
94% of researchers rate our articles as excellent or good
Learn more about the work of our research integrity team to safeguard the quality of each article we publish.
Find out more
ORIGINAL RESEARCH article
Front. Surg., 22 September 2022
Sec. Orthopedic Surgery
Volume 9 - 2022 | https://doi.org/10.3389/fsurg.2022.1000031
This article is part of the Research TopicAdvances in Research of Degenerative Orthopedic Conditions: from Basic to Clinical ResearchView all 32 articles
Background: Low bone mass concomitantly occurs in patients with adolescent idiopathic scoliosis (AIS) and can persist until skeletal maturity. The purpose of this study was to assess the asymmetrical loss of vertebral bone mineral density (vBMD) and its correlation with curve severity in patients with AIS using Hounsfield unit (HU) values measured from computed tomography scans.
Methods: A total of 93 AIS patients were retrospectively recruited. The HU values of the vertebral body (VB-HU) and pedicle screw trajectory (PST-HU) were measured from four vertebrae above (Apex − 4) to four below (Apex + 4) the apical vertebra (Apex) of the major curve. The VB-HU and PST-HU at the upper end vertebra, Apex, and lower end vertebra within the concave and convex sides of the major and minor curves and stable vertebrae were obtained.
Results: A significant correlation was found between the Cobb angle and VB-HU at the periapical levels of the major curve. VB-HU and PST-HU at periapical levels were significantly greater within the concavity than the convexity of both major and minor curves. The asymmetric ratios of VB-HU and PST-HU were significantly correlated with the major curve Cobb angle, peaked at the apex, and gradually diminished from the apex to the end vertebrae. The asymmetrical loss of vBMD aggravated with the progression of curve severity, presenting as VB-HU, significantly decreased within the convexity and insignificantly decreased within the concavity of the major curve.
Conclusion: The asymmetrical loss of vBMD was associated with the progression of curve severity in AIS. For patients with severe AIS, the distraction of the pedicle screws at the concave side should be a priority in correcting the major curve, and supplemental anchors and larger-sized screws should be placed within the convex side around the apex of the major curve to reduce the risk of screw loosening after surgery.
Adolescent idiopathic scoliosis (AIS) is a three-dimensional spinal deformity affecting children aged 10 years to maturity (1). AIS can manifest as a disturbed self-image, deformity progression, early back degeneration, and cardiopulmonary compromises (2). Therapeutic options include a brace and specific exercises for mild scoliosis and surgical instrumentation and spinal fusion for severe or rapidly progressive curves (3). Low bone mass concomitantly occurred with the spinal deformity and could still exist after skeletal maturity (4). The prevalence of low bone mass in AIS was 25%–31% and was the culprit for curve progression and implant loosening (2, 5–7).
A dual-energy x-ray absorptiometry (DXA) scan is the gold standard for measuring bone mineral water density (BMD) and diagnosing osteopenia or osteoporosis in clinical practice (8). However, DXA could not discover BMD fluctuations between cancellous and cortical bone, which would impact the accuracy of bone quality evaluation (9). Meanwhile, vertebral rotation by scoliosis could make the outcome of DXA-based BMD evaluation unreliable (10). Although quantitative computed tomography (QCT) can accurately focus on the cancellous bone area and accommodate vertebral rotation by setting slicing planes, it is impractical to apply this technique in many clinical settings due to the high-cost equipment and need for rigorous training (11).
Hounsfield unit (HU) measured from CT scans has been widely reported as a valuable technique for evaluating vertebral bone mineral density (vBMD) in recent years, and it is closely correlated with standard BMD and compressive strength (12). A CT scan is a routine preoperative examination for AIS, and practitioners can easily obtain additional information on areal bone mineral density at no extra cost. However, no previous studies have investigated vBMD using HU measurements for patients with AIS.
The purpose of this study was to assess the asymmetrical loss of vBMD and its correlation with curve severity in AIS patients.
A retrospective consecutive case review was performed to identify patients with AIS between January 2014 and December 2020 in our hospital. The inclusion criteria were as follows: (i) age from 10 to 20 years; (ii) the main thoracic curve (MTC) was the major curve (Lenke 1–4); (iii) full-spine posterior–anterior radiography; and (iv) full-spine CT scan for HU measurement. The exclusion criteria were as follows: (i) history of spinal surgery; (ii) spinal infections or metabolic disease; and (iii) other pathogenesis of scoliosis (e.g., congenital). A total of 93 patients met both the inclusion and exclusion criteria.
The demographic data, including age, sex, and body mass index (BMI), were recorded. The Cobb angle of the major curve and the two minor curves, the proximal thoracic curve (PTC) and thoracolumbar/lumbar curve (TLC), were evaluated based on full-spine posterior–anterior radiography. The BMD of the L4 vertebra was examined by a DXA scan, and a T-score ≤ −2.0 was used to distinguish low bone mass from normal bone density (13).
Full-spine CT scans were performed in the supine position with the following parameters: 320 mAs, 120 kVP, and 5 mm thickness. All Digital Imaging and Communications in Medicine (DICOM) data were analyzed using Horos software (Horos; v3.3.1@horosproject).
The HU values of each vertebral body (VB-HU) were measured using the method described by Wang et al. (14), with some modifications. The slicing plane was parallel to the superior vertebral end plate on coronal and sagittal planes and through the midpoint of the posterior edge of the spinal canal and the anterior edge of the vertebral body on the transverse plane (Figure 1). The region of interest (ROI) was placed on the coronal images of the vertebral body. The VB-HU was obtained at three locations on the coronal plane: immediately posterior to the anterior vertebral cortex, in the middle of the vertebral body, and immediately anterior to the posterior vertebral cortex. The ROI was rectangular, as large as possible, excluding the cortical margins to prevent volume averaging (12). Then, the VB-HU within the concave and convex sides were obtained separately (Figure 2). The VB-HU measured from the three slicing planes was averaged to calculate the mean HU for each vertebral body.
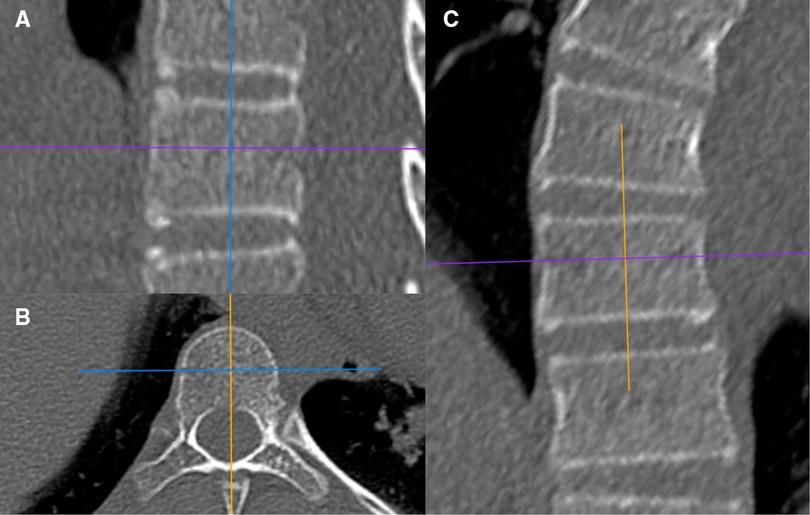
Figure 1. Schematic diagram of the sagittal slicing plane (A), the transverse slicing plane (B), and the coronal slicing plane (C).
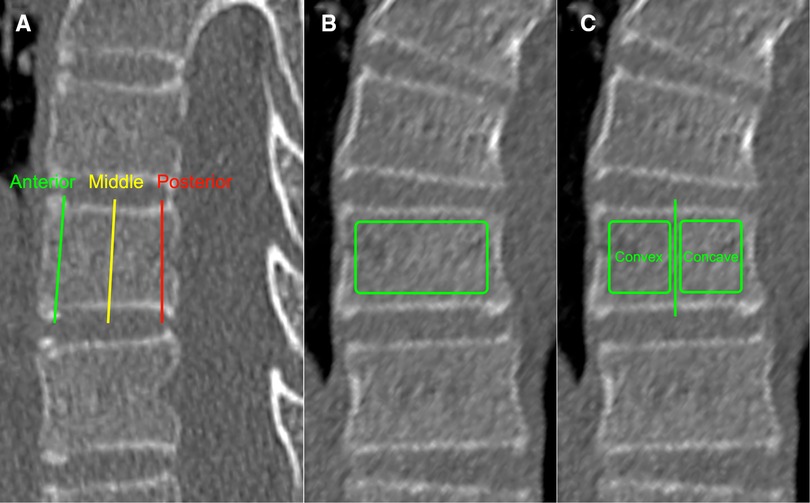
Figure 2. Schematic diagram of VB-HU measurement; three measurement locations were set on the sagittal plane (A): immediately posterior to the anterior vertebral cortex, in the middle of the vertebral body, and immediately anterior to the posterior vertebral cortex. The VB-HU of the whole vertebra (B) and the VB-HU within concave and convex sides (C) were obtained on the coronal plane.
The HU values of each pedicle screw trajectory (PST-HU) were measured using the methods described by Ishikawa et al. and Zhang et al. (15, 16). The slicing plane was adjusted along the PST on the transverse plane. The rectangular ROI was placed on the sagittal and transverse images of the pedicle screw trajectory inside the cortical shell (Figure 3). The size of the ROI was selected as follows: 25 or 30 mm × 4.0 or 4.5 mm from T1 to T5; 30 or 35 mm × 4.0 or 4.5 mm from T6 to T9; 30 or 35 mm × 4.5 or 5.0 mm from T10 to T12; 35 or 40 mm × 5.0 or 5.5 mm from L1 to L5 (17). The HU values measured from the sagittal and transverse planes were averaged to calculate the mean PST-HU for each pedicle screw trajectory.
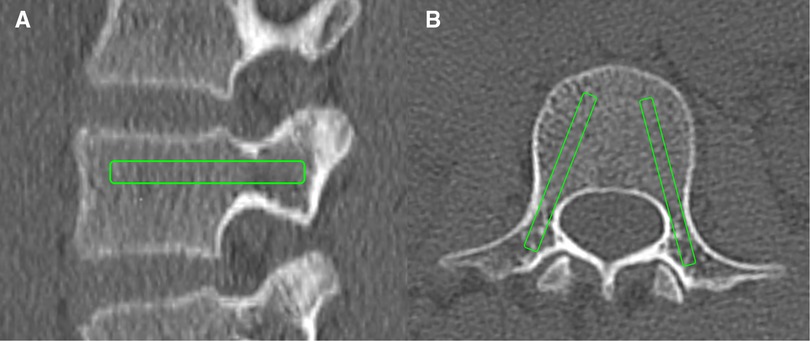
Figure 3. Schematic diagram of PST-HU measurement: the PST-HU was obtained on the sagittal plane (A) and the transverse plane (B).
VB-HU and PST-HU were measured from four vertebrae above (Apex − 4) to four below (Apex + 4) the apical vertebra (Apex) of the major curve. The data at the upper end vertebra (UEV), upper stable vertebra (USV), lower end vertebra (LEV), and lower stable vertebra (LSV) were also obtained. For the minor curves, the VB-HU and PST-HU at the apex, UEV, and LEV were measured. All parameters were measured by two independent observers and averaged for statistical analysis. The asymmetric ratios of VB-HU and PST-HU were calculated by HU values within the concave side/HU values within the convex side.
All statistical analyses were performed utilizing SPSS version 25.0 (Chicago, IL, USA). Continuous variables were presented as the mean ± standard deviation. The difference in HU values between the concave and convex sides within the target vertebral level was analyzed using a paired t-test. The asymmetric HU ratio among subgroups was compared using one-way ANOVA. The Pearson correlation coefficient was calculated to evaluate the correlation between the Cobb angle of the major curve and HU-VB as well as the asymmetric HU ratio. Differences were considered statistically significant when P < 0.05.
Among the 93 patients recruited in the current study, 35 were males and 58 were females, with a mean age of 14.6 ± 2.4 years. The mean BMI was 21.9 ± 2.3 kg/m2. The mean Cobb angle of MTC was 75.9° ± 29.6°, with PTC of 37.2° ± 14.5° and TLC of 41.5° ± 16.2°. The distributions of UEV, Apex, and LEV of the major and minor curves are shown in Table 1. A total of 43.0% (40/93) of patients presented low bone mass at L4 (T-score ≤ −2.0), and 57.0% (53/93) presented normal bone density.
The mean VB-HU from Apex − 4 to Apex + 4 of the major curve is shown in Table 2. No significant difference among vertebral levels was detected. There were significantly negative moderate correlations between the mean VB-HU at each level and the Cobb angle.
VB-HU and PST-HU within the concave and convex sides and their asymmetric ratios are shown in Table 3. The VB-HU and PST-HU within the concave side were significantly greater than those within the convex side from Apex − 3 to Apex + 3. However, at Apex − 4 and Apex + 4, the VB-HU and PST-HU within the convex side were statistically greater than those within the concave side, which was contrary to other vertebral levels. The asymmetric ratio of VB-HU and PST-HU peaked at the apex, with values of 1.43 ± 0.27 and 1.40 ± 0.25, respectively. The asymmetric ratio indicated a declining tendency cranially and caudally and decreased gradually to a minimum at Apex − 4 and Apex + 4.
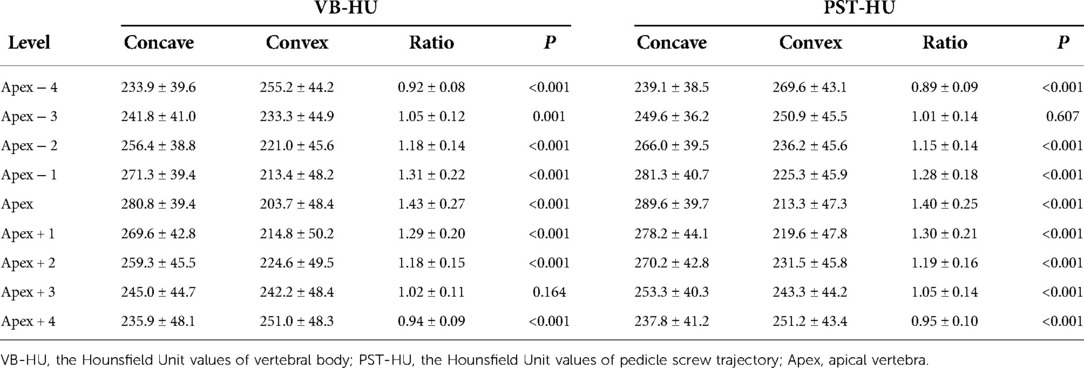
Table 3. VB-HU and PST-HU within the concave and convex side of the major curve and its asymmetric ratio.
HU values and asymmetric HU ratios at UEV, Apex, LEV, USV, and LSV are shown in Table 4. The VB-HU within the concave side was significantly greater than that on the convex side at the apex, UEV, and LEV of MTC. The PST-HU was also significantly greater within the concave side at the apex and LEV. However, there was no significant difference in HU values between the concave and convex sides at USV and LSV.
For PTC, VB-HU and PST-HU within the concave side were significantly greater than those within the convex side at the apex and LEV, while no significant difference was detected at the UEV. For TLC, the VB-HU and PST-HU were significantly greater within the concave side at the apex, while there was no difference at UEV and LEV.
The asymmetric HU ratio peaked at the apex of both major and minor curves and gradually diminished from the apex to the end vertebrae (Figure 4). The asymmetric HU ratio at the apex of the major curve was significantly greater than that of the minor curves (P < 0.001). There was no significant difference in the asymmetric HU ratio at UEV and LEV among all curves.
The 93 patients were divided into three groups according to the Cobb angle of the major curve: mild group (<60°), moderate group (60°–90°), and severe group (>90°). The comparison of VB-HU at Apex, UEV, and LEV of the major curve among subgroups is shown in Table 5. There was a significant difference in VB-HU at the apex among the subgroups. Although the VB-HU within the concave side at the apex gradually decreased with increasing Cobb angle, there was no significant difference among the subgroups. However, the mean VB-HU and the VB-HU within the convex side at the apex significantly decreased from the mild to severe group (Figure 5). No significant difference was detected in VB-HU at UEV and LEV between the mild and moderate groups, while VB-HU in the severe group was significantly less than that in the other groups. Between the mild and moderate groups, the VB-HU within neither side was significantly different at UEV and LEV. In the severe group, the VB-HU within the concave side was significantly less than that in the mild group at UEV and LEV, and the VB-HU within the convex side was significantly less than that in the other groups.
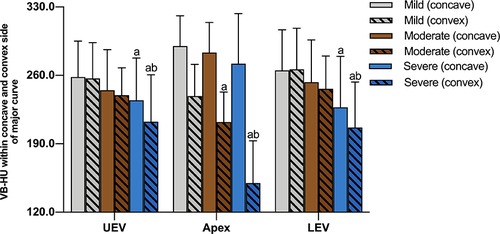
Figure 5. Comparison of VB-HU at Apex, UEV, and LEV of the major curve among subgroups; a indicates a significant difference compared with the mild group; b indicates a significant difference compared with the moderate group.
The correlation between the asymmetric HU ratio and the Cobb angle of the major curve is shown in Table 6. There were significantly positive and strong correlations between the Cobb angle and the asymmetric ratio of VB-HU and PST-HU at the apex of the major curve (r = 0.880, P < 0.001; r = 0.758, P < 0.001). The asymmetric ratios of VB-HU and PST-HU at the apex of the minor curves were also significantly associated with the Cobb angle of the major curve.
A comparison of the asymmetric HU ratio among subgroups is shown in Table 6. There was a significant difference in the asymmetric ratio of VB-HU and PST-HU at the apex of the major curve among the subgroups. The ratio at UEV was significantly greater in the severe group, while there was no significant difference between the mild and moderate groups. The only difference in the asymmetric ratio of VB-HU at LEV was detected between the mild and severe groups.
For minor curves, the asymmetric HU ratio at the apex of PTC was significantly greater in the severe group, and no significant difference was detected between the mild and moderate groups. However, for TLC, there was no significant difference in the asymmetric HU ratio at the apex between the moderate and severe groups, and the ratio in the mild group was significantly less than that in the other groups. The outcome of VB-HU is shown in Figure 6, and the outcome of PST-HU was similar to that of VB-HU.
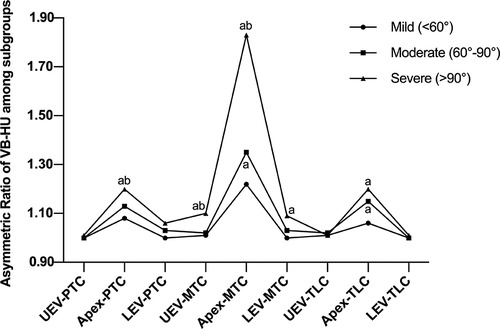
Figure 6. Comparison of the asymmetric ratio of VB-HU among subgroups; a indicates a significant difference compared with the mild group; b indicates a significant difference compared with the moderate group.
The most common tool used for the assessment of BMD is DXA, but the accuracy of DXA-based BMD evaluation can be affected by various factors, such as bony spurs, facet hypertrophy, and vertebral rotation (14). The most accurate site to assess BMD is the cancellous bone, but DXA is not adequate to differentiate between cancellous and cortical bone (18). Thus, DXA may not be reliable for the evaluation of areal BMD in patients with spinal deformities, especially scoliosis (10). The HU value measured by CT scan has been widely proposed for the evaluation of global or areal BMD because it is closely correlated with standard BMD and bone strength (12). With the assistance of multiplanar reconstruction software, it is even feasible to accurately assess the vBMD in patients with severe scoliosis. However, few studies have reported its use in patients with various severities of AIS.
Numerous studies have reported the high prevalence of low bone mass in AIS and the association between BMD and progression of Cobb angle (2, 19, 20). In the current study, low bone mass was detected in 43.0% of patients, and the T-score was significantly correlated with the Cobb angle within the major curve (r = −0.633; P < 0.01), which was consistent with previous studies. Additionally, this study provided more accurate BMD data of each vertebral body based on HU measurement and suggested that the vBMD at the periapical levels was associated with the curve severity.
The asymmetric vertebral morphology in AIS, including vertebral bodies and pedicles, has been widely reported (21–25). However, the asymmetrical loss of vBMD was only researched in patients with adult degenerative scoliosis (14). Considering the discrepancy in pathogenesis between degenerative and idiopathic scoliosis, this was the first study to demonstrate the asymmetrical loss of vBMD in AIS based on HU measurements. The current study suggested greater VB-HU and PST-HU within the concave side and relatively low HU values within the convex side of the major curve. The asymmetric ratio was the most predominantly presented at the apex and indicated a declining tendency cranially and caudally. Wolff's law may explain this change, as increasing or decreasing the load of bone could remodel the trabecular bone to adapt to these loads (26). In patients with AIS, the gravity load transmitted through the concave side of the vertebra increased and decreased on the convex side, and the apical vertebra of the major curve resisted the most asymmetric loading (27). Such developments occurred not only in the structural curve but also in the nonstructural curve (21). Thus, we measured the asymmetric ratio in all primary and compensatory curves, and similar findings were obtained. The maximum asymmetric ratio was detected at the apex of the major curve, and the degree of intravertebral difference diminished farther away from the apex, presenting symmetric HU values at USV and LSV. However, the asymmetric ratio gradually increased again from the end vertebrae to the apex of the minor curves and decreased from the apex to the end vertebra. The HU values within the concave and convex sides were statistically equal at the UEV of PTC, LEV of TLC, USV, and LSV, which might be attributed to the lower vertebral rotation and asymmetric loading (25).
As the asymmetrical change in vertebra was correlated with the curve magnitude, we included patients who covered the complete spectrum of curve severities from mild (<60°) to severe (>90°). In the current study, the asymmetric ratio of VB-HU and PST-HU at the apex, UEV, and LEV of the major curve and at the apex of the minor curves were significantly associated with the Cobb angle of the major curve, which was in accordance with previous studies (22–25). Similar results were obtained in our subgroup analysis; both the asymmetric ratio and mean VB-HU at the apex of the major curve were significantly different among subgroups. However, when we compared the unilateral VB-HU among different curve severities, no significant difference was detected within the concave side (290.0 ± 31.0 vs. 283.4 ± 30.8 vs. 272.0 ± 51.2, P > 0.05), while the VB-HU on the convex side significantly decreased from the mild to severe group (238.9 ± 32.4 vs. 212.3 ± 30.7 vs. 149.9 ± 43.2, P < 0.01), which presented as the increasing asymmetric HU ratio mentioned above. These findings suggested that although the loss of vBMD progressed with the curve magnitude, the degree of this change was asymmetrical between the concave and convex sides. The loss of vBMD within the convex side was pronounced, while it was not detectable within the concave side. Additionally, following the progression of curve severity, the aggravation of vBMD loss would be accelerated within the convex side. One explanation for these changes was that more severe scoliosis could cause more gravity shifts toward the concave side, resulting in more asymmetrical compression and shearing force across vertebrae, especially at the apex. UEV and LEV were less translated vertebrae in the major curve, and the results at UEV and LEV confirmed this view, as the difference in HU values was not significant between the mild and severe groups.
Pedicle screws have been widely used in the correction and posterior fusion of AIS because of the adequate three-column fixation provided by insertional torque (28). However, reports have shown that screw loosening is a well-known complication, with a rate of 27%–32% in patients with AIS (7, 15, 29). Since the cancellous bone density of the VB and PST has been identified as a powerful predictor of implant loosening, the asymmetrical loss of vBMD in AIS patients demonstrated by the current study may indicate a high risk of metal implant instability on the convex side around the periapical levels (15). We considered that if surgeons ignored the asymmetric vBMD due to using DXA, the efficacy of fixation could be impacted. Therefore, HU values based on CT scans were recommended as a complement to the DXA T-score for areal BMD evaluation before surgery.
In recent years, the application of CT values to evaluate vertebral bone mineral density has become a research hotspot, especially in lumbar vertebrae, cervical vertebrae, ankylosing spondylitis, and degenerative lumbar scoliosis (30, 31). Our study was the first to use the Hounsfield unit for assessing asymmetrical loss of vertebral bone mineral density and its correlation with curve severity in adolescent idiopathic scoliosis.
Based on our findings, several strategies should be noted by surgeons. If significant asymmetric vBMD was detected in patients with AIS, the distraction of the pedicle screws at the concave side should be a priority in correcting the major curve, instead of compression of the screws at the convex side (14). Additionally, supplemental anchors (cross trajectory technique) and larger screws should be placed within the convex side around the apex of the major curve to compensate for the impact of low bone mass (32). Keeping an eye on asymmetric vBMD would help surgeons in surgical planning and reduce the risk of screw loosening after surgery. For patients with mild scoliosis, timely exercises, bracing, and appropriate anti-osteoporosis therapy should be performed to eliminate the asymmetrical loss of vBMD, which could delay the curve progression to the surgical threshold (33, 34).
This study has several limitations. First, we recommended placing supplemental anchors and larger screws within the convex side around the apex to provide more fixation, but this was only a hypothesis based on HU measurements and needs to be proven by further biomechanical tests and clinical research. Second, we only evaluated the cancellous bone of PST. In practice, the screw threads could touch the cortical bone when the pedicle width was narrow. Thus, the PST-HU measured in the current study may not be accurate for pedicles with a narrow diameter. Third, only Lenke1–4 AIS patients were included, and whether the results were appropriate for patients with lumbar major curves needs to be confirmed by further research.
The asymmetrical loss of vBMD was associated with the progression of curve severity in AIS, presenting a slight loss within the concavity and severe loss within the convexity both in major and minor curves. HU values based on CT scans were recommended as a complement to the DXA T-score for areal BMD evaluation before surgery. For patients with severe AIS, the distraction of the pedicle screws at the concave side should be a priority in correcting the major curve, and supplemental anchors, as well as larger-sized screws, should be placed within the convex side around the apex of the major curve to reduce the risk of screw loosening after surgery.
The raw data supporting the conclusions of this article will be made available by the authors, without undue reservation.
YC contributed to the methodology, and writing the original draft preparation. HY contributed to the data curation and writing the original draft preparation. AP and YZ contributed to the data collection and analysis. YH and LZ contributed to the supervision. All authors contributed to the article and approved the submitted version.
The authors declare that the research was conducted in the absence of any commercial or financial relationships that could be construed as a potential conflict of interest.
All claims expressed in this article are solely those of the authors and do not necessarily represent those of their affiliated organizations, or those of the publisher, the editors and the reviewers. Any product that may be evaluated in this article, or claim that may be made by its manufacturer, is not guaranteed or endorsed by the publisher.
1. Tahvildari BP, Erfani MA, Nouraei H, Sadeghian M. Evaluation of bone mineral status in adolescent idiopathic scoliosis. Clin Orthop Surg. (2014) 6:180–4. doi: 10.4055/cios.2014.6.2.180
2. Lam TP, Hung VW, Yeung HY, Tse YK, Chu WC, Ng BK, et al. Abnormal bone quality in adolescent idiopathic scoliosis: a case-control study on 635 subjects and 269 normal controls with bone densitometry and quantitative ultrasound. Spine. (2011) 36:1211–7. doi: 10.1097/BRS.0b013e3181ebab39
3. Yu WS, Chan KY, Yu FW, Yeung HY, Ng BK, Lee KM, et al. Abnormal bone quality versus low bone mineral density in adolescent idiopathic scoliosis: a case-control study with in vivo high-resolution peripheral quantitative computed tomography. Spine J. (2013) 13:1493–9. doi: 10.1016/j.spinee.2013.05.018
4. Cheng JC, Hung VW, Lee WT, Yeung HY, Lam TP, Ng BK, et al. Persistent osteopenia in adolescent idiopathic scoliosis–longitudinal monitoring of bone mineral density until skeletal maturity. Stud Health Technol Inform. (2006) 123:47–51.17108402
5. Lee WT, Cheung CS, Tse YK, Guo X, Qin L, Lam TP, et al. Association of osteopenia with curve severity in adolescent idiopathic scoliosis: a study of 919 girls. Osteoporos Int. (2005) 16:1924–32. doi: 10.1007/s00198-005-1964-7
6. Qiu Y, Sun X, Cheng JC, Zhu F, Li W, Zhu Z, et al. Bone mineral accrual in osteopenic and non-osteopenic girls with idiopathic scoliosis during bracing treatment. Spine (Phila Pa 1976). (2008) 33:1682–9. doi: 10.1097/BRS.0b013e31817b5b9e
7. Kasim KA, Ohlin A. Evaluation of implant loosening following segmental pedicle screw fixation in adolescent idiopathic scoliosis: a 2-year follow-up with low-dose CT. Scoliosis. (2014) 9:13. doi: 10.1186/1748-7161-9-13
8. Morgan SL, Prater GL. Quality in dual-energy x-ray absorptiometry scans. Bone. (2017) 104:13–28. doi: 10.1016/j.bone.2017.01.033
9. Zou D, Jiang S, Zhou S, Sun Z, Zhong W, Du G, et al. Prevalence of osteoporosis in patients undergoing lumbar fusion for lumbar degenerative diseases: a combination of DXA and Hounsfield units. Spine. (2020) 45:E406–10. doi: 10.1097/BRS.0000000000003284
10. Kirilov N, Kirilova E, Todorov S, Nikolov N. Effect of the lumbar scoliosis on the results of dual-energy x-ray absorptiometry. Orthop Rev (Pavia). (2020) 12:8477. doi: 10.4081/or.2020.8477
11. Anderson PA, Polly DW, Binkley NC, Pickhardt PJ. Clinical use of opportunistic computed tomography screening for osteoporosis. J Bone Joint Surg Am. (2018) 100:2073–81. doi: 10.2106/JBJS.17.01376
12. Schreiber JJ, Anderson PA, Rosas HG, Buchholz AL, Au AG. Hounsfield units for assessing bone mineral density and strength: a tool for osteoporosis management. J Bone Joint Surg Am. (2011) 93:1057–63. doi: 10.2106/JBJS.J.00160
13. Kalkwarf HJ, Abrams SA, DiMeglio LA, Koo WW, Specker BL, Weiler H. Bone densitometry in infants and young children: the 2013 ISCD pediatric official positions. J Clin Densitom. (2014) 17:243–57. doi: 10.1016/j.jocd.2014.01.002
14. Wang H, Zou D, Sun Z, Wang L, Ding W, Li W. Hounsfield unit for assessing vertebral bone quality and asymmetrical vertebral degeneration in degenerative lumbar scoliosis. Spine. (2020) 45(22):1559–66. doi: 10.1097/BRS.0000000000003639
15. Ishikawa K, Toyone T, Shirahata T, Kudo Y, Matsuoka A, Maruyama H, et al. A novel method for the prediction of the pedicle screw stability: regional bone mineral density around the screw. Clin Spine Surg. (2018) 31:E473–80. doi: 10.1097/BSD.0000000000000703
16. Zhang RJ, Li HM, Gao H, Jia CY, Xing T, Shen CL. Associations between the Hounsfield unit values of different trajectories and bone mineral density of vertebrae: cortical bone and traditional trajectories. Am J Transl Res. (2020) 12:3906–16.32774744
17. Kuraishi S, Takahashi J, Hirabayashi H, Hashidate H, Ogihara N, Mukaiyama K, et al. Pedicle morphology using computed tomography-based navigation system in adolescent idiopathic scoliosis. J Spinal Disord Tech. (2013) 26:22–8. doi: 10.1097/BSD0b013e31823162ef
18. Hamdy RC, Petak SM, Lenchik L. International society for clinical densitometry position development panel and scientific advisory committee. Which central dual x-ray absorptiometry skeletal sites and regions of interest should be used to determine the diagnosis of osteoporosis? J Clin Densitom. (2002) 5:S11–8. doi: 10.1385/jcd:5:3s:s11
19. Li XF, Li H, Liu ZD, Dai LY. Low bone mineral status in adolescent idiopathic scoliosis. Eur Spine J. (2008) 17:1431–40. doi: 10.1007/s00586-008-0757-z
20. Yip BHK, Yu FWP, Wang Z, Hung VWY, Lam TP, Ng BKW, et al. Prognostic value of bone mineral density on curve progression: a longitudinal cohort study of 513 girls with adolescent idiopathic scoliosis. Sci Rep. (2016) 6:39220. doi: 10.1038/srep39220
21. Makino T, Kaito T, Sakai Y, Kashii M, Yoshikawa H. Asymmetrical ossification in the epiphyseal ring of patients with adolescent idiopathic scoliosis: a retrospective review. Bone Joint J. (2016) 98-B:666–71. doi: 10.1302/0301-620X.98B5.37133
22. Davis CM, Grant CA, Pearcy MJ, Askin GN, Labrom RD, Izatt MT, et al. Is there asymmetry between the concave and convex pedicles in adolescent idiopathic scoliosis? A CT investigation. Clin Orthop Relat Res. (2017) 475:884–93. doi: 10.1007/s11999-016-5188-2
23. Liljenqvist UR, Allkemper T, Hackenberg L, Link TM, Steinbeck J, Halm HF. Analysis of vertebral morphology in idiopathic scoliosis with use of magnetic resonance imaging and multiplanar reconstruction. J Bone Joint Surg Am. (2002) 84:359–68. doi: 10.2106/00004623-200203000-00005
24. Schlösser TP, van Stralen M, Brink RC, Chu WC, Lam TP, Vincken KL, et al. Three-dimensional characterization of torsion and asymmetry of the intervertebral discs versus vertebral bodies in adolescent idiopathic scoliosis. Spine. (2014) 39:E1159–66. doi: 10.1097/BRS.0000000000000467
25. Brink RC, Schlösser TPC, Colo D, Vincken KL, van Stralen M, Hui SCN, et al. Asymmetry of the vertebral body and pedicles in the true transverse plane in adolescent idiopathic scoliosis: a CT-based study. Spine Deform. (2017) 5:37–45. doi: 10.1016/j.jspd.2016.08.006
26. Gorissen BM, Wolschrijn CF, van Vilsteren AA, van Rietbergen B, van Weeren PR. Trabecular bone of precocials at birth; are they prepared to run for the wolf(f)? J Morphol. (2016) 277:948–56. doi: 10.1002/jmor.20548
27. Périé D, Curnier D, de Gauzy JS. Correlation between nucleus zone migration within scoliotic intervertebral discs and mechanical properties distribution within scoliotic vertebrae. Magn Reson Imaging. (2003) 21:949–53. doi: 10.1016/s0730-725x(03)00216-9
28. Lenke LG, Kuklo TR, Ondra S, Polly DW Jr. Rationale behind the current state-of-the-art treatment of scoliosis (in the pedicle screw era). Spine. (2008) 33:1051–4. doi: 10.1097/BRS.0b013e31816f2865
29. Uehara M, Takahashi J, Ikegami S, Kuraishi S, Shimizu M, Futatsugi T, et al. Pedicle screw loosening after posterior spinal fusion for adolescent idiopathic scoliosis in upper and lower instrumented vertebrae having major perforation. Spine. (2017) 42:1895–900. doi: 10.1097/BRS.0000000000002305
30. Liang X, Liu Q, Xu J, Ding W, Wang H. Hounsfield unit for assessing bone mineral density distribution within cervical vertebrae and its correlation with the intervertebral disc degeneration. Front Endocrinol. (2022) 13:920167. doi: 10.3389/fendo.2022.920167
31. Jin LY, Su XJ, Xu S, Liu HY, Li XF. Reliability of Hounsfield unit for assessing asymmetrical vertebral bone mass in adult degenerative scoliosis. Int J Gen Med. (2022) 15:5869–77. doi: 10.2147/IJGM.S368718
32. Tandon V, Franke J, Kalidindi KKV. Advancements in osteoporotic spine fixation. J Clin Orthop Trauma. (2020) 11:778–85. doi: 10.1016/j.jcot.2020.06.028
33. Tanabe H, Aota Y, Yamaguchi Y, Kaneko K, Imai S, Takahashi M, et al. Minodronate treatment improves low bone mass and reduces progressive thoracic scoliosis in a mouse model of adolescent idiopathic scoliosis. PLoS One. (2018) 13(8):e0202165. doi: 10.1371/journal.pone.0202165
Keywords: vertebral bone mineral density, Hounsfield unit, adolescent idiopathic scoliosis, low bone mass, computed tomography
Citation: Cheng Y, Yang H, Hai Y, Pan A, Zhang Y and Zhou L (2022) Hounsfield unit for assessing asymmetrical loss of vertebral bone mineral density and its correlation with curve severity in adolescent idiopathic scoliosis. Front. Surg. 9:1000031. doi: 10.3389/fsurg.2022.1000031
Received: 21 July 2022; Accepted: 31 August 2022;
Published: 22 September 2022.
Edited by:
Xiaojian Wang, Shanxi Provincial People's Hospital, ChinaReviewed by:
Geng Cui, Chinese PLA General Hospital, China© 2022 Cheng, Yang, Hai, Pan, Zhang and Zhou. This is an open-access article distributed under the terms of the Creative Commons Attribution License (CC BY). The use, distribution or reproduction in other forums is permitted, provided the original author(s) and the copyright owner(s) are credited and that the original publication in this journal is cited, in accordance with accepted academic practice. No use, distribution or reproduction is permitted which does not comply with these terms.
*Correspondence: Yong Hai eW9uZy5oYWlAY2NtdS5lZHUuY24=, cHJvZi5oYWl5b25nQG91dGxvb2suY29t Lijin Zhou ZG9jdG9yemhvdWxpamluQDE2My5jb20=
†These authors have contributed equally to this work and share first authorship
Specialty Section: This article was submitted to Orthopedic Surgery, a section of the journal Frontiers in Surgery
Disclaimer: All claims expressed in this article are solely those of the authors and do not necessarily represent those of their affiliated organizations, or those of the publisher, the editors and the reviewers. Any product that may be evaluated in this article or claim that may be made by its manufacturer is not guaranteed or endorsed by the publisher.
Research integrity at Frontiers

Learn more about the work of our research integrity team to safeguard the quality of each article we publish.