 Yong Xiao1†
 Kun Yang1†
 Zhen Wang1Mengjie Zhao2Yanxiang Deng3Wei Ji1,4Yuanjie Zou1
 Chunfa Qian1Yong Liu1Hong Xiao2*
 Hongyi Liu1*
- 1Department of Neurosurgery, Nanjing Brain Hospital Affiliated to Nanjing Medical University, Nanjing, China
- 2Department of Neuro-Psychiatric Institute, Nanjing Brain Hospital Affiliated to Nanjing Medical University, Nanjing, China
- 3Department of Biomedical Engineering, Yale University, New Haven, CT, United States
- 4Department of Neurosurgery, Wuxi People's Hospital of Nanjing Medical University, Wuxi, China
Background: Glioma is the most common primary brain tumor with a poor prognosis. Key genes that are negatively related to prognosis may provide the therapy targets to cure glioma. To clarify the role of CD44 in glioma, we explored its function at bulk-transcriptome, spatial and single-cell transcriptome levels.
Methods: In total, expression profiles with survival data of whole-grade glioma from The Cancer Genome Atlas (TCGA) and the Chinese Glioma Genome Atlas (CGGA), RNA-seq data with anatomic information of glioblastoma (GBM) from the Ivy Glioblastoma Atlas Project, RNA-sequencing (RNA-seq) data from recurrent GBM receiving adjuvant anti-PD-1 immunotherapy accessed through GSE121810, and single-cell RNA-seq data of GBM under accession GSE103224 were enrolled in this study. CD44-specific findings were further analyzed by R language.
Results: CD44 is positively correlated with WHO grade of malignancy and is negatively related to prognosis in glioma. Meanwhile, CD44 predominantly expresses in GBM mesenchymal subtype, and gene ontology (GO) and Kyoto Encyclopedia of Genes and Genomes (KEGG) analyses reveal that CD44 positively coexpressed genes are closely related to glioma immunity. Moreover, CD44+ cells mainly distribute in perinecrotic region with high expression of immune factors. At single-cell resolution, only malignant tumor cells, tumor-associated macrophages (TAMs), and T cells express CD44 in GBM. CD44+ malignant tumor cells are in mesenchymal-1-like (MES1-like) cellular state, and CD44+ TAMs are in M2 phenotype. CD44+ T cells have high expression of both PD-1 and PD-L1. CD44 and its directly interacted inhibitory immunomodulators are upregulated in patients with nonresponder recurrent GBM treated with PD-1 blockade therapy.
Conclusion: Our work demonstrates that CD44, a new M2 TAM biomarker, is involved in immune suppressor and promote glioma progression in glioma microenvironment. These results expand our understanding of CD44-specific clinical and immune features in glioma.
Introduction
The most common primary brain tumor in adults is glioma. Most of the patients with glioma confront recurrence and death even though undergoing current standard therapy. The 5-year survival rate varies from 50 to 81% in WHO II glioma and ranges from 30 to 57% in WHO III glioma, but is only 5.5% in glioblastoma (GBM, WHO IV) (1). Despite improvements in standard therapy, patients with the most aggressive type, GBM, have a median survival time of only 15 months (2). In the past decades, many new antineoplastic treatments have achieved good results in various tumors except for glioma. Bevacizumab, the only approved small molecule drug for glioma, also failed to prolong the overall survival (OS) of newly diagnosed patients with GBM (3). Although the chimeric antigen receptor (CAR)-T cell therapy succeeds in some malignancies, it does not work well in patients with glioma to improve OS and is still at an early clinical investigation stage (4). Given these clinical challenges of glioma, there is a considerable interest in exploring the molecular mechanisms related to the short survival of patients with glioma, which may be the new therapy targets for glioma.
CD44 molecule is a complex transmembrane adhesion glycoprotein and participates in a wide variety of cellular functions including cell adhesion, migration, proliferation, apoptosis, and angiogenesis, which, when pathologic, are the characteristics of malignancy (5). Unsurprisingly, CD44 is aberrantly upregulated among diverse tumors, including pancreatic cancer, breast cancer, prostate cancer, head and neck squamous cell carcinoma, and gastrointestinal cancer (6). CD44 is a well-known marker of glioma cancer stem cells (CSCs) and plays important roles in tumor initiation and progression (7). In addition, WHO grades II and III patients with glioma with high CD44 mRNA expression faced poor survival compared to low CD44 mRNA level in an independent manner (8). CD44 expression level was elevated after irradiation or temozolomide treatment in mouse glioma model (9), which indicated CD44 is involved in resistance to chemoradiation in glioma. Therefore, CD44 could be the candidate for glioma therapy.
However, the precise mechanisms underlying CD44-mediated glioma initiation and progression have not been completely elucidated. CD44 also plays important roles in diverse physiological processes, such as organ development, hematopoiesis, and diverse immune functions including T cell and lymphocyte activation (10). But we know few about the immune functions of CD44 in tumor until now. A deeper understanding of the role of CD44 in glioma will guide promising research in novel glioma therapeutic strategy. Herein, we integrated bulk RNA-sequencing data (RNA-seq) and single-cell RNA-seq data to investigate the immunosuppressive role of CD44 in glioma. Additionally, we further validated our findings with immunohistochemistry (IHC) and immunofluorescence (IF) staining data.
Methods
Bulk RNA-Seq Data
RNA expression data for human gliomas were downloaded from The Cancer Genome Atlas (TCGA) (11) and the Chinese Glioma Genome Atlas (CGGA) (12). These datasets contain bulk mRNA expression profiles and corresponding clinical information of patients with glioma. A total of 702 glioma samples from TCGA and 693 glioma samples from CGGA were used in our study. At present, the WHO's classification on glioma utilized by TCGA and CGGA is the fourth WHO's classification of tumors of the central nervous system (13). RNA-seq data of 122 GBM samples with anatomic information from the Ivy Glioblastoma Atlas Project (IGAP) (14) were used in this study. RNA-seq data from 15 patients with recurrent GBM treated with adjuvant anti-PD-1 immunotherapy were accessed through GSE121810.
Survival Analysis
Survival curves were performed by Kaplan–Meier analysis between CD44 higher and lower group and were tested for significance using the Mantel–Cox log-rank test. Hazard ratio (HR) and confidence interval (CI) were also computed to confirm the prognostic value of CD44 in patients with glioma. Furthermore, Cox proportional hazards model, including patients' age and gender, was used to evaluate the predictor effect of CD44. A value of p < 0.05 was considered statistically significant.
Immune Infiltration Analysis
Estimation of infiltrating stromal cells and immune cells in glioma samples was accomplished by the method ESTIMATE (15). Then, the xCell pipeline (16) was adopted to explore the relationship between CD44 expression level and glioma-infiltrating cell types. Because some cell types from xCell reference database do not distribute in the brain and glioma, we only used 41 cell states listed in Supplementary Figure 4 in this part analysis. Furthermore, we utilized CIBERSORTx portal (17) to infer immune cell compositions among TCGA and CGGA glioma using a set of 22 human immune cell reference profiles and predicting their absolute composition ratio within individual glioma sample.
Weighted Gene Coexpression Network Analysis
Weighted gene coexpression network analysis (WGCNA), a bioinformatics algorithm (18), was used to generate unsigned coexpression networks in TCGA and CGGA glioma. WGCNA applies topological overlap measure, a robust measure of network interconnectedness and measures the connection strength between two adjacent transcripts and all other transcripts in a network, to cluster genes into network modules. The minimum size of modules was 30 transcripts and were randomly color labeled. Next, we related the gene modules to clinical traits and selected the module of interest which contained the CD44 and had the highest correlation coefficient with CD44 expression level. Intramodular connectivity of transcripts was used to identify hub genes in the module of interest.
Gene Set Enrichment Analysis
Gene ontology (GO) (19) and Kyoto Encyclopedia of Genes and Genomes (KEGG) (20) analyses were used to explore the biological function of gene sets of interest. Pearson's correlation coefficients between CD44 and all other genes were calculated, and CD44-associated genes were defined as genes with |r| >0.5 in TCGA glioma dataset, |r| > 0.25 in CGGA glioma dataset, and |r| > 0.5 in IGAP GBM dataset. Additionally, GSEA (Linux_4.1.0) software was used to determine whether the gene set of PD-1 signaling (http://www.gsea-msigdb.org/gsea/msigdb/cards/REACTOME_PD_1_SIGNALING.html) shows statistically significant difference between anti-PD-1 immunotherapy responder and nonresponder subgroups.
Protein–Protein Interaction Network
The immunomodulator genes were downloaded from the study introduced by Thorsson (21). These immunomodulators with CD44 were imported into the STRING website (https://string-db.org/) to construct protein–protein interaction network. All the parameters were default.
Differentially Expressed Gene Analysis
Raw count matrices of 15 patients with recurrent GBM treated with adjuvant anti-PD-1 immunotherapy were utilized in this part analysis. These 15 patients were divided into responder and nonresponder subgroups based on OS cutoff for 300 days. The patient with OS greater than 300 days was labeled as therapy responder, but the one with OS lower than 300 days was regarded as nonresponder. In addition, differentially expressed genes (DEGs) between nonresponder and responder groups were identified by the package DESeq2 (1.32.0) (22).
Data Processing in Single Cell
The human GBM signal cell RNA-seq data were downloaded from The Gene Expression Omnibus (GEO) (23) under accession number GSE103224. The expression matrices were analyzed using the R package Seurat (24). We removed all cells from the downstream analysis where >10% transcripts aligned to the mitochondrial genome, or which had either fewer than 400 or more than 2,500 RNA counts. Besides, gene was filtered out when it expressed in less than 10 cells among all the 7 GBM samples. The remaining 28,825 genes in 17,357 cells passed quality control and were used into further analysis. Malignant tumor cells were distinguished from stromal cells by copy number variants (CNVs), and nontumor cells were identified using known cell-type marker genes. FindMarkers in Seurat package was used to identify the DEGs between CD44+ and CD44- cell cluster. Additionally, the top 100 DEGs according to the avg_logFC were underwent the gene set enrichment analysis. Pairwise Pearson's correlation with CD44 was established in CD44+ cell cluster, and the top 100 correlated genes according to correlation coefficient were used in subsequent enrichment analysis. We took the standard workflow of pySCENIC (0.11.2) (25) to build the regulon network of different cell types. Regulons were ranked by the regulon specificity score from high to low, and the top 20 regulons of each cell type were used to plot the heatmap among different cell types. The regulon specificity scores were scaled by cell types. The Monocle 2 package (2.14.0) (26) was applied to construct single-cell pseudotime trajectories. Considering the small number of oligodendrocytes, endothelial cells, pericytes, and T cells, only malignant tumor cells and TAMs were used in trajectory analysis, respectively. The DEGs were identified by Monocle 2, and these genes filtered by qval <0.05 were further used in pseudotime order analysis.
Immunohistochemistry Staining
The IHC data of unique GBM subtype samples from the IGAP and of normal brain tissues and glioma samples from the Human Protein Atlas (https://www.proteinatlas.org/) were downloaded and used in this study.
Immunofluorescence Staining
Formalin-fixed paraffin-embedded sections of glioma were collected and their pathological results were confirmed as glioma according to the 2016 WHO's classification of central nervous system tumors (13). Tumor sample use was approved by the Institutional Review Board at the Nanjing Brain Hospital Affiliated to Nanjing Medical University. Tumor sample was incubated with the first primary antibody against CD44 (1:5000 for IF, Servicebio) overnight at 4°C and then with the first matching secondary antibody at room temperature for 50 min in dark condition. Then, it was incubated with the second antibody CD163 (1:5000 for IF, Servicebio) overnight at 4°C and later with the second matching secondary antibody at room temperature for 50 min in dark condition. Slide was counterstained with DAPI for nuclei visualization. Finally, sample slide was imaged by Imaging System from Nikon. The CaseViewer software (3DHISTECH) can unmix and remove autofluorescence and analyze the multispectral images.
Results
CD44 Expression Level Is Correlated With Glioma Grade, IDH Type, 1p19q State, and Recurrent Status
To answer the question whether CD44 is involved in malignant progress of glioma, we compared its expression level in different WHO grades, IDH types, 1p19q states, and recurrent status in TCGA and CGGA glioma mRNA-seq datasets. First, CD44 expression in both low-grade glioma (LGG) and glioblastoma (GBM) is higher than normal brain tissues, which means CD44 plays a role in glioma tumorigenesis (Figure 1A). It turns out that CD44 is significantly upregulated in GBM (WHO IV) than that in WHO grades II and III gliomas in TCGA glioma dataset (Figure 1B). Additionally, CGGA RNA-seq data validate well to this result (Figure 1C). Additionally, the IHC data of normal brain tissues and glioma samples reveal that high-grade glioma has the highest CD44 protein expression level, but that the normal brain tissue has the lowest CD44 expression (Supplementary Figure 2). These shows that a higher CD44 expression is associated with a higher malignancy in glioma.
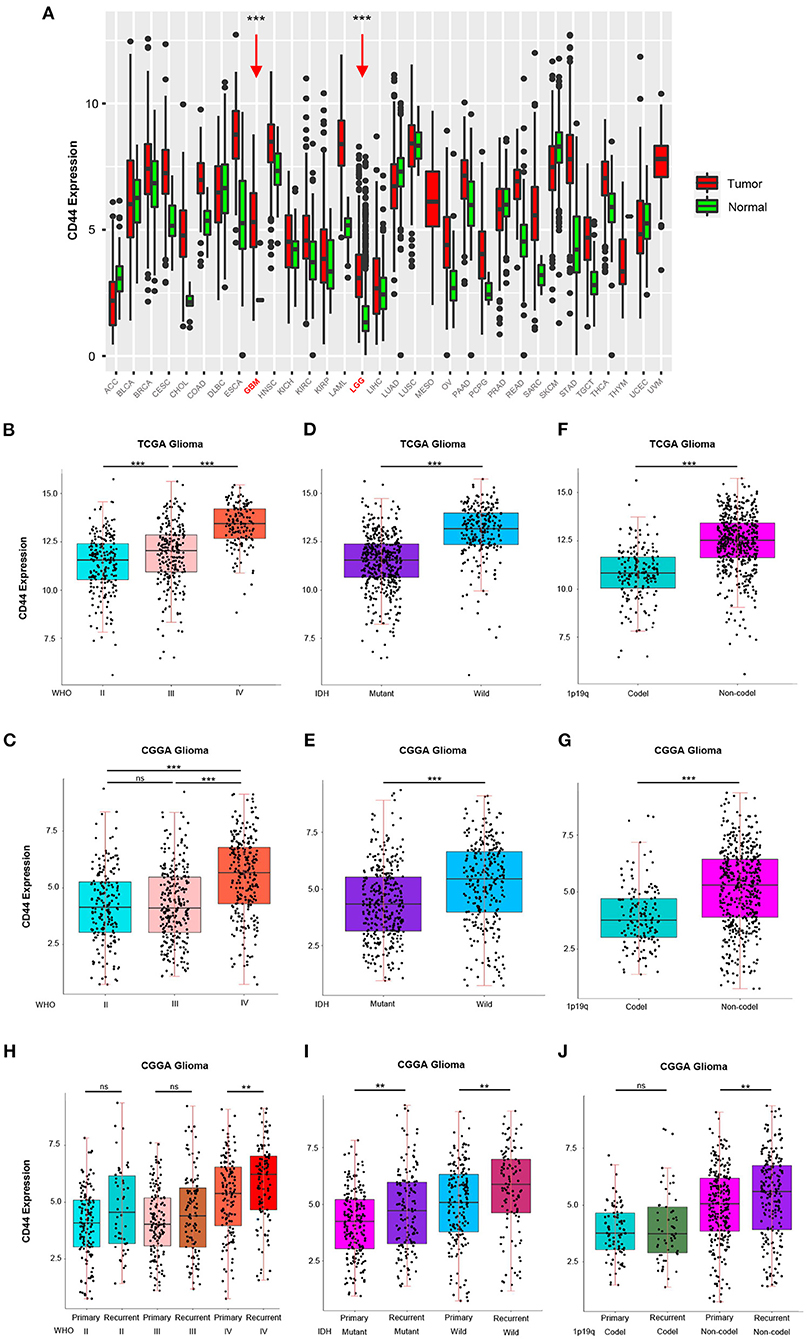
Figure 1. CD44 is highly expressed in WHO grade IV, wild-type IDH, 1p19q non-codeletion and recurrent glioma. (A) The mRNA level of CD44 is higher in GBM and LGG than normal brain. GBM and LGG are colored in red and pointed out by red arrows. CD44 significantly increases in WHO grade IV form TCGA (B) and CGGA (C). CD44 significantly increases in wild-type IDH glioma form TCGA (D) and CGGA (E). CD44 significantly increases in 1p19q non-codeletion glioma form TCGA (F) and CGGA (G). CD44 significantly increases in recurrent glioma (H–J). Tested by t-test: ***p < 0.001; **p < 0.01; ns, p ≥ 0.05.
Because IDH1 mutation frequency is >68% in LGG, but only 12% in GBM (27), and 1p19q codeletion is more common in LGG than GBM (28), we studied CD44 expression level in different IDH types and 1p19q states. In both the TCGA glioma and CGGA glioma, samples with strong CD44 transcription are primarily having wild-type IDH, but the ones with low CD44 expression have IDH mutation (Figures 1D,E), which can also be discovered among GBM groups (Supplementary Figures 3A,C). We also found a significant correlation between low CD44 transcription level and 1p19q codeletion status in both TCGA and CGGA glioma (Figures 1F,G, Supplementary Figures 3B,D). Glioma patients with IDH1 mutation have median OS three times longer than those without (27), codeletion of 1p and 19q is associated with better survival rates in glioma (29), and thus, low CD44 expression patients with glioma may have better clinical outcomes.
Furthermore, we uncovered up expression of CD44 after glioma recurrence in GBM, wild-type IDH, IDH mutation, and 1p19q non-codeletion state in CGGA glioma dataset (Figures 1H–J). Although multimodal treatments can prolong life, recurrence is inevitable in glioma, especially GBM, and it can obtain more malignant phenotype after recurrence (30). Herein, malignant glioma has relative higher CD44 expression level, and CD44 is involved in malignant progress of glioma.
Transcriptional Level of CD44 Effectively Predicts Survival of Patients With Glioma
CD44 transcription level is sufficient to predict OS of patients with glioma in TCGA and CGGA datasets (Figure 2). Compared with the lower expression of CD44 group in whole-grade glioma, patients with higher CD44 expression have significantly shorter survival. Given the obvious heterogeneity in glioma (31, 32), we further investigated the prognostic value of CD44 among different WHO grades, IDH types, 1p19q states, and recurrent status. Interestingly, we observed the same prognostic tendency of CD44 in these different compared groups (Figure 2). In addition, we did Cox-regression analysis of CD44 with patients' age and gender, namely multivariate Cox-regression analysis, in different glioma groups to evaluate their predictor values in glioma. In the Cox proportional hazards model, patients with higher CD44 expression level have higher mortality than those with lower CD44 expression in different compared groups (HR>1, p < 0.05), except in 1p19q codeletion status (p > 0.05) (Table 1). These findings suggest that CD44 could be a negative prognosticator in glioma.

Figure 2. Survival analysis of CD44 in patients with glioma. Survival analysis of CD44 mRNA expression in glioma form TCGA (A) and CGGA (B).
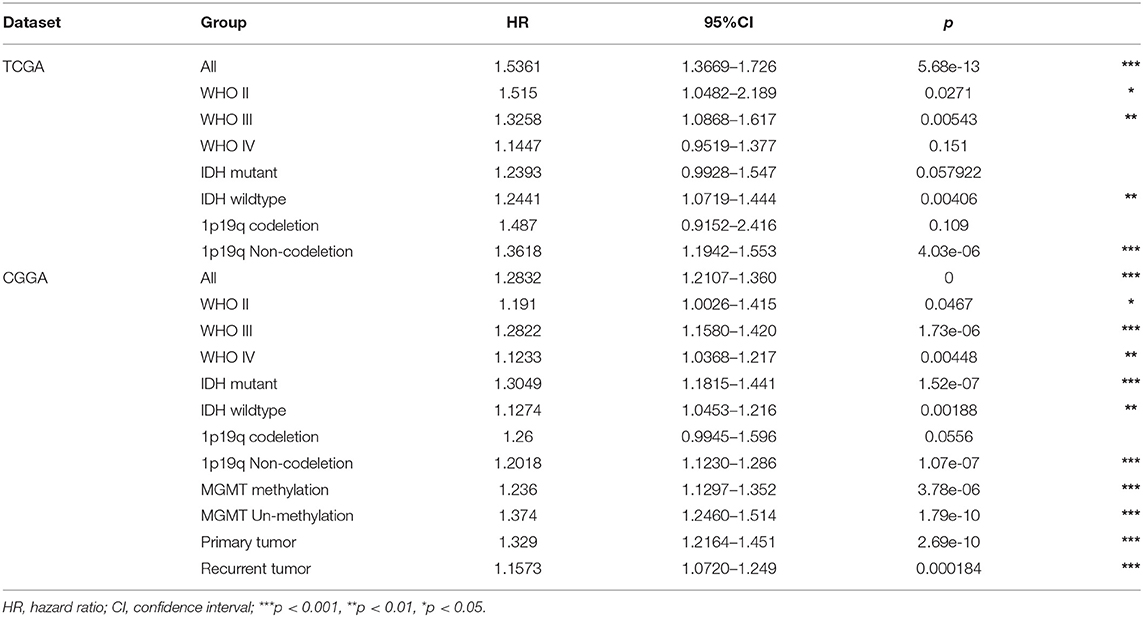
Table 1. Multi-variate Cox-regression analysis of CD44 expression with Age and Gender.
CD44 Expression in Different Glioma Subtypes
First, we analyzed the distribution of CD44 in different GBM transcription subtypes to obtain an overview of the molecular expression pattern of CD44. The CD44 mRNA expression is quite different in the three different GBM characteristic subtypes (Figure 3A). Samples with high CD44 expression are mainly concentrated in the mesenchymal subtype, which is verified by IHC results (Figure 3B). Considering the mesenchymal GBM subtype is featured with more infiltrating tumor-associated macrophages (TAMs) and immunosuppression (33), we speculated that CD44 may play an important role in glioma immune environment. Next, we adopted the other glioma subtype model that portrays adult diffuse grades II, III, and IV gliomas comprehensively (34). They reveal that a subtype of IDH mutant glioma is associated with DNA hypermethylation and better outcome, and that a group of wild-type IDH diffuse glioma shows molecular similarity to pilocytic astrocytoma and relatively favorable survival. We explored the expression difference of CD44 among pan-glioma transcriptome subtype (Figure 4A), pan-glioma DNA methylation subtype (Figure 4C), and supervised pan-glioma subtype (Figure 4E). Through comparing the survival in different subtypes (Figures 4B,D,F), we discovered that the subtypes with high CD44 expression are related to bad clinical outcomes as well.
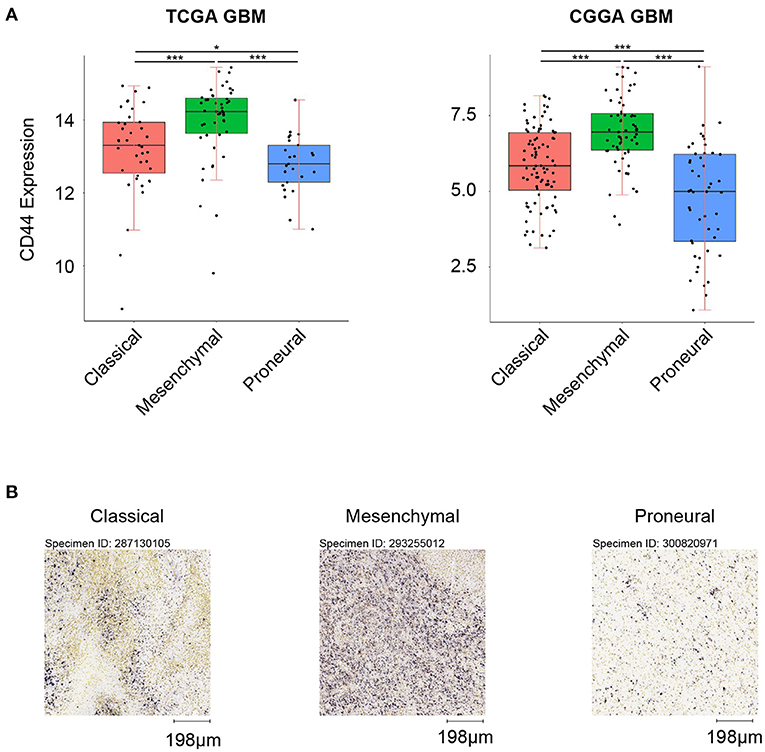
Figure 3. CD44 expression in GBM subtypes. (A) CD44 is highly upregulated in mesenchymal subtype in TCGA and CGGA GBM samples. (B) CD44 protein expression is detected in three GBM subtypes, and mesenchymal subtype glioma has the highest CD44 protein expression level. Scale, 198 μm. Tested by t-test: ***p < 0.001; *p < 0.05.
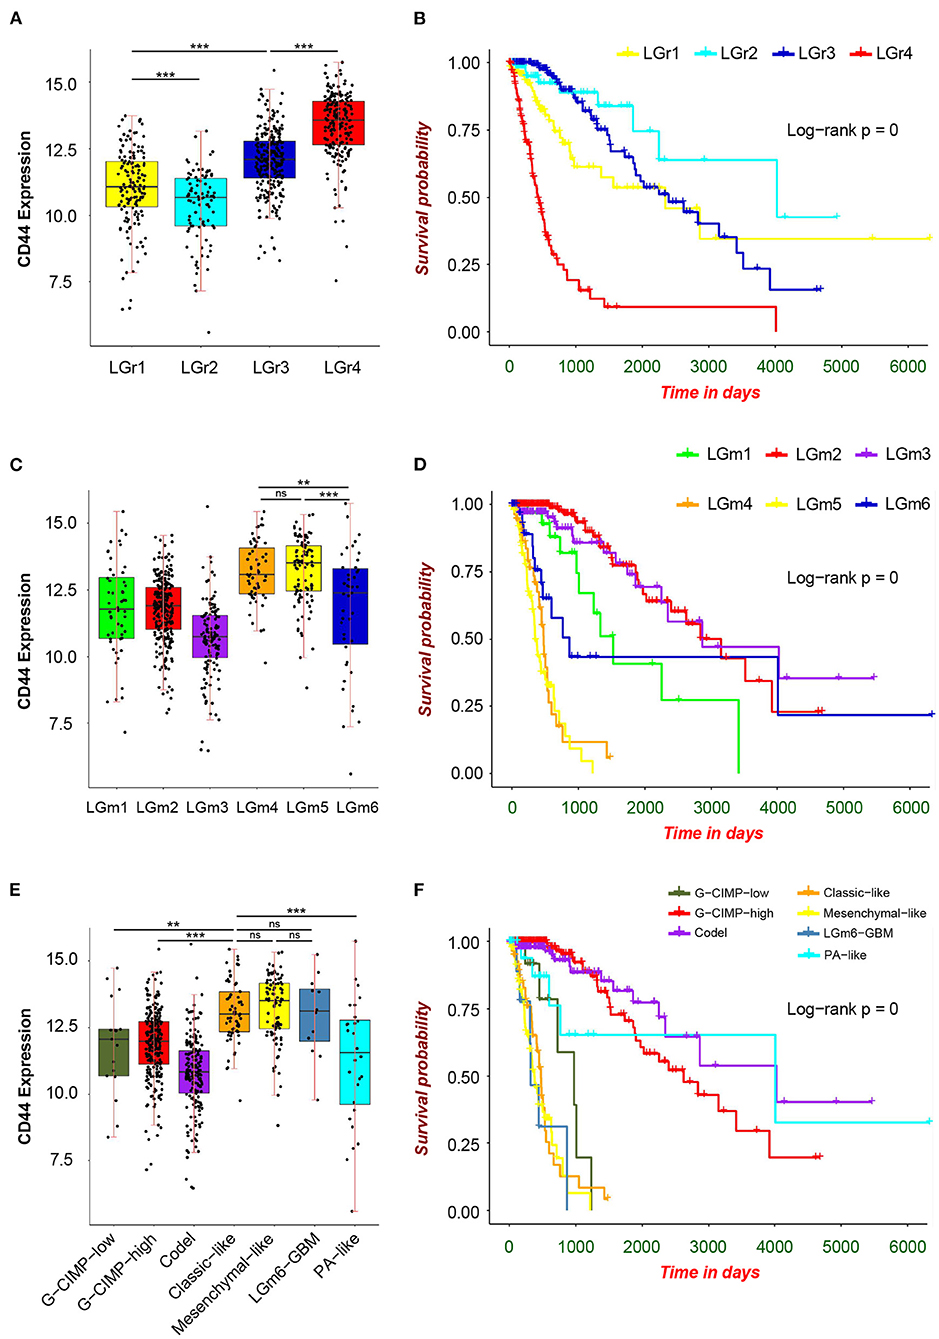
Figure 4. CD44 expression in pan-glioma subtypes. Expression of CD44 is elevated in LGr4 among pan-glioma transcriptome subtypes (A), in LGm4 and LGm5 among pan-glioma DNA methylation subtypes (C) and in classic–like, mesenchymal–like, and LGm6–GBM among supervised pan-glioma subtypes (E). These distinct glioma subtypes with high CD44 expression are in bad clinical outcomes (B,D,F). Tested by t-test: ***p < 0.001; **p < 0.01; ns, p ≥ 0.05.
CD44 Correlates With Immune-Related Biological Response in Glioma
Because immune cells are the main participants in immune response, we characterized the relationship between CD44 and the infiltrated immune cells in glioma. The results indicate that CD44 is positively associated with the immune score and stromal score in TCGA and CGGA glioma databases (Figure 5A), which suggests that CD44 does work in glioma immunity. Additionally, the standard CIBERSORTx pipeline was applied to further evaluate the relationship between CD44 and infiltration of 22 immune cells in glioma microenvironment (17). In addition, the results show that CD44 has the most significantly positive correlation with M2-type macrophages (Figure 5B). The analysis results generated by xCell workflow also confirmed the positive correlation between CD44 expression level and macrophages M2 score (Supplementary Figure 4). It is well known that M2 TAMs accelerate tumor cell invasion and angiogenesis and suppress antitumor immunity (35), which explains why CD44 can be prognostic biomarker and confirms immunity function of CD44.
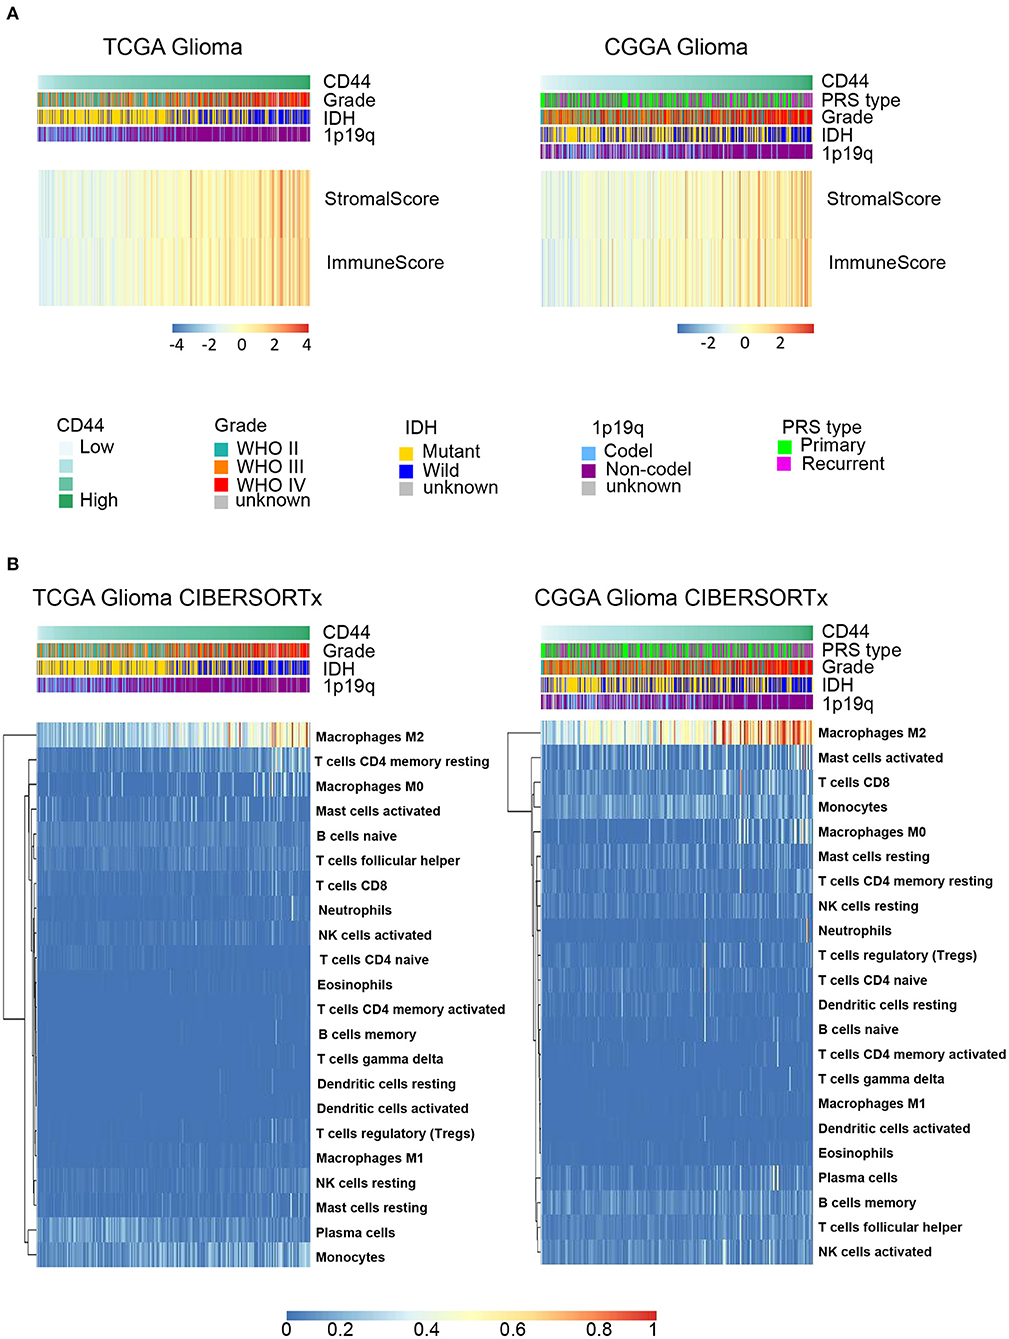
Figure 5. CD44 is closely correlated with immune microenvironment in glioma. (A) Heatmap of immune score and stromal score in TCGA and CGGA gliomas. The higher CD44 expression level the glioma has, the higher immune score and stromal score it is, which reflects glioma with elevated CD44 expression has more infiltrating immune cells. (B) Component types of 22 human immune cells infiltrated into glioma were analyzed by CIBERSORTx in TCGA and CGGA glioma datasets. Glioma with high CD44 expression has more infiltrating M2-type macrophages.
Then, to gain insight into the particular contribution of CD44 to glioma immunity, GO and KEGG analyses were used to screen relevant genes in TCGA and CGGA glioma databases. We adopt two different strategies, namely the WGCNA method and the Pearson's correlation method, to obtain the CD44 relevant genes. First, the general WGCNA analysis flow was taken to divide the genes in different modules and to correlate these module eigengenes with clinical traits including CD44 expression level. The modules were chosen as they had the highest correlation coefficient with CD44 transcription level and contained the CD44 as well. The brown, turquoise, and brown and blue module emerges as the most significant module for TCGA glioma, TCGA GBM, CGGA glioma, and CGGA GBM, respectively (Figures 6A,C,E,G, Supplementary Figure 5). Then, we picked out hub genes in these most significant modules and used them in subsequent enrichment analysis. These hub genes correlated with CD44 are involved in immune response (e.g., macrophage activation, cytokine production, microglial cell activation, and T cell activation) in both TCGA and CGGA glioma datasets (Figures 6B,D,F,H, Supplementary Table 1). Apart from the positively relevant genes, negatively relevant ones can also help us to understand the function of CD44. To acquire CD44 coexpressed genes in the second Pearson's correlation analysis part, we set different Pearson's |R| value cutoff in TCGA and CGGA glioma datasets as mentioned in the Methods section. Although the enrichment analysis results of these positively correlated genes are also most involved in immunity (Figure 7), we found that some of them are related to angiogenesis, cell adhesion, ECM-receptor interaction, and so on. (Supplementary Tables 2, 3), which is consistent with the former studies (36, 37). On the other hand, the negatively relevant genes of CD44 take parts in synaptic function (Supplementary Figure 6, Supplementary Tables 2, 3). To sum up, CD44 plays an important role in glioma immunity.

Figure 6. WGCNA analysis and enrichment analysis of significant modules. Module–trait relationship heatmap in TCGA-glioma (A), TCGA-GBM (C), CGGA-glioma (E), and CGGA-GBM (G). The row represents the module, and the column represents the trait. The values in the box indicate the correlation and p-value. Top 20 enrichment analysis results of the genes in the modules of interest were shown in TCGA-glioma (B), TCGA-GBM (D), CGGA-glioma (F), and CGGA-GBM (H). Most of the enrichment functions are related to immunity.
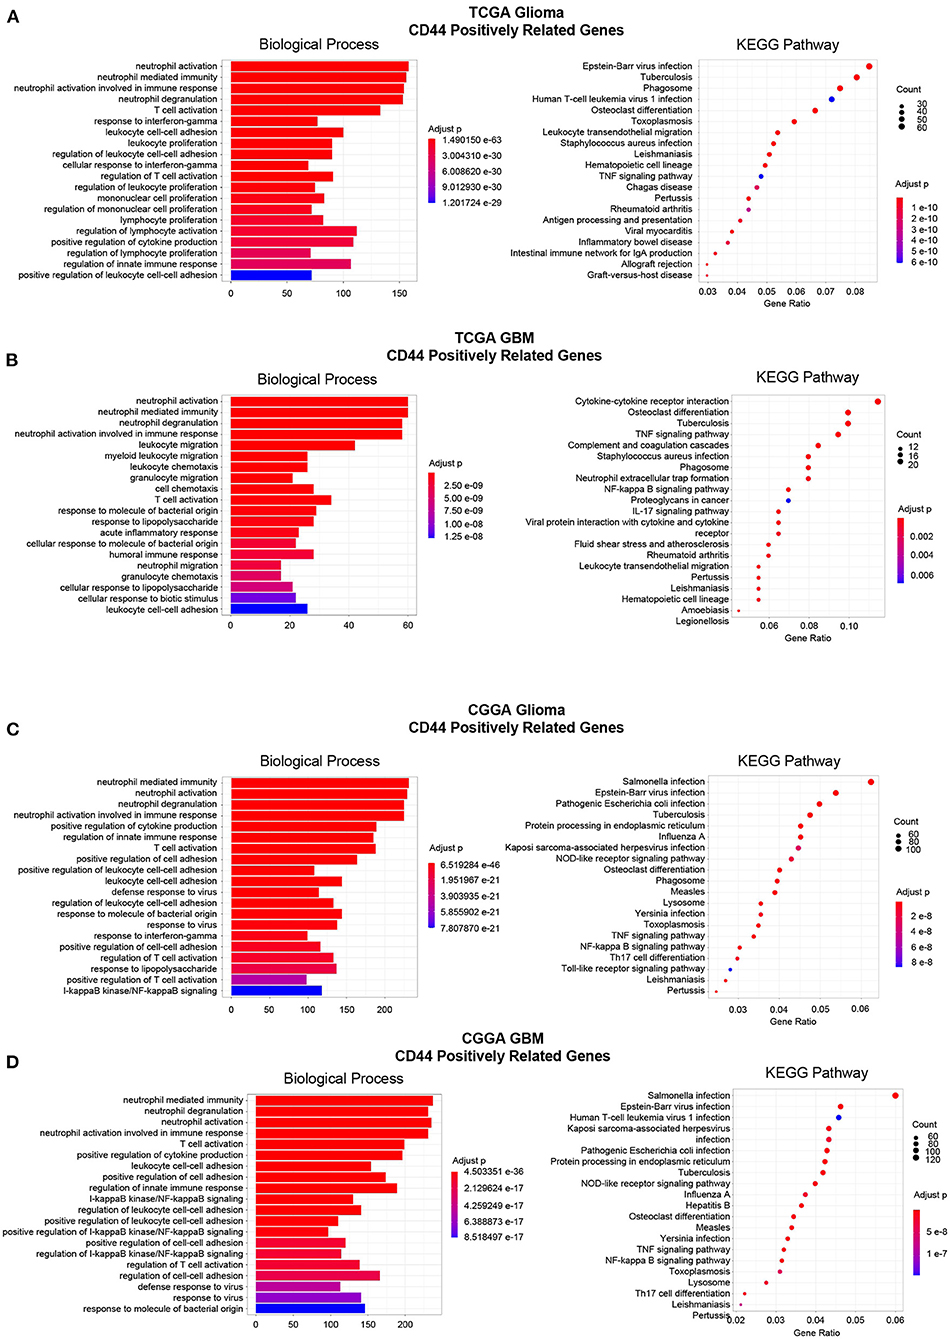
Figure 7. Enrichment analysis of CD44-positive related genes. Top 20 enrichment analysis results of CD44-positive related genes were showed in TCGA-glioma (A), TCGA-GBM (B), CGGA-glioma (C), and CGGA-GBM (D). Most of the enrichment results are related to immunity.
Spatial Distribution Preference of CD44 in GBM
Glioblastoma is one of the most heterogeneous tumors, and multiple TCGA transcription subtypes can coexist in the close tumor regions (33). Spatial heterogeneity of glioma is the barrier for treatment. Thus, we compared the CD44 expression level in different GBM tumor regions, and genes were clustered according to their tumor region features to obtain the expression patterns whose spatial states are highly desirable as CD44. The result demonstrates that CD44 mainly distributes in the perinecrotic region within tumor (Figure 8A). Some of the top correlated genes are immune genes (e.g., TNC, CCL2, SOCS3, TNFRSF12A, PTX3, and VAT1) (38, 39), invasive genes (e.g., GBP2, EMP1, VIM, ANO6, RBM47, CHI3L1, HMOX1, and ICAM1) (40–42), proliferative genes (e.g., ANXA2, ZFP36L2, and CHI3L2) (43, 44), and apoptotic genes (e.g., SOD2) (45). From the spatial-based correlated gene pattern, CD44 may take part in GBM immunity, invasion, and proliferation process. Thus, we further did enrichment analysis of this spatial-based correlated gene pattern to explore underlying biological function of CD44. The results confirmed that CD44 is related to immunity, and invasion (Figures 8B,C, Supplementary Table 4). We also found that CD44 takes part in response to decreased oxygen levels, HIF-1 signaling pathway, and angiogenesis process (Figures 8B,C, Supplementary Table 4), which is consistent with the spatial distribution preference of perinecrotic zone (Figure 8A). Because HIF1A is a regulator of CD44 and increases CD44 expression, hypoxic region in breast cancer has also been reported to contain cells with a higher concentration of CD44 expression (46). In GBM, we uncovered that CD44+ cells mainly distribute in hypoxic region with high expression of immune genes.
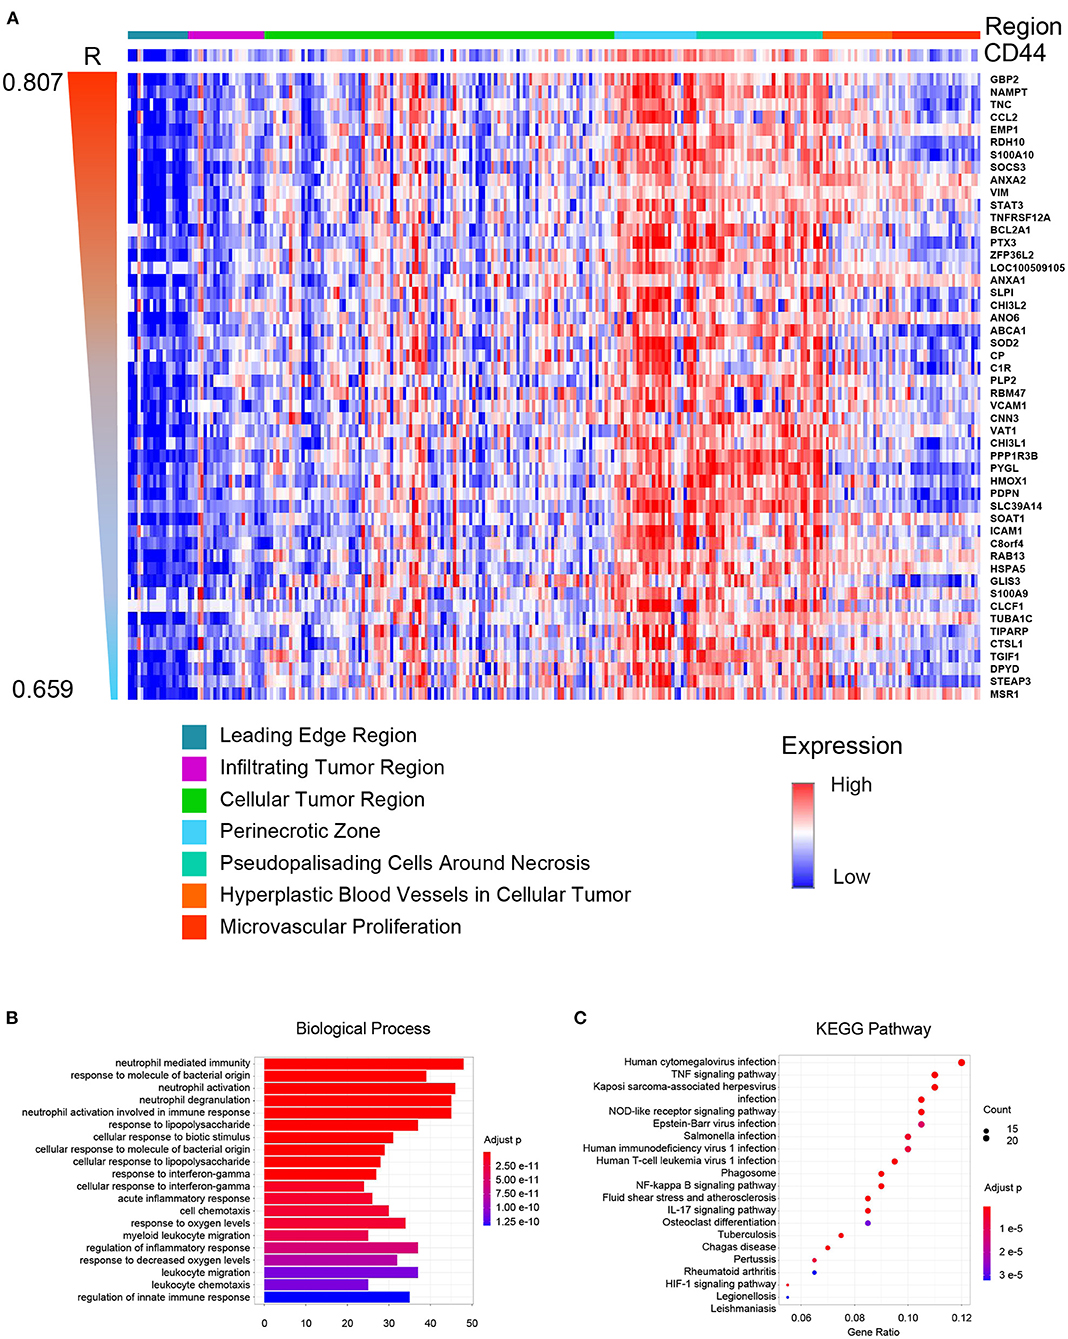
Figure 8. CD44 spatial expression pattern. (A) Heatmap of the top 50 correlated genes based on distribution similarity with CD44. The genes were ordered by correlated R index from high to low. Top 20 biological processes (B) and top 20 pathways (C) of CD44 spatial expression related genes were shown. The major of enrichment results is about immunity.
Single-Cell Landscape of CD44 in GBM
Whereas, tumor is constituted by malignant cells and surrounding stromal cells, we know few about the heterogeneity of CD44 transcription in glioma at single-cell resolution until now. Global gene expression however is readily measurable, and the advent of single-cell RNA-seq technology enables us profile individual cell expression within tumors. Therefore, we applied single-cell RNA-seq dataset for GBM (47) to further explore CD44 expression at single-cell resolution. First, we annotated GBM cells into specific cell types according to CNVs and known cell markers (Supplementary Figures 7B,C). GBM contains malignant tumor cells and TAMs together with a small number of oligodendrocytes, endothelial cells, pericytes, and T cells (Figure 9A). Then, we compared the CD44 expression level among different cell types and found that only malignant tumor cells, TAMs, and T cells express CD44 (Figure 9B). TAMs are the major immune cells in GBM, which is in accord with our finding that CD44 acts in glioma immunity. Because only a part of TAMs express CD44 (Figure 9C), DEGs between CD44+ TAMs and CD44- TAMs were calculated and underwent further enrichment analysis. The functional analysis showed that CD44+ TAMs are enriched in leukocyte migration, leukocyte chemotaxis, positive regulation of cell-substrate adhesion, extracellular matrix organization, positive regulation of angiogenesis, and so on (Figure 9D, Supplementary Table 5). In addition, CD44+ TAMs are in M2-type polarization state presenting with high expression of CD163, CD206, and STAT3, and they can also activate angiogenesis by secreting VEGFA and promote cell invasion through secreting matrix metallopeptidase (e.g., MMP14, MMP19) (Figure 9E). Because CD44 expression level is positively correlated with M2-type macrophage infiltration (Figure 5B), we verified the infiltrating M2 TAMs among different CD44+ cell infiltration levels by IHC (Figure 10A) and found that the more CD44+ cells are detected, the more M2 TAMs infiltrate, which is consistent with the correlation of CD44 with CD163 in the TCGA and CGGA glioma datasets (Figure 10B). By checking expression of CD44 and CD163 in glioma samples through IF, CD44+CD163+ cells were uncovered (Supplementary Figure 8), which confirmed that the CD44+ TAMs are in M2 phenotype. We also uncovered that not all T cells express CD44 (Supplementary Figure 7D), and the enrichment analysis results of CD44-related genes in T cells are listed in Supplementary Table 6.
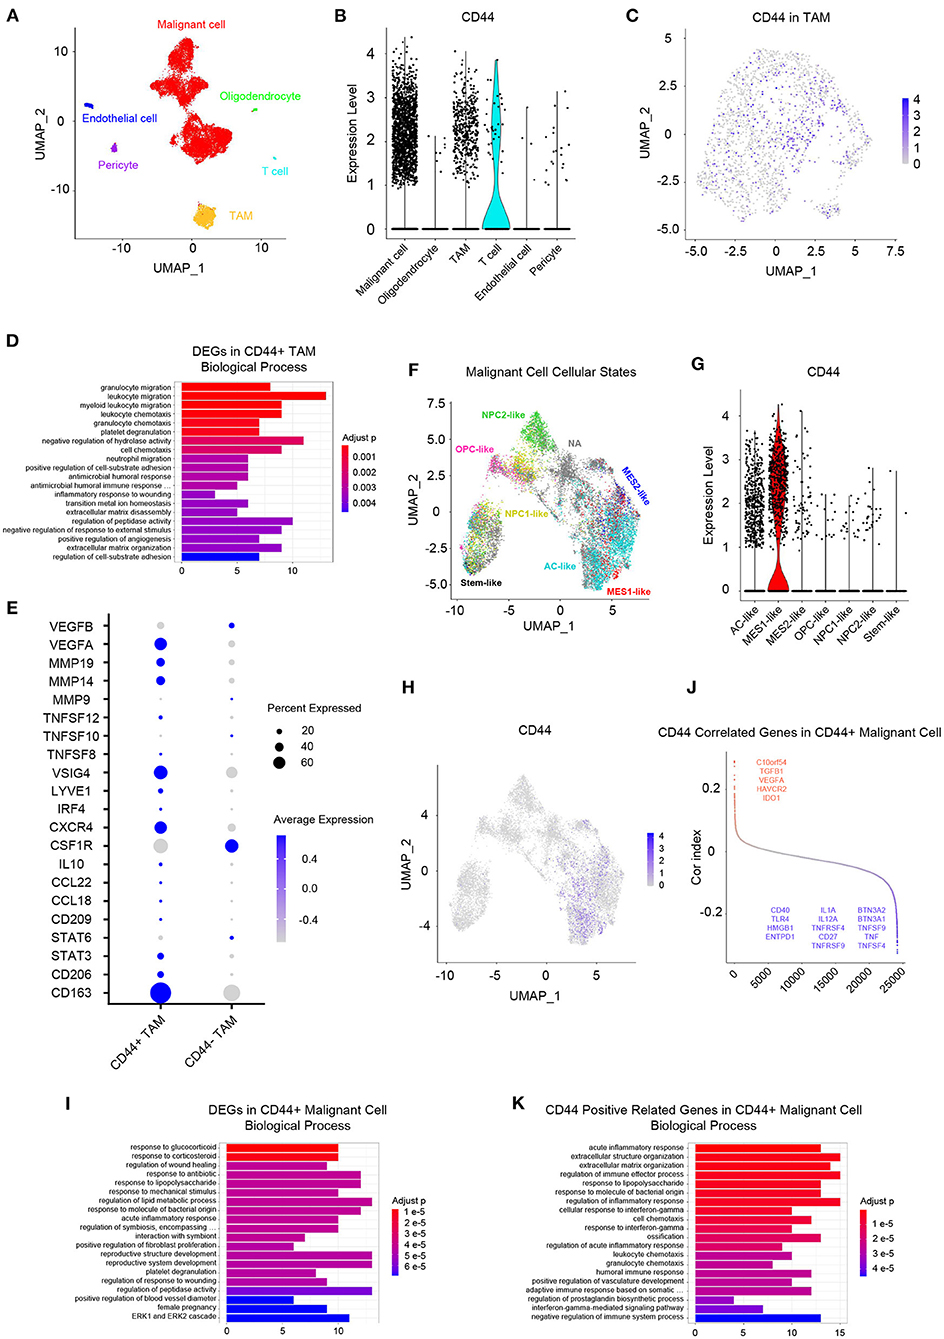
Figure 9. Landscape of CD44+ cells in GBM. (A) All GBM cell types are projected on UMAP reduction. GBM is composed of malignant tumor cells, oligodendrocytes, TAMs, T cells, endothelial cells, and pericytes. (B) Expression level of CD44 among different GBM cell types. Only malignant cells, TAMs and T cells express CD44 in GBM. (C) Expression of CD44 in TAMs is projected on UMAP reduction. (D) Top 20 biological processes of DEGs in CD44+ TAMs compared to CD44- TAMs. (E) CD44+ TAMs express M2-type TAM markers CD163 and CD206. (F) UMAP reduction of all six GBM tumor cellular state cells and stem-like cells. (G) Expression level of CD44 among the six GBM tumor cellular state cells and stem-like cells. Only MES1-like tumor cells express CD44 among different cellular states. (H) Expression of CD44 in tumor cells is projected on UMAP reduction. (I) Top 20 biological processes of DEGs in CD44+ tumor cells compared to CD44- tumor cells. (J) CD44-correlated genes in CD44+ malignant cells. Genes labeled in red are immunosuppressive genes, whose expression level positively correlates with CD44; blue colored genes are immune stimulator genes and their expression negatively relates to CD44. (K) Top 20 biological processes of CD44 positive-related genes in CD44+ malignant cells.

Figure 10. Verification of infiltrating M2 TAMs in different groups. (A) Comparison of the infiltration of M2 TAMs (CD163+) among the high, intermediate and low intratumoral CD44+ cell groups in the IGAP IHC database. Scale, 895 μm. (B) Correlation of CD44 with CD163 in the TCGA and CGGA glioma datasets.
Neftel et al. declare that GBM malignant tumor cells can be grouped into a limited set of cellular states, namely astrocyte-like (AC-like), mesenchymal-1-like (MES1-like), mesenchymal-2-like (MES2-like), oligodendrocyte-progenitor-like (OPC-like), neural-progenitor-1-like (NPC1-like), and neural-progenitor-2-like (NPC2-like) states (32). Because CD44 was described as a marker of GBM CSCs, also known as glioma stem–progenitor cells or glioma-initiating cells (7), we also annotated the stem-like cells besides the six GBM tumor cellular states in malignant cells (Figure 9F). Furthermore, we revealed MES1-like state preference of CD44 (Figure 9G), which is similar to TCGA-mesenchymal subtype preference of CD44 (Figure 3). Surprisingly, no GBM stem-like cells express CD44, suggesting that it is not a suitable CSC marker (Figure 9G). Next, we compared the DEGs between CD44+ tumor cells and CD44- tumor cells (Figure 9H), and the enrichment analysis results verified the immunity function of CD44 (Figure 9I, Supplementary Table 7). In addition, we calculated the Pearson's correlated genes with CD44 in CD44+ tumor cells and uncovered that some positive related genes are immunosuppressive genes (e.g., C10orf54, TGFB1, VEGFA, HAVCR2, and IDO1) and that some negative related genes are immune stimulator genes (e.g., BTN3A2, BTN3A1, TNFSF9, TNF, TNFSF4, IL1A, IL12A, TNFRSF4, CD27, TNFRSF9, CD40, TLR4, HMGB1, and ENTPD1) (Figure 9J, Supplementary Table 8). The enrichment analysis results of CD44-positive related genes in CD44+ malignant cell showed that CD44 correlates with immune activities as well (Figure 9K, Supplementary Table 7).
Correlation of CD44 and GBM Immunosuppression
CD44 is related to immunity in glioma, CD44+ malignant tumor cells are in MES-1-like state, and CD44+ TAMs are in M2 phenotype. Therefore, we hypothesized that glioma CD44+ cells take part in tumor immunosuppression. First, we used the immunomodulators (21) with CD44 to construct the protein–protein interaction network, and the immunomodulators with direct interaction to CD44 were identified (Figure 11A). Then, we found that some of the CD44-correlated genes in CD44+ cells are immunomodulators (Figure 9J, Supplementary Figures 7E,F). For example, in CD44+ T cells, some positive related genes are immunosuppressive genes (e.g., CD274, VEGFA, PDCD1, and CTLA4) and that some negative related genes are immune stimulator genes (e.g., CCL5, ITGB2, ICAM1, and PRF1). Thus, CD44+ malignant tumor cells, CD44+ TAMs, and CD44+ T cells may induce immunosuppression in glioma. Next, we explored the expression of the immunomodulators with direct interaction to CD44 among the glioma CD44+ cells (Figures 11B–D). Each CD44+ cell-type functions immunosuppression through different ways: CD44+ tumor cells express CD276, IL13, VEGFA, and IDO1; CD44+ TAMs express IL10, TGFB1, VEGFA, and HAVCR2; CD44+ T cells express CD274, TGFB1, CTLA4, LAG3, and PDCD1 (Figure 11C). To our surprise, we found that CD44+ T cells express both CD274 (namely PD-L1) and PDCD1 (namely PD-1) in glioma. In addition, we built the regulon network of glioma cells, and the regulon network of CD44+ cells is different from CD44- cells (Figure 12). DDIT3 regulon is upregulated in CD44+ tumor cells, which can inhibit type I interferon (IFN-I) and IFN-stimulated gene production (48). RUNX3 is upregulated in CD44+ T cells, which serves as immunosuppressive role in tumor (49). Therefore, CD44+ glioma cells participate in glioma immunosuppression.
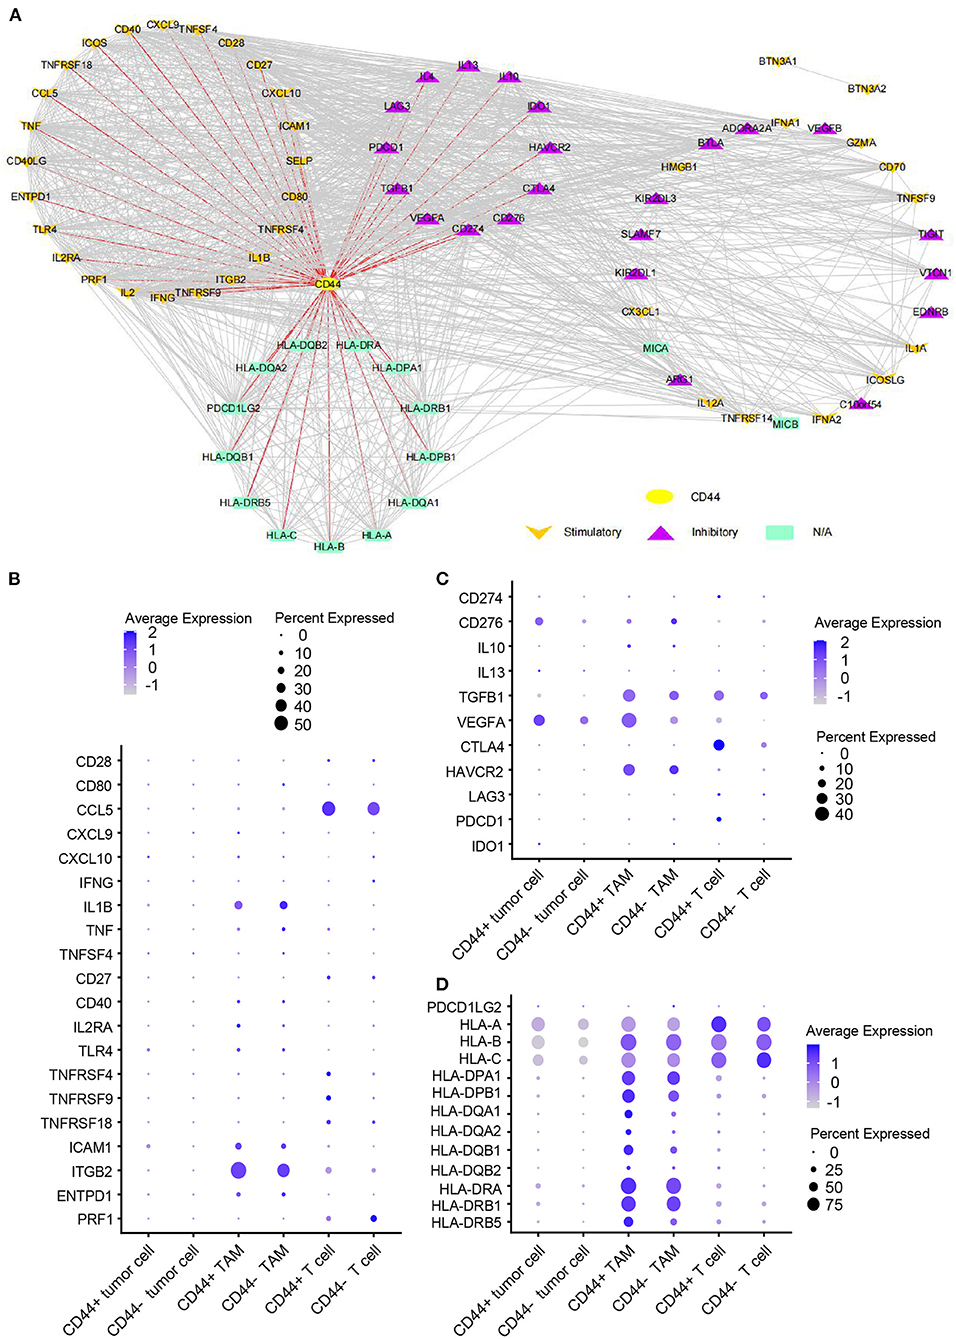
Figure 11. Expression of immunomodulators in CD44+ glioma cells. (A) Protein–protein interaction network of CD44 and immunomodulators. The direct interaction between CD44 and immunomodulators was colored in red. Expression dot plot of stimulatory immunomodulators with direct interaction to CD44 (B), inhibitory immunomodulators with direct interaction to CD44 (C) and other immunomodulators with direct interaction to CD44 (D) among tumor cells, TAMs, and T cells.
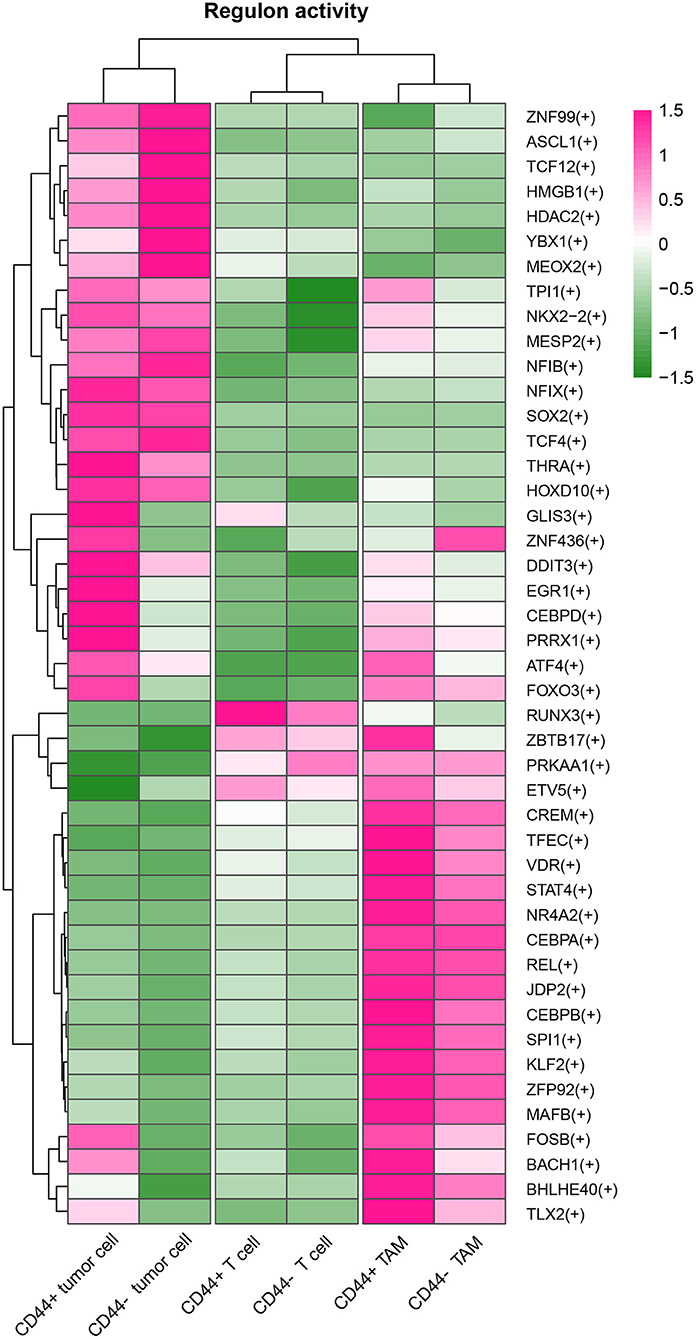
Figure 12. Heatmap of regulon activity among tumor cells, TAMs and T cells. The cell types and activated regulons were clustered respectively.
It is an ongoing endeavor to conduct researches on the development of new drugs, and new strategies eradicating cancer target the immune cells with immune checkpoints (50). PD-1 blockade yielded promising results in many cancers, and the Ivy Consortium initiated a multiinstitution, randomized, open-label pilot study of pembrolizumab, an anti-PD-1 monoclonal antibody, in patients with recurrent GBM (51). To uncover the correlation between immunotherapy and CD44 in glioma, we extracted bulk RNA-seq data of patients with recurrent GBM receiving adjuvant, postsurgical PD-1 blockade therapy from this study. The responder and nonresponder patients are different in mRNA expression pattern based on principal component analysis (Figure 13A). Furthermore, the patients with nonresponder recurrent GBM are enriched in PD-1 signaling pathway, suggesting that they have immunosuppression microenvironment and would display therapy resistance (Figure 13B). CD44 and most of its directly interacted inhibitory immunomodulators express relatively higher in immunotherapy nonresponder subgroup than responder subgroup, although some genes are not statistically significant (Figure 13C). These results confirm immunosuppression role of CD44 in glioma.
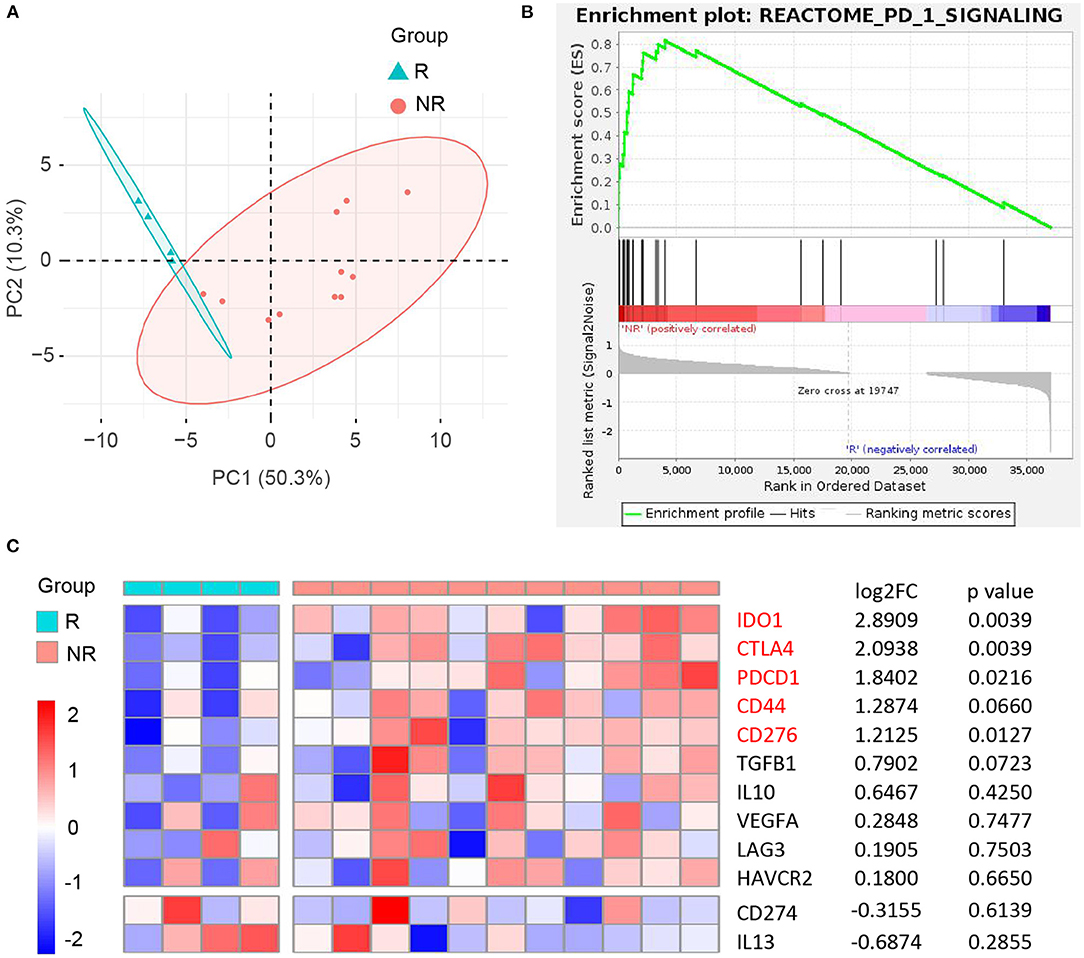
Figure 13. Correlation between CD44 and anti-PD-1 immunotherapy in recurrent GBM. (A) Principal component analysis of responder (R) and nonresponder (NR) recurrent GBM treated with anti-PD-1 immunotherapy based on RNA-seq data. (B) NR subgroup is enriched in REACTOME PD-1 signaling pathway compared to R subgroup. (C) Heatmap of CD44 and its directly interacted inhibitory immunomodulators expression between R and NR recurrent GBM subgroups. NR group was compared to R group, and the matching log2FC and p-value of each gene were shown in the right column.
Discussion
In this study, the function of CD44 was explored in glioma at bulk, spatial, and single-cell level, respectively. We discovered the immune characteristic of CD44 in glioma, which plays a critical role in clinical outcomes.
One meta-analysis claims higher expression of CD44 that predicts poor survival in glioma particularly in those with WHO grades II and III glioma (52), and another clinical research discovers that higher tumor expression of CD44 acts as a negative prognosis indicator in patients with GBM (53). Our work also found that CD44 can be a prognostic biomarker, whose transcription level is related to malignancy glioma and poor prognosis in two notable glioma cohorts (11, 12). CD44 is a cell membrane glycoprotein which involved in diverse tumor aggressive processes including invasion, proliferation, apoptosis, and angiogenesis (37), but there are no studies reporting its activity in glioma immunity. To gain the overview of CD44 function, we adopted multiple methods to obtain CD44-related genes, including WGCNA, the Pearson's correlation, and DEGs. Later, we did the enrichment analysis of these gene sets of interest to get further understanding of them. It is very interesting to notice that immunity function is more significant than CD44 other functions (Figures 6, 7, Supplementary Tables 1–3), such as invasion, proliferation, and angiogenesis reported as before. Furthermore, CD44 transcription level is related to M2 macrophage infiltration at bulk-seq resolution (Figure 5B), and this finding is verified by single-cell RNA-seq data that CD44+ TAMs are in M2-type state (Figure 9E) and by IHC that glioma with higher CD44+ cells infiltration has more infiltrating M2 macrophages (Figure 10A). In addition, CD44+CD163+ cells were verified by IF on human glioma samples (Supplementary Figure 8). M2 TAM accelerating tumorigenicity (54) is one of the underlying reasons why CD44 can be the convincing prognostic biomarker for glioma. These results support that CD44 is a new biomarker for M2 TAMs.
In glioma mouse model, CD44 was restricted to hypoxic and perivascular tumor regions, and HIF-2α, a hypoxia signature, was correlated with CD44 in human glioma (55). We also checked the spatial preference of CD44 in glioma and found that CD44 distributes in the perinecrotic zone within tumor (Figure 8A). The correlated gene patterns based on CD44 distribution preference are involved in hypoxia response and angiogenesis which coincides with the former research, but we found that the major of enrichment analysis results are immune-related activities that highlight its immune function (Figures 8B,C). Apart from CD44 spatial preference, transcription subtype preference, namely mesenchymal subtype, in bulk-seq level (Figure 3) and cellular state preference, namely MES1-like state, at single-cell resolution (Figure 9G) are also revealed by our study. Whereas, TCGA mesenchymal subtype GBM is characterized as immunosuppressive and therapy resistant tumor (33), the significance of CD44 expression preference in specific GBM molecular subtype and tumor cell cellular state is unclear. Therefore, we calculated the DEGs between CD44+ tumor cells and CD44- tumor cells and identified the Pearson's correlated genes in CD44+ tumor cells (Figures 9H–K). These results support our new finding that CD44 acts in glioma immunity. The major of glioma-infiltrating immune cells are TAMs, and an increased infiltering TAM correlates with shorter survival time (35). Thus, the surface markers of TAMs may be the potential therapeutic targets. TAMs in glioma are commonly identified by the expression of CD11b, CD14, CD68, CD163, and CD206. Additionally, we demonstrated that CD44 expression has high concordance with CD11b, CD14, CD68, CD163, and CD206, which indicates a synergistic relationship between CD44 and macrophage markers in glioma (Supplementary Figure 9). This reminds us that for patients who acquired resistance to standard therapy based on the expression of CD44 (36), we should pay attention to the increasing of TAM makers and arising of M2-type TAMs infiltrating.
To go a step further, we explored the immunosuppressive role of CD44 in glioma. As reported, CD44 expression level is positively correlated with PD-L1, PD-1, IL10, and TGFB1 expression in some cancers (56, 57). Thus, coexpression of CD44 and checkpoint family members were checked in glioma, and we found that CD44 expression positively correlates with the expression level of PD-L1 and PD-1 and correlates with the expression level of PDCD1LG2 (namely PD-L2) as well in the TCGA and CGGA glioma datasets (Supplementary Figure 10). HAVCR2 plays almost the same immunosuppressive functions as PD-1 in glioma (58), and we also found that CD44 shows a consistent correlation with HAVCR2 and PD-1 in glioma (Supplementary Figure 10). It has been reported that CD40, TNFSF14, LGALS9, and SIGLEC10 high expression levels are associated with glioma malignancy grade and negative prognosis (59–61). Therefore, there are some positive relationships between CD44 and these immune checkpoints in glioma (Supplementary Figure 10). However, further analysis found that NCR3LG1 shows negative relationship with CD44 in glioma (Supplementary Figure 10), which may be partially explained by the low expression in malignant glioma and positive glioma survival biomarker of NCR3LG1 (Supplementary Figure 11). CD44 can positively regulate the expression of PD-L1 by activating PD-L1 transcription partly via the association between its intracytoplasmic domain and a regulatory region in PD-L1 (62), and CD44+ tumor-initiating cells in head and neck squamous cell carcinoma suppress antitumor immunity through inducible expression of PD-L1 (63). PD-L1 represses antitumor immunity through its interaction with the PD-1 receptor on T cells (64). Furthermore, PD-1 is obviously elevated in CD44+ T cell than CD44- T cell (65). CD44 takes part in formation and persistence of regulatory T cells which play a vital role in tumor immunosuppression: LGALS9 interacts with CD44 in association with TGF-β receptors to drive FOXP3 expression in regulatory T cells (66); CD44 maintains FOXP3+ regulatory T cell persistence via inducing production of IL10 and TGFB1 (67). Conversely, other immunomodulators can also regulate CD44 expression levels. IL4 and IL13 can upregulate CD44 expression in human cervical adenocarcinoma cell lines and colonic epithelial cell lines (68, 69). Our results revealed that distinct CD44+ cell type plays the immunosuppressive role through expressing different immunomodulators in GBM, and it is interesting to uncover that CD44+ T cells express both PD-L1 and PD-1 (Figure 11C). Thus, glioma-infiltrating CD44+ T cells can inhibit antitumor immunity by inducible expression of PD-L1. Finally, the correlation of CD44 mRNA expression and glioma immunotherapy was studied. CD44 and its directly interacted inhibitory immunomodulators are upregulated in patients with nonresponder recurrent GBM receiving PD-1 blockade therapy. However, it still needs more clinical studies to confirm the relationship between CD44 and glioma immunotherapy for the small number of glioma samples treated with immunotherapy.
Conclusion
Our research limitations include analysis from publicly available data cohorts and limited data interpretation by the lack of mechanistic approaches and causality association because this study does not implement experiments in vivo. The finding of a new candidate biomarker CD44 for M2 TAMs and its immunosuppressive function in glioma is hypothesis-generating and needs more wet experiment validation. Future works needed to advance that this field further should focus on exploring downstream pathways through which CD44 acts its immunity role in different glioma cell types, such as tumor cells, TAMs, and T cells.
Data Availability Statement
Publicly available datasets were analyzed in this study. These data can be found at: TCGA database (https://www.cancer.gov/about-nci/organization/ccg/research/structural-genomics/tcga), the CGGA database (http://www.cgga.org.cn/), the IGAP database (http://glioblastoma.alleninstitute.org/), and the GEO database (https://www.ncbi.nlm.nih.gov/geo) with accession number GSE121810 and GSE103224.
Author Contributions
YX, HX, and HL conceptualized and coordinated the work. YX prepared the acquisition, analysis, and interpretation of data. YX and KY prepared the figures and tables. YX, ZW, MZ, YD, and WJ wrote the original draft. YZ, CQ, YL, HX, and HL reviewed and edited the manuscript. All authors have read and approved the final version of manuscript.
Funding
The research work was supported by grants from the National Natural Science Foundation of China (81972350), Jiangsu Science and Education Strengthening Engineering Innovation Team Project (CXTDA2017050), Medical Research Foundation of Jiangsu Health Commission (H2019059), Medical Science and Technology Development Foundation of Nanjing (ZDX16011) and Postgraduate Research and Practice Innovation Program of Jiangsu Province (SJCX19_0331 and KYCX20_1419).
Conflict of Interest
The authors declare that the research was conducted in the absence of any commercial or financial relationships that could be construed as a potential conflict of interest.
Publisher's Note
All claims expressed in this article are solely those of the authors and do not necessarily represent those of their affiliated organizations, or those of the publisher, the editors and the reviewers. Any product that may be evaluated in this article, or claim that may be made by its manufacturer, is not guaranteed or endorsed by the publisher.
Acknowledgments
We thank Dr. Liangtao Zheng at Peking University for preparing the manuscript.
Supplementary Material
The Supplementary Material for this article can be found online at: https://www.frontiersin.org/articles/10.3389/fsurg.2021.775194/full#supplementary-material
Abbreviations
CGGA, the Chinese Glioma Genome Atlas; CI, confidence interval; CSCs, cancer stem cells; DEGs, differentially expressed genes; GBM, glioblastoma; GO, gene ontology; HR, hazard ratio; IGAP, the Ivy Glioblastoma Atlas Project; KEGG, Kyoto Encyclopedia of Genes and Genomes; LGG, low-grade glioma; OS, overall survival; TAMs, tumor-associated macrophages; TCGA, the Cancer Genome Atlas; WGCNA, weighted gene coexpression network analysis.
References
1. Lapointe S, Perry A, Butowski NA. Primary brain tumours in adults. Lancet. (2018) 392:432–46. doi: 10.1016/S0140-6736(18)30990-5
2. Grossman SA, Ye X, Piantadosi S, Desideri S, Nabors LB, Rosenfeld M, et al. Survival of patients with newly diagnosed glioblastoma treated with radiation and temozolomide in research studies in the United States. Clin Cancer Res. (2010) 16:2443–9. doi: 10.1158/1078-0432.CCR-09-3106
3. Chinot OL, Wick W, Mason W, Henriksson R, Saran F, Nishikawa R, et al. Bevacizumab plus radiotherapy-temozolomide for newly diagnosed glioblastoma. N Engl J Med. (2014) 370:709–22. doi: 10.1056/NEJMoa1308345
4. Brown MP, Ebert LM, Gargett T. Clinical chimeric antigen receptor-T cell therapy: a new and promising treatment modality for glioblastoma. Clin Transl Immunology. (2019) 8:e1050. doi: 10.1002/cti2.1050
5. Xu H, Niu M, Yuan X, Wu K, Liu A. CD44 as a tumor biomarker and therapeutic target. Exp Hematol Oncol. (2020) 9:36. doi: 10.1186/s40164-020-00192-0
6. Chen C, Zhao S, Karnad A, Freeman JW. The biology and role of CD44 in cancer progression: therapeutic implications. J Hematol Oncol. (2018) 11:64. doi: 10.1186/s13045-018-0605-5
7. Dzobo K, Senthebane DA, Ganz C, Thomford NE, Wonkam A, Dandara C. Advances in therapeutic targeting of cancer stem cells within the tumor microenvironment: an updated review. Cells. (2020) 9:1896. doi: 10.3390/cells9081896
8. Hou C, Ishi Y, Motegi H, Okamoto M, Ou Y, Chen J, et al. Overexpression of CD44 is associated with a poor prognosis in grade II/III gliomas. J Neurooncol. (2019) 145:201–10. doi: 10.1007/s11060-019-03288-8
9. Gudbergsson JM, Christensen E, Kostrikov S, Moos T, Duroux M, Kjaer A, et al. Conventional treatment of glioblastoma reveals persistent CD44(+) subpopulations. Mol Neurobiol. (2020) 57:3943–55. doi: 10.1007/s12035-020-02004-2
10. Ponta H, Sherman L, Herrlich PA. CD44: from adhesion molecules to signalling regulators. Nat Rev Mol Cell Biol. (2003) 4:33–45. doi: 10.1038/nrm1004
11. Cancer Genome Atlas Research N. Comprehensive genomic characterization defines human glioblastoma genes and core pathways. Nature. (2008) 455:1061–8. doi: 10.1038/nature07385
12. Zhao Z, Meng F, Wang W, Wang Z, Zhang C, Jiang T. Comprehensive RNA-seq transcriptomic profiling in the malignant progression of gliomas. Sci Data. (2017) 4:170024. doi: 10.1038/sdata.2017.24
13. Louis DN, Perry A, Reifenberger G, von Deimling A, Figarella-Branger D, Cavenee WK, et al. The 2016 world health organization classification of tumors of the central nervous system: a summary. Acta Neuropathol. (2016) 131:803–20. doi: 10.1007/s00401-016-1545-1
14. Puchalski RB, Shah N, Miller J, Dalley R, Nomura SR, Yoon JG, et al. An anatomic transcriptional atlas of human glioblastoma. Science. (2018) 360:660–3. doi: 10.1126/science.aaf2666
15. Yoshihara K, Shahmoradgoli M, Martinez E, Vegesna R, Kim H, Torres-Garcia W, et al. Inferring tumour purity and stromal and immune cell admixture from expression data. Nat Commun. (2013) 4:2612. doi: 10.1038/ncomms3612
16. Aran D, Hu Z, Butte AJ. xCell: digitally portraying the tissue cellular heterogeneity landscape. Genome Biol. (2017) 18:220. doi: 10.1186/s13059-017-1349-1
17. Newman AM, Liu CL, Green MR, Gentles AJ, Feng W, Xu Y, et al. Robust enumeration of cell subsets from tissue expression profiles. Nat Methods. (2015) 12:453–7. doi: 10.1038/nmeth.3337
18. Langfelder P, Horvath S. WGCNA: an R package for weighted correlation network analysis. BMC Bioinformatics. (2008) 9:559. doi: 10.1186/1471-2105-9-559
19. Huang da W, Sherman BT, Lempicki RA. Bioinformatics enrichment tools: paths toward the comprehensive functional analysis of large gene lists. Nucleic Acids Res. (2009) 37:1–13. doi: 10.1093/nar/gkn923
20. Kanehisa M, Sato Y, Kawashima M, Furumichi M, Tanabe M. KEGG as a reference resource for gene and protein annotation. Nucleic Acids Res. (2016) 44:D457–62. doi: 10.1093/nar/gkv1070
21. Thorsson V, Gibbs DL, Brown SD, Wolf D, Bortone DS, Ou Yang TH, et al. The Immune Landscape of Cancer. Immunity. (2018) 48:812–30.e814. doi: 10.1016/j.immuni.2018.03.023
22. Love MI, Huber W, Anders S. Moderated estimation of fold change and dispersion for RNA-seq data with DESeq2. Genome Biol. (2014) 15:550. doi: 10.1186/s13059-014-0550-8
23. Barrett T, Troup DB, Wilhite SE, Ledoux P, Rudnev D, Evangelista C, et al. NCBI GEO: mining tens of millions of expression profiles–database and tools update. Nucleic Acids Res. (2007) 35:D760–765. doi: 10.1093/nar/gkl887
24. Stuart T, Butler A, Hoffman P, Hafemeister C, Papalexi E, Mauck WM 3rd, et al. Comprehensive integration of single-cell data. Cell. (2019) 177:1888–902.e1821. doi: 10.1016/j.cell.2019.05.031
25. Aibar S, Gonzalez-Blas CB, Moerman T, Huynh-Thu VA, Imrichova H, Hulselmans G, et al. SCENIC: single-cell regulatory network inference and clustering. Nat Methods. (2017) 14:1083–6. doi: 10.1038/nmeth.4463
26. Qiu X, Mao Q, Tang Y, Wang L, Chawla R, Pliner HA, et al. Reversed graph embedding resolves complex single-cell trajectories. Nat Methods. (2017) 14:979–82. doi: 10.1038/nmeth.4402
27. Huang LE. Friend or foe-IDH1 mutations in glioma 10 years on. Carcinogenesis. (2019) 40:1299–307. doi: 10.1093/carcin/bgz134
28. Ren X, Cui X, Lin S, Wang J, Jiang Z, Sui D, et al. Co-deletion of chromosome 1p/19q and IDH1/2 mutation in glioma subsets of brain tumors in Chinese patients. PLoS ONE. (2012) 7:e32764. doi: 10.1371/journal.pone.0032764
29. Zhao J, Ma W, Zhao H. Loss of heterozygosity 1p/19q and survival in glioma: a meta-analysis. Neuro Oncol. (2014) 16:103–12. doi: 10.1093/neuonc/not145
30. Toms SA, Kim CY, Nicholas G, Ram Z. Increased compliance with tumor treating fields therapy is prognostic for improved survival in the treatment of glioblastoma: a subgroup analysis of the EF-14 phase III trial. J Neurooncol. (2019) 141:467–73. doi: 10.1007/s11060-018-03057-z
31. Filbin MG, Tirosh I, Hovestadt V, Shaw ML, Escalante LE, Mathewson ND, et al. Developmental and oncogenic programs in H3K27M gliomas dissected by single-cell RNA-seq. Science. (2018) 360:331–5. doi: 10.1126/science.aao4750
32. Neftel C, Laffy J, Filbin MG, Hara T, Shore ME, Rahme GJ, et al. An integrative model of cellular states, plasticity, and genetics for glioblastoma. Cell. (2019) 178:835–49.e821. doi: 10.1016/j.cell.2019.06.024
33. Wang Q, Hu B, Hu X, Kim H, Squatrito M, Scarpace L, et al. Tumor evolution of glioma-intrinsic gene expression subtypes associates with immunological changes in the microenvironment. Cancer Cell. (2018) 33:152. doi: 10.1016/j.ccell.2017.12.012
34. Ceccarelli M, Barthel FP, Malta TM, Sabedot TS, Salama SR, Murray BA, et al. Molecular profiling reveals biologically discrete subsets and pathways of progression in diffuse glioma. Cell. (2016) 164:550–63. doi: 10.1016/j.cell.2015.12.028
35. Ye J, Yang Y, Jin J, Ji M, Gao Y, Feng Y, et al. Targeted delivery of chlorogenic acid by mannosylated liposomes to effectively promote the polarization of TAMs for the treatment of glioblastoma. Bioact Mater. (2020) 5:694–708. doi: 10.1016/j.bioactmat.2020.05.001
36. Mooney KL, Choy W, Sidhu S, Pelargos P, Bui TT, Voth B, et al. The role of CD44 in glioblastoma multiforme. J Clin Neurosci. (2016) 34:1–5. doi: 10.1016/j.jocn.2016.05.012
37. Chen D, Li D, Xu XB, Qiu S, Luo S, Qiu E, et al. Galangin inhibits epithelial-mesenchymal transition and angiogenesis by downregulating CD44 in glioma. J Cancer. (2019) 10:4499–508. doi: 10.7150/jca.31487
38. Locatelli M, Ferrero S, Martinelli Boneschi F, Boiocchi L, Zavanone M, Maria Gaini S, et al. The long pentraxin PTX3 as a correlate of cancer-related inflammation and prognosis of malignancy in gliomas. J Neuroimmunol. (2013) 260:99–106. doi: 10.1016/j.jneuroim.2013.04.009
39. Yang P, Wang K, Zhang C, Wang Z, Liu Q, Wang J, et al. Novel roles of VAT1 expression in the immunosuppressive action of diffuse gliomas. Cancer Immunol Immunother. (2021) 70:2589–600. doi: 10.1007/s00262-021-02865-z
40. Wang J, Li X, Wu H, Wang H, Yao L, Deng Z, et al. EMP1 regulates cell proliferation, migration, and stemness in gliomas through PI3K-AKT signaling and CD44. J Cell Biochem. (2019) 120:17142–50. doi: 10.1002/jcb.28974
41. Xuan ZB, Wang YJ, Xie J. ANO6 promotes cell proliferation and invasion in glioma through regulating the ERK signaling pathway. Onco Targets Ther. (2019) 12:6721–31. doi: 10.2147/OTT.S211725
42. Yu S, Yu X, Sun L, Zheng Y, Chen L, Xu H, et al. GBP2 enhances glioblastoma invasion through Stat3/fibronectin pathway. Oncogene. (2020) 39:5042–55. doi: 10.1038/s41388-020-1348-7
43. Chen L, Lin L, Xian N, Zheng Z. Annexin A2 regulates glioma cell proliferation through the STAT3cyclin D1 pathway. Oncol Rep. (2019) 42:399–413. doi: 10.3892/or.2019.7155
44. Che Mat MF, Mohamad Hanif EA, Abdul Murad NA, Ibrahim K, Harun R, Jamal R. Silencing of ZFP36L2 increases sensitivity to temozolomide through G2/M cell cycle arrest and BAX mediated apoptosis in GBM cells. Mol Biol Rep. (2021) 48:1493–503. doi: 10.1007/s11033-021-06144-z
45. Cheng Y, Dai C, Zhang J. SIRT3-SOD2-ROS pathway is involved in linalool-induced glioma cell apoptotic death. Acta Biochim Pol. (2017) 64:343–50. doi: 10.18388/abp.2016_1438
46. Krishnamachary B, Penet MF, Nimmagadda S, Mironchik Y, Raman V, Solaiyappan M, et al. Hypoxia regulates CD44 and its variant isoforms through HIF-1alpha in triple negative breast cancer. PLoS ONE. (2012) 7:e44078. doi: 10.1371/journal.pone.0044078
47. Yuan J, Levitin HM, Frattini V, Bush EC, Boyett DM, Samanamud J, et al. Single-cell transcriptome analysis of lineage diversity in high-grade glioma. Genome Med. (2018) 10:57. doi: 10.1186/s13073-018-0567-9
48. Wang S, Hou P, Pan W, He W, He DC, Wang H, et al. DDIT3 targets innate immunity via the DDIT3-OTUD1-MAVS pathway to promote bovine viral diarrhea virus replication. J Virol. (2021) 95:e02351–20. doi: 10.1128/JVI.02351-20
49. Manandhar S, Lee YM. Emerging role of RUNX3 in the regulation of tumor microenvironment. BMB Rep. (2018) 51:174–81. doi: 10.5483/BMBRep.2018.51.4.033
50. Akhavan D, Alizadeh D, Wang D, Weist MR, Shepphird JK, Brown CE. CAR T cells for brain tumors: Lessons learned and road ahead. Immunol Rev. (2019) 290:60–84. doi: 10.1111/imr.12773
51. Cloughesy TF, Mochizuki AY, Orpilla JR, Hugo W, Lee AH, Davidson TB, et al. Neoadjuvant anti-PD-1 immunotherapy promotes a survival benefit with intratumoral and systemic immune responses in recurrent glioblastoma. Nat Med. (2019) 25:477–86. doi: 10.1038/s41591-018-0337-7
52. Wu G, Song X, Liu J, Li S, Gao W, Qiu M, et al. Expression of CD44 and the survival in glioma: a meta-analysis. Biosci Rep. (2020) 40:BSR20200520. doi: 10.1042/BSR20200520
53. Si D, Yin F, Peng J, Zhang G. High Expression of CD44 Predicts a Poor Prognosis in Glioblastomas. Cancer Manag Res. (2020) 12:769–75. doi: 10.2147/CMAR.S233423
54. Myers KV, Pienta KJ, Amend SR. Cancer Cells and M2 Macrophages: Cooperative Invasive Ecosystem Engineers. Cancer Control. (2020) 27:1073274820911058. doi: 10.1177/1073274820911058
55. Johansson E, Grassi ES, Pantazopoulou V, Tong B, Lindgren D, Berg TJ, et al. CD44 Interacts with HIF-2alpha to Modulate the Hypoxic Phenotype of Perinecrotic and Perivascular Glioma Cells. Cell Rep. (2017) 20:1641–53. doi: 10.1016/j.celrep.2017.07.049
56. Zhang C, Wang H, Wang X, Zhao C, Wang H. CD44, a marker of cancer stem cells, is positively correlated with PD-L1 expression and immune cells infiltration in lung adenocarcinoma. Cancer Cell Int. (2020) 20:583. doi: 10.1186/s12935-020-01671-4
57. Dzobo K, Sinkala M. Cancer Stem Cell Marker CD44 Plays Multiple Key Roles in Human Cancers: Immune Suppression/Evasion, Drug Resistance, Epithelial-Mesenchymal Transition, and Metastasis. OMICS. (2021) 25:313–32. doi: 10.1089/omi.2021.0025
58. Li G, Wang Z, Zhang C, Liu X, Cai J, Wang Z, et al. Molecular and clinical characterization of TIM-3 in glioma through 1,024 samples. Oncoimmunology. (2017) 6:e1328339. doi: 10.1080/2162402X.2017.1328339
59. Liang T, Wang X, Wang F, Feng E, You G. Galectin-9: A Predictive Biomarker Negatively Regulating Immune Response in Glioma Patients. World Neurosurg. (2019) 132:e455–62. doi: 10.1016/j.wneu.2019.08.117
60. Werner JM, Kuhl S, Ulrich K, Krischek B, Stavrinou P, Goldbrunner R, et al. Expression of CD40 Correlates Negatively with Overall and Progression-Free Survival of Low- and High-Grade Gliomas. World Neurosurg. (2019) 130:e17–25. doi: 10.1016/j.wneu.2019.05.112
61. Long S, Li M, Liu J, Yang Y, Li G. Identification of immunologic subtype and prognosis of GBM based on TNFSF14 and immune checkpoint gene expression profiling. Aging. (2020) 12:7112–28. doi: 10.18632/aging.103065
62. Kong T, Ahn R, Yang K, Zhu X, Fu Z, Morin G, et al. CD44 Promotes PD-L1 Expression and Its Tumor-Intrinsic Function in Breast and Lung Cancers. Cancer Res. (2020) 80:444–57. doi: 10.1158/0008-5472.CAN-19-1108
63. Lee Y, Shin JH, Longmire M, Wang H, Kohrt HE, Chang HY, et al. CD44+ Cells in head and neck squamous cell carcinoma suppress T-cell-mediated immunity by selective constitutive and inducible expression of PD-L1. Clin Cancer Res. (2016) 22:3571–81. doi: 10.1158/1078-0432.CCR-15-2665
64. Masugi Y, Nishihara R, Yang J, Mima K, da Silva A, Shi Y, et al. Tumour CD274 (PD-L1) expression and T cells in colorectal cancer. Gut. (2017) 66:1463–73. doi: 10.1136/gutjnl-2016-311421
65. Stephen TL, Payne KK, Chaurio RA, Allegrezza MJ, Zhu H, Perez-Sanz J, et al. SATB1 Expression Governs Epigenetic Repression of PD-1 in Tumor-Reactive T Cells. Immunity. (2017) 46:51–64. doi: 10.1016/j.immuni.2016.12.015
66. Wu C, Thalhamer T, Franca RF, Xiao S, Wang C, Hotta C, et al. Galectin-9-CD44 interaction enhances stability and function of adaptive regulatory T cells. Immunity. (2014) 41:270–82. doi: 10.1016/j.immuni.2014.06.011
67. Bollyky PL, Falk BA, Long SA, Preisinger A, Braun KR, Wu RP, et al. CD44 costimulation promotes FoxP3+ regulatory T cell persistence and function via production of IL-2, IL-10, and TGF-beta. J Immunol. (2009) 183:2232–41. doi: 10.4049/jimmunol.0900191
68. Trejdosiewicz LK, Morton R, Yang Y, Banks RE, Selby PJ, Southgate J. Interleukins 4 and 13 upregulate expression of cd44 in human colonic epithelial cell lines. Cytokine. (1998) 10:756–65. doi: 10.1006/cyto.1998.0361
69. Ibrahim EM, Stewart RL, Corke K, Blackett AD, Tidy JA, Wells M. Upregulation of CD44 expression by interleukins 1, 4, and 13, transforming growth factor-beta1, estrogen, and progestogen in human cervical adenocarcinoma cell lines. Int J Gynecol Cancer. (2006) 16:1631–42. doi: 10.1111/j.1525-1438.2006.00637.x
Keywords: CD44, glioma, M2, tumor-associated macrophage, spatial, single cell, immunosuppression
Citation: Xiao Y, Yang K, Wang Z, Zhao M, Deng Y, Ji W, Zou Y, Qian C, Liu Y, Xiao H and Liu H (2022) CD44-Mediated Poor Prognosis in Glioma Is Associated With M2-Polarization of Tumor-Associated Macrophages and Immunosuppression. Front. Surg. 8:775194. doi: 10.3389/fsurg.2021.775194
Received: 13 September 2021; Accepted: 29 December 2021;
Published: 03 February 2022.
Edited by:
Xingen Zhu, Second Affiliated Hospital of Nanchang University, ChinaReviewed by:
Binghao Zhao, Peking Union Medical College Hospital (CAMS), ChinaYumin Wang, Central South University, China
Copyright © 2022 Xiao, Yang, Wang, Zhao, Deng, Ji, Zou, Qian, Liu, Xiao and Liu. This is an open-access article distributed under the terms of the Creative Commons Attribution License (CC BY). The use, distribution or reproduction in other forums is permitted, provided the original author(s) and the copyright owner(s) are credited and that the original publication in this journal is cited, in accordance with accepted academic practice. No use, distribution or reproduction is permitted which does not comply with these terms.
*Correspondence: Hong Xiao, eGhua3l5MTIzQDE2My5jb20=; Hongyi Liu, bmpua3l5bGh5QDE2My5jb20=
†These authors have contributed equally to this work