 Valentin Prioul
 Jean Slawinski
 Steeve Guersent2
 Philippe Lopes
 Pierre-Marie Leprêtre
95% of researchers rate our articles as excellent or good
Learn more about the work of our research integrity team to safeguard the quality of each article we publish.
Find out more
ORIGINAL RESEARCH article
Front. Sports Act. Living , 07 April 2025
Sec. Elite Sports and Performance Enhancement
Volume 7 - 2025 | https://doi.org/10.3389/fspor.2025.1554055
This article is part of the Research Topic Environmental Determinants of Athletes’ Development and Performance View all 3 articles
Background: Time to perform 40-yard dash (40-yd) is a performance criterion in American football. Sprinting ability is strongly correlated with maximal values of horizontal power (PHmax), Force (FH0) and Velocity (VH0). While numerous methods for developing sprint speed exist, few studies have focused on the effects of periodizations on the sprinting mechanical variables in young talented American football players.
Objective: this study aimed to compare the effects of block (BP) and undulating (UP) training periodization modalities on 40-yard dash performance.
Method: 27 players from the Young French League of American football (17.1 ± 0.9 y, 179.9 ± 5.5 cm, 81.1 ± 14.9 kg) were randomly assigned in either the BP (n = 15) or UP (n = 12) group. Anthropometric characteristics, 40-yd performance, maximal velocity (Vmax), PHmax, FH0 and VH0 were assessed before and after 10-wk intervention period.
Results: Training resulted in the 40-yd performance increase of 3.72% (p < 0.001) and significant changes in Vmax (+ = 6.13 ± 5.62%, p < 0.001) and VH0 values (+2.68 ± 4.14%, p = 0.004). BP intervention leaded higher improvements in time to perform 40-yd (4.45 ± 2.06 vs. 3.02 ± 1.93%, p < 0.001) and Vmax (7.30 ± 6.63% vs. 4.54 ± 4.10%, p = 0.002,) compared to UP. No periodization effect was found in changes of VH0 (BP: 3.42 ± 4.31% vs. UP: 1.48 ± 3.88, p = 0.214).
Conclusion: Our results showed that BP and UP were effective to increase sprint performance. Despite a similar training load, the block periodization of training had better effects on 40-yd performance compared to undulating training periodization in this population of talented young American football players.
American Football (AF) is characterized by the repetition of brief, highly intense actions. On average, play lasts 5.23 s and is interspersed with a recovery period of no more than 40 s, under penalty of the offensive squad (EO) (1). During the phases of play, players repeat numerous brutal accelerations and decelerations, enabling them to reach high speed values during sprints with (COD) or without (LD) change of direction (2). Two groups of authors have shown a relationship between sprint performance and the division in which the player played. Thus, the fastest athletes are those who play at the highest level (3, 4). An athlete's ability to accelerate forward has been linked to the capacity to produce and apply a high level of power to the ground in a horizontal direction, as well as a high level of external force at different speeds during sprinting. This ability is described by a linear relationship between force and speed (F-V) and a second-degree polynomial relationship linking power to speed (P-V). The relationships linking force and power to speed describe the change in maximum horizontal external force and power production as the speed of movement increases. These same relationships exist across mono and polyarticular movements. They provide an objective quantification of force/power production capabilities through the maximum power an athlete can develop in a horizontal direction (PHmax), the theoretical maximum horizontal force an athlete can produce on the ground (FH0) and the theoretical maximum speed up to which the athlete is still capable of producing positive horizontal force (VH0) (5). The values of FH0 and VH0 are independent and associated with different physical and technical skills related to the production of a high level of horizontal force at low (FH0) and high (VH0) running speeds. These different mechanical variables are the result of a complex integration of different physiological, neural and biomechanical processes involving total external force production and characterize the different performance abilities of athletes (6, 7). Studies show that sprint performance variables, which are characterized by maximum speed (m.s−1), average speed (m.s−1) and distance covered over four seconds (m), are related to the efficiency of horizontal force application on the ground more than total force (8). These performance variables are strongly correlated with PHmax, VH0 but not FH0 (8). Morin et al. (8) report that world-class sprinters have an F-V relationship more oriented towards VH0 than FH0. These results confirm the influence of maximum speed (Vmax) and athletes' ability to produce horizontal force on the ground at high speed on sprint performance (9). Through the templates present at the American football, the integration of body mass (BM) into the mechanical variables of horizontal force and power (FH0rel and PHmaxrel) increases the magnitude of differences between positions and/or categories (10). Together the previous findings suggested that players performing at the highest level are the fastest sprinters, and this performance has been correlated with VH0 and Pmax (8, 9).
F-V profiles have been used in previous research as input for individualised training programs, as they help identifying an athlete's strengths and weaknesses. The results from the study of Devismes et al. (11) confirm the general hypothesis that sprinting skills increase with performance. As hypothesised, these authors (11) showed that F0, V0, Pmax increase with the performance level in team sports. Periodization follows training planning and programming, with the aim of improving athletes’ sporting performance. Numerous authors have demonstrated the effectiveness of implementing training periodization for the development of strength, muscular power and improved sports performance (12–16). Handling variations in training loads (TL) and training cycles depend on the periodization implemented. There are several types of periodization in the literature, but we're only interested in the undulating (UP) and block (BP) models. The undulating model will lead to variations in performance by aiming to develop several physical qualities on a daily and/or weekly basis (17) whereas the block model will develop a physical quality over a period of two to four weeks (17). Some authors have sought to demonstrate the effectiveness of one periodization over the other in improving athletes' sports performance, but have failed to distinguish significantly which was preferable (14, 18–20). However, Painter et al. (19) would be in favour of BP, for a population of NCAA IA sprinters while two groups of authors (18, 20) tend towards a UP for a population with little or moderate experience. It is therefore difficult to make a choice based on the scientific literature, since the variables that make up the mesocycle and the muscle-strengthening program may be different (18).
Through knowledge of the mechanical variables associated with sprint performance, authors have highlighted the improvement in players’ ability to apply maximum horizontal force (FH0), PHmax and speed variables (i.e., Vmax and VH0) following weighted sprint training (21–24). Consequently, this type of training would improve sprint performance over 30 m and intermediate times (22, 24, 25). The loads used for weighted sprints can be informed by a percentage of the body mass (22, 24) or by a percentage of the speed variables (i.e., Vmax or VH0) (21, 23, 26). Improvement in the speed-oriented variables of the F-v profile (i.e., PHmax, VH0 and Vmax) would move towards assisted (supra-maximal) or Vmax sprints. Assisted sprint training sessions have been shown to increase average speed over the first fifteen yards in female college footballers (27). However, some authors show that training with unresisted or assisted sprints failed to improve mechanical variables training (21–24). Training methods for strength training are diverse and varied according to athletes’ goals, but intensities are generally prescribed by a percentage of 1-RM (%1-RM) (28). The use of a %1-RM may have some limitations, such as an inaccurate training load prescription (29). Indeed, athletes’ 1-RM is not fixed in time and can fluctuate according to various factors such as sleep, diet and fatigue caused by training. To overcome these limitations, some authors have turned to velocity-based training (VBT) to prescribe a load, number of sets and repetitions based on the speed of movement of an object (29–31). A linear relationship exists between speed and %1-RM, which can be used to prescribe exercise intensity. Moreover, with the accumulation of fatigue, speed decreases until it reaches the 1-RM speed, which can be used to avoid failure during the series and thus excessive fatigue (29–31). After learning about the factors associated with American football performance, this study was based on the development of physical qualities. For this reason, the objective was to compare the effects of two training periodization modalities on 40-yard dash performance. We hypothesized a beneficial effect of training on sprint performance, but did not know which periodization was more effective.
Thirty-three American football players were selected to participate in the study. All of them joined the sports excellence program based on their results from the previous regular season and their success in the Combine test (32). Six players were excluded due to injury or participation below 80% of the training sessions. The distribution of final twenty-seven participants (17.1 ± 0.9 y, 179.9 ± 5.5 cm, 81.1 ± 14.9 kg, BMI: 25.1 ± 4.0 kg.m−2) and their anthropometric characteristics are presented in Table 1. This study was authorized by the Comité d'Ethique pour la Recherche en Sciences et Techniques des Activités Physiques et Sportives (CERSTAPS) and registered under IRB00012476-2022-16-02-154.
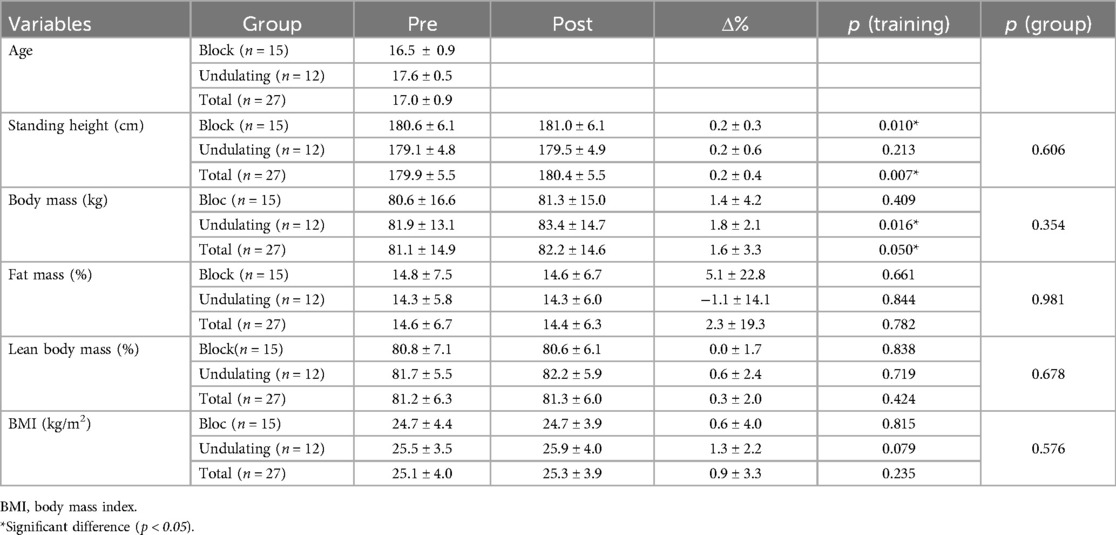
Table 1. Changes in anthropometric characteristics during the training period.
Following a six-week program of strength training in the form of circuit training and a four-week cycle of muscle hypertrophy using the cluster set method (76) all players completed evaluation tests. These tests were carried out over two non-consecutive days, separated by 48 h during which the players took part in low-intensity technical-tactical training sessions lasting less than two hours. For all tests, two trials were performed and only the best performance was retained (4). The same assessments were repeated at the end of the ten-week training period. All tests were supervised by the same operator.
On the first day of evaluation, each athlete's standing height (SH) was measured using a portable height gauge (Leicester Tanita H001, Tanita corporation, Tokyo, Japan), and body mass (BM) and percentage fat mass (%) values using a professional impedance scale (Tanita DC360S, Tanita corporation, Tokyo, Japan). After a standardized warm-up, players performed a vertical rebound with free-arm countermovement (CMJ) (Optojump Next, Microgate, Bolzano, Italy) (33). Subsequently, the players performed a straight-line sprint of 40-yards or 36.6 m (i.e., 40-yd) on an uncovered synthetic pitch. Split times at 9.1 m, 18.3 m and 36.6 m were recorded using photocells (Witty System, Microgate, Bolzano, Italy). Position data were recorded as a function of time by a radar (Stalker ATS Pro II, Applied Concepts, TX, USA). This device was positioned 3 m directly behind the starting line and at a vertical height of 1 m to be approximately aligned with the athlete's center of mass (34). The variables of FH0, VH0 and PHmax were obtained through a method using speed data during straight-line sprinting (6). The speed curve over sprint time (VH[t]) was fitted by a mono-exponential function using least-squares regression:
with τ the acceleration time constant. The horizontal acceleration of the center of mass can be expressed as a function of time, after deriving the velocity over time:
The horizontal force (FH) was then modelled over time:
with Fair as the aerodynamic friction force encountered during sprinting, which is calculated from the sprint speed and the estimated frontal body surface and a friction coefficient. Using the horizontal force and sprint speed values, we were able to determine an individual force-velocity relationship using least-squares linear regression. This relationship was then used to identify FH0 and VH0 as the x- and y-axis intercept. Maximum horizontal power was determined as:
The relative variables (FH0rel, PHmaxrel) were determined by dividing the absolute value by the player's body mass. Samozino and al. (7) showed that sprint performance primarily depends on PHmax in football, rugby, basketball, and track and field. Depending on the distances to be covered, we can observe a dominance of force or velocity in the profiles. Additionally, Cahill and al. (21) used FH0 and PHmax as outcome measures in high school rugby and lacrosse players.
After a standardized 10-min warm-up including 5-min of mobility exercises (shoulders, hip and ankle) followed by a specific warm-up exercise for the lower limbs as unloaded lunge, hip thrust or squat, the players performed box squat (BX) movements in the presence of spotter, using an Olympic weightlifting bar equipped with an inertial measurement unit (Vmaxpro®, EnodePro; Blaumann & Meyer—Sports Technology, UG, Magdeburg, Germany) (35). Briefly, athletes had to control the speed of movement during the descent phase and then hold the low position in contact with the box for around two seconds. At the instructor's signal, the player had to perform the ascent phase as quickly as possible. The initial load to be lifted was 20.0 kg for all participants. This was gradually increased by 20.0 kg until the mean propulsion velocity (MPV) fell below 1.00 m.s−1. From this speed, the load was incremented by 10.0 kg until the MPV dropped to 0.50 m.s−1, then by 2.5–5.0 kg until the series was stopped. Three attempts were made for each load with an MPV value greater than 1.00 m.s−1, two for loads inducing an MPV value between 0.65 and 1.00 m.s−1, and only one repetition for loads at which the MPV value fell below 0.65 m.s−1. Recovery time between each set was 4 min. Only the best repetition for each load was counted (best MPV) (36, 37). Bar displacement data were recorded at a frequency of 1,000 Hz and transmitted via a Bluetooth connection (65 Hz) to a tablet (38, 39). For each repetition, load, mean power (MP) and MPV values were collected in a spreadsheet (Microsoft® Excel version 16.16.27, Microsoft Corporation, Redmond, USA) according previous recommendations (36, 37). The force variable (F, expressed in N) was calculated as follows:
where MP is the average power, expressed in watts (w) and MPV, the average propulsion speed expressed in m.s−1.
The variable MP was calculated according to the equation proposed by Olovsson Ståhl and Öhrner (39):
where g corresponds to the acceleration of gravity, i.e., 9.81 m.s−1, represents time in seconds and m, the mass of the load moved, expressed in kg.
Linear regression using the value of R2 to determine the percentage of variance was used when analyzing the load-velocity (L-V) and force-velocity-power (FVP) profiles of the box squat. If the R2 is close to 1, this means that the points are aligned on the right. Using the equation of a linear line, where a corresponds to the value of the theoretical maximum vertical velocity (Vv0) and b to the value of the theoretical maximum vertical force (Fv0), we were able to determine the maximum vertical power (PVmax) which corresponds to the peak of the power-velocity relationship. The value of PVmax was calculated as follows:
The players were assigned to a training group (BP or UP) after randomization based on their 40-yard time. Then they completed a ten-week cycle of muscular power development using undulating or block programming according to the methodology of Painter et al. (19). Each week consisted of three sixty-minute strength training sessions, one sixty-minute sprint training session and three seventy-five- to one hundred and twenty-minute technical-tactical workouts. Table 2 shows the training schedule according to the development objective of the strength training sessions.

Table 2. Training schedule of team players according the undulating and block periodizations.
Of the three sessions, two were monitored using VBT, with bench press (DC) and BX as the main exercises. The other was dedicated to the shoulder press, following the recommendations of Hicks et al. (40), depending on the quality to be developed, and to individualized injury prevention exercises. Bench press and shoulder press data were not used in this study. To identify the loads associated with the physical quality to be developed during the sessions, we used C-v and power-velocity (P-V) profiles. Speed and percentage of 1-RM follow an almost perfect linear relationship, making it possible to identify the target speed at 85% 1-RM (31). The velocity associated with PVmax was used to identify the load through the C-V profile.
All sprint sessions were directed by a percentage of maximum velocity (%Vmax) obtained during the sprint F-v profile assessment (21). Each athlete had a 10 m throw time, calculated according to Vmax using the approach of Haugen et al. (41), which was recorded using photocells. All sprints were performed with a run-up phase before reaching the 10-m throw. Each session consisted of six sprints with a 4 min passive recovery. Only one specific sprint session per week was performed during the intervention.
For the development of strength quality, the BX sessions were carried out using the MPV associated with 85% of the athlete's 1-RM. During the warm-up phase, if the athlete was 5% above the target speed, we increased the workload from 2.5 to 5.0 kg, and vice versa if the speed was reduced by 5%. When the athlete, in his series, reduced his work MPV by 15%, he had to stop and take three minutes of recovery. To end the BX exercise, the athlete had to either have the first repetition of his set at a MPV below 15% (i.e., 85% 1-RM) (42) or perform twenty-five repetitions in total (43). Strengthening exercises on the lower and upper limbs were performed following the BX by completing three sets of ten repetitions. For the sprints, the players had to perform six sled pushes over 10 m, with a 2.5 m run-up, in a time equivalent to 25% of Vmax (21). This meant that an athlete with a Vmax of 9.00 m.s−1 had to have a 10-m throw time of 4.44 s. A load on the carriage thrust was added corresponding to the desired split time. To ensure that the athlete remained within the range of maximum strength development, the split time was not to exceed 30% of Vmax.
To develop the quality of speed, the BX was performed with an unloaded Olympic bar (i.e., 20.0 kg). The athlete's aim was to produce as much speed as possible during the concentric phase, by performing a jump to complete the extension. Due to the reduced fatigue caused by the absence of load, the athlete was stopped when the best MPV of the series decreased by 5%. The number of sets was set at four, with a passive recovery period of two minutes. Complementary assisted exercises (3 sets of 5 repetitions) were performed after the BX. For the development of sprint Vmax, a distance of 35-m was chosen by the recommendations of Rumpf et al. (44) and to approximate field conditions. A capture of the split time between the 25-m and 35-m was recorded and corresponded to 95%–100% of the athletes’ Vmax. Sessions were characterized by six unresisted repetitions with four to five minutes of recovery.
For maximum power development, BX was performed using an individual load to develop the PVmax calculated during the FVP profile assessment. The number of repetitions per set was set at a decrease of 15% of the day's PVmax, with a passive recovery of 3 min between each set. The first two BX sessions consisted of four sets, followed by the last two with five sets. Following BX, plyometric exercises were performed in a horizontal and vertical plane over three sets of five repetitions with two minutes of passive recovery (40, 42). For the development of PHmax in sprinting, the load put on the sled corresponded to an optimal load (Lopt) on the recommendations of Cross et al. (26). To find out this load, we used 50% of the VH0 which gave us a speed and therefore a split time on the 10-m throw. The split time had to be no more than 55% or less than 45% of VH0. With this load the players performed six 10-m throw sprints, with 10-m run-up, followed by a four-minute passive recovery. The resistance load ranged from 30.0 to 162.5 kg for a mean relative load values of 1.5 ± 0.2 and 0.5 ± 0.1 kg.body mass−1 at 75% and 45% of Vmax, respectively.
The number of training sessions of each quality was the same for both periodizations, as were the instructions for performing the main and complementary exercises. The warm-up before a sprint or strength training session was identical for both groups. Both periodizations consisted of two five-week mesocycles, with a two-week relief period in between.
For BP, the first mesocycle focused on maximum strength development for three weeks, characterized by loads ≥ 85% 1-RM in weight training and a 75% decrease in Vmax in sprinting, followed by two weeks of maximum power development, characterized by Lopt during sprinting and weight training sessions. The second mesocycle aimed to develop maximum power and speed, characterized by two weeks at Lopt and three weeks at light load and non-weighted sprint. For UP, the intensity of BX and sprint training varied from week to week. The first mesocycle consisted of two strength and three power sessions in the weight room, and two strength, one power and two speed sessions in sprinting. The second mesocycle included one strength, one power and three speed sessions in the weight room and one strength, three power and one speed session in the sprint.
Training load (TL) was calculated by taking into account the number of sets, repetitions and intensity of the session (as a percentage of Vmax) and, for sprinting, the distance covered in metres was added (45). After each session, players were asked to give their feedback on the intensity (RPE) of the session, following the recommendations of Foster et al. (46). This intensity was then multiplied by the duration of the session to calculate the sRPE.
All data were analyzed using JASP statistical software (version 0.17.2.1, JASP team, University of Amsterdam, Amsterdam, The Netherlands). Quantitative variables are presented as mean ± standard deviation. The distribution of the data was checked using the Shapiro–Wilk test, and the equality of variances of the data by the Levene test. The Student's t-test for independent samples was used to compare the percentage changes in 40-yd time and variables associated with sprint performance between the two training groups (block vs. undulating), and the Student's t-test for paired samples to observe the effect of the two periodizations on these same variables. Where necessary, the Mann–Whitney and Wilcoxon tests were used. The significance level was set at 5% (p < 0.05). A Spearman correlation was used to identify a correlation between variations in BM and sprint times (i.e., 40-yd; 20-yd; 10-yd). The use of G*Power software (version 3.1.9.6, University of Kiel, Germany) enabled us to estimate a necessary theoretical number of 21 players per group, i.e., a total population of 42 athletes. This estimate was based on the percentage variation in speed over 40-yd observed by Gavanda et al. (14), i.e., a calculated size effect (SE) value equal to 0.8, and on the application of a significance threshold set at 5% (p = 0.05) for statistical power of 80% (47). To minimize the bias associated with the difference between the number of subjects theoretically required and the actual number of participants, the ES value was calculated a posteriori. The ES was qualified as trivial if its numerical value was less than 0.2, low if between 0.2 and 0.49, medium if between 0.5 and 0.79 or large if greater than 0.8.
The results of the anthropometric characteristics were presented in Table 1. No significant differences were observed for measurements taken at the beginning of the intervention. There was a time effect on SH and BM values. No significant differences were found between groups. The Student's or Wilcoxon test showed a significant difference on SH and moderate ES following the intervention for the whole sample (p = 0.007; ES = −0.54) and BP (p = 0.01; ES = −0.77). A significant increase in BM was found for the population as a whole (p = 0.05, ES = −0.40) and for athletes in the UP group (p = 0.016, ES = −0.77). All other anthropometric characteristics remained significantly unchanged, and ES was considered low to trivial except for BMI in the UP group (p = 0.079, ES = −0.56). No correlation was found between variations in BM or lean body mass and time to 40-yd. All measurements of sprint parameters for both training modalities were reported in Table 3. No significant differences were observed in the measurements taken at the start of the intervention. Figure 1 showed a significant improvement of 3.72% at 40-yd (p < 0.01, ES = 1.77). This improvement on the 40-yd was more marked for athletes in the BP group (4.45 ± 2.06, p < 0.001, ES = 2.09) compared with those in the UP group (3.02 ± 1.93%, p < 0.001, ES = 1.54). A 3.08% increase in time to perform 10-yd (ES = 0.69, p = 0.001) was also noted. Our results show an effect of periodization on time variations at 10-yd, with a significant improvement of 4.71 ± 4.11% (ES = 1.10) for athletes in the BP group vs. a non-significant gain of 1.26 ± 4.69% (ES = 0.28) for players in the UP group. The players of the BP group significantly improved their 20-yd time by 1.48 ± 2.53% (3.13 ± 0.25 vs. 3.08 ± 0.28s, p = 0.039, ES = 0.59) whereas a 0.35 ± 2.63% drop in performance was found in players of the UP group, for whom the time to 20-yd went from 3.00 ± 0.19 to 3.01 ± 0.20s (p = 0.670, ES = −0.13).
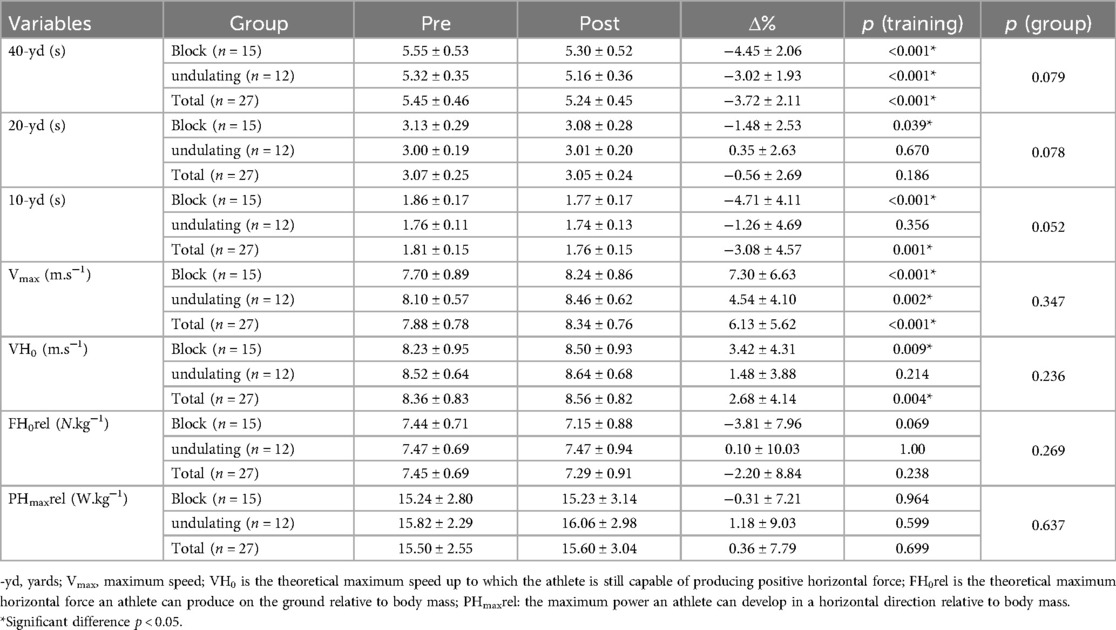
Table 3. Effect of training modality on sprint parameters.
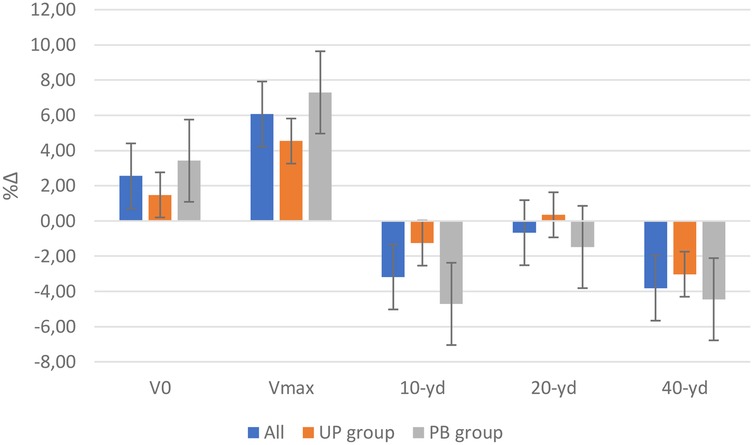
Figure 1. Effects of training programs on sprint performance. Legend: V0, Vmax are theoretical maximal velocity and maximal speed. 10-yd, 20-yd and 40-yd presented the covered sprint distance expressed in yards.
Our results showed a significant improvement in Vmax of 6.13 ± 5.62% (7.88 ± 0.78 vs. 8.34 ± 0.76 m.s−1, p < 0.001, ES = −1.21) and VH0 of 2.68 ± 4.14% (8.36 ± 0.83 vs. 8.56 ± 0.82 m.s−1, p = 0.004, ES = −0.61) without a group effect. A greater gain was noted for players in the BP group compared to those in the UP group for Vmax (7.30 ± 6.63 vs. 4.54 ± 4.10, p = 0.002, ES = 1.30). VH0 increased significantly only in the BP group (3.42 ± 4.31%, p = 0.009, ES = −0.78). Our results show a relationship between variation in time over 40-yd and variation in Vmax (r = −0.43, p = 0.025) and VH0 (r = −0.4, p = 0.039). No significant difference was observed on the mechanical variable of PHmaxrel (0.36 ± 7.79%, p = 0.699, ES = −0.08). No group effect was observed between the two training modalities (−0.31 ± 7.21 vs. 1.18 ± 9.03%, p = 0.964, ES = −0.15, for BP and UP, respectively). Our results show a decrease in FH0rel of 2.20 ± 8.84% (7.45 ± 0.69 vs. 7.29 ± 0.91 N.kg−1, p = 0.238, ES = 0.23). This reduction was visible in athletes in the PB group (−3.81 ± 7.96%, p = 0.069, ES = 0.54) but not in the UP group (0.10 ± 10.03%, p = 1.00, ES = 0.00).
The aim of this study was to compare the effects of two training periodization modalities (block vs. undulating periodizations) on 40-yard performance. Our main results show an improvement in time and Vmax at 40-yd with training and with no effect of the type of periodization. However, block periodization (BP) appears to exert more greater effects than undulating periodization (UP) on the progression of Vmax and 40-yd sprint time. A cross-training periodization effect is observed on times at 10-yd and 20-yd and on the value of VH0, but neither UP nor BP have a significant effect on FH0rel and PHmaxrel values. First, we will discuss anthropometric characteristics during the training period.
Our results show no significant difference between BM, fractions of lean body mass and fat mass values between our two groups before and after training. BM values increased during the training period. Our results are similar to those of Painter et al. (19), who also showed an increase in BM with no effect of training modality in highly trained athletes. In our study, the increase in BM is explained by a significant gain in BM for the UP group and not significant for the BP group. Gavanda et al. (14) have previously shown a stronger effect of training period on BM in athletes undergoing UP compared to their counterparts undergoing BP. This variation in BM observed by Gavanda et al. (14) was associated with a decrease in fat mass and an increase in lean body mass in their two groups of AF players. However, these changes were more marked in athletes in the UP group after the four four-week mesocycles of training (a total of sixteen weeks of training). The variations in fat mass and lean body mass observed by Gavanda et al. (14) could explain our results. Indeed, we observed that the increase in body mass was contemporaneous with a trend towards a decrease in fat mass and an increase in lean body mass (+2.1 vs. + 0.4 kg) more marked in our athletes in the UP group than in the BP group. In our study, the improvement in BM in the UP group could also be explained by a training-induced change in bone mass. Indeed, Almstedt et al. (48) observed an increase in bone density from 2.2% to 7.0% following 24 weeks of undulatory strength training.
No correlation was found between variations in body mass or lean body mass and time over 40-yd. These results are in agreement with those of Abe et al. (49), who showed no relationship between lean body mass and 100-m performance. In our study, we observed a 3.72% improvement in 40-yd performance. This observation can be explained by a significant reduction in running time of −4.45% for the BP group (ES = 2.09) and −3.02% for the UP group (ES = 1.54). Previously Gavanda et al. (14) had shown a significant effect of the same types of training (BP and UP) on sprint performance, with a small effect size (ES = 0.2 and 0.32 for BP and UP, respectively). These differences in ES between the two studies may be explained by the use of a different training methodology. In the study of Gavanda et al. (14), athletes performed a non-specific training method, i.e., strength training without specific sprint work. In our study, both groups performed muscle-strengthening sessions combined with sprint work, with or without weights. It has been shown by Rumpf et al. (44) that the use of a specific training method improved sprint performance more than a more general method. Furthermore, the differences observed between our results and those of Gavanda et al. (14) could also be explained by different development objectives. Indeed, in their study, Gavanda et al. (14) focused on the development of muscular endurance, hypertrophy and muscular strength, whereas our protocol was based on the development of strength, power and maximum speed. These lines of development could also explain our observation of an improvement in time over 10-yd. Indeed, as shown by Lockie et al. (50), weighted sprinting or heavy-load strength training work induced better speed gains over 10-m in sprinting, i.e., around 10.9-yd.
However, our results show an effect of periodization on time variations at 10-yd, with a significant improvement of 4.71 ± 4.11% (ES = 1.10) for athletes in the BP group vs. a non-significant gain of 1.26 ± 4.69% (ES = 0.28) for players in the UP group. To our knowledge, no study has investigated the effects of periodization (BP vs. UP) on sprint performance over a distance of less than 20-m or 20-yd. Our results show an effect of periodization on time variations at 20-yd with training. Thus, athletes in the BP group significantly improved their 20-yd time by 1.48 ± 2.53% (3.13 ± 0.25 vs. 3.08 ± 0.28s, p = 0.039, ES = 0.59). Conversely, our results show a 0.35 ± 2.63% drop in performance for players in the UP group, for whom the time to 20-yd went from 3.00 ± 0.19 to 3.01 ± 0.20s (p = 0.670, ES = −0.13). These observations are similar to the results of the study by Sabido et al. (20) who reported a non-significant decrease in time to 20-m in nine adolescent handball players (15.3 ± 0.5 years old) after eight weeks of BP. This more pronounced trend towards a decrease in 20-m time was accompanied by a greater improvement in horizontal jump performance in the young players following BP compared with the UP group (20). Previously Brechue et al. (51) had shown a significant relationship between average speed over 20-yd and long jump performance (i.e., BJ). Two recent studies showed that BP had the best effects on strength in volleyball players (52) and in young hockey players (53). In our study, the variation in performance on sprint times would seem to indicate that BP would be more effective than UP in improving the acceleration capacity of young American football players. BP appears to be more effective than UP for sprint performance. In our study, improvements in 10-yd, 20-yd, and 40-yd sprint times were greater for BP than for UP. These findings are supported by Sabido et al., who observed a moderate effect size (ES = −0.51) improvement in the 20-m sprint time for BP but no significant effect. Additionally, both groups showed significant improvements in jump performance, though the gains were more pronounced for BP (9.7% vs. 4.0% for BP and UP, respectively). However, in the study by Gavanda et al. (14), 40-yd sprint performance significantly improved, but no difference was found between groups. The discrepancy between these studies may stem from differences in training programs. Sabido et al. implemented a program focused on neural development (power and explosive strength), whereas Gavanda et al. (14) designed their training around muscular development (endurance and hypertrophy). Together, the results of these previous studies suggest that responses to strength and sprint training are sensitive to periodization types. To better understand the difference between the BP and UP effects on sprint performance, we looked at the effects of periodization on the responses of mechanical variables to training.
Our results show a 6.13% improvement in maximum velocity (Vmax) values and a 2.68% improvement in theoretical maximum horizontal velocity (VH0) with training. This result is in agreement with the work of Slawinski et al. (9), who showed a relationship between improved sprint performance and changes in Vmax and VH0 values with training. As with the Vmax variable, changes in VH0 were more marked for players in the BP condition than their counterparts in the UP group, with a significant improvement in VH0 with training only for the BP group. The periodization effect could explain this observation. According to observations by Hicks et al. (40), sprint sessions with weighted sled improved times over 10-yd and 20-yd and the value of VH0, as well as Vmax. The improvement in Vmax would be due in part to a better index of technical application of ground force (DRF) following training sessions with weighted and assisted sprints (8, 54). According to Morin et al. (8), the value of Vmax is also correlated with those of VH0 and PHmaxrel. In our study, the ten weeks of training induced a non-significant gain in PHmaxrel of 0.36%. This was due to a 2.20% drop in FH0, which was not offset by the 2.68% increase in VH0. Indeed, according to equation 4, PHmaxrel is the product of VH0 and FH0 per unit body mass. Our results show an effect of periodization on variations in FH0. Indeed, athletes in the BP group showed a 3.81 ± 7.96% drop in FH0, while players in the UP group maintained their strength levels (+0.10 ± 10.03%). The observed effect of periodization on FH0 and PHmaxrel values could be explained by a different distribution of maximum strength development sessions between BP and UP. Gains in FH0rel have been reported in athletes following sixteen training sessions with weighted sled (24). Cahill et al. and Lathi et al. (21, 23) observed significant increases in strength following weighted sled sessions, whereas FH0rel values were maintained or decreased in athletes whose training was based on repetition of unresisted or assisted sprints (21, 23). In 23 young sprinters, Martínez-Valencia et al. (55) previously showed that use of a load up to 20% of body mass could provide a training stimulus in young sprinters to improve the peak value of the rate of force development (RFD) during the sprint start, and thus, early acceleration. The RFD values has been considered a factor that influences performance in explosive playing actions (56, 57). RFD determines the force that can be generated in the early phase of muscle contraction (55). Ishøi et al. (56) observed significant relationship RFD, FH0, Pmax and sprint time (0- to 5-m and 0- to 30-m). Many elite sprinters follow a combined program consisting of resistance training and sprint training to increase RFD values (58). Batra et al. (58) showed that BP training was effective in raising the physical capabilities directly transferable to sprinting. Comparative studies in American Football players and other strength athletes showed a greater adaptations after BP compared to UP (18). Nonetheless, players of BP group did not improve or maintain their FH0rel value. This finding could be explained by the distribution of the maximum speed development based on un-resisted sprint sessions. In previous studies, sprint evaluation was conducted at the end of the training period (21, 23). In our study, only three sessions were based on the development of FH0rel which were distributed differently according to training modalities. The periodization in our study for the BP group did not allow us to carry out assessments following the three heavy sled training sessions, but only nine weeks later (four weeks of power, three weeks of speed and two weeks of training relief). It has already been reported that un-resisted sprint training did not improve acceleration performance in untrained and trained subjects (59, 60). Thus, these many weeks without weighted sprints with heavy loads could perhaps explain the decrease in FH0rel value of BP group players.
On the other hand, while BP appears to be more effective in developing variable associated with sprinting performance, a minimum interval between sessions is necessary to optimize the effects of training. Hartmann et al. (18) previously reported that a minimum recovery period of 72 h was required to restore high levels of performance in American football players and others. Thus, the integration of strength training into in-season conditioning depends on the duration of the competition period, the frequency of contests, and the proportion of the conditioning program (18). In their meta-analyse, Hartmann et al. (18) suggested that two weekly strength sessions are optimal for maximizing training effects on mechanical variables and sprinting performance. Rønnestad et al. (61) also proposed a weekly training session targeting a non-prioritized physical quality to improve and maintenance over time strength and power qualities (62). The schedule in team sports is increasingly demanding, leaving little time to develop the physical qualities necessary for performance (63). For this reason, it is beneficial for strength and conditioning coaches to focus on BP during the off-season, as it has proven effective in improving key variables within a short periodization (61). To maintain these improvements, UP should be employed, taking into account the frequency of competitions during the week, which can be quite frequent in some sports (64).
Explosive playing actions (i.e., accelerations, sprinting, rapid changes of direction, and powerful movements such as kicking, tackling or striking) are critical for performance in team sports, as they involve high-intensity, short-duration movements that contribute to success in competition (65–68). Precautions must be taken into account when applying our results to other populations. Sled towing is a highly beneficial exercise for enhancing force output and improving the acceleration phase of sprinting (55). Sled towing could be integrated into the early stages of a sprint training program to build strength and explosive power. According to a study comparing BP and UP among trained field athletes, BP appears to be more favorable for maximizing specific qualities (strength, hypertrophy) during the off-season or pre-season in male and female athletes (53, 69–71). BP may also provide more favorable results in terms of resting hormone levels and injury reduction (72). Thus, BP may be used in the off-season or pre-season to allow for optimal recovery and adaptation. BP is also recommended for untrained individuals as it helps to build a solid strength foundation in male and female (73). However, UP might be more advantageous for athletes who need frequent variations in training intensity. For track and field athletes, UP would be more appropriate during the competitive season to prevent stagnation and maintain consistent progress (70). In untrained and elite female handball players, it was shown that BP promoted maximal strength development, while UP was more beneficial for maintaining and improving endurance and agility during the competition period (74, 75). As a result, periodization should be tailored to the athlete's specific goals (e.g., sprinting, muscular strength, or injury prevention), experience level, and the phase of the season. BP is more beneficial for specific strength development and recovery, while DUP is better suited for maintaining performance and preventing stagnation. Finally, coaches might consider integrating sled towing and resistance training during the off-season in order to optimize the peak force, RFD, and sprint acceleration performance.
Both training modalities showed a significant improvement in performance at 40-yd. It would appear that UP is more suitable for increasing muscle mass and maintaining the mechanical variables FH0rel and PHmaxrel. Conversely, the focus on physical qualities during BP would enable these to be developed. As a result, BP would be more suitable for young players who are inexperienced in training. Depending on the sporting calendar, the use of BP, whose aim is to improve the mechanical variables associated with sprint performance, would be judicious in the inter- or pre-season. The aim is to maintain these variables with UP during the season.
The datasets presented in this study can be found in online repositories. The names of the repository/repositories and accession number(s) can be found in the article/Supplementary Material.
The studies involving humans were approved by Comité d'Ethique pour la Recherche en Sciences et Techniques des Activités Physiques et Sportives. The studies were conducted in accordance with the local legislation and institutional requirements. Written informed consent for participation in this study was provided by the participants’ legal guardians/next of kin. Written informed consent was obtained from the individual(s), and minor(s)' legal guardian/next of kin, for the publication of any potentially identifiable images or data included in this article.
VP: Methodology, Formal Analysis, Writing – original draft, Conceptualization, Data curation, Investigation. JS: Investigation, Methodology, Conceptualization, Data curation, Validation, Writing – review & editing. SG: Investigation, Writing – review & editing, Funding acquisition, Project administration. PL: Writing – review & editing, Resources. P-ML: Writing – review & editing, Formal Analysis, Funding acquisition, Methodology, Project administration, Supervision, Validation, Writing – original draft.
The author(s) declare that no financial support was received for the research and/or publication of this article.
The authors declare that the research was conducted in the absence of any commercial or financial relationships that could be construed as a potential conflict of interest.
The author(s) declared that they were an editorial board member of Frontiers, at the time of submission. This had no impact on the peer review process and the final decision.
The author(s) declare that no Generative AI was used in the creation of this manuscript.
All claims expressed in this article are solely those of the authors and do not necessarily represent those of their affiliated organizations, or those of the publisher, the editors and the reviewers. Any product that may be evaluated in this article, or claim that may be made by its manufacturer, is not guaranteed or endorsed by the publisher.
1. Iosia MF, Bishop PA. Analysis of exercise-to-rest ratios during division IA televised football competition. J Strength Cond Res. (2008) 22(2):332–40. doi: 10.1519/JSC.0b013e31816607b0
2. Bayliff GE, Jacobson BH, Moghaddam M, Estrada C. Global positioning system monitoring of selected physical demands of NCAA division I football players during games. J Strength Cond Res. (2019) 33(5):1185–91. doi: 10.1519/JSC.0000000000003137
3. Ghigiarelli JJ. Combine performance descriptors and predictors of recruit ranking for the top high school football recruits from 2001 to 2009: differences between position groups. J Strength Cond Res. (2011) 25(5):1193–203. doi: 10.1519/JSC.0b013e318215f546
4. Gillen ZM, Shoemaker ME, McKay BD, Cramer JT. Performance differences between national football league and high school American football combine participants. Res Q Exerc Sport. (2019) 90(2):227–33. doi: 10.1080/02701367.2019.1571679
5. Jiménez-Reyes P, Samozino P, García-Ramos A, Cuadrado-Peñafiel V, Brughelli M, Morin J-B. Relationship between vertical and horizontal force-velocity-power profiles in various sports and levels of practice. PeerJ. (2018) 6:e5937. doi: 10.7717/peerj.5937
6. Samozino P, Rabita G, Dorel S, Slawinski J, Peyrot N, Saez de Villarreal E, et al. A simple method for measuring power, force, velocity properties, and mechanical effectiveness in sprint running: simple method to compute sprint mechanics. Scand J Med Sci Sports. (2016) 26(6):648–58. doi: 10.1111/sms.12490
7. Samozino P, Peyrot N, Edouard P, Nagahara R, Jimenez-Reyes P, Vanwanseele B, et al. Optimal mechanical force-velocity profile for sprint acceleration performance. Scand J Med Sci Sports. (2022) 32(3):559–75. doi: 10.1111/sms.14097
8. Morin J-B, Bourdin M, Edouard P, Peyrot N, Samozino P, Lacour J-R. Mechanical determinants of 100-m sprint running performance. Eur J Appl Physiol. (2012) 112(11):3921–30. doi: 10.1007/s00421-012-2379-8
9. Slawinski J, Termoz N, Rabita G, Guilhem G, Dorel S, Morin J-B, et al. How 100-m event analyses improve our understanding of world-class men’s and women’s sprint performance. Scand J Med Sci Sports. (2017) 27(1):45–54. doi: 10.1111/sms.12627
10. Delaney JA, Olson TM, Morin J-B. Sprint acceleration mechanical profiling for the NFL draft. Sport Perform Sci Rep. (2018):1–3.
11. Devismes M, Aeles J, Philips J, Vanwanseele B. Sprint force-velocity profiles in soccer players: impact of sex and playing level. Sports Biomech. (2021) 20(8):947–57. doi: 10.1080/14763141.2019.1618900
12. Bompa TO, Haff G. Periodization: theory and methodology of training. 5th edn. Champaign, IL: Human Kinetics (2009). p. 125–46.
13. Fleck S. Non-linear periodization for general fitness & athletes. J Hum Kinet. (2011) 29A:41–5. doi: 10.2478/v10078-011-0057-2
14. Gavanda S, Geisler S, Quittmann OJ, Schiffer T. The effect of block versus daily undulating periodization on strength and performance in adolescent football players. Int J Sports Physiol Perform. (2019) 14(6):814–21. doi: 10.1123/ijspp.2018-0609
15. Harries SK, Lubans DR, Callister R. Comparison of resistance training progression models on maximal strength in sub-elite adolescent rugby union players. J Sci Med Sport. (2016) 19(2):163–9. doi: 10.1016/j.jsams.2015.01.007
16. Souza EO, Ugrinowitsch C, Tricoli V, Roschel H, Lowery RP, Aihara AY, et al. Early adaptations to six weeks of non-periodized and periodized strength training regimens in recreational males. J Sports Sci Med. (2014) 13(3):604–9.25177188
17. Issurin VB. New horizons for the methodology and physiology of training periodization. Sports Med. (2010) 40(3):189–206. doi: 10.2165/11319770-000000000-00000
18. Hartmann H, Wirth K, Keiner M, Mickel C, Sander A, Szilvas E. Short-term periodization models: effects on strength and speed-strength performance. Sports Med. (2015) 45(10):1373–86. doi: 10.1007/s40279-015-0355-2
19. Painter KB, Haff GG, Ramsey MW, McBride J, Triplett T, Sands WA, et al. Strength gains: block versus daily undulating periodization weight training among track and field athletes. Int J Sports Physiol Perform. (2012) 7(2):161–9. doi: 10.1123/ijspp.7.2.161
20. Sabido R, Hernández-Davó JL, Botella J, Jiménez-Leiva A, Fernández-Fernández J. Effects of block and daily undulating periodization on neuromuscular performance in young male handball players. Kinesiology. (2018) 50(1):93–103. doi: 10.26582/k.50.1.6
21. Cahill MJ, Oliver JL, Cronin JB, Clark K, Cross MR, Lloyd RS, et al. Influence of resisted sled-pull training on the sprint force-velocity profile of male high-school athletes. J Strength Cond Res. (2020) 34(10):2751–9. doi: 10.1519/JSC.0000000000003770
22. Edwards T, Piggott B, Banyard HG, Haff GG, Joyce C. The effect of a heavy resisted sled-pull mesocycle on sprint performance in junior Australian football players. J Strength Cond Res. (2023) 37(2):388–93. doi: 10.1519/JSC.0000000000004269
23. Lahti J, Jiménez-Reyes P, Cross MR, Samozino P, Chassaing P, Simond-Cote B, et al. Individual sprint force-velocity profile adaptations to in-season assisted and resisted velocity-based training in professional rugby. Sports. (2020) 8(5):74. doi: 10.3390/sports8050074
24. Morin J-B, Petrakos G, Jiménez-Reyes P, Brown SR, Samozino P, Cross MR. Very-heavy sled training for improving horizontal-force output in soccer players. Int J Sports Physiol Perform. (2017) 12(6):840–4. doi: 10.1123/ijspp.2016-0444
25. Kawamori N, Newton RU, Hori N, Nosaka K. Effects of weighted sled towing with heavy versus light load on sprint acceleration ability. J Strength Cond Res. (2014) 28(10):2738–45. doi: 10.1519/JSC.0b013e3182915ed4
26. Cross MR, Lahti J, Brown SR, Chedati M, Jimenez-Reyes P, Samozino P, et al. Training at maximal power in resisted sprinting: optimal load determination methodology and pilot results in team sport athletes. PLoS One. (2018) 13(4):e0195477. doi: 10.1371/journal.pone.0195477
27. Upton DE. The effect of assisted and resisted sprint training on acceleration and velocity in division IA female soccer athletes. J Strength Cond Res. (2011) 25(10):2645–52. doi: 10.1519/JSC.0b013e318201be16
28. Kraemer WJ, Ratamess NA. Fundamentals of resistance training: progression and exercise prescription. Med Sci Sports Exerc. (2004) 36(4):674–88. doi: 10.1249/01.MSS.0000121945.36635.61
29. Baena-Marín M, Rojas-Jaramillo A, González-Santamaría J, Rodríguez-Rosell D, Petro JL, Kreider RB, et al. Velocity-based resistance training on 1-RM, jump and sprint performance: a systematic review of clinical trials. Sports. (2022) 10(1):8. doi: 10.3390/sports10010008
30. Thompson SW, Olusoga P, Rogerson D, Ruddock A, Barnes A. Is it a slow day or a go day?”: the perceptions and applications of velocity-based training within elite strength and conditioning. Int J Sports Sci Coach. (2023) 18(4):1217–28. doi: 10.1177/17479541221099641
31. Weakley J, Mann B, Banyard H, McLaren S, Scott T, Garcia-Ramos A. Velocity-Based training: from theory to application. Strength Cond J. (2021) 43(2):31–49. doi: 10.1519/SSC.0000000000000560
32. Côté J, Vierimaa M. The developmental model of sport participation: 15 years after its first conceptualization. Sci Sports. (2014) 29:S63–9. doi: 10.1016/j.scispo.2014.08.133
33. Glatthorn JF, Gouge S, Nussbaumer S, Stauffacher S, Impellizzeri FM, Maffiuletti NA. Validity and reliability of optojump photoelectric cells for estimating vertical jump height. J Strength Cond Res. (2011) 25(2):556–60. doi: 10.1519/JSC.0b013e3181ccb18d
34. Cross MR, Brughelli M, Brown SR, Samozino P, Gill ND, Cronin JB, et al. Mechanical properties of sprinting in elite rugby union and rugby league. Int J Sports Physiol Perform. (2015) 10(6):695–702. doi: 10.1123/ijspp.2014-0151
35. Swinton PA, Lloyd R, Keogh JWL, Agouris I, Stewart AD. A biomechanical comparison of the traditional squat, powerlifting squat, and box squat. J Strength Cond Res. (2012) 26(7):1805–16. doi: 10.1519/JSC.0b013e3182577067
36. Sánchez-Medina L, Pallarés J, Pérez C, Morán-Navarro R, González-Badillo J. Estimation of relative load from bar velocity in the full back squat exercise. Sports Med Int Open. (2017) 01(02):E80–8. doi: 10.1055/s-0043-102933
37. Sánchez-Medina L, Pallarés J, Morán-Navarro R, Pérez C, González-Badillo J. Technical note on using the movement velocity to estimate the relative load in resistance exercises – response. Sports Med Int Open. (2018) 02(01):E17–9. doi: 10.1055/s-0037-1600940
38. Held S, Rappelt L, Deutsch J-P, Donath L. Valid and reliable barbell velocity estimation using an inertial measurement unit. Int J Environ Res Public Health. (2021) 18(17):9170. doi: 10.3390/ijerph18179170
39. Olovsson Ståhl E, Öhrner P. Concurrent validity of an inertial sensor for measuring muscle mechanical properties (2020). Available at: https://urn.kb.se/resolve?urn=urn:nbn:se:umu:diva-173423 (Accessed October 12, 2020).
40. Hicks DS, Schuster JG, Samozino P, Morin J-B. Improving mechanical effectiveness during sprint acceleration: practical recommendations and guidelines. Strength Cond J. (2020) 42(2):45–62. doi: 10.1519/SSC.0000000000000519
41. Haugen TA, Breitschädel F, Seiler S. Sprint mechanical variables in elite athletes: are force-velocity profiles sport specific or individual? PLoS One. (2019) 14(7):e0215551. doi: 10.1371/journal.pone.0215551
42. Guerriero A, Varalda C, Piacentini M. The role of velocity based training in the strength periodization for modern athletes. J Funct Morphol Kinesiol. (2018) 3(4):55. doi: 10.3390/jfmk3040055
43. Benedict T. Manipulating resistance training program variables to optimize maximum strength in men: a review. J Strength Cond Res. (1999) 13(3):289. doi: 10.1519/1533-4287(1999)013%3C0289:MRTPVT%3E2.0.CO;2
44. Rumpf MC, Lockie RG, Cronin JB, Jalilvand F. Effect of different sprint training methods on sprint performance over various distances: a brief review. J Strength Cond Res. (2016) 30(6):1767–85. doi: 10.1519/JSC.0000000000001245
45. Mamon MA, Olthof SBH, Burns GT, Lepley AS, Kozloff KM, Zernicke RF. Position-specific physical workload intensities in American collegiate football training. J Strength Cond Res. (2022) 36(2):420–6. doi: 10.1519/JSC.0000000000004174
46. Foster C. Monitoring training in athletes with reference to overtraining syndrome. Med Sci Sports Exercise. (1998) 30(7):1164–8. doi: 10.1097/00005768-199807000-00023
47. Beck TW. The importance of a priori sample size estimation in strength and conditioning research. J Strength Cond Res. (2013) 27(8):2323–37. doi: 10.1519/JSC.0b013e318278eea0
48. Almstedt HC, Canepa JA, Ramirez DA, Shoepe TC. Changes in bone mineral density in response to 24 weeks of resistance training in college-age men and women. J Strength Cond Res. (2011) 25(4):1098. doi: 10.1519/JSC.0b013e3181d09e9d
49. Abe T, Kawamoto K, Dankel SJ, Bell ZW, Spitz RW, Wong V, et al. Longitudinal associations between changes in body composition and changes in sprint performance in elite female sprinters. Eur J Sport Sci. (2020) 20(1):100–5. doi: 10.1080/17461391.2019.1612950
50. Lockie RG, Schultz AB, Callaghan SJ, Jeffriess MD. Physiological profile of national-level junior American football players in Australia. Serb J Sports Sci. (2012) 6(4):127–36.
51. Brechue WF, Mayhew JL, Piper FC. Characteristics of sprint performance in college football players. J Strength Cond Res. (2010) 24(5):1169–78. doi: 10.1519/JSC.0b013e3181d68107
52. Tavakkoli MJ, Abbaspoor M, Nikooie R. The effect of 8 weeks of block and traditional periodization training models on practical factors in volleyball players. Sci J Sport Perform. (2022) 1(2):83–93. doi: 10.55860/YMMU8246
53. Mølmen KS, Øfsteng SJ, Rønnestad BR. Block periodization of endurance training – a systematic review and meta-analysis. Open Access J Sports Med. (2019) 10:145–60. doi: 10.2147/OAJSM.S180408
54. Hicks DS, Drummond C, Williams KJ, Van Den Tillaar R. The effect of a combined sprint training intervention on sprint force-velocity characteristics in junior Australian football players. PeerJ. (2023) 11:e14873. doi: 10.7717/peerj.14873
55. Martínez-Valencia MA, Romero-Arenas S, Elvira JLL, González-Ravé JM, Navarro-Valdivielso F, Alcaraz PE. Effects of sled towing on peak force, the rate of force development and sprint performance during the acceleration phase. J Hum Kinet. (2015) 46(1):139–48. doi: 10.1515/hukin-2015-0042
56. Ishøi L, Aagaard P, Nielsen MF, Thornton KB, Krommes KK, Hölmich P, et al. The influence of hamstring muscle peak torque and rate of torque development for sprinting performance in football players: a cross-sectional study. Int J Sports Physiol Perform. (2019) 14(5):665–73. doi: 10.1123/ijspp.2018-0464
57. Thorlund J, Aagaard P, Madsen K. Rapid muscle force capacity changes after soccer match play. Int J Sports Med. (2009) 30(04):273–8. doi: 10.1055/s-0028-1104587
58. Batra A, Wetmore AB, Hornsby WG, Lipinska P, Staniak Z, Surala O, et al. Strength, endocrine, and body composition alterations across four blocks of training in an elite 400 m sprinter. J Funct Morphol Kinesiol. (2021) 6(1):25. doi: 10.3390/jfmk6010025
59. Stavridis I, Ekizos A, Zisi M, Agilara G-O, Tsolakis C, Terzis G, et al. The effects of heavy resisted sled pulling on sprint mechanics and spatiotemporal parameters. J Strength Cond Res. (2023) 37(12):2346–53. doi: 10.1519/JSC.0000000000004548
60. Zafeiridis A, Saraslanidis P, Manou V, Ioakimidis P, Dipla K, Kellis S. The effects of resisted sled-pulling sprint training on acceleration and maximum speed performance. J Sports Med Phys Fitness. (2005) 45(3):284–90.16230978
61. Rønnestad BR, Øfsteng SJ, Ellefsen S. Block periodization of strength and endurance training is superior to traditional periodization in ice hockey players. Scand J Med Sci Sports. (2019) 29(2):180–8. doi: 10.1111/sms.13326
62. Rønnestad BR, Nymark BS, Raastad T. Effects of in-season strength maintenance training frequency in professional soccer players. J Strength Cond Res. (2011) 25(10):2653. doi: 10.1519/JSC.0b013e31822dcd96
63. Esteves PT, Mikolajec K, Schelling X, Sampaio J. Basketball performance is affected by the schedule congestion: nBA back-to-backs under the microscope. Eur J Sport Sci. (2021) 21(1):26–35. doi: 10.1080/17461391.2020.1736179
64. Yu L, Altieri C, Bird SP, Corcoran G, Jiuxiang G. The importance of in-season strength and power training in football athletes: a brief review and recommendations. Int J Strength Cond Res. (2021) 1(1):1–8. doi: 10.47206/ijsc.vi0.23
65. Albaladejo Saura M, Vaquero-Cristóbal R, García-Roca JA, Esparza-Ros F. What variables allow the differentiation between more and less successful adolescent volleyball players? J Hum Kinet. (2023) 87:229–42. doi: 10.5114/jhk/166107
66. Gabbett TJ, Jenkins DG, Abernethy B. Relative importance of physiological, anthropometric, and skill qualities to team selection in professional rugby league. J Sports Sci. (2011) 29(13):1453–61. doi: 10.1080/02640414.2011.603348
67. Gabbett TJ, Seibold AJ. Relationship between tests of physical qualities, team selection, and physical match performance in semiprofessional rugby league players. J Strength Cond Res. (2013) 27(12):3259–65. doi: 10.1519/JSC.0b013e31828d6219
68. Suchomel TJ, Nimphius S, Stone MH. The importance of muscular strength in athletic performance. Sports Med. (2016) 46(10):1419–49. doi: 10.1007/s40279-016-0486-0
69. Gavanda S, Geisler S, Quittmann OJ, Bauhaus H, Schiffer T. Three weeks of detraining does not decrease muscle thickness, strength or sport performance in adolescent athletes. Int J Exerc Sci. (2020) 13(6):633–44.32509134
70. Hicks DS, Drummond C, Williams KJ, Van Den Tillaar R. Exploratory analysis of sprint force-velocity characteristics, kinematics and performance across a periodized training year: a case study of two national level sprint athletes. Int J Environ Res Public Health. (2022) 19(22):15404. doi: 10.3390/ijerph192215404
71. Manchado C, Cortell-Tormo JM, Tortosa-Martínez J. Effects of two different training periodization models on physical and physiological aspects of elite female team handball players. J Strength Cond Res. (2018) 32(1):280–7. doi: 10.1519/JSC.0000000000002259
72. Painter K, Haff G, Triplett N, Stuart C, Hornsby G, Ramsey M, et al. Resting hormone alterations and injuries: block vs. DUP weight-training among D-1 track and field athletes. Sports. (2018) 6(1):3. doi: 10.3390/sports6010003
73. Api G, Arruda D. Comparison of periodization models: a critical review with pratical applications. J Appl Sport Sci. (2022) 6(2):77–105. doi: 10.37393/JASS.2022.02.7
74. Bartolomei S, Stout JR, Fukuda DH, Hoffman JR, Merni F. Block vs. Weekly undulating periodized resistance training programs in women. J Strength Cond Res. (2015) 29(10):2679–87. doi: 10.1519/JSC.0000000000000948
75. Kok L-Y, Hamer PW, Bishop DJ. Enhancing muscular qualities in untrained women: linear versus undulating periodization. Med Sci Sports Exerc. (2009) 41(9):1797–807. doi: 10.1249/MSS.0b013e3181a154f3
Keywords: sprint acceleration, mechanical variables, undulating periodization, block training, team players, young talent evaluation, American football, performance
Citation: Prioul V, Slawinski J, Guersent S, Lopes P and Leprêtre P-M (2025) Effect of two training modalities on sprint performance in young American football players. Front. Sports Act. Living 7:1554055. doi: 10.3389/fspor.2025.1554055
Received: 31 December 2024; Accepted: 28 February 2025;
Published: 7 April 2025.
Edited by:
Mabliny Thuany, University of Porto, PortugalReviewed by:
Pedro Forte, Higher Institute of Educational Sciences of the Douro, PortugalCopyright: © 2025 Prioul, Slawinski, Guersent, Lopes and Leprêtre. This is an open-access article distributed under the terms of the Creative Commons Attribution License (CC BY). The use, distribution or reproduction in other forums is permitted, provided the original author(s) and the copyright owner(s) are credited and that the original publication in this journal is cited, in accordance with accepted academic practice. No use, distribution or reproduction is permitted which does not comply with these terms.
*Correspondence: Pierre-Marie Leprêtre, cGllcnJlLW1hcmllLmxlcHJldHJlQHVuaXYtcm91ZW4uZnI=
Disclaimer: All claims expressed in this article are solely those of the authors and do not necessarily represent those of their affiliated organizations, or those of the publisher, the editors and the reviewers. Any product that may be evaluated in this article or claim that may be made by its manufacturer is not guaranteed or endorsed by the publisher.
Research integrity at Frontiers
Learn more about the work of our research integrity team to safeguard the quality of each article we publish.