 Adrien Cerrito
 Larissa Wittwer2
 Kai-Uwe Schmitt
94% of researchers rate our articles as excellent or good
Learn more about the work of our research integrity team to safeguard the quality of each article we publish.
Find out more
ORIGINAL RESEARCH article
Front. Sports Act. Living, 03 April 2025
Sec. Biomechanics and Control of Human Movement
Volume 7 - 2025 | https://doi.org/10.3389/fspor.2025.1387934
Introduction: As a coach or health care professional working with physically active people, it can be difficult to guide runners towards safe and effective progression, because making changes to single aspects of running technique may not lead to the desired result. Alternatively, it has been proposed to consider the human body as one complex system when assessing and improving human movement. From this perspective, it appears that the movement variability and local dynamic stability, expressed as the maximum Lyapunov exponent (LyEmax), may be of particular interest. This study investigated the difference in LyEmax of the lower extremities' main joints (ankle, knee, hip) between experienced and novice runners at different running speeds.
Methods: Thirty-six participants were recruited, with 18 experienced runners and 18 novice runners. Participants ran at three different speeds on a treadmill for 10 minutes in each of the following conditions: preferred running speed, 10% slower, and 10% faster. Twenty-six participants were included in the analysis. The LyEmax was calculated from joint kinematics and a two-way ANOVA with repeated measures was applied.
Results: The results showed that there is a strong effect of running experience on the LyEmax with the experienced runners having more local dynamic stability. The effect of running speed was statistically significant only for the hip joint, where higher running speeds resulted in more local dynamic stability in both groups.
Discussion and conclusion: The results should be interpreted with caution, particularly due to the low running speeds chosen by the novice runners. Nevertheless, the study's findings support the emerging view that movement variability is a parameter on which it is important to focus, and that local dynamic stability should be improved in novice runners as well as with athletes or patients who are in a return-to-sport phase of a rehabilitation.
Running is a natural way of locomotion that represents a form of physical activity practiced by millions of individuals worldwide [e.g., (1–3)]. Running is appreciated for multiple reasons, such as its simplicity, accessibility, and convenience. In addition, it has many health benefits, for instance providing a protective effect against chronic diseases and premature death from any condition (4), and improving mental health (5). But while some health benefits might have immediate effect, e.g., for mental health (6), to exploit most other benefits, running must be practiced regularly and for a prolonged period. During this period, not only physiological adaptations take place (7), but experience is also gained and running technique changes. For example, experienced runners generally appear to adopt techniques with shorter steps and higher step frequency, compared to inexperienced (i.e., novice) runners (8). Also, differences in joint angle magnitudes, such as greater amplitudes in ankle inversion/eversion and hip abduction/adduction in novice runners, were found in previous studies (9). Kinetic differences were also reported, with greater ankle inversion and hip abduction moments in novice runners (9). These differences may be linked to the development of running-related injuries or to lower running economy and could partially explain higher risk of injury (10) and lower performance in novice runners. Nevertheless, applying these data in coaching, prevention or rehabilitation activities as a guide to rapidly and safely progress in running remains difficult, because it would imply the existence of one perfect running technique. In fact, sports techniques are likely to be highly individual (11) and in running, differences in anthropometry, preferred muscle activation patterns and functional statuses (e.g., joint mobility) could be sufficient to explain uniqueness in gait patterns. Hence, making changes to the running technique to improve performance and prevent running-related injuries should be an individualised operation rather than rely on averaged biomechanical data from single body segments, joints or spatio-temporal parameters (12).
In contrast, perceiving the body as one complex entity might provide deeper insight into the issue, because the output of the interactions between all body parts is considered rather than the body parts individually. Approaches stemming from the complex systems theory, such as nonlinear movement analysis, have been proposed to this end (13). More specifically, movement variability is thought to reflect how the central nervous system adapts motor strategies to internal and external perturbations and to carry important information about the health and expertise status of the motor behaviour (14). In this context, it appears that there is an optimum lying between too little and too much movement variability. To safely progress in running, it is conceivable that it is more important to achieve or maintain this state, than to improve certain movements in isolated joints according to reference values. In particular, a system aiming for balanced movement variability requires local dynamic stability—often expressed as the maximum Lyapunov Exponent (LyEmax)—to avoid its collapse. It has been shown that the level of local dynamic stability differed between groups of various experience levels, with experienced runners generally showing more local dynamic stability than novice runners (15, 16) and factors such as footwear (17) and exhaustion (16) having substantial influence. These factors may represent important training variables that can be manipulated when working with runners in practice. Nevertheless, one aspect that has not been investigated is the difference in local dynamic stability between experienced and novice runners when changing running speed. This is a significant aspect because varying running speeds represents an important part of running training to prevent monotony (18, 19), thereby ensuring progress and expand the richness of motor repertoire.
Hence, this study's aim was to investigate the effect of the level of experience and running speed on local dynamic stability expressed as LyEmax in the ankle, knee, and hip joints in the sagittal plane. The ankle joint served as the primary reference for the analysis. The focus was set on local dynamic stability of joint kinematics rather than kinetics for feasibility reasons. The latter requires more technical equipment, which may strongly limit the transferability into coaching or clinical practice. Moreover, the sagittal plane was chosen for the analysis due to its high level of reliability that is also found in portable measurement systems, such as inertial sensors (20), which can easily be used by coaches or clinicians.
A cross-sectional study was conducted that compared a group of experienced runners (Exp) with a group of novice runners (Nov) running at three different speeds: preferred running speed (“Preferred”), 10% faster (“Fast”) and 10% slower (“Slow”).
Precise sample size calculation was difficult to perform because, to the best of the authors' knowledge, no prior study investigating differences in local dynamic stability between novice and experienced runners in different running speed conditions existed. Nevertheless, some work investigating the inverse of stability, i.e., movement variability expressed in terms of coordination variability, was found (21), on which basis a medium effect size was expected. Sample size estimation was therefore performed using a Cohen's f ranging from 0.2 to 0.25, as well as an α and β error probabilities of 0.05 and 0.2, respectively. The calculations performed in G*Power (v. 3.1) (22) resulted in a sample size of 28–44 participants and a sample size of 36 was chosen for this study as the middle value.
Thirty-six participants were recruited using the following eligibility criteria. Basic criteria applied to both groups: (i) feeling healthy, (ii) being free of any pain symptoms, and (iii) being aged between 20 and 40 years of age. Group-specific inclusion criteria were also set. For the Exp group, participants with a minimum of 4 years of running experience with a minimum weekly training volume of 20 km on a monthly average were eligible. For the Nov group, participants with a running experience ranging from none to a maximum of 6 months were eligible. Exclusion criteria were the following: (i) musculoskeletal or neurological disorders that could affect movement patterns, (ii) musculoskeletal injury in the past 12 months, (iii) serious medical conditions (e.g., tumor, myocardial infarction), and (iv) running experience matching neither group requirements.
Ten participants had to be excluded from the analysis due to technical problems in the kinematic data, such as marker detachment or occlusion, leading to a final sample size of 26. Consequently, a post hoc power analysis (1-β) of the results was performed. Demographic data, anthropometry, and training characteristics are presented for both groups together as well as separately in Table 1.
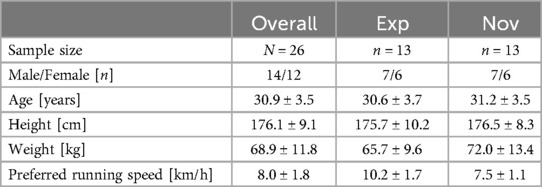
Table 1. Sample characteristics.
The study was conducted in line with the Declaration of Helsinki and it was approved by the responsible Ethics Committee of the Canton of Bern (Ref.: 2022-01136). All participants provided written informed consent to participate.
Basic demographic, health- and training-related data were collected through a custom questionnaire delivered via LimeSurvey (v. 2.56.1, LimeSurvey, Hamburg, Germany). Anthropometrics (body height and weight) were measured using a stadiometer and a scale. Running kinematics were obtained from a 16-camera optoelectronic motion capture system and the Vicon Nexus Software (Vicon, Oxford, UK). For that purpose, 28 retroreflective markers were attached to participants' anatomical landmarks according to the Conventional Gait Model 2.3 for the lower limbs (23). Kinematic data were collected at 200 Hz. Participants ran on a treadmill (h/p/cosmos Quasar Med, h/p/cosmos sports medical gmbh, Nussdorf-Traunstein, Germany) with 0% incline in three trials at different speeds.
Participants were invited for a single data collection session. Upon arrival, written informed consent was obtained and participants were asked to wear sports clothes and their own running shoes. Data collection began with the administration of the questionnaire and with taking the anthropometric measures. Then, participants were equipped with the markers, which were secured with double-sided tape and “kinesiology tape” (Figure 1). They were asked to draw opaque envelopes to randomly set the order of the three running speeds Slow, Preferred, and Fast. Participants then warmed up according to a standardised routine consisting of squats-to-calf raises, squat-lunges, and two running drills. Then, they were asked to further warm up on the treadmill, to familiarise with it, and to select their preferred running speed. For this purpose, they were asked to try various speeds and to find the one they would choose for a comfortable long run (24). Preferred running speed was written down, the 10% were calculated and subtracted (Slow) and added (Fast) to it, and running trials were started according to the previously randomised order. In each running trial, participants ran for 10 min, and the last 2 min were recorded. Between each trial, participants had a break of 3–5 min.
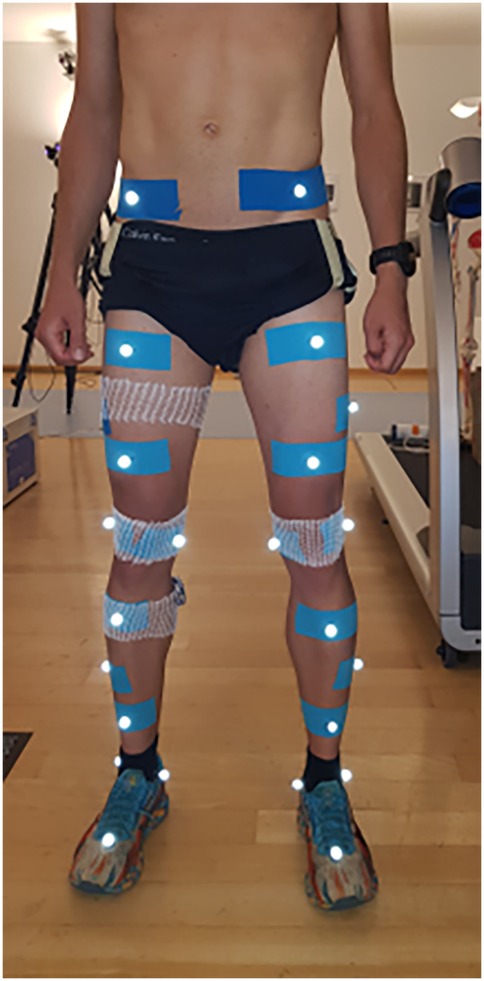
Figure 1. Marker set up used: conventional gait model 2.3 for the lower limbs.
Kinematic data were cleaned within Vicon Nexus, which included marker labelling, gap filling and removing ghost markers. Joint angles from the CGM2.3 model were also calculated via Vicon Nexus. All further data processing was performed within MATLAB (v. R2021b, Mathworks, Natick, MA, USA) using custom-written scripts. Joint angle data were low-pass filtered using a 2nd order zero-lag Butterworth filter with a cut-off frequency of 15 Hz. The cut-off frequency was set based on a visual inspection of the Power Spectrum Analysis performed with pilot data from two other studies (25, 26). The trials were then cropped to a standardized length containing the first 100 complete strides (27). The number of strides used was rounded up from the recommendations by Raffalt et al. (27) and Mehdizadeh and Sanjari (28). Stride detection was based on kinematic data, where peak knee flexions were detected to separate strides. Visual quality inspection was performed to ensure correctness of this process.
In brief, the LyEmax quantifies the level of chaos in a dynamical system (i.e., a system that evolves over time). Analysing running gait using an approach based on dynamical systems theory allows the application of the LyEmax method to quantify how well the motor system can attenuate perturbations to maintain stable running gait pattern (13). For the analysis, the time series data (i.e., kinematics) are reconstructed into a state space to reveal information about the underlying dynamic process. An optimal time-lag (τ) and embedding dimension (d) must first be identified to generate an appropriate state space and allow optimal unfolding of new information about the underlying dynamical process. In this higher-dimensional state space, the time series data are expected to form trajectories orbiting an attractor. The LyEmax effectively quantifies the rate at which these orbiting trajectories diverge, where higher values indicate less capability of the motor system to attenuate perturbations (13, 29). The interested reader is referred to Stergiou (13) for more comprehensive description.
All calculations for the LyEmax were performed in MATLAB using adapted scripts from the NONANToolbox (30). First, to perform the state-space reconstruction, the time-lag τ and the embedding dimension d were computed using the Average Mutual Information (AMI) and the False Nearest Neighbour (FNN) methods, respectively (13). For AMI, a maximum time-lag of one second was set. The calculation of AMI and FNN was performed for all participants in all conditions for the ankle joint kinematics in the sagittal plane. These values were averaged to obtain mean τ and mean m, which were then used to calculate LyE for the ankle, knee and hip joint kinematics in the sagittal plane (27). The LyEmax was calculated with the Wolf algorithm (27) using an evolve parameter of 0.05 times the sampling frequency (13).
Statistical analysis was performed in Jamovi (v. 2.3.28) (31). First, the questionnaire data and the three running speeds were analysed using descriptive statistics [mean ± standard deviation (SD)]. The analysis of the effect of experience level and running speed on LyEmax was then calculated using a two-way ANOVA with repeated measures. Normal distribution of residuals was verified visually using a histogram and Q-Q plot. In addition, a Shapiro–Wilk test was performed to further check for normal distribution. Sphericity was tested using Mauchly Test. All tests were performed with a significance level of 0.05. Where the ANOVA indicated statistically significant differences, pairwise comparisons were performed with Bonferroni adjustment. Effect sizes were calculated as partial eta squared (ηp2) and interpreted as follows: 0.01: small effect; 0.06: medium effect; 0.14: large effect (32).
Training characteristics of the Exp group are presented in Figure 2. Six out of 13 Exp runners (46.2%) indicated being member of a running group and 12 participating in competitions (92.3%). All Exp runners participated in other sports, such as swimming, cycling, pilates, or volleyball. Six of the Nov runners (46.2%) were physically active on a regular basis by participating in one or multiple sports (e.g., swimming, yoga, hiking, or badminton).
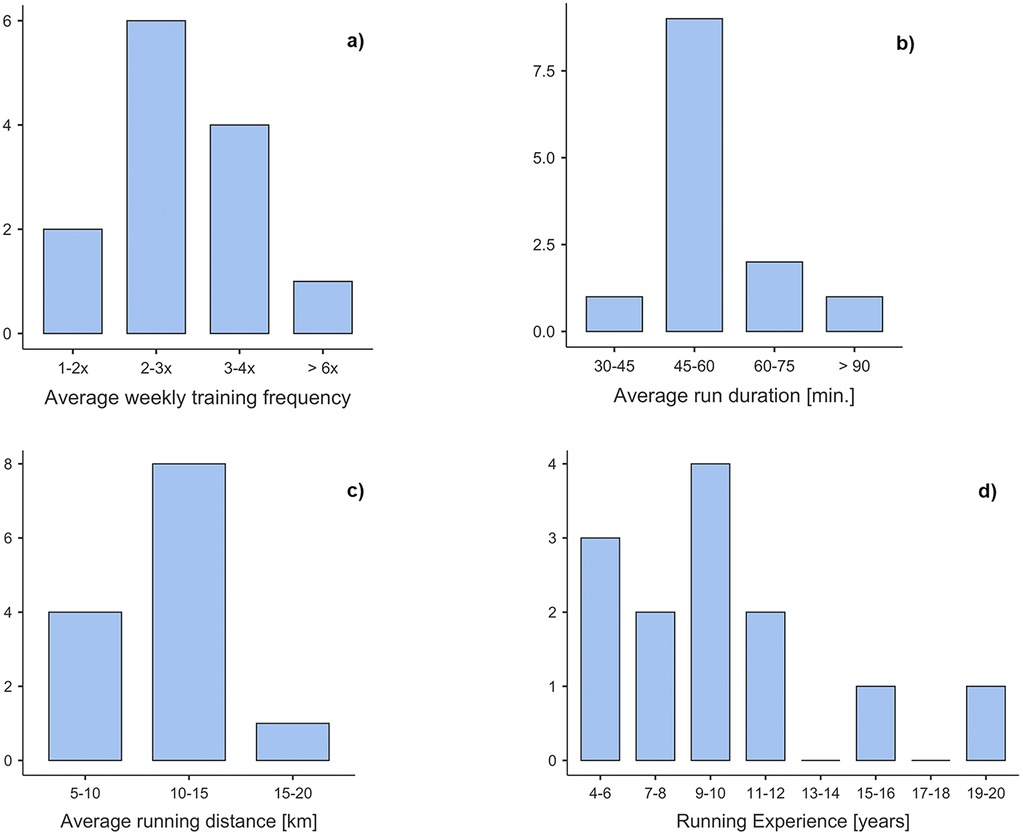
Figure 2. Training-related data of the Exp group. The top left bar plot (a) presents the distribution of the average weekly training frequency, (b) the average duration of run training sessions, (c) the average running distance per running training, and (d) the running experience.
Out of the Nov and Exp groups, three runners (23.1%) and one runner (7.7%), respectively, reported having sustained an injury to the lower extremities from which they did not recover fully. In the Nov group, injuries occurred between nine months and six years prior to data collection and the recovery ranged from 80% to 95%. In the Exp group, the injury occurred three years prior to data collection and the runner reported a 95% recovery.
The AMI and FNN calculations resulted in a time-lag τ of 29 frames and an embedding dimension d of 6.
Table 2 presents the mean LyEmax (±SD) for the ankle, knee and hip joints at each running speed for both groups. Figures 3–5 illustrate the distribution of these data, respectively.
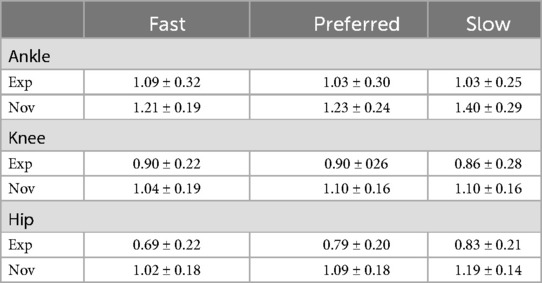
Table 2. Mean ± SD LyEmax values for the ankle, knee, and hip joints at fast, preferred, and slow running speeds for experienced (Exp) and novice (Nov) runners.
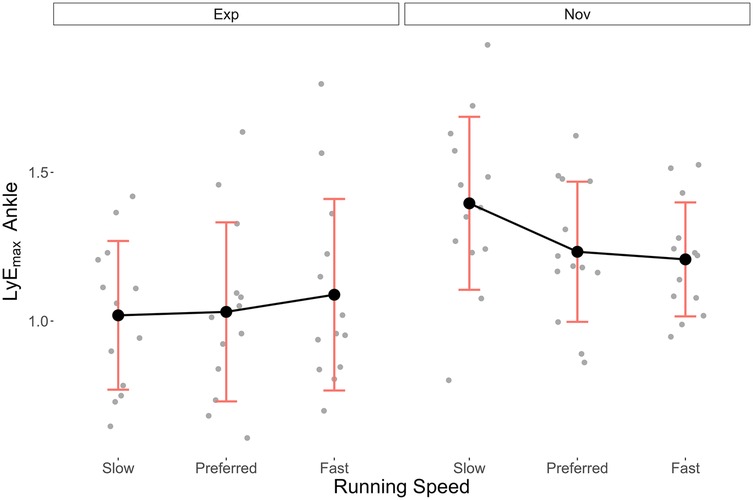
Figure 3. Mean ± SD LyEmax data of the ankle joint in the Exp and Nov groups at different running speeds.
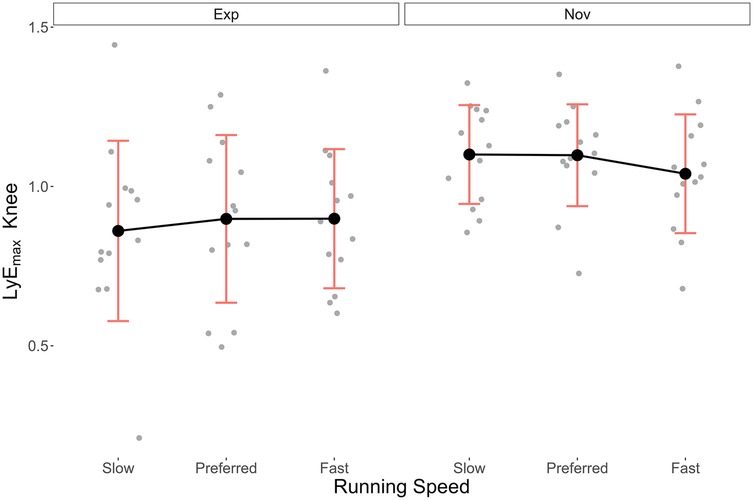
Figure 4. Mean ± SD LyEmax data of the knee joint in the Exp and Nov groups at different running speeds.
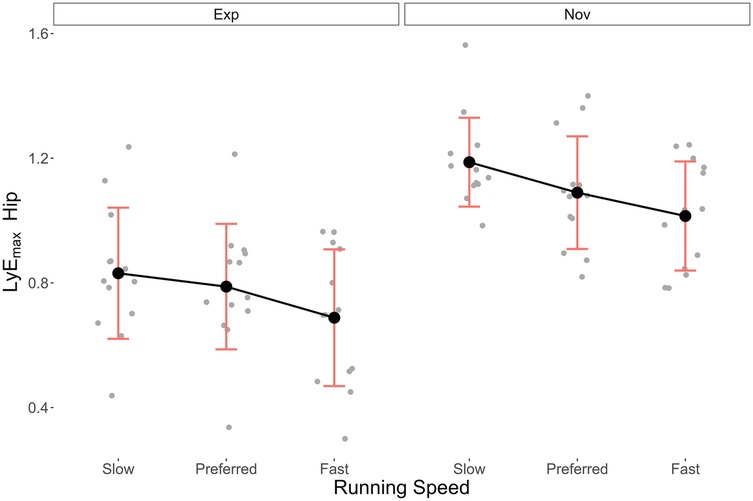
Figure 5. Mean ± SD LyEmax data of the hip joint in the Exp and Nov groups at different running speeds.
For the ankle joint, no assumption for the ANOVA calculation was violated (Shapiro–Wilk test p = 0.38, Mauchly test p = 0.61). Mean LyEmax (±SD) was consistently lower in the Exp than in the Nov group, with values for Fast, Preferred, and Slow of 1.09 (±0.32), 1.03 (±0.30), and 1.02 (±0.25) and 1.21 (±0.19), 1.23 (±0.24), and 1.40 (±0.29), respectively. The ANOVA revealed a statistically significant effect of running experience on LyEmax (p < 0.02, 1-β = 65%) and that this effect is large (ηp2 = 0.22). In contrast, while the effect of running speed alone appeared to be medium (ηp2 = 0.06), it was not statistically significant (p = 0.26, 1-β = 18%). The interaction between running experience and running speed, however, showed large effect on the LyEmax (ηp2 = 0.14) and was statistically significant (p < 0.03, 1-β = 41%). The results of the post hoc pairwise comparison Bonferroni tests showed non-significant p-values in all comparisons (p = 0.48–1.00) for the effect of running speed on LyEmax in the ankle. For the interaction effect, the results showed that the LyEmax differed between Exp and Nov particularly in the Slow running speed condition (p = 0.03) and where Nov run Slow and Exp run Fast (p = 0.03).
For the knee and hip joints, normal distribution of the model residuals (Shapiro–Wilk test p = 0.09 and p = 0.43, respectively) and sphericity (Mauchly test p = 0.29 and p = 0.12, respectively) was also assumed. Here too, mean LyEmax (±SD) was consistently lower in the Exp group. For the knee in the Fast, Preferred, and Slow conditions, values were 0.90 (±0.22), 0.90 (±0.26), and 0.86 (±0.28), respectively, in the Exp group, and 1.04 (±0.19), 1.10 (±0.16), and 1.10 (±0.16) in the Nov group. The ANOVA showed a large, statistically significant effect of running experience on the knee's LyEmax (ηp2 = 0.24, p = 0.01, 1-β = 70%). Both the effect of running speed and the interaction between the two independent variables were small and not statistically significant (ηp2 = 0.01, p = 0.79, 1-β = 7% and ηp2 = 0.03, p = 0.51, 1-β = 11%, respectively). The post hoc analysis showed no significant p-values, neither for the effect of running speed (p = 1.00) nor for the interaction effect (p = 0.18–1.00).
For the hip in the Fast, Preferred, and Slow conditions, values were 0.69 (±0.22), 0.79 (±0.20), and 0.83 (±0.21), respectively, in the Exp group, and 1.02 (±0.18), 1.09 (±0.18), and 1.19 (±0.14) in the Nov group. In the ANOVA, both independent variables showed statistically significant large effects on LyEmax, with running experience ηp2 = 0.57 (p < 0.01, 1-β = 99%) and running speed ηp2 = 0.25 (p < 0.01, 1-β = 73%). The effect of the interaction was very small and not statistically significant (ηp2 = 0.01, p = 0.79, 1-β = 7%). In the post hoc analysis, statistically significant results were found in the comparison between Slow and Fast running speed (p < 0.01). Regarding the interaction effects, seven pairwise comparisons were statistically significant, with six concerning the effect of running experience at the same (e.g., Slow vs. Slow, p < 0.01) or different running speed conditions (e.g., Nov running Slow vs. Exp running Preferred, p < 0.01). One comparison within the Nov group showed statistically significant difference in LyEmax in Slow vs. Fast (p = 0.02).
The post hoc pairwise comparisons from the Bonferroni tests for the ankle, knee and hip joints are presented in the Supplementary Material.
This study investigated the effect of running experience and running speed on the local dynamic stability of the ankle, the knee, and the hip joints. The results showed that runners from the Exp group had statistically significantly lower LyEmax values in all three joints of the lower limbs in all three running speed conditions compared to those from the Nov group, meaning that running experience has a strong effect (ηp2 = 0.22–0.57) on increased local dynamic stability. The results corroborate prior studies that also showed experienced runners exhibit more local dynamic stability in the lower limb's joints while running, although these studies investigated other parameters, such as the effect of footwear (15) or fatigue in a 5 km exhaustive run (16).
In contrast, the running speed condition did not show statistically significant results, except for the hip joint. An analysis of the trends of the LyEmax over the three running speed conditions, nevertheless, appeared interesting. For the ankle joint in the Exp group, the LyEmax increased from Slow to Fast, with the largest increase occurring between Preferred and Fast. This result is in line with the trends observed by Wang et al. and Aghaie et al. in the knee and hip joints (21, 33). Wang et al. (21) stated that the increase in movement variability with increasing speed could be interpreted in two ways. First, it could signify that faster running speeds demand more variability in movement patterns to increase adaptability to internal and external perturbations. Second, it could reflect less stability as the running speed becomes physically more challenging and leads to difficulties in dynamically stabilising joint movements. Nevertheless, although the authors of the current study agree with Wang et al. (21) that conclusions about the interpretation is difficult at this stage, they believe the first view better explains the results, because in the current study, the running speed conditions were based on the preferred running speed. This means that participants felt relatively comfortable while running even in the Fast condition and that the task probably did not lead to as much biomechanical demands as in sprinting and to as much difficulty in dynamically stabilising the joint movements.
Interestingly, participants of the Nov group exhibited the opposite trend with decreasing LyEmax values as the running speed increased. This trend was observed in all three joints, although to a lesser extent in the knee joint. A possible explanation for this result is that the average preferred running speed selected by Nov participants (7.5 km/h) was close to the speed of 7.2 km/h that is considered to be the preferred speed at which unexperienced runners transition from walking to running (34). From a dynamical systems' perspective, such transition phases are always characterised by increased levels of instability (35), which may explain the largest LyEmax values found in the Slow and Fast conditions, respectively.
In both groups' hip joints, the results revealed the lowest LyEmax values overall and showed a decrease as the running speed increased. In the knee, the values slightly increased from Slow to Preferred in the Exp group and slightly decreased from Preferred to Fast in the Nov group. These hip and knee results are not in line with the findings of Wang et al. and Aghaie et al. who found an increase in movement variability and LyEmax, both meaning less stability (21, 33). The discrepancies might be due to several reasons. First, Wang et al. (21) did not investigate local dynamic stability but rather movement variability expressed as variations in coordinative patterns, which only allows a gross conceptual comparison to the current study, where variability is the inverse of stability. Second, the authors did not report the number of strides investigated per participant, but the number is likely to be relatively low compared to the current study that used 100 strides. The issue of small number of strides also applies to the study by Aghaie et al. (33) who used 50 strides. Finally, Aghaie et al. (33) used inertial measurement unit sensors to obtain joint angles and the Rosenstein algorithm to calculate the Lyapunov exponent, which makes direct comparison difficult. Such methodological disparities have recently been reported in a systematic review on the application of the Lyapunov exponent to the analysis of human movement performance (29) and to facilitate interpretation of the results, future studies should be more strictly based on reference studies, such as the one by Raffalt et al. (27).
The in-depth analysis of the interaction effect revealed that, although the lower preferred running speed in Nov participants led to smaller speed ranges from Slow to Fast (1.5 km/h) than in Exp participants (2.0 km/h), their gradient in ankle LyEmax were much higher (0.19) than in the Exp group (0.07). This increased gradient in LyEmax in Nov compared to Exp participants was also found in the knee (0.06 vs. 0.04) and hip (0.18 vs. 0.14) joints, yet to a lesser extent, resulting in statistically non-significance. But beyond the current statistical results, the qualitative analysis indicated unequivocally that experienced runners' local dynamic stability was less affected by changes in running speed than that of novice runners. Moreover, provided the statistical power of the interaction effects in the knee and hip was very low (11% and 7%, respectively), the risk of β error was relatively high. Hence, future studies should investigate the interaction effects between running speed and experience more closely.
Future research should overcome the limitations of this study. First, participants were asked to run on a treadmill, which is known to alter gait patterns when compared to overground walking [e.g., (36)]. The reason for using a treadmill was that it allows the use of optoelectronic motion capture, which is considered to be the gold standard in motion capture (37), and to use a large amount of strides continuously. Second, the two groups had extremely different running experience and no intermediate group was included. Having a group of intermediate experience could have provided further insight in the role running experience has on local dynamic stability. Third, the sample used for the data analysis was smaller than the targeted sample size estimation. Fourth, Slow and Fast were separated from the preferred running speed by only 10%. It is conceivable that more pronounced results could have been achieved with running speed conditions of 20% lower and higher than the preferred running speed. Moreover, it can be criticised that the preferred running speed is subjective and may not be reliable, especially when determined on a treadmill [e.g., (38)]. This method resulted in preferred running speeds close to the walk-to-running transition [7.2 km/h (39)], thereby limiting the range of applicability of the results. Hence, future studies could consider other possible running speed determination methods, such one based on the Froude number (40) or physiological parameters [e.g., ventilatory threshold (41)], to decrease the subjective aspect. Fifth, parameters such as fatigue after each running bout, menstrual cycle status for female runners, or footwear type were not controlled. These are parameters could have affected the findings of this study and should be included in future studies' protocols. Finally, applying a longitudinal study design should be considered in future to better understand the evolution of local dynamic stability and/or its role in the development of running-related injuries. This is particularly important since the development on injuries is multifactorial (42).
In contrast, the study's strengths were, that the design was optimised to reduce the risk of bias in the calculation of the LyEmax and explicitly based on the study by Raffalt et al. (27). This included, for example, the choice of a high number of strides. The sample was also well balanced. For example, both groups were of equal size and had the same sex distribution. It should be noted, however, that there were two more participants in the Nov group that had sustained an injury from which they did not recover fully. This might have slightly biased the results.
Nevertheless, the study's results fit well in the bigger picture that begins to arise from the increased use of nonlinear analysis methods to investigate human movement in relation to performance and motor expertise (43, 44). Briefly, experienced runners are thought to have richer repertoires in movement strategies and are therefore more capable of compensating for internal and external perturbations and ultimately to maintain local dynamic stability (14). This motor capacity is also thought to be related to health status, with insufficient stability or exaggerated variability increasing the risk of developing musculoskeletal injuries, which could explain at least partly why novice runners are at considerably higher risk for running-related injuries than experienced runners (10).
The study has therefore clinical implications that can be of interest to coaches and health care practitioners who work with athletes or physically active patients. In particular, when supervising a novice runner or when in a return-to-sport phase of a runner's rehabilitation, it appears to be important to achieve or retrieve optimal levels of local dynamic stability. This can be performed in parallel to the development of other physical capacities, such as strength training, but might be more important in first place compared to being able to run a certain distance at a certain speed. Achieving such skills could specifically be practiced, for example, by using nonlinear pedagogy methods (45). In particular, varying the running speeds in training might be of particular benefit to train local dynamic stability under varying conditions and become less affected by them, such as the runners from the Exp group of this study.
In conclusion, this study showed that experienced runners have better local dynamic stability in the lower limbs' sagittal kinematics than novice runners. Moreover, this difference is present at preferred running speed, but also in slower and faster speeds. These findings support the view that achieving optimal levels of local dynamic stability is important in sports and clinical practice to safely progress in running.
The datasets presented in this article are not readily available due to ethical reason data is not available. Requests to access the datasets should be directed to YWRyaWVuLmNlcnJpdG9AYmZoLmNo.
The studies involving humans were approved by Address:Gesundheits-, Sozial- und Integrationsdirektion des Kantons Bern (GSI)—Kantonale Ethikkommission, Murtenstrasse 31, Hörsaaltrakt Pathologie, Eingang 43A, Büro H372, 3010 Bern,U3dpdHplcmxhbmRpbmZvLmtla0BiZS5jaA==. The studies were conducted in accordance with the local legislation and institutional requirements. The participants provided their written informed consent to participate in this study.
AC: Conceptualization, Data curation, Formal analysis, Investigation, Methodology, Project administration, Resources, Software, Supervision, Visualization, Writing – original draft, Writing – review & editing. LW: Conceptualization, Data curation, Formal analysis, Investigation, Methodology, Validation, Visualization, Writing – original draft, Writing – review & editing. KS: Investigation, Project administration, Supervision, Validation, Writing – review & editing.
The author(s) declare that no financial support was received for the research and/or publication of this article.
The authors declare that the research was conducted in the absence of any commercial or financial relationships that could be construed as a potential conflict of interest.
All claims expressed in this article are solely those of the authors and do not necessarily represent those of their affiliated organizations, or those of the publisher, the editors and the reviewers. Any product that may be evaluated in this article, or claim that may be made by its manufacturer, is not guaranteed or endorsed by the publisher.
The Supplementary Material for this article can be found online at: https://www.frontiersin.org/articles/10.3389/fspor.2025.1387934/full#supplementary-material
1. Outdoor Foundation. Outdoor Recreation Participation Report (2018). Available at: http://oia.outdoorindustry.org/2018-Participation-Report (Accessed December 29, 2020).
2. Lamprecht M. Sport Schweiz 2014—sportaktivität und Sportinteresse der Schweizer Bevölkerung. Magglingen, Switzerland: Bundesamt für Sport BASPO (n.d.).
3. Lamprecht M, Bürgi R, Stamm H. Sport Schweiz 2020: Sportaktivität und Sportinteresse der Schweizer Bevölkerung. Magglingen: Bundesamt für Sport BASPO (2020).
4. Lee D, Brellenthin AG, Thompson PD, Sui X, Lee I-M, Lavie CJ. Running as a key lifestyle medicine for longevity. Prog Cardiovasc Dis. (2017) 60:45–55. doi: 10.1016/j.pcad.2017.03.005
5. Oswald F, Campbell J, Williamson C, Richards J, Kelly P. A scoping review of the relationship between running and mental health. IJERPH. (2020) 17:8059. doi: 10.3390/ijerph17218059
6. Basso JC, Suzuki WA. The effects of acute exercise on mood, cognition, neurophysiology, and neurochemical pathways: a review. Brain Plast. (n.d.) 2:127–52. doi: 10.3233/BPL-160040
7. Gibala MJ, Rakobowchuk M. Physiological adaptations to training. Olympic Textbook Sci Sport. (2008) 15:56–69. doi: 10.1002/9781444303315.ch4
8. Gómez-Molina J, Ogueta-Alday A, Stickley C, Cámara J, Cabrejas-Ugartondo J, García-López J. Differences in spatiotemporal parameters between trained runners and untrained participants. J Strength Cond Res. (2017) 31:2169–75. doi: 10.1519/JSC.0000000000001679
9. Jiang X, Xu D, Fang Y, Bíró I, Baker JS, Gu Y. PCA of running biomechanics after 5 km between novice and experienced runners. Bioengineering. (2023) 10:876. doi: 10.3390/bioengineering10070876
10. Videbæk S, Bueno AM, Nielsen RO, Rasmussen S. Incidence of running-related injuries per 1000 h of running in different types of runners: a systematic review and meta-analysis. Sports Med. (2015) 45:1017–26. doi: 10.1007/s40279-015-0333-8
11. Bartlett R, Wheat J, Robins M. Is movement variability important for sports biomechanists? Sports Biomech. (2007) 6:224–43. doi: 10.1080/14763140701322994
12. Van Oeveren BT, De Ruiter CJ, Beek PJ, Van Dieën JH. The biomechanics of running and running styles: a synthesis. Sports Biomech. (2021) 23(4):516–54. doi: 10.1080/14763141.2021.1873411
14. Harrison SJ, Stergiou N. Complex adaptive behavior and dexterous action. Nonlinear Dyn Psychol Life Sci. (2015) 19:345–94.26375932
15. Frank NS, Prentice SD, Callaghan JP. Local dynamic stability of the lower extremity in novice and trained runners while running intraditional and minimal footwear. Gait Posture. (2019) 68:50–4. doi: 10.1016/j.gaitpost.2018.10.034
16. Hoenig T, Hamacher D, Braumann K-M, Zech A, Hollander K. Analysis of running stability during 5000 m running. Eur J Sport Sci. (2019) 19:413–21. doi: 10.1080/17461391.2018.1519040
17. Hollander K, Hamacher D, Zech A. Running barefoot leads to lower running stability compared to shod running—results from a randomized controlled study. Sci Rep. (2021) 11:4376. doi: 10.1038/s41598-021-83056-9
18. Garcin M, Fleury A, Ansart N, Mille-Hamard L, Billat V. Training content and potential impact on performance: a comparison of young male and female endurance-trained runners. Res Q Exerc Sport. (2006) 77:351–61. doi: 10.1080/02701367.2006.10599369
19. Matos S, Clemente FM, Silva R, Pereira J, Cancela Carral JM. Performance and training load profiles in recreational male trail runners: analyzing their interactions during competitions. Int J Environ Res Public Health. (2020) 17:8902. doi: 10.3390/ijerph17238902
20. Zeng Z, Liu Y, Li P, Wang L. Validity and reliability of inertial measurement units measurements for running kinematics in different foot strike pattern runners. Front Bioeng Biotechnol. (2022) 10:1005496. doi: 10.3389/fbioe.2022.1005496
21. Wang W, Qu F, Li S, Wang L. Effects of motor skill level and speed on movement variability during running. J Biomech. (2021) 127:110680. doi: 10.1016/j.jbiomech.2021.110680
22. Faul F, Erdfelder E, Buchner A, Lang A-G. Statistical power analyses using G*power 3.1: tests for correlation and regression analyses. Behav Res Methods. (2009) 41:1149–60. doi: 10.3758/BRM.41.4.1149
23. Leboeuf F, Baker R, Barré A, Reay J, Jones R, Sangeux M. The conventional gait model, an open-source implementation that reproduces the past but prepares for the future. Gait Posture. (2019) 69:235–41. doi: 10.1016/j.gaitpost.2019.04.015
24. Hafer JF, Freedman Silvernail J, Hillstrom HJ, Boyer KA. Changes in coordination and its variability with an increase in running cadence. J Sports Sci. (2016) 34:1388–95. doi: 10.1080/02640414.2015.1112021
25. Burch S. Association between running technique, running economy and history of injury in trained female runners—a pilot study (Master’s thesis). Eidgenössische Technische Hochschule Zürich (2022).
26. Blättler M. Is Decreased Movement Coordination Variability Associated with Larger Acute Transient Achilles Tendon Changes After a Bout of Running? A Pilot Study. Eidgenössische Technische Hochschule Zürich (2023).
27. Raffalt PC, Kent JA, Wurdeman SR, Stergiou N. Selection procedures for the largest Lyapunov exponent in gait biomechanics. Ann Biomed Eng. (2019) 47:913–23. doi: 10.1007/s10439-019-02216-1
28. Mehdizadeh S, Sanjari MA. Effect of noise and filtering on largest Lyapunov exponent of time series associated with human walking. J Biomech. (2017) 64:236–9. doi: 10.1016/j.jbiomech.2017.09.009
29. Winter L, Taylor P, Bellenger C, Grimshaw P, Crowther RG. The application of the Lyapunov exponent to analyse human performance: a systematic review. J Sports Sci. (2024) 41(22):1994–2013. doi: 10.1080/02640414.2024.2308441
32. Miles J, Shevlin M. Applying Regression and Correlation a Guide for Students and Researchers. London: Sage Text UK (2001).
33. Aghaie Ataabadi P, Sarvestan J, Alaei F, Yazdanbakhsh F, Abbasi A. Linear and non-linear analysis of lower limb joints angle variability during running at different speeds. Acta Gymn. (2021) 51:e2021.023. doi: 10.5507/ag.2021.023
34. Rotstein A, Inbar O, Berginsky T, Meckel Y. Preferred transition speed between walking and running: effects of training status. Med Sci Sports Exerc. (2005) 37:1864–70. doi: 10.1249/01.mss.0000177217.12977.2f
35. Kelso JAS. The Haken–Kelso–Bunz (HKB) model: from matter to movement to mind. Biol Cybern. (2021) 115:305–22. doi: 10.1007/s00422-021-00890-w
36. Yang F, King GA. Dynamic gait stability of treadmill versus overground walking in young adults. J Electromyogr Kinesiol. (2016) 31:81–7. doi: 10.1016/j.jelekin.2016.09.004
37. Van der Kruk E, Reijne MM. Accuracy of human motion capture systems for sport applications; state-of-the-art review. Eur J Sport Sci. (2018) 18:806–19. doi: 10.1080/17461391.2018.1463397
38. Kong PW, Candelaria NG, Tomaka J. Perception of self-selected running speed is influenced by the treadmill but not footwear. Sports Biomech. (2009) 8:52–9. doi: 10.1080/14763140802629990
39. Voigt M, Hansen EA. The puzzle of the walk-to-run transition in humans. Gait Posture. (2021) 86:319–26. doi: 10.1016/j.gaitpost.2021.03.035
40. Strongman C, Morrison A. Evaluating dynamic similarity of fixed, self-selected and anatomically scaled speeds in non-linear analysis of gait during treadmill running. Hum Mov Sci. (2021) 76:102768. doi: 10.1016/j.humov.2021.102768
41. De Ruiter CJ, Verdijk PWL, Werker W, Zuidema MJ, De Haan A. Stride frequency in relation to oxygen consumption in experienced and novice runners. Eur J Sport Sci. (2014) 14:251–8. doi: 10.1080/17461391.2013.783627
42. Correia CK, Machado JM, Dominski FH, De Castro MP, De Brito Fontana H, Ruschel C. Risk factors for running-related injuries: an umbrella systematic review. J Sport Health Sci. (2024) 13:793–804. doi: 10.1016/j.jshs.2024.04.011
43. Hunter B, Karsten B, Greenhalgh A, Burnley M, Muniz-Pumares D. The application of non-linear methods to quantify changes to movement dynamics during running: a scoping review. J Sports Sci. (2023) 41:481–94. doi: 10.1080/02640414.2023.2225014
44. Komar J, Seifert L, Thouvarecq R. What variability tells US about motor expertise: measurements and perspectives from a complex system approach. Mov Sport Sci. (2015) 89:65–77. doi: 10.1051/sm/2015020
Keywords: running, local dynamic stability, kinematics, lower extremities, motor control
Citation: Cerrito A, Wittwer L and Schmitt K-U (2025) The effect of running experience and speed on local dynamic stability in running. Front. Sports Act. Living 7:1387934. doi: 10.3389/fspor.2025.1387934
Received: 18 February 2024; Accepted: 10 March 2025;
Published: 3 April 2025.
Edited by:
Joao R. Vaz, Egas Moniz School of Health & Science, PortugalReviewed by:
Phil Hayes, Northumbria University, United KingdomCopyright: © 2025 Cerrito, Wittwer and Schmitt. This is an open-access article distributed under the terms of the Creative Commons Attribution License (CC BY). The use, distribution or reproduction in other forums is permitted, provided the original author(s) and the copyright owner(s) are credited and that the original publication in this journal is cited, in accordance with accepted academic practice. No use, distribution or reproduction is permitted which does not comply with these terms.
*Correspondence: Adrien Cerrito, YWRyaWVuLmNlcnJpdG9AYmZoLmNo
Disclaimer: All claims expressed in this article are solely those of the authors and do not necessarily represent those of their affiliated organizations, or those of the publisher, the editors and the reviewers. Any product that may be evaluated in this article or claim that may be made by its manufacturer is not guaranteed or endorsed by the publisher.
Research integrity at Frontiers
Learn more about the work of our research integrity team to safeguard the quality of each article we publish.