 Hadi Sotudeh
- Social Networks Lab, Department of Humanities, Social and Political Sciences, ETH Zürich, Zürich, Switzerland
This paper reviews the principles employed to identify team tactical formations in association football, covering over two decades of research based on event and tracking data. It first defines formations and discusses their history and importance. It then introduces the preprocessing and team/position-level principles. Preprocessing includes match segments and normalized locations followed by data representation using various options, such as average locations, hand-engineered features, and graphs for the team-level and relative locations, distributions, and images for the position-level approaches. Either of them is later followed by applying templates or clustering. Among the limitations for future research to address is the reliance on spatial rather than temporal aggregation, which bases formation identification on newly introduced coordinates that may not be available in raw tracking data. Assuming a fixed number of outfield players (e.g., 10) fails to address scenarios with fewer players due to red cards or injuries. Additionally, accounting for phases of play is crucial to provide more practical context and reduce noise by excluding irrelevant segments, such as set pieces. The existing formation templates do not support arrangments with more or fewer players in each horizontal line (e.g., 6-3-1). On the other hand, clustering forces new observations to be described with previously learned clusters, preventing the possibility of discovering emerging formations. Lastly, alternative evaluation methods should have been explored more rigorously, in the absence of ground truth labels. Overall, this study identifies assumptions, consequences, and drawbacks associated with formation identification principles to structure the body of knowledge and establish a foundation for the future.
Introduction
The success of the Roman Triplex Acies formation in ancient battles (1) and the power efficiency of migratory birds' V-shaped flight (2) are just two examples that demonstrate the benefits of collective behavior. Formations have also been studied in other domains, including transportation (3), robotics (4), space exploration (5), video games (6), choreography (7), and sports such as American football (8), field hockey (9), handball (10), and association football1 (11).
In football, formations have been present since the early versions, as evidenced by available drawings from a festive match played in Italy in 1688, which depict team arrangements on the field, including players' defined distances (12). After the codification of football and its split from rugby in 1863, the first observed formations were 2-2-6, 1-2-7, and 2-3-5 (pyramid). Historically, formations have been modified to balance defensive and offensive capabilities while adapting to rule changes such as offside in 1925. Arsenal's 3-2-2-3 (W-M) from the 1930s, Brazil's 4-2-4 in the 1950s, and the 4-2-3-1 formation used in recent decades are a few examples of this continuous evolution (11) because there is no optimal formation as each has its pros and cons (13, 14).
We define “formation”2 as an abstraction summarizing each team's spatial arrangement on the pitch over a match using labels (16) that are usually short to communicate useful and relevant information to the target audience in a consistent manner. While this definition means there is no requirement for a standard and unified set of these labels, they are commonly reported using three to five digits denoting the number of outfield players from defense to attack in each horizontal line3 usually in a symmetric manner, like 4-4-2 (four defenders, four midfielders, and two attackers), as shown in Figure 1.
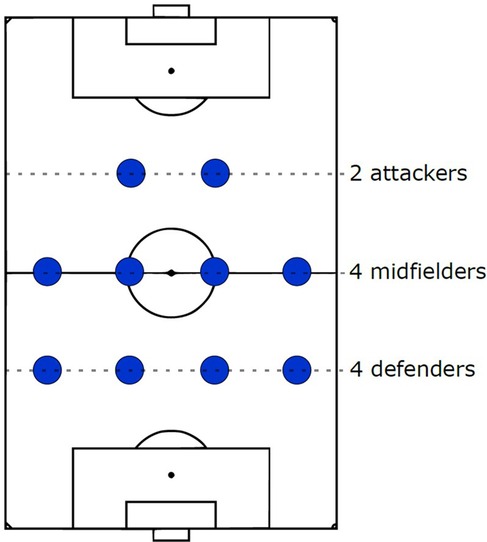
Figure 1. A (symmetric) 4-4-2 formation.
Formations can change in a match for various reasons (18) including the match score (19), coach instructions (20), substitutions (21), tactical position4 switches, match phases (22–25), opponent (26), mental pressure, injuries, and yellow/red cards. This definition aligns with football as a dynamic interaction process (27) and contrasts with the traditional belief that formations are fixed throughout a match, as reported in “starting formation”5 graphics in media and history books (11, 28).
Formations are important to ensure a team operates cohesively, without confusion or delay, while taking advantage of each player's abilities and conserving energy. Therefore, players' confidence is boosted and they can inflict maximum damage on their opponents while remaining less susceptible to attacks (1). Moreover, it serves as a reference (29) for players to remember their organization and responsibilities when distracted (30), helps coaches reduce communication overhead, and shapes the team's collective behavior by creating desired scenarios (31), such as passing options and numerical superiorities. All these reasons could explain why formations are covered in coaching programs, interviews (22, 32–34), training sessions (20), dressing room discussions (35), and media (36).
Formations are also among the first considerations in opposition analysis (13, 20), as highlighted by the spygate incident (37). This is because coaches have the freedom to choose any6 formation consisting of a goalkeeper and six to ten other starting players to counter opponents (11, 39–41). In addition, there are other factors that can influence a formation choice such as the skills of available players (19), tradition (11), recent results (42), coach and club's principles (43), league (30, 44), home or away (45), and pitch elevation (46).
Goal
Formation analysis is often carried out qualitatively (47) relying on previous matches using isolated observations (16), most seen arrangements (48), or only out-of-possession moments (49, 50) resulting in a time-consuming and subjective process (51). For instance, comparing the starting formations recorded by two industry data providers for the 2022 Men's World Cup shows only a 65% agreement (52, 53) highlighting the lack of ground truth formation labels (54).
To address these issues, dozens of data-driven studies have been conducted over the past decades to identify formations in a more automated, scalable, and objective manner. These solutions also can have player/coach recruitment in addition to performance and match analysis applications such as studying the relationship between formation choice and various success metrics (e.g., goals, expected goals, scoring zone entries) (30, 55, 56), examining the physical load implications of different formations (57–59), and comparing the identified formations with the instructed ones. Ideally, these approaches, given data availability, can also support real-time applications for media, fans, and specifically the coaching staff to facilitate in-game interventions.
Given the ongoing interest in this problem and the time required to get informed about the relevant developments and their limitations, we recognized the need for a survey on the subject of “formation identification principles in football using event and tracking data” to structure the body of knowledge, prevent redundant efforts, and establish a foundation for future research.
Method
Our survey is not a systematic review but rather an extensive overview of the principles used to identify football formations7 using event and tracking data8 in the past decades9. We put together similar attempts for each principle found in academic papers, presentations, books, theses, and patents starting with the seminal publications in football and their reference lists. Next, we monitored sources that cited the initial publications and subsequently expanded them to relevant principles from other sports and fields.
In summary, these principles are preprocessing the input data, followed by choosing either the team or position level. Regardless of the choice, there is a data representation and identification step followed up by evaluation. The goal at the team level is to directly report the formation for the entire team while the position level first starts by identifying individual player positions and then maps the set of those positions to a formation label using a pre-defined lookup table. Therefore, this survey also covers tactical position identification methods relevant to formation identification.
An overview of these principles and their concepts is depicted in Figure 2. Each step is explained through the remainder sections and subsections of this paper.
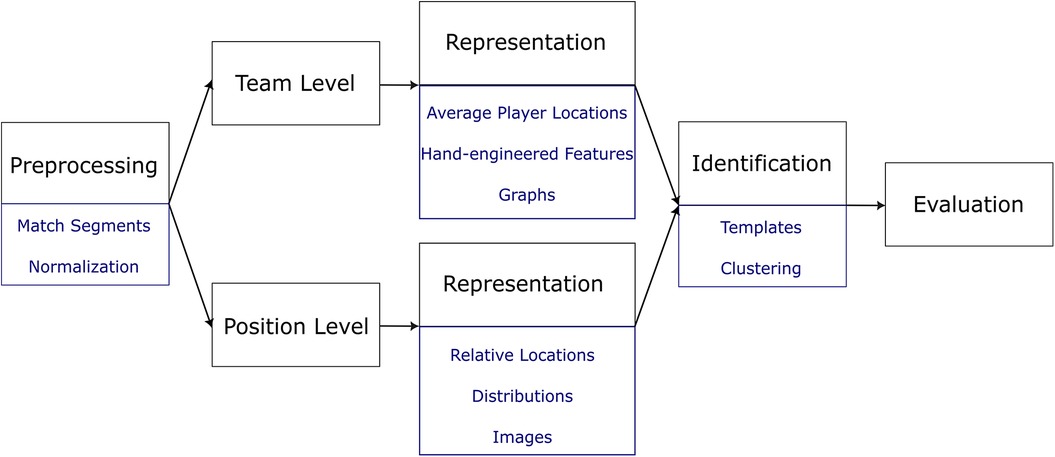
Figure 2. Overview of the formation identification principles.
Data
In this section, we introduce the event and tracking data sources. Event data is used only in “Match Segments” while tracking data is employed in all steps shown in Figure 2.
Event data
The event data commonly includes on-ball actions such as passes, throw-ins, shots, and fouls during a match, often with timestamps, locations, involved players, and other relevant attributes. The collection of event data can be traced back to the 1950s when Charles Reep began recording its basic elements occasionally with pen and paper (69). Today, event data is typically recorded by computer-assisted professional annotators (70).
Tracking data
The second source is the time series of the ball and player locations obtained through optical tracking cameras installed in the stadiums (71), radar-based systems such as Global Positioning System (GPS) sensors worn by players and inside the ball (72), or computer vision and deep learning models applied to TV footage (73). A tracking dataset with 25 frames per second results in more than three million records per match (74).
Preprocessing
In this section, the input data is preprocessed by transforming teams to have a consistent attacking direction (e.g., from bottom to top) to negate the effect of half-time side switches, or ignoring the goalkeeper locations, as they may not be relevant. Moreover, the pitch sizes are standardized since they can differ per stadium10. The other preprocessing tasks are explained in “match segments” or “normalized locations” subsections.
Match segments
Since formations can change throughout a match, as mentioned in the introduction, it is necessary to divide the match time into segments, known as phases of play, to report formations. For each phase, coaches instruct their teams to deploy a set of customized principles and arrangements (76, 77). While defining these segments is subjective, there are commonalities among the previous approaches seen in the literature, coaching textbooks, and match reports (78). For example, the England Football Association's training and coaching guide from 1967 introduced the attack (in-possession), defense (out-of-possession), and preparation (transition) phases (77). The transition phase can be divided into attack to defense and vice versa (79). Additionally, set-pieces are considered a separate phase by some coaches because a considerable proportion of goals comes from them (80).
One major difference among these approaches is how the in and out-of-possession phases are divided into smaller sub-phases. For instance, whether to base the division on when each of the opposite team's attack, midfield, and defense lines is broken (81) or to divide the pitch into tactical zones such as the first, middle, and last third of the field (20). This latter approach is reflected in the training grounds of some professional teams to guide player positioning and direction during training sessions (82).
To provide more context, formations should be reported per segment and previous studies operationalized it using a combination of event or tracking data:
1. Fixed time intervals, such as per match half (83) five-minute windows (84), and 15-minute windows subdivided in case of a substitution (85, 86).
2. In and out of possession sequences (25, 87) such as two-minute windows of each separately (88) with tweaks to discard interruptions, short sequences, and some seconds after throw-ins, free kicks, corners, and penalties (89) or consider only sub-windows bigger than five seconds to ignore transitions, and end the time window due to a substitution or half-time break (88).
3. Identification of common in and out-of-possession subphases such as build-up, and low/mid/high blocks using ball zone changes (90) or a Convolutional Neural Network (CNN) trained on labeled tracking data frame visualizations (55).
4. Change point identification by applying g-segmentation on Delaunay adjacency matrices (91), or planarity testing on the graph representation (92) to find distinct intervals (55, 93).
Match segments play a crucial role in identifying formations by excluding segments that have a different nature, such as set pieces. These aspects were overlooked in earlier attempts until recently (55). Additionally, these segments provide more context taking into account the team's arrangement concerning the opponent's influence and ball location, such as build-up (opposed/unopposed) (78). Analyzing segments will also allow one to discuss relevant sub-formations in each phase rather than focusing solely on the overall team arrangement. For instance, it is common to describe a team's build-up as 3–2 (three in the back and two in the middle).
Normalization
The objective here is to report formations regardless of their on-pitch location (89). For example, Figure 3 illustrates a 4-4-2 formation in various regions and to classify them as the same formation, certain studies have utilized one or both of the following steps, which are part of the Procrustes analysis (94), a statistical shape analysis method with a long history in biology (95).
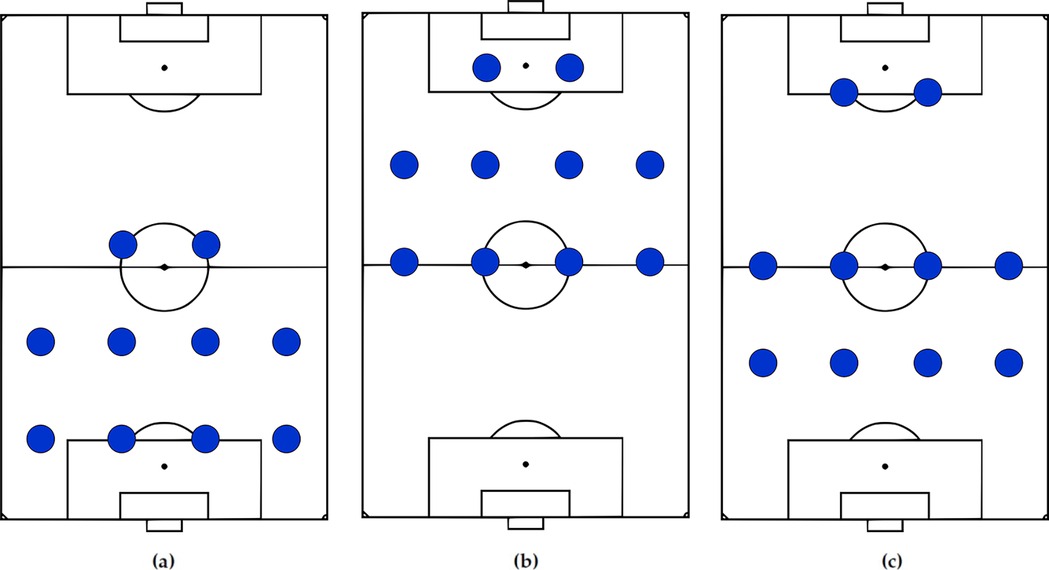
Figure 3. A 4-4-2 in defense (a), attack (b), and with two attackers playing higher up on the pitch (c). All these arrangements should ideally be reported as 4-4-2. While the normalization step can handle (a) and (b), it may result in reporting (c) as a different formation.
In translation, the locations of each team's players are relocated with a constant vector (e.g., team centroid or common k-nearest neighbor11) to the pitch center (89, 93, 98, 99). To treat compact and narrow formations the same, scaling methods such as min-max (31, 89, 100), scaling to range (101), and division by standard deviation (45, 83, 91, 102–105) are employed.
However, it is crucial to mention that the normalization methods result in unintended transformations of player locations. For instance, applying min-max normalization to an unorthodox 4-4-2, depicted in Figure 3c, where two attackers are located significantly higher up, may not achieve the desired outcome of categorizing it as the same formation as the other 4-4-2 formations shown in Figures 3a,b (106). Therefore, it is desired to achieve the same objective by the other pipeline steps.
Team level
Representation
The team-level formation representation should have the following properties:
1. Distinguishing Power: It should differ for distinct formations.
2. Uniqueness: The same formation should have a single and consistent representation.
3. Robustness: Small player location changes that do not alter the formation should not affect the representation.
In addition to the raw 2D coordinate vector (107), the following approaches have been proposed:
Average Player Locations is the simplest and most common representation (25, 85, 108, 109) in media and reports, as shown in Figure 4. However, a limitation of this representation is that compactness will be interpreted as a direct consequence of averaging. For instance, if a player switches from left to right during the first half, taking average locations per half would locate the player near the pitch center, which is not correct (25, 102) and results in misleading statements (110, 111). One possible mitigation is to compute averages over smaller windows. However, the appropriate time length will depend on the player's position change rate and remains unknown.
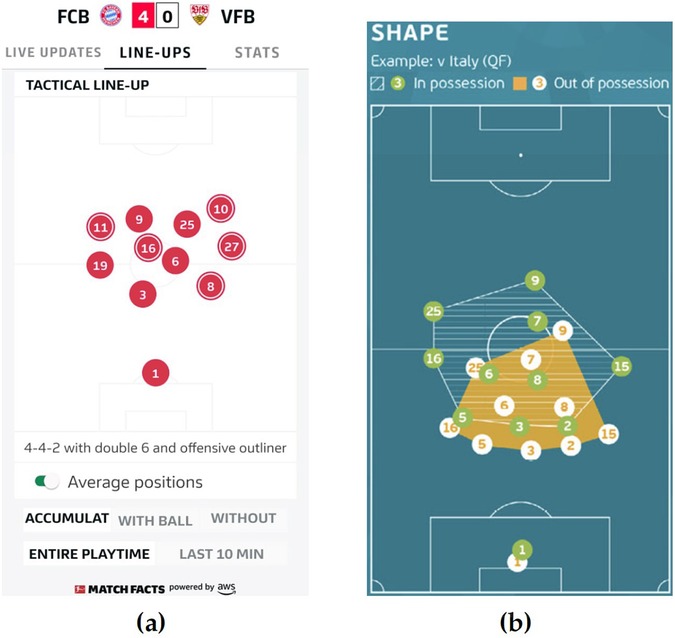
Figure 4. Examples of player average locations seen in the German Bundesliga's official mobile application (112) in (a) and UEFA's technical report (113) in (b).
Hand-engineered Features where relevant indicators for formations such as team centroid, range (83), convex hull, spread, stretch (114), the distance between the farthest players (115), or team heatmaps (116) are computed. For instance, Figure 5 depicts an grid placed around a team, resulting in an vector where a cell records the presence or absence of at least one player. The primary burden here remains the identification of relevant features.
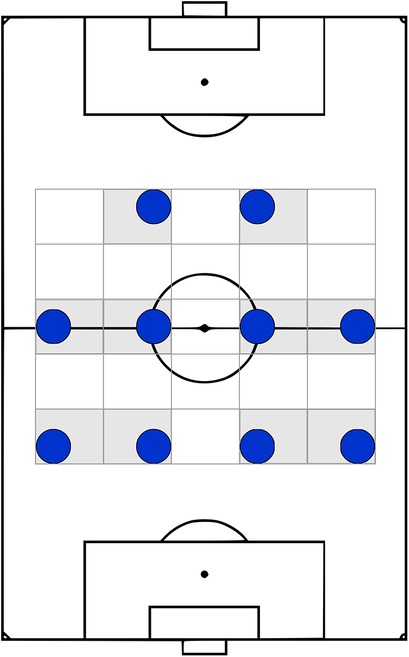
Figure 5. A 5 × 5 grid, inspired by (117), with gray cells indicating the presence of at least one player. This produces a vector of length 25 (5 × 5) to represent the team's arrangement.
Graphs representation assumes a set of relations (i.e., edges) among players that can describe their spatial organizations, seen through tracking data, by neighborhood structure rather than aggregated spatial distributions. For a team with n players, there are a maximum of directed or undirected relations ignoring self-loops, as shown in Figure 6a (118, 119). Since not all of these relations are relevant, previous studies applied heuristics to well-known graphs, such as minimum spanning trees, nearest-neighbor graphs (10, 92, 120–126), and Delaunay triangulation (DT) (104, 105, 127, 128)12 to only consider neighborhood relations. Two examples of them are depicted in Figures 6b,c.
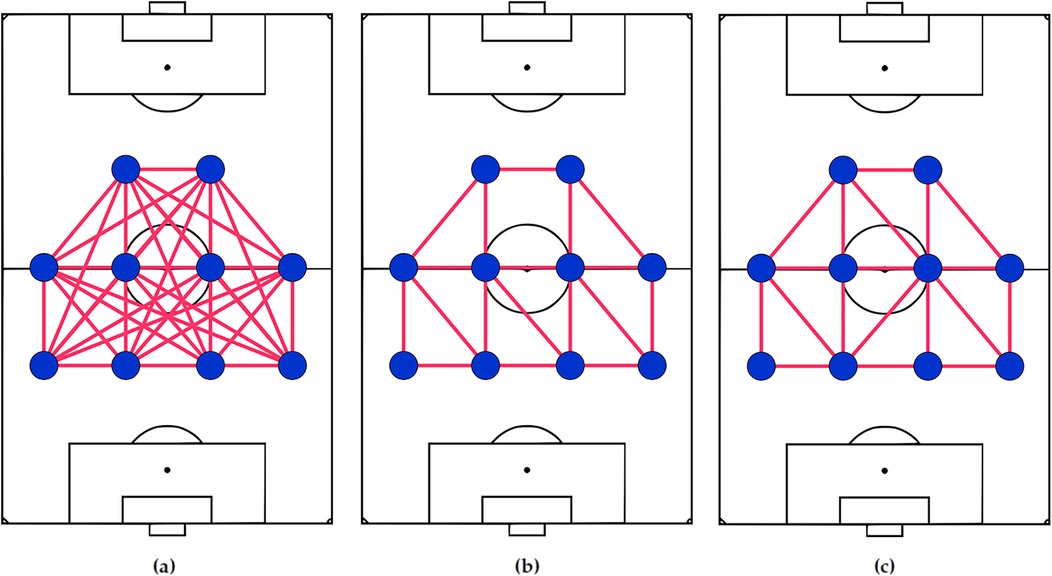
Figure 6. A 4-4-2 representation as a complete undirected graph (a), a union of minimum and second minimum spanning trees (b) presented in (82), and delaunay triangulation (c) proposed in (104). Considering the properties a team-level representation should have, a complete graph (a) can’t distinguish formations since all players are connected. The algorithms producing (b) and (c) do not guarantee a unique answer and are not robust against small player location changes that don’t affect the team's formation.
These options have also been successful for similar applications in biometrics such as fingerprint (131–134), palmprint (135), and face identification (136). Additionally, these representations can incorporate inter-team and intra-team relationships when considering both teams together. Coaches have used similar graph representations as a tool for visual communication, too (137).
The primary obstacle lies in identifying the relevant relations. Tactical zones drawn on training grounds serve as just one reference for players to arrange themselves on the pitch and there are other references to consider, such as space (77), ball, goals (77), teammates and opposition players, field markings, nearest players (55), and passing options (77, 121). Moreover, some of these graph-based representations such as DT suffer from (1) a lack of a unique solution and (2) susceptible to minor player location changes, leading to errors in identifying the same formations and inconsistent results.
To the best of our knowledge, previously published formation studies did not consider addressing these two drawbacks when proposing graph-based representations.
Identification
To assign formations at the team level, both template-based and clustering approaches have been explored, as discussed below. Typically, formations are identified by matching frames or game segments to the most similar template or cluster. A more robust approach, inspired by match analysts' methods and overlooked by previous studies, involves using only frames or segments that exhibit 100% similarity with a template or cluster. Frames that do not fully align can be categorized as transitions, variations, or new formation labels based on similarity scores. Forcing non-perfect matches into predefined templates or clusters will introduce noise and obscure the results.
Templates are inspired by common labels like 4-4-2. This option involves preparing a list of formation templates and matching them to the most similar label. The matching process can be accomplished through similarity functions or machine learning algorithms.
Examples of similarity functions are Euclidean-based distances (83, 89, 138), graph edit distance (139), the Freeman code (140, 141), and the sum of element-wise differences divided by the maximal possible distance (84, 142, 143). Machine learning algorithms, such as neural networks, support vector machines, and decision trees, are also employed in some of those attempts (100, 107, 115, 117, 144–150).
One difficulty here is maintaining a consistent and up-to-date list of these templates because of (1) differences across the sources and (2) emergence of new formations over time. For example, Table 1 shows the formations listed by three well-known industry data providers (52, 151, 152). The matching agreement among these providers is just 30% (13 out of 44). This comparison highlights the subjective nature of these labels. Additionally, the FIFA video game series offers 52 formations (153), providing variations to the same label, such as 4-4-2 flat and holding, because players can be arranged in different ways while still using the same label (20).
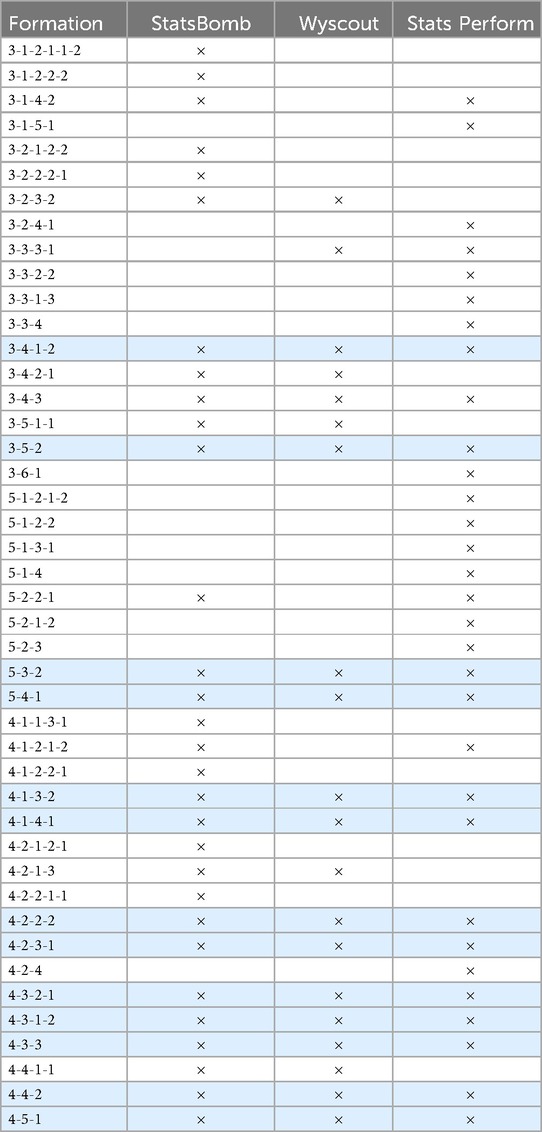
Table 1. Comparison of three data providers’ 44 formations shows 30% agreement (colored rows).
A notable observation about these predefined formation templates is their symmetry, as seen in Figure 1 and coaching documents reported before. However, this assumption appears unrealistic when it comes to player arrangements observed through tracking data.
Clustering avoids the difficulties explained in the template-based option and is not restricted to a set of predefined labels. It focuses on learning formations directly from tracking data by inferring the number of players in each horizontal (i.e., defense, midfield, and attack) or vertical (flank) line directly, as shown in Figure 1. Various clustering algorithms, such as complete-linkage (154), K-means (92, 155, 156), Jenks natural breaks optimization & (157), Percentage (101), FOREL (158), and team width/length-based (159), have been proposed to cluster players' x and y coordinates separately per frame. The number of lines can be determined by setting a fixed number (e.g., three) or using optimization methods like the elbow or silhouette method.
Position level
Several studies focused on reporting team formations bottom-up by starting from smaller units called positions13, which are defined based on where on the pitch players spend most of their match time. Positions are commonly communicated with labels such as center back and right midfield, as shown in Figure 7, for an example.
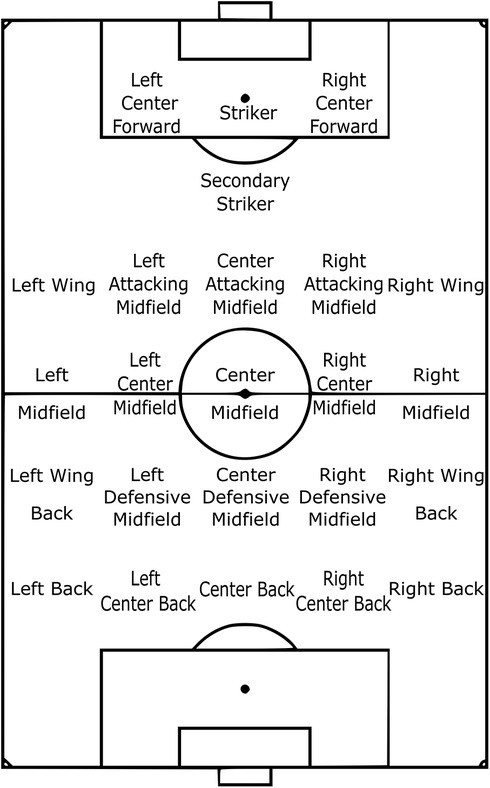
Figure 7. The outfield tactical position locations documented by StatsBomb (52).
The reason behind considering positions rather than player identifiers is that players can swap positions, be substituted or sent off during a match, or differ across matches while the set of all possible positions on the pitch remains fixed. Similar to the team-level approach, an appropriate data representation is chosen and later either template or clustering is applied to identify positions. The key assumption employed in the position-level approach is that no two teammates can occupy the same position simultaneously (9). Therefore, a one-to-one mapping is applied to assign either a template or cluster position by solving the assignment problem (161).
Similar to Table 1, we compiled the list of position labels from the same three industry data providers see Table 2 by merging labels with identical descriptions or spatial arrangements on the pitch. This comparison shows a 79% agreement, indicating a stronger consensus than for formations.
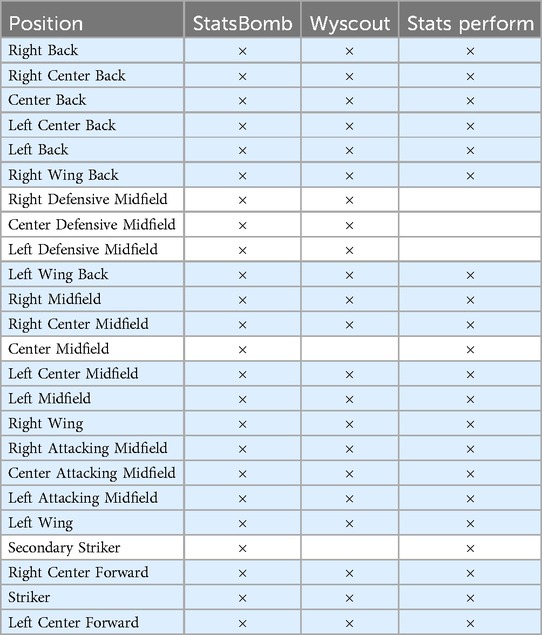
Table 2. Comparison of three data providers’ 24 outfield positions shows 79% agreement (colored rows).
Representation
Player position data representation proposals apart from the 2D coordinate vectors can be classified into the following categories:
Relative Locations are based on how position labels have been named relative to each other. For instance, a left back in a 4-4-2 formation is located to the left of the center backs (45). This approach describes a position using statistics relative to the other players (8) such as the percentage of teammates located in the front, behind, right, and left angle bins (83), as depicted in Figure 8a, the division into 16 instead of four (162, 163), or the amount of created angles (50, 164).
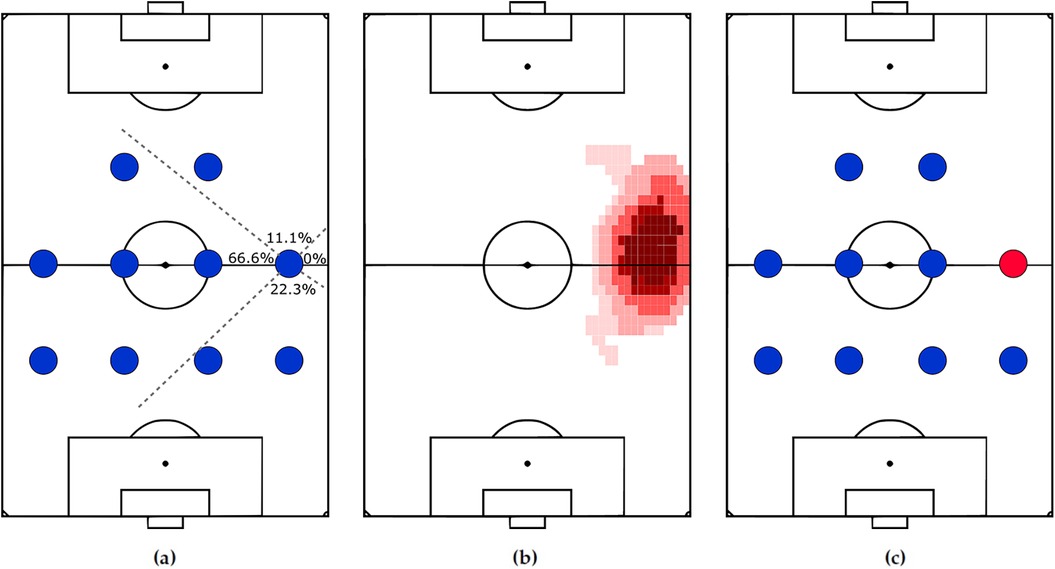
Figure 8. A right midfielders’ representation using relative locations (a), heatmap (b), and color-coded image (c).
Distributions such as bivariate normal distributions (88) and normalized heatmaps containing players' occupancy probabilities (83, 165), as shown in Figure 8b.
Images can capture a position's spatial arrangement, as proposed in (99) and shown in Figure 8c to serve as input for image classifiers.
Identification
Similar to the team level, the position-level identification approaches are templates and clustering.
Templates ensure adherence to common position labels. This approach assigns the representation to a predefined set of position templates using one of the following methods:
1. Rule-based such as defining arbitrary pitch regions (home areas) for each position. When a player moves outside the designated area, the position is updated accordingly (166, 167).
2. Similarity functions such as Chi-square distance for the relative locations representation and naive Bayes as a distance function on the log probabilities of the heatmaps (83).
3. Machine learning algorithms such as ResNet on images of color-coded positions, see Figure 8c (99).
The issues discussed for the template-based approach at the team level are also valid here.
Clustering moves away from the template issues and various clustering algorithms (78) such as k-means (9, 31, 45, 51, 83, 87, 102, 168–171), Gaussian mixture models (25, 103, 172–175), and hierarchical agglomerative (25, 55, 88, 91, 96, 97, 104, 175–179) have been applied. To determine the number of position clusters, different numbers of clusters (87), dendrogram (88, 105), or a combination of them along with video/match analysts' inputs were considered (55).
Evaluation
Regardless of the approach, previous studies have generally fallen short in terms of reporting their accuracy, execution time, and required storage. This is understandable given the variations in validation datasets, evaluation metrics, labeling quality, granularity, and expert interpretations (106).
While quantitative evaluation in this area remains difficult due to the lack of ground truth in sports analytics (180), there are other aspects to an evaluation, as suggested for mathematical models in general and sports analytics ones in particular (181, 182). We divide them into design and qualitative categories.
In design, aspects such as realistic assumptions, output robustness to small input data changes, output stability over time, reproducibility, and interpretability can be covered. In the qualitative category, one can address whether the outputs behave as expected in known and boundary scenarios and if the results are intuitive, insightful, and actionable for practitioners (183).
Discussion & conclusion
While the definition of formations remains an ill-defined problem, we aimed to provide more clarity by defining them as the spatial arrangement of players on the field. Our paper offers an overview of more than 20 years of research on team tactical formations starting from the late 1990s in simulated robotic soccer and American football. The importance of formations is highlighted through opposition analysis, training sessions, and media coverage and the formation identification still is carried out qualitatively to a large extent by counting the number of players in each horizontal line overlooking the vertical disposition.
The main principles were structured as first preprocessing and later taking either a team or position-level approach. The two main concepts employed in the preprocessing step were match segments and normalized locations. The objective of dividing the match time into smaller windows, known as phases of play, is to move beyond reporting one fixed formation for the entire match. Normalized locations aimed to report the same formation for the same arrangements, regardless of where they occurred. However, the potential unintended consequences were not fully understood. Moreover, the same objective can be achieved through other steps of the pipeline without the need for normalization.
After preprocessing, two different paths were followed: The team-level approach looks at a whole team at once while the position level starts with positions as smaller units to build on. In both, the first step is data representation and later, the detection using either qualitatively labeled data (templates) or clustering methods.
Among the data representation options, average locations were the simplest and most commonly used. However, they lead to misleading statements due to the natural outcome of compactness resulting from averaging. When utilizing hand-engineered features or graph representations, it is crucial to carefully select the elements to include in those representations. These elements should align with the references coaches use to instruct team arrangements. Additionally, the representation should be unique for the same arrangements, or arrangements that are not distinguishable due to small player location differences.
After data representation in the team or position levels, formation identification has been achieved by employing domain knowledge through templates or relying on data through clustering. While templates are relatable to public understanding and can be widely accepted, preparing a list of labels and qualitatively assessing them could be cumbersome, especially since there is no worldwide consensus and they change over time. This could be why some adopted clustering to bypass the issues associated with templates. Clustering avoids these issues but on the other hand, requires tracking data of a large number of matches and will limit the future observations to be mapped to one of the existing formation clusters seen in the selected set of matches.
Since our comparison has shown more consensus in position labels than formations, we suggest carefully considering match segments and choosing the position-level approach. For data representation, a graph choice seems reasonable because it can achieve the objectives of the normalization step without facing its drawbacks. When deciding between templates or clustering, it is important to consider the drawbacks of each.
The limitations identified in each step were documented in their respective sections and Table 3 highlights the major ones. Future research can address these limitations and then provide the most value by reporting identified formations and player tactical positions over match time, incorporating contextual factors such as phases of play, substitutions, red cards, scoreline, halftime, and stoppage breaks to reveal formation and position dynamics. Finally, large-scale studies could identify patterns across leagues, seasons, coaches, and teams, as well as how formations counter each other, considering relevant success factors. These advancements will also significantly influence sports science studies that focus on physical load monitoring.
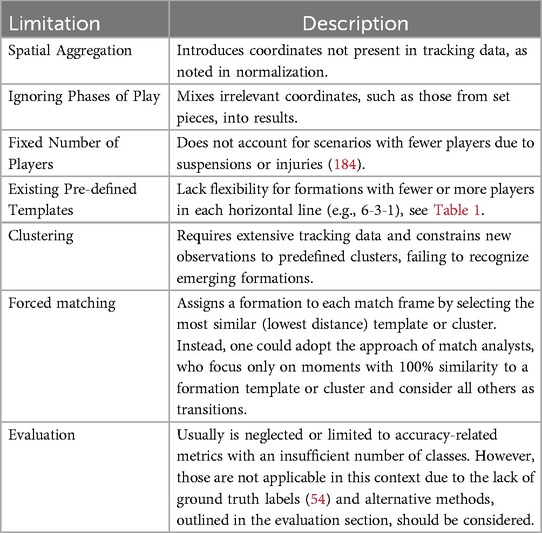
Table 3. Some recognized limitations of previous studies.
Author contributions
HS: Writing – original draft, Writing – review & editing.
Funding
The author(s) declare financial support was received for the research, authorship, and/or publication of this article. This research was supported through ETH Grant ETH-012 21-2 to Ulrik Brandes.
Acknowledgments
We would like to acknowledge Ulrik Brandes, Hugo Fabrègues, and the anonymous reviewers for their valuable input, as well as the assistance of ChatGPT 3.5, an AI language model by OpenAI, for the cohesive and concise text revision.
Conflict of interest
The author declares that the research was conducted in the absence of any commercial or financial relationships that could be construed as a potential conflict of interest.
Generative AI statement
The authors declare that Generative AI was used in the creation of this manuscript. As stated in the acknowledgment section, ChatGPT 3.5 is only used for cohesive and concise text revision and nothing else.
Publisher's note
All claims expressed in this article are solely those of the authors and do not necessarily represent those of their affiliated organizations, or those of the publisher, the editors and the reviewers. Any product that may be evaluated in this article, or claim that may be made by its manufacturer, is not guaranteed or endorsed by the publisher.
Footnotes
1. ^Association/European football or soccer from hereafter is just referred to it as “football”.
2. ^The same term has also been used to describe the selection of the best team under specific constraints (15), which is not the subject of this paper. Therefore, we used “tactical formation” in the title to avoid this confusion. In this context, tactical does not mean intended formations but observed ones through data. Hereafter, we will refer to it simply as “formation”.
3. ^One can find exceptions where the emphasis is given to the vertical lines, as seen in 2-7-2 denoting the number of players from left to right (17). The digits in this case sum up to 11 as the goalkeeper is also considered.
4. ^The term "tactical position", often communicated with labels such as center back and right midfield, typically refers to where players spend most of their match time on the pitch. Since "position" is also used in the literature for player locations (coordinates) from tracking data, we added the adjective "tactical" to avoid confusion.
5. ^These graphics are analysts’ educated guesses based on the starting players’ list in addition to players’ tactical positions and team formations from previous matches, as the team officials do not announce their formation.
6. ^There is no restriction on the formation choice in the Laws of the Game (38).
7. ^Excluding studies focused on specific team segments, like defenders (60, 61).
8. ^Excluding studies that relied on direct video or image analysis (62–65), as well as partial TV broadcast tracking data (66) because recent advances have allowed for generating full tracking data (67).
9. ^The earliest attempts we found date back to the late 1990s in RoboCup and American football (8, 68).
10. ^However, the common pitch standardization methods result in distorted player locations (75).
11. ^Inspired by players’ alignments with nearest teammates (88, 96, 97).
12. ^In which players in adjacent Voronoi cells (“dominant regions”) are connected (129, 130).
13. ^Some use the term “role“ to refer to the position (87, 91, 160).
References
2. Weimerskirch H, Martin J, Clerquin Y, Alexandre P, Jiraskova S. Energy saving in flight formation. Nature. (2001) 413(6857):697–8. doi: 10.1038/35099670
3. Anderson M, Robbins A. Formation flight as a cooperative game. In: Guidance, Navigation, and Control Conference and Exhibit. American Institute of Aeronautics and Astronautics (1998). p. 244–51. doi: 10.2514/6.1998-4124
4. Ahn HS. Formation Control: Approaches for Distributed Agents. Cham: Springer (2020). (Studies in Systems, Decision and Control; vol. 205). doi: 10.1007/978-3-030-15187-4
5. Hadaegh F, Beard R. Constellation Templates: An Approach to Autonomous Formation Flying. (1998). Available online at: https://hdl.handle.net/2014/19186 (Accessed January 3, 2025).
6. van der Heijden M, Bakkes S, Spronck P. Dynamic formations in real-time strategy games. IEEE Symposium on Computational Intelligence and Games (2008). p. 47–54
7. Beck S, Doerr N, Kurzhals K, Riedlinger A, Schmierer F, Sedlmair M, et al. Choreovis: planning and assessing formations in dance choreographies. Comput Graph Forum. (2024) 43(3):e15104. doi: 10.1111/cgf.15104
8. Lazarescu M, Venkatesh S. On the Recognition of American Football Formations from Images. Sydney: University of Sydney (2000). p. 261–4. Available online at: https://hdl.handle.net/10536/DRO/DU:30044790
9. Lucey P, Bialkowski A, Carr P, Morgan S, Matthews I, Sheikh Y. Representing and discovering adversarial team behaviors using player roles. IEEE Conference on Computer Vision and Pattern Recognition (2013). p. 2706–13
10. Pozo A, Gracía J, Patricio MA, Molina JM. A structured representation to the group behavior recognition issue. In: Molina JM, Corredera JRC, Pérez MFC, Ortega-García J, Barbolla AMB, editors. User-Centric Technologies and Applications. Berlin, Heidelberg: Springer (2011). p. 47–57. doi: 10.1007/978-3-642-19908-0_6
11. Wilson J. Inverting the Pyramid: The History of Soccer Tactics. New York, NY: Bold Type Books (2013).
12. di Bini PL, Nacci F, Cecchini A, Matini P, Stamperia di S.A.S. alla Condotta. Memorie del Calcio Fiorentino : Tratte da Diverse Scritture e Dedicate All’ Altezze Serenissime di Ferdinando Principe di Toscana e Violante Beatrice di Baviera. Firenze: Nella Stamperia di S.A.S. alla Condotta (1688). Available online at: http://archive.org/details/memoriedelcalcio00bini (cited July 27, 2022).
14. Otero-Saborido FM, Torreblanca-Martinez S, Torreblanca-Martinez V, Nevado-Garrosa F, Nuñez-Campos M, González-Jurado JA. Three-defender versus two-defender systems in football: a comparison of offensive play. Proc Inst Mech Eng Pt P J Sports Eng Technol. (2023). doi: 10.1177/17543371231178043
15. Marcolino LS, Jiang AX, Tambe M. Multi-agent team formation: diversity beats strength? Proceedings of the Twenty-Third international Joint Conference on Artificial Intelligence. AAAI Press (2013). p. 279–85. Available online at: https://dl.acm.org/doi/10.5555/2540128.2540170 (cited September 4, 2022).
16. van der Leij J. Formation. Football Philosophy. (2019). Available online at: http://footballphilosophy.org/encyclopedia/formation (cited February 10, 2023).
17. The Coaches’ Voice. Thiago Motta’s tactics and style of play. (2024). Available online at: https://coachesvoice.com/cv/thiago-mottas-tactics-and-style-of-play (cited July 11, 2024).
18. Forcher L, Preine L, Forcher L, Wäsche H, Jekauc D, Woll A, et al. Shedding some light on in-game formation changes in the German Bundesliga: frequency, contextual factors, and differences between offensive and defensive formations. Int J Sports Sci Coach. (2023) 18(6):2051–60. doi: 10.1177/17479541221130054
19. Rossi E. Cause ed effetti della scelta e delle variazioni del sistema di gioco [Master thesis for first category coaches]. Italian Football Federation (2002). Available online at: https://figc.it/it/tecnici/aula-multimediale/documenti/cause-ed-effetti-della-scelta-e-delle-variazioni-del-sistema-di-gioco (cited December 12¸2022).
21. Wittkugel J, Memmert D, Wunderlich F. Substitutions in football - what coaches think and what coaches do. J Sports Sci. (2022) 40(15):1668–77. doi: 10.1080/02640414.2022.2099177
22. Bate A, Wright N, Thornton T. Sky Sports. (2023). Tactics of the future: Marauding ‘keepers, no formations and all-round players. Available online at: https://skysports.com/football/story-telling/11095/12929273/the-inside-view-on-the-tactics-of-tomorrow (cited August 25, 2023).
23. Estrella W. El Futbolero US. (2023). Hours before playing against Newcastle, the words of the PSG coach that would make Mbappé angry. Available online at: https://elfutbolero.us/news/Hours-before-playing-against-Newcastle-the-words-of-the-PSG-coach-that-would-make-Mbappe-angry-20231127-0035.html (cited November 28, 2023 ).
24. FIFA. FIFA Training Centre. (2021). Formations. Available online at: https://www.fifatrainingcentre.com/en/game/tournaments/olympic-football-tournament/woft/formations.php (cited February 27, 2023).
25. Whitmore J, Seidl T. Stats Perform. (2021). Shape Analysis: Automatically Detecting Formations. Available online at: https://statsperform.com/resource/shape-analysis-automatically-detecting-formations (cited January 20, 2022).
26. Steve Holland • Champions League tactics, Chelsea 1 Barcelona 0 • Masterclass. (2020). Available online at: https://youtube.com/watch?v=mPlfKlbKe2o (cited December 28, 2022).
27. Lames M, Hermann S, Prüßner R, Meth H. Football match dynamics explored by recurrence analysis. Front Psychol. (2021) 12:747058. doi: 10.3389/fpsyg.2021.747058
28. Cox MW. Zonal Marking: From Ajax to Zidane, the Making of Modern Soccer. New York, NY: Bold Type Books (2019).
29. 2nd Brazilian football evolution week. (2017). Available online at: https://youtube.com/watch?v=xZW6tnY2Gbw (cited April 7, 2022).
30. Buchheit M, Settembre M, Tarascon A, Hader K, Stokes A, Munro A, et al. Know-your-own-league context: insights for player preparation and recruitment—Part 1: Team formations. (2023). Available online at: https://sportperfsci.com/know-your-own-league-context-insights-for-player-preparation-and-recruitment-part-1-team-formations (cited March 30, 2023).
31. Lüttecke M. Well Formatted: Understanding Team Behavior Through Formation Analysis (master thesis). University of Konstanz (2021).
32. Chelsea & Brentford managers Potter & Frank interview EACH OTHER! | Brentford vs Chelsea | Pre Match. (2022). Available online at: https://youtube.com/watch?v=siQpMWfJTr4 (cited October 20, 2022).
33. Spalletti L. I did my thesis on 3-5-2. (2024). Available online at: https://www.beinsports.com/en-us/soccer/uefa-european-championship-3/articles/i-did-my-thesis-on-3-5-2--spalletti-rages-at-talk-of-formation-pact-with-italy-players-2024-06-25 (cited January 20, 2025).
34. Sean Dyche • Key principles of the 4-4-2 formation and how he used it at Burnley • Masterclass. (2023). Available online at: https://youtube.com/watch?v=o3YY7PY-IH0 (cited February 10, 2023).
35. Altschäff T, Falk C. sportbild. (2023). Diese Zettel brachten Wende: SPORT BILD enthüllt Bayerns Taktik-Revolution!. Available online at: https://sportbild.bild.de/bundesliga/vereine/bayern-muenchen/diese-zettel-brachten-wende-sport-bild-enthuellt-bayerns-taktik-revolution-83199754.sport.html (cited January 20, 2025).
36. Smith A. Sky Sports. (2022). Man City formation in Liverpool defeat disputed by Gary Neville and Jamie Carragher. Available online at: https://skysports.com/football/news/11095/12722772/man-city-formation-in-liverpool-defeat-disputed-by-gary-neville-and-jamie-carragher (cited October 17, 2022).
37. talkSPORT. Marcelo Bielsa: The full transcript of Leeds manager’s incredible press conference addressing “spygate”. (2019). Available online at: https://talksport.com/football/efl/475976/marcelo-bielsa-leeds-full-transcript-incredible-press-conference-spygate (cited January 20, 2025).
38. The International Football Association Board. Laws of the Game 2020/21. Zurich: International Football Association Board (2020). Available online at: https://digitalhub.fifa.com/m/5371a6dcc42fbb44/original/d6g1medsi8jrrd3e4imp-pdf.pdf (cited April 19, 2022).
39. Biermann C. Football Hackers: The Science and Art of a Data Revolution. London: Blink Publishing (2019).
40. Dodgshon AS. Tactical formation matchups associated with the outcome of soccer matches (master Thesis). University of New Brunswick (2020). Available online at: https://unbscholar.lib.unb.ca/handle/1882/14046 (cited January 20, 2025).
41. Thomas Frank REVEALS his tactics for facing the “big six”. (2023). Available online at: https://youtube.com/watch?v=Rzfk1i3YKaQ (cited September 19, 2023 ).
42. Mesoudi A. Cultural evolution of football tactics: strategic social learning in managers’ choice of formation. Evol Hum Sci. (2020) 2:14. doi: 10.1017/ehs.2020.27
43. Kormelink H, Seeverens T. The Coaching Philosophies of Louis van Gaal and the Ajax Coaches. 1st ed. Philadelphia: Reedswain Books & Videos (1997).
44. Gonzalez-Rodenas J, Moreno-Perez V, Campo RLD, Resta R, Coso JD. Evolution of tactics in professional soccer: an analysis of team formations from 2012 to 2021 in the Spanish LaLiga. J Hum Kinet. (2023) 88:207–16. doi: 10.5114/jhk/167468
45. Bialkowski A, Lucey P, Carr P, Yue Y, Matthews I. Win at home and draw away: automatic formation analysis highlighting the differences in home and away team behaviors. Proceedings of the MIT Sloan Sports Analytics Conference (2014). p. 8. Available online at: https://researchgate.net/publication/261760499_Win_at_Home_and_Draw_Away_Automatic_Formation_Analysis_Highlighting_the_Differences_in_Home_and_Away_Team_Behaviors (cited July 14, 2022).
46. Valencia-Aguirre OH, Bravo-Navarro WH, Loaiza-Dávila LE, Valencia-Cárdenas MH. Incidence of tactical formations on the results of soccer matches played at altitude. Retos. (2023) 50:408–14. doi: 10.47197/retos.v50.96852
47. spielverlagerung. (2022). Available online at: https://spielverlagerung.com (cited April 22, 2022).
48. Thompson M. Get Goalside. (2020). Is this the death of formations (as we know them)? Available online at: https://getgoalsideanalytics.com/12015746-is-this-the-death-of-formations-as (cited February 3, 2023).
49. Foschi L. Analisi del 4-1-4-1 con prevalenza alla fase di non possesso (UEFA Pro License Thesis). Italian Football Federation (2007). Available online at: https://figc.it/it/tecnici/aula-multimediale/documenti/analisi-del-4-1-4-1-con-prevalenza-alla-fase-di-non-possesso (cited December 12, 2022).
50. Thompson M. High-fat data for low(er)-fat costs. Get Goalside. (2023). Available online at: https://getgoalsideanalytics.com/high-fat-data-for-low-er-fat-costs (cited February 16, 2023).
51. Lucey P, Bialkowski A, Carr GP, Matthews I, Yue Y. Analysis of team behaviors using role and formation information. US10062033B2. (2018). Available online at: https://patents.google.com/patent/US10062033B2 (cited January 31, 2022).
52. StatsBomb. open data. (2023). Available online at: https://github.com/statsbomb/open-data/tree/master/doc (cited March 28, 2024).
53. Wyscout. Football Professional Videos and Data Platform. (2023). Available online at: https://wyscout.com (cited April 27, 2023).
54. Sotudeh H. On tactical formations reported by media. (2024). Available online at: https://linkedin.com/posts/hadisotudeh_football-sports-tv-activity-7262124623218020352-dTn4 (cited December 19, 2024).
55. Bauer P, Anzer G, Shaw L. Putting team formations in association football into context. J Sports Anal. (2023) 9(1):39–59. doi: 10.3233/JSA-220620
56. Forcher L, Forcher L, Jekauc D, Wäsche H, Woll A, Gross T, et al. How coaches can improve their Teams’ match performance—the influence of in-game changes of tactical formation in professional soccer. Front Psychol. (2022) 13:11. doi: 10.3389/fpsyg.2022.914915
57. Forcher L, Forcher L, Wäsche H, Jekauc D, Woll A, Altmann S. The influence of tactical formation on physical and technical match performance in male soccer: a systematic review. Int J Sports Sci Coach. (2023) 18(5):1820–49. doi: 10.1177/17479541221101363
58. Morgans R, Radnor J, Fonseca J, Haslam C, King M, Rhodes D, et al. Match running performance is influenced by possession and team formation in an English premier league team. Biol Sport. (2024) 41(3):275–86. doi: 10.5114/biolsport.2024.135414
59. Modric T, Carling C, Lago-Peñas C, Sarmento H, Veršić S, Pajonková F, et al. It is not (all) about running faster, opponent also plays; the effect of opposition team formation on running performance in professional soccer match-play. Int J Perform Anal Sport. (2024) 0(0):1–15. doi: 10.1080/24748668.2024.2430099
60. Horton M. Algorithms for the Analysis of Spatio-Temporal Data from Team Sports (PhD thesis). The University of Sydney (2018). Available online at: https://ses.library.usyd.edu.au/handle/2123/17755 (cited 2022 July 19)
61. Kim HC, Kwon O, Li KJ. Spatial and spatiotemporal analysis of soccer. In: Proceedings of the 19th ACM SIGSPATIAL International Conference on Advances in Geographic Information Systems. ACM Press (2011). p. 385.
62. Atmosukarto I, Ghanem B, Ahuja S, Muthuswamy K, Ahuja N. Automatic recognition of offensive team formation in American football plays. IEEE Conference on Computer Vision and Pattern Recognition Workshops (2013). p. 991–8
63. Atmosukarto I, Ghanem B, Saadalla M, Ahuja N. Recognizing team formation in American football. In: Moeslund T, Thomas G, Hilton A, editors. Computer Vision in Sports. Cham: Springer (2014). p. 271–91. doi: 10.1007/978-3-319-09396-3_13
64. Hess R, Fern A. Toward Learning Mixture-of-parts pictorial Structures. Oregon: ICML Workshop on Constrained Optimization and Structured Output Spaces (2007). Available online at: http://videolectures.net/icml07_fern_tlm (cited July 19, 2022).
65. Hess R, Fern A, Mortensen E. Mixture-of-Parts pictorial structures for objects with Variable part sets. IEEE International Conference on Computer Vision (2007). p. 1–8
66. Mortensen J. Statistical methods for tracking data in sports (PhD thesis). Simon Fraser University (2020). Available online at: https://summit.sfu.ca/item/20806 (cited July 19, 2022).
67. Omidshafiei S, Hennes D, Garnelo M, Wang Z, Recasens A, Tarassov E, et al. Multiagent off-screen behavior prediction in football. Sci Rep. (2022) 12(1):8638. doi: 10.1038/s41598-022-12547-0
68. Stone P, Veloso M. Layered approach to learning client behaviors in the robocup soccer server. Appl Artif Intell. (1998) 12(2–3):165–88. doi: 10.1080/088395198117811
69. Pollard R. Charles reep (1904–2002): pioneer of notational and performance analysis in football. J Sports Sci. (2002) 20(10):853–5. doi: 10.1080/026404102320675684
70. Pappalardo L, Cintia P, Rossi A, Massucco E, Ferragina P, Pedreschi D, et al. A public data set of spatio-temporal match events in soccer competitions. Sci Data. (2019) 6(1):236. doi: 10.1038/s41597-019-0247-7
71. StatsPerform. SportVU. (2022). Available online at: https://statsperform.com/team-performance/football-performance/optical-tracking (cited February 14, 2022).
72. Catapult. Vector. (2022). Available online at: https://catapultsports.com/solutions/vector (cited February 14, 2022).
73. SkillCorner. A New World of Performance Insight from Video Tracking Technology. (2020). Available online at: https://medium.com/skillcorner/a-new-world-of-performance-insight-from-video-tracking-technology-f0d7c0deb767 (cited February 14, 2022).
74. Kovalchik SA. Player tracking data in sports. Annu Rev Stat Appl. (2023) 10(1):677–97. doi: 10.1146/annurev-statistics-033021-110117
75. Brandes U. A goal-aligned coordinate system for invasion games. J Sports Anal. (2023) 9(4):261–71. doi: 10.3233/JSA-220706
76. Pioli S. Le catene di gioco laterali in un 4-4-2 (UEFA pro license thesis). Italian Football Federation. (2003). Available online at: https://figc.it/it/tecnici/aula-multimediale/documenti/le-catene-di-gioco-laterali-in-un-4-4-2 (cited December 5, 2022).
77. Wade A. The F.A. Guide to Training and Coaching. United Kingdom: An official publication of the Football Association (1967). p. 260.
78. High Performance Team of FIFA. Enhanced Football Intelligence Explanation. Zurich: FIFA (2023). Available online at: https://www.fifatrainingcentre.com/media/native/tournaments/womens-world-cup/2023/FIFA%20Enhanced%20Football%20Intelligence%20(EFI)%20Explainations_EN%20v1.1.pdf (cited January 20, 2025).
79. Schweizerischer Fussballverband. Spielsysteme. UEFA C Coaching License Program (2nd day). (2022). Available online at: https://football.ch/portaldata/27/Resources/dokumente/trainer/de/aus-_und_fortbildung/02_uefa_c-diplom/tag_2/06_d_TH_Prinzipien_-_Spielsysteme.pdf (cited December 21, 2022).
80. Rangnick’s coaching philosophy, tactics and data-driven football strategy. (2021). Available online at: https://youtube.com/watch?v=mZskzUKsNwU (cited February 28, 2022).
81. Sportlogiq Phases of play. (2020). Available online at: https://youtube.com/watch?v=gRjZ2wyXp18 (cited March 15, 2023).
82. Sumpter D. Soccermatics: Mathematical Adventures in the Beautiful Game. Dublin: Bloomsbury Sigma (2017). p. 352.
83. Bialkowski AN. Aligning and Characterising Group Behaviours Using Role Information (PhD thesis). Queensland University of Technology (2015). Available online at: https://eprints.qut.edu.au/86706 (cited June 1, 2022).
84. Beernaerts J, Baets BD, Lenoir M, Mey KD, de Weghe NV. Analysing team formations in football with the static qualitative trajectory Calculus. Proceedings of the 6th International Congress on Sport Sciences Research and Technology Support. Science and Technology Publications (2018). p. 15–22
85. Caldeira N, Lopes RJ, Fernandes D, Araujo D. From optical tracking to tactical performance via voronoi diagrams: team formation and Players’ roles constrain interpersonal linkages in high-level football. Sensors. (2023) 23(1):273. doi: 10.3390/s23010273
86. Ma J. An Analysis of Formation Disruption in Soccer (bachelor thesis). Harvard University (2020). Available online at: https://dash.harvard.edu/handle/1/37364766 (cited May 9, 2022).
87. Bialkowski A, Lucey P, Carr P, Matthews I, Sridharan S, Fookes C. Discovering team structures in soccer from spatiotemporal data. IEEE Trans Knowl Data Eng. (2016) 28(10):2596–605. doi: 10.1109/TKDE.2016.2581158
88. Shaw L, Glickman M. Dynamic analysis of team strategy in professional football. (2020). Available online at: https://static.capabiliaserver.com/frontend/clients/barca/wp_prod/wp-content/uploads/2020/01/56ce723e-barca-conference-paper-laurie-shaw.pdf (cited February 14, 2022).
89. Müller-Budack E, Theiner J, Rein R, Ewerth R. “Does 4-4-2 exist?”—an analytics approach to understand and classify football team formations in single match situations. International Workshop on Multimedia Content Analysis in Sports. Association for Computing Machinery (2019). p. 25–33
90. Sormaz M, Nichol D. Quantifying the Impact of off-the-ball movement in Football. London: OptaPro Analytics Forum (2019). Available online at: https://youtube.com/watch?v=IG6LJo5c_6U (cited February 4, 2022).
91. Kim H, Kim B, Chung D, Yoon J, Ko SK. SoccerCPD: formation and role change-point detection in soccer matches using spatiotemporal tracking data. In: ACM SIGKDD Conference on Knowledge Discovery and Data Mining. Association for Computing Machinery (2022). p. 3146–56.
92. Ayanegui H, Ramos F. Recognizing patterns of dynamic behaviors based on multiple relations in soccer robotics domain. In: Ghosh A, De RK, Pal SK, editors. Pattern Recognition and Machine Intelligence. Berlin, Heidelberg: Springer (2007). p. 33–40.
93. Feuerhake U. Detection of changes in groups of moving objects. In: The International Archives of Photogrammetry, Remote Sensing and Spatial Information Sciences. Nice: Copernicus (2022). p. 117–24.
94. Jäger JM, Schöllhorn WI. Identifying individuality and variability in team tactics by means of statistical shape analysis and multilayer perceptrons. Hum Mov Sci. (2012) 31(2):303–17. doi: 10.1016/j.humov.2010.09.005
95. Dryden IL, Mardia KV. Statistical Shape Analysis: With Applications in R. 2nd ed. Oxford: John Wiley & Sons, Ltd (2016). p. 479. Available online at: https://onlinelibrary.wiley.com/doi/10.1002/9781119072492 (cited August 11, 2022).
96. Shaw L. Classifying and analyzing team strategy in professional soccer matches. In: New England Symposium on Statistics in Sports. Massachusetts: Harvard University Science Center (2019). Available online at: https://youtube.com/watch?v=VU4BOu6VfbU (cited April 14, 2022).
97. Shaw L. Using Data to Analyse Team Formations. Using Data to Analyse Team Formations (2019). Available online at: http://eightyfivepoints.blogspot.com/2019/11/using-data-to-analyse-team-formations.html (cited September 10, 2022).
98. Andrienko N, Andrienko G, Barrett L, Dostie M, Henzi P. Space transformation for understanding group movement. IEEE Trans Vis Comput Graph. (2013) 19(12):2169–78. doi: 10.1109/TVCG.2013.193
99. Newman JD. Automated Pre-Play Analysis of American Football Formations Using Deep Learning (master thesis). Brigham Young University (2022). Available online at: http://hdl.lib.byu.edu/1877/etd12454
100. Habibi J, Chiniforooshan E, HeydarNoori A, Mirzazadeh M, Safari MA, Younesy HR. Coaching a soccer simulation team in RoboCup environment. In: Shafazand H, Tjoa AM, editors. Information and Communication Technology. Berlin, Heidelberg: Springer (2002). p. 117–26.
101. Clemente FM, Martins FML, Couceiro MS, Mendes RS, Figueiredo AJ. Developing a football tactical metric to estimate the sectorial lines: a case study. In: Murgante B, Misra S, Rocha AM, Torre C, Rocha JG, Falcão MI, et al., editors. Computational Science and Its Applications. Cham: Springer (2014). p. 743–53.
102. Bialkowski A, Lucey P, Carr P, Yue Y, Sridharan S, Matthews I. Large-scale analysis of soccer matches using spatiotemporal tracking data. IEEE International Conference on Data Mining Workshop (2014). p. 725–30
103. Hobbs J, Holbrook M, Frank N, Sha L, Lucey P. Improved structural discovery and representation learning of multi-agent data. arXiv [Preprint]. (2019) arXiv:1912.13107. doi: 10.48550/arXiv.1912.13107
104. Narizuka T, Yamazaki Y. Characterization of the formation structure in team sports. arXiv [Preprint]. (2018) arXiv:1802.06766. doi: 10.48550/arXiv.1802.06766
105. Narizuka T, Yamazaki Y. Clustering algorithm for formations in football games. Sci Rep. (2019) 9(1):13172. doi: 10.1038/s41598-019-48623-1
106. Boomstra T. Towards automatically classifying football formations for video analysis (master thesis). Utrecht University (2022). Available online at: https://studenttheses.uu.nl/handle/20.500.12932/41653 (cited June 20, 2022).
107. Faria BM, Castillo G, Lau N, Reis LP. Classification of FC portugal robotic soccer formations: a comparative study of machine learning algorithms. International Conference on Mobile Robots and Competitions (2010). p. 4–9. Available online at: http://robotica2010.ipleiria.pt/images/02.1.pdf (cited December 16, 2022).
108. Bundesliga. bundesliga.de—die offizielle Webseite der Bundesliga. (2020). Realformation als neue Echtzeit-Statistik. Available online at: https://bundesliga.com/de/bundesliga/news/realformation-position-aufstllung-taktik-aws-match-facts-echtzeit-statistik-daten-11481 (cited July 28, 2022).
109. DFL. bundesliga.de—die offizielle Webseite der Bundesliga. (2021). Bundesliga Match Facts: Realformation: Trends. Available online at: https://bundesliga.com/de/bundesliga/news/realformation-trends-amazon-web-services-aws-match-facts-daten-formation-aufstellung-taktik-14712 (cited February 14, 2022).
110. FIFA. FIFA Training Centre. (2022). Game Insights Episode 4: Chelsea’s principles of attack in a 3-4-3 system. Available online at: https://www.fifatrainingcentre.com/en/game/game-insights/chelsea_principles_of_attack_in_3_4_3_system.php (cited January 20, 2025).
111. Simon Rolfs. bundesliga.de—die offizielle Webseite der Bundesliga. (2020). Simon Rolfes über den Mehrwert der Realformation. Available online at: https://bundesliga.com/de/bundesliga/news/simon-rolfes-kolumne-realformation-aws-bundesliga-match-facts-taktik-13851 (cited July 27, 2022).
112. DFL. Bundesliga Official App. Frankfurt: DFL Deutsche Fußball Liga GmbH (2024). Available online at: https://play.google.com/store/apps/details?id=com.bundesliga (cited December 18, 2024).
113. UEFA. EURO 2020 Technical Report. (2021). Available online at: https://uefatechnicalreports.com/uefa-euro-2020 (cited February 24, 2022).
114. Low B, Coutinho D, Gonçalves B, Rein R, Memmert D, Sampaio J. A systematic review of collective tactical behaviours in football using positional data. Sports Med. (2020) 50(2):343–85. doi: 10.1007/s40279-019-01194-7
115. Asali E, Negahbani F, Tafazzol S, Maghareh MS, Bahmeie S, Barazandeh S, et al. Namira Soccer 2D Simulation Team Description Paper. (2018). Available online at: https://wrighteagle2d.github.io/robocup/2018/Namira_SS2D_RC2018_TDP.pdf (cited September 14, 2022).
116. Trastelis F. Automatic mapping of football team formation using computer vision (master thesis). University of Piraeus (2022). doi: 10.26267/unipi_dione/2105
117. Visser U, Drücker C, Hübner S, Schmidt E, Weland HG. Recognizing formations in opponent teams. In: Stone P, Balch T, Kraetzschmar G, editors. Robot Soccer World Cup IV. Berlin, Heidelberg: Springer Springer (2001). p. 391–6. doi: 10.1007/3-540-45324-5_44
118. Feuerhake U. Recognition of repetitive movement patterns—the case of football analysis. ISPRS Int J Geoinf. (2016) 5(11):208. doi: 10.3390/ijgi5110208
119. Feuerhake U, Sester M. Mining group movement patterns. ACM SIGSPATIAL International Conference on Advances in Geographic Information Systems. Association for Computing Machinery (2013). p. 520–3
120. Johnson JH, Iravani P. The multilevel hypernetwork dynamics of complex systems of robot soccer agents. ACM Trans Auton Adapt Syst. (2007) 2(2):5-es. doi: 10.1145/1242060.1242062
121. Ramos F, Ayanegui H. Discovering behavior patterns in muti-agent teams. In: Nguyen NT, Jo GS, Howlett RJ, Jain LC, editors. Agent and Multi-Agent Systems: Technologies and Applications. Berlin, Heidelberg: Springer (2008). p. 391–400. doi: 10.1007/978-3-540-78582-8_40
122. Ramos F, Ayanegui H. Tracking behaviours of cooperative robots within multi-agent domains. In: Kordic V, editor. Autonomous Agents. London: IntechOpen (2010). p. 45–64. doi: 10.5772/9658
123. Ramos J, Lopes RJ, Marques P, Araújo D. Hypernetworks reveal compound variables that capture cooperative and competitive interactions in a soccer match. Front Psychol. (2017) 8:1379. doi: 10.3389/fpsyg.2017.01379
124. Ribeiro J, Davids K, Araújo D, Silva P, Ramos J, Lopes R, et al. The role of hypernetworks as a multilevel methodology for modelling and understanding dynamics of team sports performance. Sports Med. (2019) 49(9):1337–44. doi: 10.1007/s40279-019-01104-x
125. Ribeiro J, Garganta J, Davids K, Barreira D. A multilevel hypernetworks approach to assess coordination and communication in player interactions in sports teams as co-evolutionary networks. Braz J Mot Behav. (2020) 14(5):167–70. doi: 10.20338/bjmb.v14i5.216
126. Scotognella F. Simulations of Nearest Teammate-Based Soccer Match-Plays with Different Formations. Preprints. (2021).
127. Bai A, Zhang H, Lu G, Jiang M, Chen X. WrightEagle 2D Soccer Simulation Team Description. (2012). Available online at: https://wrighteagle2d.github.io/tdps/WrightEagle2012_2D_Soccer_Simulation_Team_Description_Paper.pdf (cited September 27, 2022).
128. Mimura T, Nakada Y. Quantification of pass plays based on geometric features of formations in team sports. In: International Symposium on Information and Communication Technology. New York, NY: Association for Computing Machinery (2019). p. 306–13.
129. Okabe A, Boots B, Sugihara K, Chiu SN, Kendall DG. Spatial Tessellations: Concepts and Applications of Voronoi Diagrams. 2nd ed. New Jersey: John Wiley & Sons, Ltd (2000). doi: 10.1002/9780470317013
130. Taki T, Hasegawa J, Fukumura T. Development of motion analysis system for quantitative evaluation of teamwork in soccer games. IEEE International Conference on Image Processing. IEEE (1996). p. 815–8
131. Bebis G, Deaconu T, Georgiopoulos M. Fingerprint identification using delaunay triangulation. International Conference on Information Intelligence and Systems (1999). p. 452–9
132. Hernández-Palancar J, Muñoz-Briseño A, Gago-Alonso A. A new triangular matching approach for latent palmprint identification. In: Ruiz-Shulcloper J, Sanniti di Baja G, editors. Progress in Pattern Recognition, Image Analysis, Computer Vision, and Applications. Berlin, Heidelberg: Springer (2013). p. 294–301.
133. Liang X, Bishnu A, Asano T. A robust fingerprint indexing scheme using minutia neighborhood structure and low-order delaunay triangles. IEEE Trans Inform Forensics Secur. (2007) 2(4):721–33. doi: 10.1109/TIFS.2007.910242
134. Muñoz-Briseño A, Gago-Alonso A, Hernández-Palancar J. Fingerprint indexing with bad quality areas. Expert Syst Appl. (2013) 40(5):1839–46. doi: 10.1016/j.eswa.2012.09.018
135. Bouchemha A, Nait-Ali A, Doghmane N. A robust technique to characterize the palmprint using radon transform and delaunay triangulation. Int J Comput Appl. (2010) 10(10):35–42. doi: 10.5120/1515-1895
136. Chiang J, Wang RC. The application of delaunay triangulation to face recognition. In: National Computer Symp. Taiwan (1997). p. 27–32. Available online at: https://robotix.ah-oui.org/user_docs/2401/Triangulation-to-Face-Recognition.pdf (cited January 20, 2025).
137. Jamie Carragher & Jesse Marsch FULL Monday Night Football Post Match analysis. (2024). Available online at: https://youtube.com/watch?v=OCA16sFn9OU (cited March 7, 2024).
138. Mello F, Ramos L, Maximo M, Roim R, Moura V. ITAndroids 2D Soccer Simulation Team Description. (2013). Available online at: https://wrighteagle2d.github.io/robocup/2013/TDP_ITAndroids.pdf (cited September 13, 2022).
139. Chio TS, Tarn TJ. Rules and control strategies of multi-robot team moving in hierarchical formation. International Conference on Robotics and Automation (2003). p. 2701–6
140. Ayanegui-Santiago H. Recognizing team formations in multiagent systems: applications in robotic soccer. In: Nguyen NT, Kowalczyk R, Chen SM, editors. Computational Collective Intelligence Semantic Web, Social Networks and Multiagent Systems. Berlin, Heidelberg: Springer (2009). p. 163–73.
141. Kai-Cheng Z, Long-Ling Z, Shen-Zhang G, Wen-Jin W, Qi-Yu T, Qin-Zhu L, et al. YuShan 2015 Team Description Paper for RoboCup2015. (2015). p. 6. Available online at: https://wrighteagle2d.github.io/robocup/2015/YuShan2015_TDP.pdf (cited September 14, 2022).
142. Beernaerts J. The use of the Qualitative Trajectory Calculus in sports analytics 9PhD thesis). Ghent University (2019). Available online at: http://hdl.handle.net/1854/LU-8630663
143. D’hulst J. Datagedreven Formatiedetectie in Voetbal met de Static Qualitative Trajectory Calculus en Hiërarchisch Clusteren (mster thesis). KU Leuven (2023). Available online at: https://belgianfootball.s3.eu-central-1.amazonaws.com/s3fs-public/rbfa/docs/pdf/rbfa_knowledge_centre/studies/RBFA_study_52_formation_detection_thesis.pdf (cited October 23, 2024).
144. Almeida R, Reis LP, Jorge AM. Analysis and forecast of team formation in the simulated robotic soccer domain. In: Lopes LS, Lau N, Mariano P, Rocha LM, editors. Progress in Artificial Intelligence. Springer (2009). p. 239–50.
145. Asali E, Valipour M, Zare N, Afshar A, Katebzadeh M, Dastghaibyfard GH. Using machine learning approaches to detect opponent formation. In: Artificial Intelligence and Robotics (IRANOPEN) (2016). Qazvin: IEEE. p. 140–4.
146. Faria BM, Reis LP, Lau N, Castillo G. Machine learning algorithms applied to the classification of robotic soccer formations and opponent teams. IEEE Conference on Cybernetics and Intelligent Systems (2010). p. 344–9
147. Iglesias JA, Ledezma A, Sanchis A. Compare behavior in agent modeling task. Proceedings of the IADIS International Conference Applied Computing. International Association for Development of the Information Society (IADIS) (2006). p. 289–96. Available online at: http://hdl.handle.net/10016/1095
148. Lee GJ, Jung JJ. DNN-based multi-output model for predicting soccer team tactics. PeerJ Comput Sci. (2022) 8:e853. doi: 10.7717/peerj-cs.853
149. Tavafi A, Khodabakhshi V, Nozari N, Shaghelani M, Zare H, Hashemian M. FC-Perspolis 2012 Soccer 2D Simulation Team Description Paper. (2012). p. 6. Available online at: https://wrighteagle2d.github.io/robocup/2013/TDP_FC-Perspolis.pdf (cited September 13, 2022 ).
150. Zare N, Najimi A, Sarvmaili M, Akbarpour A, NaghipourFar M, Barahimi B, et al. CYRUS 2D Simulation Team Description Paper 2017. (2017). Available online at: https://wrighteagle2d.github.io/robocup/2017/TDP_CYRUS.pdf (cited June 23, 2022).
151. Identifying every Premier League team’s preferred shape. (2023). Available online at: https://youtube.com/watch?v=_Sok6gKhgic (cited March 7, 2024).
152. Wyscout. Wyscout API. (2019). Available online at: https://support.wyscout.com/matches-wyid-events (cited March 28, 2024).
153. FIFPlay. FIFA 23 Formations. (2022). Available online at: https://fifplay.com/fifa-23/formations (cited March 29, 2023).
154. Fernández de la Rosa J. A framework for the analytical and visual interpretation of complex spatiotemporal dynamics in soccer (Ph.D. thesis). Polytechnic University of Catalonia (2022). Available online at: http://hdl.handle.net/10803/673529
155. Machado V, Leite R, Moura F, Cunha S, Sadlo F, Comba JLD. Visual soccer match analysis using spatiotemporal positions of players. Comput Graph. (2017) 68:84–95. doi: 10.1016/j.cag.2017.08.006
156. Mizumoto M, Fuzimitsu T, Ebara T, Yamamoto S, Asai H, Ishida A, et al. 2D Soccer Simulation League Team Description Ri-one. (2017). p. 6. Available online at: https://wrighteagle2d.github.io/robocup/2017/TDP_Rione2017.pdf (cited September 14, 2022).
157. Michalczyk K. Stats Perform. 2020. How Impactful Are Line-Breaking Passes? Available online at: https://statsperform.com/resource/how-impactful-are-line-breaking-passes (cited April 7, 2022).
158. Khodos A, Panteleyev M. Formation recognition by clustering-based method in virtual soccer. Proceedings of the 12th Majorov International Conference on Software Engineering and Computer Systems. Saint Petersburg, Russia (2020). p. 12. Available online at: http://ceur-ws.org/Vol-2893/paper_19.pdf (cited June 1, 2022).
159. Parlak D. An Open-Source Implementation of FIFA’s Enhanced Football Intelligence (master thesis). University of Zurich (2023). Available online at: https://capuana.ifi.uzh.ch/publications/PDFs/24098_An_Open_Source_Implementation_of_FIFA_s_Enhanced_Football_Intelligence.pdf (cited January 20, 2025).
160. Desmond R. Explaining the Inverted Winger—player Role Analysis. TheMastermindSite (2022). Available online at: https://themastermindsite.com/2022/09/19/explaining-the-inverted-winger-player-role-analysis (cited August 25, 2023).
161. Kuhn HW. The Hungarian method for the assignment problem. Nav Res Logist Q. (1955) 2(1–2):83–97. doi: 10.1002/nav.3800020109
162. Pleuler D. From fixed to fluid: a model for frame-by-frame player role classification. Carnegie Mellon Sports Analytics Conference (2023). Available online at: https://youtube.com/watch?v=uvH2A5kwRxg (cited June 14, 2024).
163. Pleuler D. Fixed to Fluid: Frame-by-Frame Role Classification. GitHub (2024). Available online at: https://github.com/devinpleuler/research/blob/master/frame-by-frame-position.md (cited June 14, 2024).
164. Vasconcelos DM, Maximo MROA, Tasinaffo PM. An opponent formation classifier for simulated robot soccer. In: Buche C, Rossi A, Simões M, Visser U, editors. RoboCup 2023: Robot World Cup XXVI. Cham: Springer (2024). p. 179–90.
165. Arsenault J, Cunniff M, Tulsky E, Forbes JR. Spatial roles in hockey special teams. J Quant Anal Sports. (2024) 20(3):235–50. doi: 10.1515/jqas-2023-0019
166. Ju W, Doran D, Hawkins R, Evans M, Laws A, Bradley P. Contextualised high-intensity running profiles of elite football players with reference to general and specialised tactical roles. Biol Sport. (2022) 40(1):291–301. doi: 10.5114/biolsport.2023.116003
167. Stone P, Veloso M. Task decomposition, dynamic role assignment, and low-bandwidth communication for real-time strategic teamwork. Artif Intell. (1999) 110(2):241–73. doi: 10.1016/S0004-3702(99)00025-9
168. Bialkowski A, Lucey P, Carr P, Yue Y, Sridharan S, Matthews I. Identifying team style in soccer using formations learned from spatiotemporal tracking data. IEEE International Conference on Data Mining Workshop (2014). p. 9–14
169. Lucey P, Bialkowski A, Carr GP, Matthews I, Sheikh Y. Tracking player role using non-rigid formation priors. US9342785B2. (2016). Available online at: https://patents.google.com/patent/US9342785B2/en (cited January 31, 2022).
170. Lucey P, Sha L, Carr GPK, Matthews IA. Sports formation retrieval. US10140575B2. (2018). Available online at: https://patents.google.com/patent/US10140575B2/en (cited September 13, 2022).
171. Wei X, Sha L, Lucey P, Morgan S, Sridharan S. Large-scale analysis of formations in soccer. International Conference on Digital Image Computing: Techniques and Applications (2013). p. 1–8
172. Hobbs J, Ganguly S, Lucey PJ. System and Method for Predicting Formation in Sports. US20210383123A1. (2021). Available online at: https://patents.google.com/patent/US20210383123A1/en (cited January 31, 2022).
173. Hobbs J, Ganguly S, Lucey PJ. System and Method for Predicting Formation in Sports. 20240185604. (2024). Available online at: https://www.freepatentsonline.com/y2024/0185604.html (cited June 11, 2024).
174. Seidl T, Stöckl M, Lucey PJ. Interactive Formation Analysis in Sports Utilizing Semi-Supervised Methods. 20220254036. (2022). p. 20. Available online at: https://freepatentsonline.com/y2022/0254036.html (cited September 2, 2022).
175. StatsPerform. Edge Analysis. (2021). Available online at: https://statsperform.com/team-performance/football-performance/edge-analysis (cited January 20, 2025).
176. Kriek A. RoboCup formation modeling (master thesis). University of Stellenbosch (2009). Available online at: http://hdl.handle.net/10019.1/2810
177. Riley P, Veloso M, Kaminka G. An empirical study of coaching. In: Asama H, Arai T, Fukuda T, Hasegawa T, editors. Distributed Autonomous Robotic Systems 5. Tokyo: Springer Japan (2002). p. 215–24.
178. Schmid M, Blauberger P, Lames M. Simulating defensive trajectories in American football for predicting league average defensive movements. Front Sports Act Living. (2021) 3:669845. doi: 10.3389/fspor.2021.669845
179. Tong Q, Yao W, Lv W, Zeng D. Analysis of formations and game styles in soccer. IEEE International Workshop on Multimedia Signal Processing (2022). p. 1–5
180. Davis J, Bransen L, Devos L, Meert W, Robberechts P, Van J, et al. Evaluating sports analytics models: challenges, approaches, and lessons learned. CEUR Workshop Proceedings (2022). p. 11. Available online at: http://ceur-ws.org/Vol-3169/paper1.pdf (cited April 16, 2024).
181. Davis J, Bransen L, Devos L, Jaspers A, Meert W, Robberechts P, et al. Methodology and evaluation in sports analytics: challenges, approaches, and lessons learned. Mach Learn. (2024) 113(9):6977–7010. doi: 10.1007/s10994-024-06585-0
183. Wang Z, Veličković P, Hennes D, Tomašev N, Prince L, Kaisers M, et al. TacticAI: an AI assistant for football tactics. Nat Commun. (2024) 15(1):1906. doi: 10.1038/s41467-024-45965-x
184. Muller J. Tottenham’s high line was mad, misguided—and so much fun. The New York Times. 2023. Available online at: https://nytimes.com/athletic/5039030/2023/11/07/tottenham-high-line-ange-postecoglou (cited June 26, 2024).
Keywords: football, soccer, formation, shape, position
Citation: Sotudeh H (2025) The principles of tactical formation identification in association football (soccer) — a survey. Front. Sports Act. Living 6:1512386. doi: 10.3389/fspor.2024.1512386
Received: 16 October 2024; Accepted: 30 December 2024;
Published: 5 February 2025.
Edited by:
Tianbiao Liu, Beijing Normal University, ChinaReviewed by:
Nuno André Nunes, Southampton Solent University, United KingdomFrancesco Scotognella, Polytechnic University of Turin, Italy
Copyright: © 2025 Sotudeh. This is an open-access article distributed under the terms of the Creative Commons Attribution License (CC BY). The use, distribution or reproduction in other forums is permitted, provided the original author(s) and the copyright owner(s) are credited and that the original publication in this journal is cited, in accordance with accepted academic practice. No use, distribution or reproduction is permitted which does not comply with these terms.
*Correspondence: Hadi Sotudeh, aHNvdHVkZWhAZXRoei5jaA==