 Alejandro Bustamante-Garrido1,2,3
 Esteban Aedo-Muñoz3,4
 Ciro Brito5
 Danilo Silva-Esparza6Jorge Pérez-Contreras2,7,8Mikel Izquierdo-Redin1
 Hugo Cerda-Kohler9,10*
- 1Navarrabiomed, Hospitalario Universitario de Navarra (HUN), Universidad Pública de Navarra (UPNA), IdiSNA, Pamplona, Spain
- 2Escuela de Ciencias del Deporte y la Actividad Física, Facultad de Salud, Universidad Santo Tomás, Santiago, Chile
- 3Laboratorio de Biomecánica Deportiva, Unidad de Ciencias Aplicadas al Deporte, Instituto Nacional de Deportes, Ministerio del Deporte de Chile, Santiago, Chile
- 4Escuela de Ciencias de la Actividad Física, el Deporte y la Salud, Facultad de Ciencias Médicas, Universidad de Santiago de Chile, Santiago, Chile
- 5Postgraduate Program of Physical Education, Federal University of Juiz de Fora, Governador Valadares, Belo Horizonte, Brazil
- 6Área física de fútbol formativo de Universidad Católica de Chile – Cruzados SDAP, Santiago, Chile
- 7Escuela de Educación, programa de Magíster en Evaluación y Planificación del Entrenamiento Deportivo, Universidad Viña del mar, Viña del Mar, Chile
- 8Escuela de Doctorado en Investigación Aplicada a las Ciencias Sanitarias, Universidad de las Palmas de Gran Canaria, Las Palmas de Gran Canaria, Spain
- 9Unidad de Fisiología del Ejercicio, Centro de Innovación, Clínica MEDS, Santiago, Chile
- 10Departamento de Educación Física, Deportes y Recreación, Facultad de Artes y Educación Física, Universidad Metropolitana de Ciencias de la Educación, Santiago, Chile
Sprint performance is a critical factor in soccer. While previous studies have extensively explored the biomechanical, physiological, and metabolic determinants of sprinting, the impact of anthropometric variables in team sports contexts, especially soccer, remains underexplored. This study aims to investigate the influence of anthropometric and mechanical variables on sprint performance in young soccer players. Fifty-eight young soccer players were evaluated in anthropometry and a 30-meter (m) sprint using radar technology. Split times in 5, 15, and 30 m were determined, in addition to the assessment of the force-velocity profile proposed by Morin and Samozino. Results: Key anthropometric variables associated with improved sprint performance included lower-limb muscle mass at distances 5 and 15 m (R2 = 0.08 and R2 = 0.09, respectively, both with small effects). Additionally, body composition, particularly a lower % body fat, was crucial across all sprint distances (ES: large). Among the mechanical variables, max power (R2 = 0.997, ES: large) and maximum velocity (R2 = 0.553, ES: large) are the mechanical variables that were most strongly associated with sprint performance over distances greater than 30 m. Soccer coaches, athletic trainers, and strength and conditioning specialists working with young athletes can apply the findings of this study to their training programming.
1 Introduction
Successful soccer performance is influenced by various modifiable physical, physiological, biomechanical, and tactical factors (1). During a soccer match, players must repeatedly alternate between low- and high-intensity efforts, covering large distances with frequent multidirectional movements. These movements often include sprints, jumps, changes of direction, lateral displacements, and quick decelerations (2). Sprinting actions, in particular, are crucial for soccer performance. On average, professional soccer players perform between 27 and 35 sprints per match (3), each lasting 2–4 s (4). These sprints are decisive for critical moments in the game, such as counter-attacks, pressing, and positional advantages (5), and can significantly affect match outcomes.
Accelerating and reaching top speed depends on a complex interplay of physiological, biomechanical, metabolic, and morphological factors (6). Strength, power, and impulse are key biomechanical contributors (6–10). Morphological factors such as body stature and muscle mass influence a player's sprinting capacity (11–13). Additionally, factors like muscle fiber composition (14) and anaerobic capacity (15) affect an athlete's ability to perform repeated high-intensity efforts. While genetic traits, sex, and age inevitably shape physical capacities, combining these unmodifiable factors with trainable attributes ultimately determines performance in soccer. These and other factors encompass a range of variables contributing to sprint performance, as schematically represented in Figure 1. However, research on the impact of morphological factors on speed and acceleration performance still needs to be conducted.
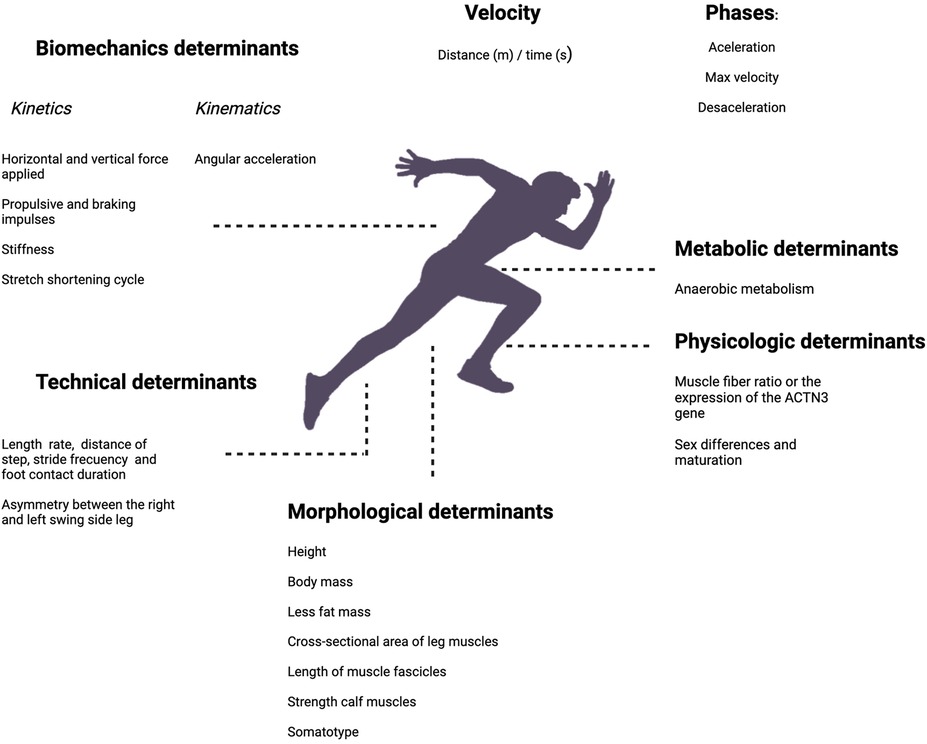
Figure 1. Kinetics: horizontal and vertical force applied (6–9, 16, 17); propulsive and braking impulses (10, 18–20); stiffness (21, 22); stretch-shortening cycle (21, 22), kinematics: angular acceleration (17, 23, 24), technical determinants: step length, rate, and distance, stride frequency and foot contact duration (18); timing of the contralateral arm and leg swing, asymmetry between the right and left swing side leg (25), morphological determinants; height (13), body mass (11, 12), less fat mass (26), cross-sectional area of leg muscles (27–30), length of muscle fascicles (31), strength calf muscles (32), somatotype (33); physiologic determinants: muscle fiber ratio or the expression of the ACTN3 gene (14, 34); sex differences and maturation (13, 35–37), anaerobic metabolism (15).
Regarding anthropometric variables affecting sprint performance, most studies have focused on track and field sprinters rather than team sports athletes (see Figure 1 for references related to morphological determinants). A few studies have identified the anthropometric variables that affect sprinting in team sports such as soccer. For example, body mass (BM), body mass index (BMI), and height (13, 38) have been variables associated with sprint performance. This presents a significant gap in the literature, particularly for soccer, in which the specific demands and context differ markedly from individual sprint events. Our study addressed this gap by examining anthropometric variables influencing young soccer players’ sprint performance. By doing so, we hope to provide insights that will inform training and development strategies tailored to the unique needs of soccer athletes.
2 Materials and methods
2.1 Experiment approach
The assessments were conducted on cadets from Chile's first-division professional soccer teams. These evaluations were part of the battery of tests performed by the staff, and the players signed informed consent and permission for their data to be published. The assessments were carried out following the Declaration of Helsinki standards.
2.2 Participants
Fifty-eight male cadet players (age: 16.05 + 1.46 years, height: 175.14 + 7.10 cm, body mass: 65.78 + 8.26 kg) participated in this study. Goalkeepers were discarded due to the specificity of their positions.
2.3 Anthropometric assessments
All athletes were evaluated in the morning after fasting for 12 h. The assessment of body mass was conducted using a Tanita precision scale, model Bc-601, with a resolution of 0.1 g. Height evaluation was performed using a SECA brand stadiometer with 1 mm precision. A Lufkin brand metal tape measure with an accuracy of 1 mm was employed to measure the body circumferences. Diameter measurements were obtained using a Rosskraft caliper, while skinfold thickness was assessed using a Harpenden caliper. The assessments were performed following the protocols established by ISAK (39) by a certified level II professional.
2.4 Speed-acceleration evaluation 30 m
The 30 m acceleration evaluation was performed on a natural grass soccer field with specific footwear for this surface type. For this, Stalker ATS II model radar (Applied Concepts, Dallas, TX, USA; accuracy + 1.61 km/h, sampling 46.9 Hz) was located on a tripod 10 m from the starting line and at the height of 1 m to align with the location of the center of mass (CM) of the subject (5). The athletes were instructed to initiate a 30 m maximal sprint starting from the standing starting position. Two attempts were performed with 5 min rest between them. Sprint performance metrics (split times at 0–5, 0–15, and 0–30 m) and mechanical outputs were analyzed based on the best time trial performance.
2.5 Horizontal force-velocity profile (FVP)
The speed-time data obtained via radar were processed using the Excel® spreadsheet developed by Morin and Samozino (40). This tool facilitates the computation of the maximum horizontal force exerted during the sprint (F0), maximum velocity (V0), and peak horizontal power output (Pmax). Furthermore, we determined the proportion of the total lower limb force applied horizontally to the ground (RFmax) and the rate of decline in horizontal force with increasing velocity (DRF). This approach relies on the fundamental principles of motion to establish the force-velocity relationship utilizing athlete velocity and body mass (41). Radar validity for these purposes was confirmed through comparison with force platforms (absolute bias of 3%–7%) (42). In terms of reliability, the mean typical error remained small (CV ≤ 8.4%) across all kinetic and kinematic variables (43), confirming its utility as a field tool for assessing these parameters.
To model the net horizontal anteroposterior ground reaction force (FH) applied to the body's center of mass (CM) over time, we employed the following equation (43):
here, m denotes the runner's body mass in kilograms, and Faero(t) represents the aerodynamic drag to be overcome during sprinting, proportional to the square of the air velocity relative to the runner:
where vw is the wind velocity (if applicable), and k is the runner's aerodynamic friction coefficient. In the vertical direction, during the acceleration phase, the runner's body CM ascended from the initial to an upright running posture and remained constant between the complete strides. Thus, by utilizing fundamental dynamics laws in the vertical plane, the mean net vertical ground reaction forces (FV) applied to the body CM during each complete stride can be modeled over time as equal to the body weight:
here, “g” denotes the gravitational acceleration (9.81 m/s2).
The mechanical effectiveness of force application during running can be quantified in each support phase or stride by the ratio (RF in%) of FH to the corresponding total resultant ground reaction forces (FRes, in N) and throughout the entire acceleration phase by the slope of the linear decrease in RF with increasing velocity (DRF, in %/s/m). Since the starting block phase (push-off and subsequent airborne time) lasts between 0.5 and 0.6 s (44, 45), occurring for an average duration of ∼0.3 s, RF and DRF values can be computed from FH and FV values modeled for t > 0.3 s.
3 Statical analysis
Stepwise linear regression analysis was performed to identify the determinants of sprint performance. Before these analyses, a collinearity diagnostic procedure was implemented to reduce possible multicollinearity problems among predictor variables. Three linear regressions were performed: anthropometric variables vs. time, mechanical variables vs. time, and a combination of anthropometric and mechanical variables vs. time. The latter was performed to determine the relative contribution of each factor. The effect size (ES) for multiple linear regressions was calculated using Cohen's f2 (46). The following threshold values for ES reported as f2 were employed: ≥0.02 as small, ≥0.15 as medium, and ≥0.35 as large (47). Stata (Release 18. College Station, TX: StataCorp LLC) software was used for these analyses.
4 Results
The results of our study indicate that the mean and standard deviation times to cover 5, 15 and 30 m were: 1.42 ± 0.10, 2.83 ± 0.12 and 4.66 ± 0.20 s respectively. The variables derived from the FVP were F0 (N/kg) 7.07 ± 0.82, V0 (m/s2) 9.18 ± 0.54 and Pmax (W/kg) 16.23 ± 2.19. The applied linear regressions showed that body mass index (BMI, 21.39 ± 1.85), % muscle mass (%MM, 50.20 ± 5.82), % body fat (%BF, 21.07 ± 3.30), maximal hip circumference (MHC, 94.27 ± 4.89) and TCC (thigh circumference corrected, 55.86 ± 4.53) are the anthropometric variables that affect the sprint.
4.1 Anthropometric variables determining sprint
When examining the anthropometric variables influencing 5 m sprint times, BMI and TCC were identified as the main factors. The stepwise linear regression model explained 8% of the variability in 5 m sprint times (R2 = 0.08), reaching statistical significance (p = 0.0384) with an F-value of 3.46. The model's RMSE is 0.09523, indicating an acceptable fit. Analysis of anthropometric variables for the 15 m sprint highlighted MHC as a significant determinant. The stepwise linear regression model accounted for 9% of the variability in the 15 m sprint times (R2 = 0.09), with statistical significance (p = 0.0128) and an F-value of 6.62, confirming the model's reliability. The model, with an R2 of 0.32, showed that BMI, % MM, and % BF collectively explained 32% of the variability in the 30 m sprint times (p < 0.001, F = 10.08). Table 1 presents the results of the stepwise linear regression analyses’ results examining anthropometric variables’ influence on the 5-, 15, and 30 m sprint times. For each distance, the table displays each predictor variable's non-standardized coefficient (B), standard error, t-value, p-value, 95% confidence interval, f2 and ES.

Table 1. Anthropometric variables that determine sprints.
4.2 Mechanical variables determining sprint
Stepwise linear regression identified the relative Pmax as the primary mechanical variable that influenced the time to run 5 m. The model explained 16.8% of the variability in 5 m sprint times (R2 = 0.168). This coefficient suggests that higher values of relative Pmax are associated with shorter 5 m sprint times. For the 15 m distance, relative Pmax was also identified as the primary mechanical variable explaining sprint time (97.57%; R2 = 0.9757). The analysis identified V0 as the primary mechanical variable influencing the time to run at 30 m. The model explains 55.34% of the variability (R2 = 0.5534). Table 2 presents the results of stepwise linear regression.
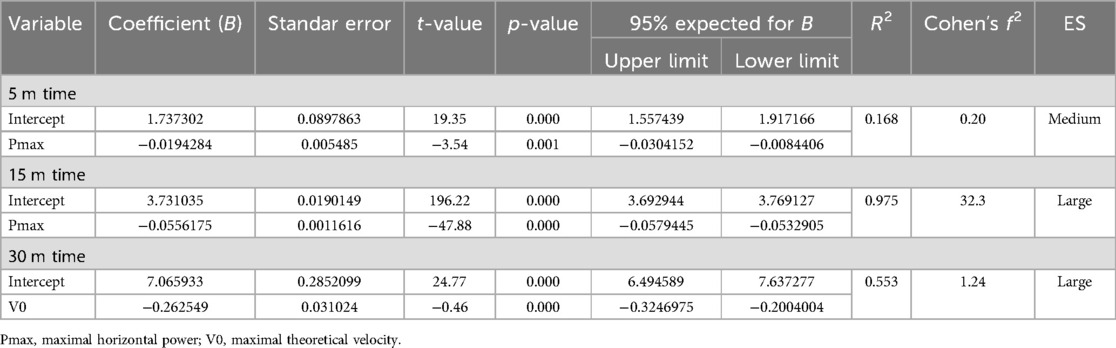
Table 2. Mechanical variables that determine sprints.
4.3 Mechanical and anthropometric variables determining sprint
Analysis of the mechanical and anthropometric variables affecting 5 m sprint times revealed significant results. The model explained 36.01% (R2 = 0.3601) of the variance in 5 m sprint times (p < 0.0001, F = 11.69). The coefficients indicated that a higher Pmax was associated with shorter 5 m sprint times, whereas an increase in MCH was related to longer sprint times. For 15 m, no anthropometric variable was added, leaving only Pmax as the most determining variable of this distance. Our model explained 59.75% of the variability in the 30 m sprint times (R2 = 0.5975, p < 0.0001, F = 29.20). The coefficients indicate that a higher V0 and a larger TCC are associated with reduced sprint times, whereas an increased MHC is linked to longer sprint times. Table 3 presents the results of stepwise linear regression for 30 m.
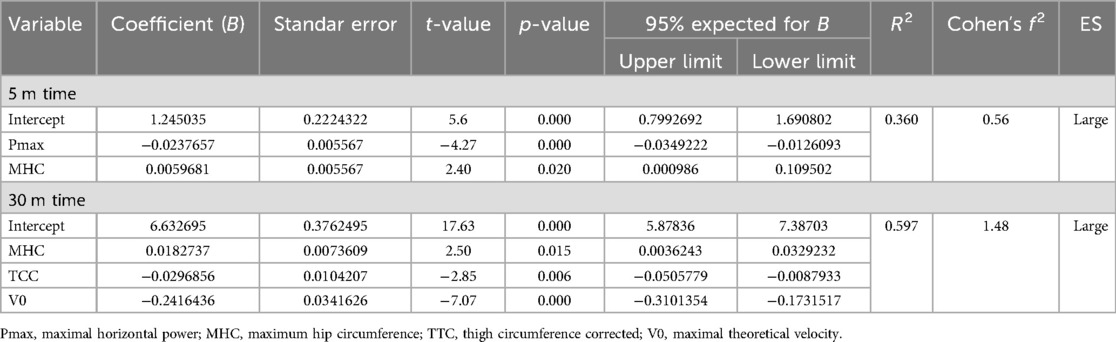
Table 3. Anthropometric and mechanicals variables that determine sprints.
5 Discussion
Our study aimed to identify the key anthropometric and mechanical variables influencing sprint performance. Understanding these factors is crucial because the ability to execute such high-speed actions significantly enhances the likelihood of success in both offensive and defensive football actions.
5.1 Anthropometric variables related to sprint performance
Regarding anthropometric variables related to sprinting, our results align with those of previous studies (48–50), where higher BMI values were negatively associated with performance in the 5 and 30-meter sprints (small and large ES, respectively). Thus, the most critical indicator is body composition, where lower-limb MM is associated with better sprint performance (51). Our results support this: TCC and MHC are anthropometric variables associated with better performance at 5 and 15 m (ES: small), respectively. Chelly et al. (52) report significant correlations between thigh muscle volume and 5 m sprint performance in young soccer players (r = 0.43, p = 0.05), and Tottori et al. (53) identified the cross-sectional area of the gluteus maximus as a predictive variable in 100-m performance in adults sprinters. Similar to other studies (54–56), our results showed a negative association between% BF and short-distance sprint times and % MM. This result contradicts our hypothesis, which can be explained by the contribution of MM to the total BM. These results provide valuable insights into MM gain, specifically in the lower limbs, reduction of %BF, and optimal BM to enhance sprint performance in football players.
5.2 Mechanical variables related to sprinting
Our results indicate that the relative Pmax is the variable that best explains the time to cover 5 and 15 m (medium and large ES). At the same time, V0 is the mechanical variable that has the most significant influence on the 30-meter sprint time (ES: large). These findings are consistent with those of Haugen et al. (57), who found an almost perfect inverse correlation (r = 1 ± 0.01) between the time to cover short distances (10 m) and relative Pmax. They also observed that the V0 variable correlated more significantly as distance increased. Samozino et al. (58) emphasized that the Pmax and FV profile of each athlete were the most significant variables in short-distance sprints (>30 m). Other studies have reported that F0 and V0 are the variables that contribute most to the time over short distances (59, 60). While these studies may seem contradictory, we must clarify that mechanical power is the product of applied force and velocity (61). This means that Pmax is a composite variable that reflects the capacity to generate force and achieve a high velocity. Therefore, the results were similar at first glance. Pmax integrates the ability to effectively apply force during the initial acceleration and the capacity to maintain a high maximum velocity over longer distances. The results suggest that optimizing Pmax can improve the initial acceleration and achieve higher maximum speeds.
5.3 Anthropometric and mechanical variables that determine times over short distances
An analysis that considered anthropometric and mechanical variables was conducted to determine their relationship with sprint performance. Our results enhanced the accuracy over distances of 5 and 30 m. Pmax, V0, and TCC negatively affected the time to cover 5 m (higher values, shorter times; ES: large). The impact of Pmax on short distances has been discussed in the previous section. For 30 m, V0 and TCC contribute to reducing time (ES: large), while MHC slightly increases it. The latter may seem contradictory, as this variable has been shown to increase V0. Studies have highlighted the inconsistency in the relationship between sprint performance and hip extensors (62), emphasizing that they relate to the sprint phase (acceleration, maximum velocity, and deceleration). According to our results, MHC is an essential variable in the initial meters of the sprint (>15 m) but not in longer sprints.
6 Practical applications and limitations
The results provide valuable information for trainers, and strength and conditioning specialists working with young athletes as they can apply this study's findings directly, by incorporating exercises that target lower-limb muscle development, improve body composition, and enhance mechanical power output, coaches can design programs specifically tailored to strengthen sprinting ability, which may enhance overall soccer performance and increase the likelihood of athletic success.
It is important to highlight that the biological age of the participants could not be identified, which could have provided additional information regarding their physical development and maturation. Additionally, the sample size was determined by convenience, as we included all athletes in the available category, limiting the generalizability of the results to a broader population.
7 Conclusion
This study investigated the relationship between anthropometric and mechanical variables and sprint performance among young soccer players. Our findings provide valuable insights into optimizing training programs to improve this population's sprinting ability. Key anthropometric variables associated with improved sprint performance included lower-limb MM at short distances (5 and 15 m). Additionally, body composition, particularly a lower % BF, was crucial across all sprint distances. Among the mechanical variables, Pmax and theoretical V0 were most strongly associated with sprint performance (<30 m), as well as with distances greater than 30 m. This provides valuable information for youth soccer coaches and physical trainers. A notable result from our research is the negative relationship between MCH and the 30 m time. Future research should further explore the relative contribution of perimeter during different phases of sprinting.
Data availability statement
The raw data supporting the conclusions of this article will be made available by the authors, without undue reservation.
Ethics statement
Ethical approval was not required for the study involving human samples in accordance with the local legislation and institutional requirements because [reason ethics approval was not required]. Written informed consent for participation in this study was provided by the participants’ legal guardians/next of kin.
Author contributions
AB-G: Conceptualization, Formal Analysis, Methodology, Writing – original draft, Investigation, Writing – review & editing. EA-M: Conceptualization, Writing – review & editing, Methodology, Writing – original draft. CB: Formal Analysis, Methodology, Writing – original draft, Conceptualization, Writing – review & editing. DS-E: Project administration, Supervision, Writing – original draft, Visualization, Writing – review & editing. JP-C: Resources, Writing – original draft, Writing – review & editing. MI-R: Formal Analysis, Supervision, Writing – review & editing, Writing – original draft. HC-K: Conceptualization, Formal Analysis, Methodology, Supervision, Writing – review & editing, Writing – original draft.
Funding
The author(s) declare that no financial support was received for the research, authorship, and/or publication of this article.
Acknowledgments
The authors acknowledge the staff and athletes of Universidad Católica de Chile.
Conflict of interest
The authors declare that the research was conducted in the absence of any commercial or financial relationships that could be construed as a potential conflict of interest.
Publisher's note
All claims expressed in this article are solely those of the authors and do not necessarily represent those of their affiliated organizations, or those of the publisher, the editors and the reviewers. Any product that may be evaluated in this article, or claim that may be made by its manufacturer, is not guaranteed or endorsed by the publisher.
References
1. Smith DJ. A framework for understanding the training process leading to elite performance. Sports Med. (2003) 33:1103–26. doi: 10.2165/00007256-200333150-00003
2. Taylor JB, Wright AA, Dischiavi SL, Townsend MA, Marmon AR. Activity demands during multi-directional team sports: a systematic review. Sports Med. (2017) 47:2533–51. doi: 10.1007/s40279-017-0772-5
3. Di Salvo V, Baron R, González-Haro C, Gormasz C, Pigozzi F, Bachl N. Sprinting analysis of elite soccer players during European champions league and UEFA cup matches. J Sports Sci. (2010) 28(14):1489–94. doi: 10.1080/02640414.2010.521166
4. Wisløff U, Castagna C, Helgerud J, Jones R, Hoff J. Strong correlation of maximal squat strength with sprint performance and vertical jump height in elite soccer players: figure 1. Br J Sports Med. (2004) 38(3):285–8. doi: 10.1136/bjsm.2002.002071
5. Simperingham KD, Cronin JB, Ross A. Advances in sprint acceleration profiling for field-based team-sport athletes: utility, reliability, validity and limitations. Sports Med. (2016) 46(11):1619–45. doi: 10.1007/s40279-016-0508-y
6. Buchheit M, Samozino P, Glynn JA, Michael BS, Al Haddad H, Mendez-Villanueva A, et al. Mechanical determinants of acceleration and maximal sprinting speed in highly trained young soccer players. J Sports Sci. (2014) 32(20):1906–13. doi: 10.1080/02640414.2014.965191
7. Weyand PG, Sandell RF, Prime DNL, Bundle MW. The biological limits to running speed are imposed from the ground up. J Appl Physiol. (2010) 108(4):950–61. doi: 10.1152/japplphysiol.00947.2009
8. Valamatos MJ, Abrantes JM, Carnide F, Valamatos MJ, Monteiro CP. Biomechanical performance factors in the track and field sprint start: a systematic review. Int J Environ Res Public Health. (2022) 19(7):4074. doi: 10.3390/ijerph19074074
9. Jiménez-Reyes AP, García-Ramos A, Cuadrado-Peñafiel V. Differences in sprint mechanical force-velocity profile between trained soccer and futsal players. Int J Sports Physiol Perform. (2018) 14:478–85. doi: 10.1123/ijspp.2018-0402
10. Vanwanseele B, Aeles J. Mechanical determinants of sprint performance in elite and sub-elite field hockey players. International Conference on Biomechanics sin Sports. Japan (2016).
11. Bonato M, Bizzozero S, Filipas L, La Torre A. The influence of anthropometric parameters in track and field curve sprint. J Sports Med Phys Fitness. (2023) 63(12):1254–61. doi: 10.23736/S0022-4707.23.15056-0
12. Barbieri D, Zaccagni L, Babić V, Rakovac M, Mišigoj-Duraković M, Gualdi-Russo E. Body composition and size in sprint athletes. J Sports Med Phys Fitness. (2017) 57(9):1142–6. doi: 10.23736/S0022-4707.17.06925-0
13. Mathisen G, Pettersen SA. Anthropometric factors related to sprint and agility performance in young male soccer players. Open Access J Sports Med. (2015) 337:337–42. doi: 10.2147/OAJSM.S91689
14. Hopwood HJ, Bellinger PM, Compton HR, Bourne MN, Minahan C. The relevance of muscle fiber type to physical characteristics and performance in team-sport athletes. Int J Sports Physiol Perform. (2023) 18:223–30. doi: 10.1123/ijspp.2022-0235
15. Thompson MA. Physiological and biomechanical mechanisms of distance specific human running performance. Integr Comp Biol. (2017) 57(2):293–300. doi: 10.1093/icb/icx069
16. Nagahara R, Mizutani M, Matsuo A, Kanehisa H, Fukunaga T. Association of sprint performance with ground reaction forces during acceleration and maximal speed phases in a single sprint. J Appl Biomech. (2018) 34(2):104–10. doi: 10.1123/jab.2016-0356
17. Clark KP, Meng CR, Stearne DJ. “Whip from the hip”: thigh angular motion, ground contact mechanics, and running speed. Biol Open. (2020) 9:1–13. doi: 10.1242/bio.053546
18. Haugen T, McGhie D, Ettema G. Sprint running: from fundamental mechanics to practice—a review. Eur J Appl Physiol. (2019) 119(6):1273–87. doi: 10.1007/s00421-019-04139-0
19. Kawamori N, Nosaka K, Newton RU. Relationships between ground reaction impulse and sprint acceleration performance in team sport athletes. J Strength Cond Res. (2013) 27(3):568–73. doi: 10.1519/JSC.0b013e318257805a
20. Macedo T, Leme C, Arruda F, Yuzo F, Rosa J. Determinant biomechanical variables for each sprint phase performance in track and field: a systematic review. Int J Sports Sci Coach. (2024) 19:488–509. doi: 10.1177/17479541231200526
21. Harrison AJ, Keane SP, Coglan J. Force-velocity relationship and stretch-shortening cycle function in sprint and endurance athletes. J Strength Cond Res. (2004) 18(3):473. doi: 10.1519/13163.1
22. Hennessy L, Kilty J. Relationship of the stretch-shortening cycle to sprint performance in trained female athletes. J Strength Cond Res. (2001) 15(3):326–31. doi: 10.1519/00124278-200108000-00011
23. Clark KP, Ryan LJ, Meng CR, Stearne DJ. Evaluation of maximum thigh angular acceleration during the swing phase of steady-speed running. Sports Biomech. (2021) 22:1–14. doi: 10.1080/14763141.2021.1986124
24. Weyand PG, Sternlight DB, Bellizzi MJ, Wright S. Faster top running speeds are achieved with greater ground forces not more rapid leg movements. J Appl Physiol. (2000) 89(5):1991–9. doi: 10.1152/jappl.2000.89.5.1991
25. Vellucci CL, Beaudette SM. A need for speed: objectively identifying full-body kinematic and neuromuscular features associated with faster sprint velocities. Front Sports Act Living. (2023) 4:1–15. doi: 10.3389/fspor.2022.1094163
26. Abe T, Kawamoto K, Dankel SJ, Bell ZW, Spitz RW, Wong V, et al. Longitudinal associations between changes in body composition and changes in sprint performance in elite female sprinters. Eur J Sport Sci. (2020) 20(1):100–5. doi: 10.1080/17461391.2019.1612950
27. Sugisaki N, Kanehisa H, Tauchi K, Okazaki S, Iso S, Okada J. The relationship between 30-m sprint running time and muscle cross-sectional areas of the psoas major and lower limb muscles in male college short and middle distance runners. Int J Sports Sci. (2011) 9:1–7. doi: 10.5432/ijshs.20100018
28. Yasuda T, Kojima K, Kawamoto K, Abe T. Relationships between physiological cross-sectional area of the thigh muscles and sprint performance in female 100-m sprinters. Med Sci Sports Exerc. (2002) 34(5):S262. doi: 10.1097/00005768-200205001-01469
29. Kamino K, Maehama R, Kunimasa Y, Makino A, Sano K, Kijima K, et al. Specific distribution of cross-sectional area in each hamstring muscle of sprint runners and relationship between those and sprint performance. Jpn J Phys Fit Sports Med. (2018) 67(6):383–91. doi: 10.7600/jspfsm.67.383
30. Nuell S, Illera-Domínguez Víctor R, Carmona G, Alomar X, Padullés JM, Lloret M, et al. Hypertrophic muscle changes and sprint performance enhancement during a sprint-based training macrocycle in national-level sprinters. Eur J Sport Sci. (2020) 20(6):793–802. doi: 10.1080/17461391.2019.1668063
31. Kumagai K, Abe T, Brechue WF, Ryushi T, Takano S, Mizuno M. Sprint performance is related to muscle fascicle length in male 100-m sprinters. J Appl Physiol. (2000) 88(3):811–6. doi: 10.1152/jappl.2000.88.3.811
32. Hébert-Losier K, Ngawhika TM, Balsalobre-Fernandez C, O’Neill S. Calf muscle abilities are related to sprint performance in male rugby union players. Phys Ther Sport. (2023) 64:117–22. doi: 10.1016/j.ptsp.2023.09.001
33. Cinarli FS, Buyukcelebi H, Esen O, Barasinska M, Cepicka L, Gabrys T, et al. Does dominant somatotype differentiate performance of jumping and sprinting variables in young healthy adults? Int J Environ Res Public Health. (2022) 19(19):11873. doi: 10.3390/ijerph191911873
34. Pickering C, Kiely J. ACTN3: more than just a gene for speed. Front Physiol. (2017) 8:1–9. doi: 10.3389/fphys.2017.01080
35. Galantine P, Sudlow A, Peyrot N, Vercruyssen F, Bélard C, Dalleau G, et al. Force–velocity profile in sprinting: sex effect. Eur J Appl Physiol. (2023) 123(4):911–21. doi: 10.1007/s00421-022-05121-z
36. McClelland EL, Weyand PG. Sex differences in human running performance: smaller gaps at shorter distances? J Appl Physiol. (2022) 133(4):876–85. doi: 10.1152/japplphysiol.00359.2022
37. Nuell S, Illera-Domínguez V, Carmona G, Alomar X, Padullés JM, Lloret M, et al. Sex differences in thigh muscle volumes, sprint performance and mechanical properties in national-level sprinters. PLoS One. (2019) 14(11):e0224862. doi: 10.1371/journal.pone.0224862
38. Mainer-Pardos E, Gonzalo-Skok O, Nobari H, Lozano D, Pérez-Gómez J. Age-related differences in linear sprint in adolescent female soccer players. BMC Sports Sci Med Rehabil. (2021) 13(1):97. doi: 10.1186/s13102-021-00327-8
39. Esparza Ros F, Vaquero-Cristóbal R, Marfell-Jones M. International standars for anthropometric assessment. International Society for the Advancement of Kinanthropometry, 2019.
41. Jiménez-Reyes P, Samozino P, García-Ramos A, Cuadrado-Peñafiel V, Brughelli M, Morin JB. Relationship between vertical and horizontal force-velocity-power profiles in various sports and levels of practice. PeerJ. (2018) 2018(11):1–18. doi: 10.7717/peerj.5937
42. Samozino P, Rabita G, Dorel S, Slawinski J, Peyrot N, Saez de Villarreal E, et al. A simple method for measuring power, force, velocity properties, and mechanical effectiveness in sprint running. Scand J Med Sci Sports. (2016) 26:648–58. doi: 10.1111/sms.12490
43. Simperingham KD, Cronin JB, Pearson SN, Ross A. Reliability of horizontal force–velocity–power profiling during short sprint-running accelerations using radar technology. Sports Biomech. (2019) 18(1):88–99. doi: 10.1080/14763141.2017.1386707
44. Mendiguchia J, Samozino P, Martinez-Ruiz E, Brughelli M, Schmikli S, Morin JB, et al. Progression of mechanical properties during on-field sprint running after returning to sports from a hamstring muscle injury in soccer players. Int J Sports Med. (2014) 35(8):690–5. doi: 10.1055/s-0033-1363192
45. Morin JB, Samozino P. Interpreting power-force-velocity profiles for individualized and specific training. Int J Sports Physiol Perform. (2016) 11:267–72. doi: 10.1123/ijspp.2015-0638
46. Selya AS, Rose JS, Dierker LC, Hedeker D, Mermelstein RJ. A practical guide to calculating Cohen’s f2, a measure of local effect size, from PROC MIXED. Front Psychol. (2012) 3:1–6. doi: 10.3389/fpsyg.2012.00111
47. Cohen J. Statistical Power Analysis for the Behavioral Sciences. New York, NY: Routledge (2013). doi: 10.4324/9780203771587
48. Ben Brahim M, Sal-de-Rellán A, Hernaiz-Sánchez A, Yasin H, García-Valverde A. The relationships between body mass index, reciprocal ponderal index, waist-to-height ratio, and fitness in young adult males. Front Psychol. (2023) 14:1–8. doi: 10.3389/fpsyg.2023.1250913
49. Nikolaidis PT. Body mass index and body fat percentage are associated with decreased physical fitness in adolescent and adult female volleyball players. J Res Med Sci. (2013) 18:22–6.23900100
50. Septadina IS, Suciati T, Se HS. Body mass index as a parameter of running speed. Biosci Med. (2019) 3(2):1–9. doi: 10.32539/bsm.v3i2.83
51. Perez-Gomez J, Rodriguez GV, Ara I, Olmedillas H, Chavarren J, González-Henriquez JJ, et al. Role of muscle mass on sprint performance: gender differences? Eur J Appl Physiol. (2008) 102(6):685–94. doi: 10.1007/s00421-007-0648-8
52. Chelly MS, Chérif N, Amar MB, Hermassi S, Fathloun M, Bouhlel E, et al. Relationships of peak leg power, 1 maximal repetition half back squat, and leg muscle volume to 5-m sprint performance of junior soccer players. J Strength Cond Res. (2010) 24(1):266–71. doi: 10.1519/JSC.0b013e3181c3b298
53. Tottori N, Suga T, Miyake Y, Tsuchikane R, Tanaka T, Terada M, et al. Trunk and lower limb muscularity in sprinters: what are the specific muscles for superior sprint performance? BMC Res Notes. (2021) 14(1):1–6. doi: 10.1186/s13104-021-05487-x
54. Ishida A, Travis S, Stone M. Associations of body composition, maximum strength, power characteristics with sprinting, jumping, and intermittent endurance performance in male intercollegiate soccer players. J Funct Morphol Kinesiol. (2021) 6(1):7. doi: 10.3390/jfmk6010007
55. Honório S, Batista M, Serrano J, Petrica J, Rebelo M, Vieira F, et al. Analysis of anthropometric and physical performance variables in U-17 soccer players. Front Sports Act Living. (2023) 5:1–9. doi: 10.3389/fspor.2023.1284411
56. Pérez-Contreras J, Merino-Muñoz P, Aedo-Muñoz E. Vínculo entre composición corporal, sprint y salto vertical en futbolistas jóvenes de élite de Chile. MHSalud. (2021) 18(2):1–14. doi: 10.15359/mhs.18-2.5
57. Haugen TA, Breitschädel F, Seiler S. Sprint mechanical variables in elite athletes: are force-velocity profiles sport specific or individual? PLoS One. (2019) 14(7):1–14. doi: 10.1371/journal.pone.0215551
58. Samozino P, Peyrot N, Edouard P, Nagahara R, Jimenez-Reyes P, Vanwanseele B, et al. Optimal mechanical force-velocity profile for sprint acceleration performance. Scand J Med Sci Sports. (2022) 32(3):559–75. doi: 10.1111/sms.14097
59. Bustamante-Garrido A, Izquierdo M, Miarka B, Cuartero-Navarrete A, Pérez-Contreras J, Aedo-Muñoz E, et al. Mechanical determinants of sprinting and change of direction in elite female field hockey players. Sensors. (2023) 23(18):1–13. doi: 10.3390/s23187663
60. Hicks D, Drummond C, Williams K, Van den Tillaar R. Investigating vertical and horizontal force-velocity profiles in club-level field hockey athletes: do mechanical characteristics transfer between orientation of movement? Int J Strength Cond. (2023) 3(1):1–14. doi: 10.47206/ijsc.v3i1.188
61. Knudson DV. Correcting the use of term “power” in the strength and conditioning literature. J Strength Cond Res. (2009) 23(6):1902–8. doi: 10.1519/JSC.0b013e3181b7f5e5
Keywords: athletic performance, anthropometry, force-velocity profile, motion analysis, soccer
Citation: Bustamante-Garrido A, Aedo-Muñoz E, Brito C, Silva-Esparza D, Pérez-Contreras J, Izquierdo-Redin M and Cerda-Kohler H (2024) Anthropometric and mechanical factors determining sprint in young soccer players: a brief report. Front. Sports Act. Living 6:1480973. doi: 10.3389/fspor.2024.1480973
Received: 14 August 2024; Accepted: 9 October 2024;
Published: 24 October 2024.
Edited by:
Yassine Negra, University of Manouba, TunisiaReviewed by:
Luís Branquinho, Polytechnic Institute of Portalegre, PortugalSenda Sammoud, University of Jendouba, Tunisia
Copyright: © 2024 Bustamante-Garrido, Aedo-Muñoz, Brito, Silva-Esparza, Pérez-Contreras, Izquierdo-Redin and Cerda-Kohler. This is an open-access article distributed under the terms of the Creative Commons Attribution License (CC BY). The use, distribution or reproduction in other forums is permitted, provided the original author(s) and the copyright owner(s) are credited and that the original publication in this journal is cited, in accordance with accepted academic practice. No use, distribution or reproduction is permitted which does not comply with these terms.
*Correspondence: Hugo Cerda-Kohler, aHVnb3Jja0BnbWFpbC5jb20=