 Taku Yasuda
 Kaori Tachibana2
 Hirotaka Mutsuzaki
- 1Center for Medical Sciences, Ibaraki Prefectural University of Health Sciences, Ami, Japan
- 2Department of Physical Therapy, School of Healthcare, Ibaraki Prefectural University of Health Sciences, Ami, Japan
Background: The competitiveness of wheelchair basketball has increased over time. However, screen-play, considered a vital offensive tactic in running basketball, is still poorly clarified. Therefore, this study aimed to clarify the impact of screen-play on scoring and game results in wheelchair basketball and assess the roles of each player classification (PC).
Methods: Information regarding screen-play, including 13 categories such as shot success, location, and PC, was recorded for 22 wheelchair basketball games in the Tokyo 2020 Paralympic Games. This information was analyzed using the chi-square test to evaluate the significant differences in the appearance frequency of variables in each category (categorical variable) between the winning and losing teams and the shot-success rate.
Results: Except for PC-related categorical variables, comparing the appearance frequency of the winning and losing teams confirmed a significant difference for screen and pass locations (all p < 0.05). Regarding the shot-success rates of the winning and losing teams, a significant difference in five categories was confirmed, including shot and pass locations (all p < 0.05). Regarding the PC, comparing the appearance frequency of the winning and losing teams confirmed a significant difference for PC of the screener (p < 0.05). Significant differences were found in the shot-success rates of the winning and losing teams in nine, five, three, and four categories regarding the PCs of the shooter, user, screener, and passer, respectively, such as shot location, pass location, and type of screen (p < 0.05, respectively).
Conclusion: In wheelchair basketball offenses, it may be effective to consider the following points in the scenario lead-up to a shot: Using two different spaces, in the paint and the 3-point field goal area, could be crucial in screen-play. Improving the accuracy of on-the-ball screen plays appears vital, and using off-the-ball screens could also contribute to winning. Allocating approximately 50% of screeners to the middle-point classification (Middle) players and the rest to the low-point (Low) and high-point (High) classification players, at approximately 25% each, may be practical. Regarding winning team player roles, using High shooters and users; Low, Middle, and High screeners; and Middle and High passers contributed to play success.
1 Introduction
Wheelchair basketball is a sport originally used mainly as a treatment for war-injured soldiers and was adopted by the first Paralympic Games in Rome in 1960 (1). As international tournaments are flourishing, not only rehabilitation aspects but also competitive aspects are garnering more attention (2). To date, 108 national institutions have been affiliated with the International Wheelchair Basketball Federation (3). Wheelchair basketball is one of the world's top-rated sports featured in the Paralympics.
Wheelchair basketball is based on similar rules as running basketball; however, the use of wheelchairs and player classification (PC) simultaneously differentiates it from running basketball. PC involves eight categories, ranging from 1.0 to 4.5, with 0.5-point increments. The eight categories of PC are determined by the difference between the players' volume of action (the limit to which a player can move voluntarily in any direction and return to the upright seated position with control without holding the wheelchair for support or using the upper extremities to aid the movement) (4).
Some studies on wheelchair basketball have been conducted based on the players' performance in actual games, as described below. These studies examined differences between individual competitors, [categorized by PC] based on statistical data recorded in an official match, including the success or failure of shots, number of rebounds, assists, and turnovers. For example, Vanlandewijck et al. (5) analyzed the players' performance based on statistical data collected from the World Championship men's games in 1998. They reported that the PC represented the functional potential of the players. For instance, this study indicated that the 4.0- and 4.5-point players are significantly superior in rebounding and shooting close to the basket because of their seat height, maneuverability, power to close the basket, and ability to control their trunks for grasping the rebound. Additionally, Molik et al. (6) analyzed the quality of each player's contribution using statistical data of the game, such as scores, shots, and rebounds, based on their classification in the women's games, which tend to be lower scoring, at the World Championships in 2006. They clarified that this depended on the team's ranking, based on the order assigned in the tournament. However, these studies are based on individual perspectives. Since wheelchair basketball is a team sport, it is also essential to analyze performance from a team perspective. However, only a few studies have focused on teams, such as the study by Gómez et al. (7). The authors focused on the Beijing Paralympics in 2008 and the World Championships in 2010 and reported that the following factors that affected the match outcome: the field goal percentage and free throw rate (i.e., free-throws made/field-goals attempted) in men's games, and the field goal percentage and offensive rebound percentage [i.e., offensive rebounds/(offensive rebounds + opponents' defensive rebounds)] in women's games.
Furthermore, when focusing on the team, each player's performance in the game is exhibited in cooperation with other players by using tactics. Thus, clarifying the tactics of wheelchair basketball via statistical analyses of data is also necessary. Recently, Francis et al. (8) developed a model that predicted the outcome of field goal attempts based on specific action variables included in the categorical predictor variables. They analyzed five variables related to offensive tactics, including Shot Location and PC. “Pre shot” includes an offensive tactic that uses screens, such as “Curl” and “Pick & Roll”. These tactics have also been described as “vital to any type of offense” in running basketball (9). Moreover, because the wheelchair is considered a part of the player (10), has a constant width, and cannot move laterally without changing the wheels' direction, players cannot pass through narrow spaces as in running basketball. Therefore, in wheelchair basketball, “a player can neither jump nor move laterally,” screen-play is essential for the offense to break through the defense and shoot with a higher success rate (11). However, the abovementioned previous studies have not conducted a detailed analysis of screen-play.
In summary, while wheelchair basketball has been emphasized as a competitive sport, studies focusing on its competitiveness remain limited. Therefore, this study aimed to clarify the impact of screen-play on scoring and game results and assess the role of each PC in wheelchair basketball.
2 Materials and methods
2.1 Participants
This cross-sectional study targets multiple teams participating in a single international competition, the Tokyo 2020 Paralympics. We analyzed 22 games, where the top 8 of the 12 men's teams participated in wheelchair basketball; each team consisted of 12 players.
The need for written informed consent was waived by the Institutional Review Board of Ibaraki Prefectural University of Health Sciences, since this research has a retrospective nature, did not include any identifying data, and only used the data of the games that are open to the public. As an alternative to written informed consent, we announced an information disclosure document regarding ethical considerations on the Ibaraki Prefectural University of Health Sciences Hospital website. The Institutional Review Board of Ibaraki Prefectural University of Health Sciences approved the above method. This study was conducted in accordance with the Declaration of Helsinki and was approved by the Institutional Review Board of Ibaraki Prefectural University of Health Sciences (No. e390).
2.2 Study procedures
We recorded all 3,841 possessions in 22 games and considered 2,567 offensive sequences that resulted in field goal attempts for analysis. All data generated and analyzed during this study were obtained from the footage of those games on the Paralympics YouTube channel (https://www.youtube.com/@paralympics).
2.2.1 Categorization of screen-play
Information regarding the following 13 categories was recorded and screen plays that led to field goal attempts in each game were analyzed: (Ⅰ) the success of shots (made/missed), (Ⅱ) presence of a screen (with/without), (Ⅲ) location of shots on screen plays (shot location), (Ⅳ) location of the screen used immediately before shots (screen location), (Ⅴ) location of the pass issued immediately before a shot on screen plays (pass location), (Ⅵ) type of screen, (Ⅶ) type of screen-play, (Ⅷ) movement of on-the-ball screen plays, (Ⅸ) movement of off-the-ball screen plays, (X) PC of the shooter on screen plays, (Ⅺ) PC of the user, (Ⅻ) PC of the screener, and (XIII) PC of the passer who passed the ball to the shooter on screen plays.
Regarding (Ⅲ), (Ⅳ), and (Ⅴ), we divided each location into the following six areas based on the figure used by Francis et al. (8) (Figure 1): paint-low (PL), paint-high (PH), Top, Corner, Wing, 3-point field goal area (3P). Compared to the figure of Francis et al., our figure has the following three modifications: we divided the restricted area into two sections, considering that basketball tactics distinguish between the low-post and high-post (9); we also divided the 2-point field goal area into two sections, considering that basketball tactics distinguish between the corner and wing (9); as the base point for dividing those areas, we used the center line side edge of the neutral zone, which is on a line extending from the outer edge of the free-throw line toward the end-line (10).
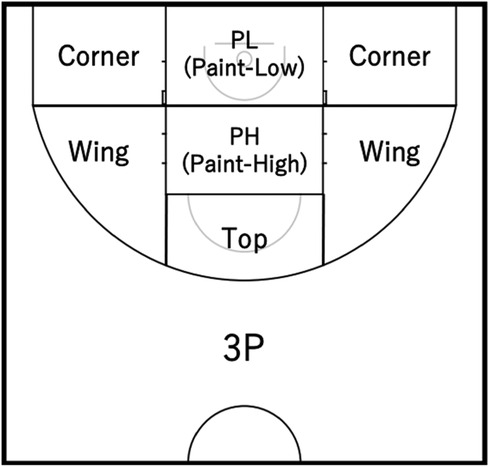
Figure 1. Shot/screen/pass locations.
Regarding (Ⅵ), we categorized the type of screen into the following two types: i) on-the-ball screens, where the user or screener held the ball; ii) off-the-ball screens, where neither the user nor the screener held the ball.
Regarding (Ⅶ), we categorized the type of screen-play into the following six types based on the difference in the shooter (whether the shooter was the user, the screener, or another player of the screen play) and the process leading to the shot along with the type of screen mentioned above (9) (Figure 2): the plays where the user shot using the on-the-ball screen (ON-U); plays where the screener of the on-the-ball screen shot after receiving a pass from the user (ON-S); plays where another player shot after receiving a pass from the user of the on-the-ball screen (ON-A); plays that led to a shot through two or more extra passes after the user used the on-the-ball screen (ON-E); plays where the user shot using the off-the-ball screen (OF-U); and plays where the screener of the off-the-ball screen shot (OF-S). In wheelchair basketball, a player may progress with a live ball on the court in any direction unless the number of pushes while holding the ball exceeds 2 (10). Therefore, we categorized ON-U when it was confirmed that the user pushed the big wheel without dribbling after holding the ball by using the off-the-ball screen and OF-U when both dribbling and pushing the big wheel were not confirmed.
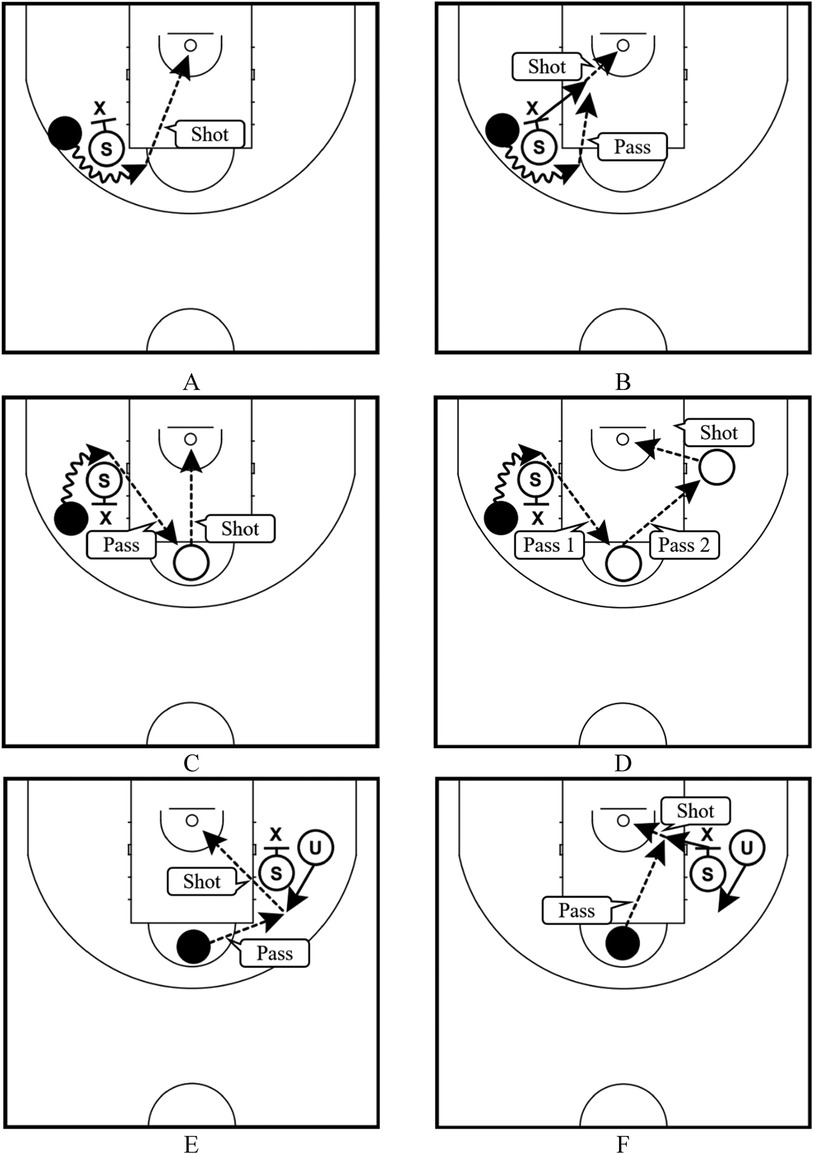
Figure 2. Types of screen-play; (A) the plays where the user shot using the on-the-ball screen (ON-U), (B) plays where the screener of the on-the-ball screen shot after receiving a pass from the user (ON-S), (C) plays where another player shot after receiving a pass from the user of the on-the-ball screen (ON-A), (D) plays that led to a shot through two or more extra passes after the user used the on-the-ball screen (ON-E), (E) plays where the user shot using the off-the-ball screen (OF-U), and (F) plays where the screener of the off-the-ball screen shot (OF-S).
Regarding (Ⅷ), we categorized the movement of on-the-ball screen plays into four variables based on the difference in movements of the user after using the on-the-ball screen (9) and whether the screener held the ball or not (12) (Figure 3).
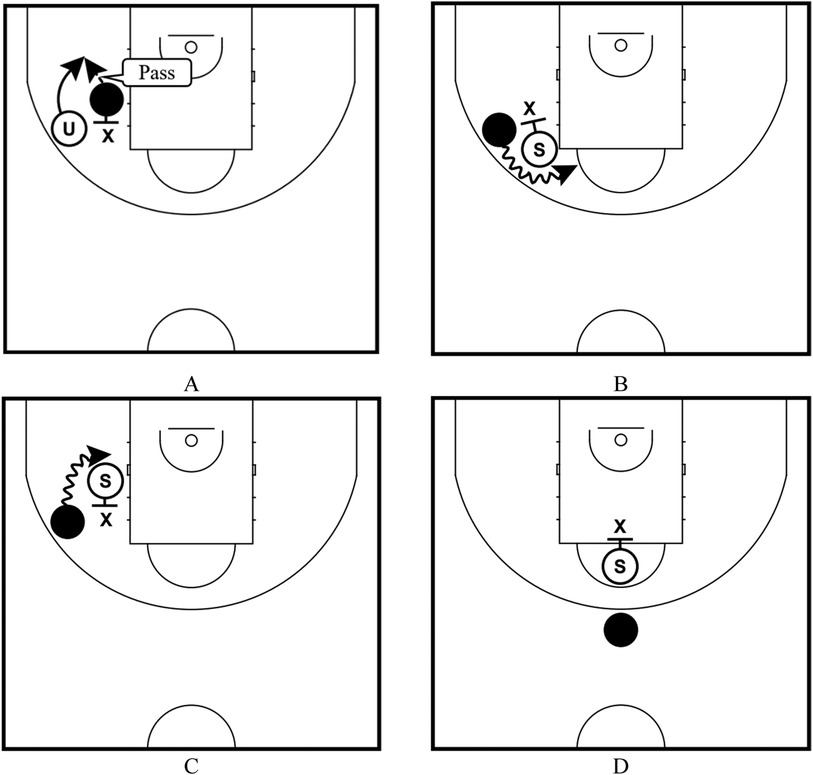
Figure 3. Movements of on-the-ball screen plays; (A) the plays where the screener held a ball (Around), (B) plays where the user moved toward the center-line side against the screener (Center-line), (C) plays where the user moved toward the end-line side against the screener (End-line), and (D) plays where the screener was on the center-line side of the defense who protected the user holding a ball in a Top or 3P on Top extension (ON-Down).
Regarding (Ⅸ), we categorized the movement of off-the-ball screen plays into four variables according to the location of the screener relative to the defense, considering the screen's angle (9) (Figure 4).
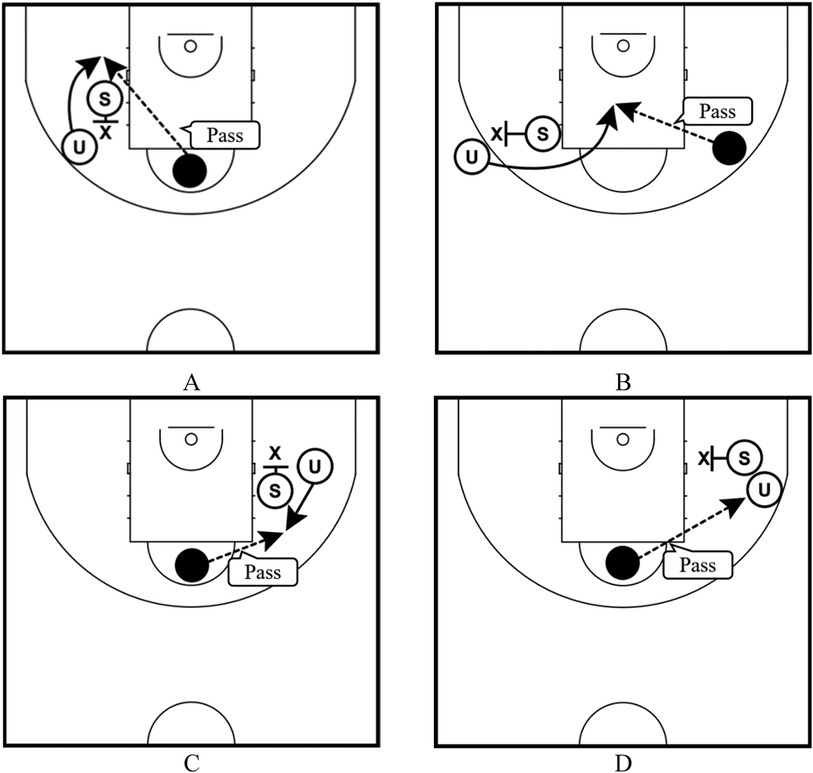
Figure 4. Movements of off-the-ball screen plays; (A) the plays where the screener was on the end-line side of the defense who protected the user (Back), (B) the plays where the screener was on the middle-line (the imaginary line connecting baskets running through the center of the court) side of the defense who protected the user (Cross), (C) the plays where the screener was on the center-line side of the defense who protected the user (Down), and (D) the plays where the screener was on the side-line side of the defense who protected the user (Flare).
Regarding (X), (Ⅺ), (Ⅻ), and (XIII), referring to the study by Francis et al. (8), we set a PC of 1.0 and 1.5, 2.0–3.0, and 3.5–4.5 as low-point (Low), middle-point (Middle), and high-point (High) category players, respectively, based on the PC recognized by the classifiers.
2.2.2 Data extraction
A single observer extracted data from the videos according to the abovementioned categories. The observer, who had more than 10 years of experience as a basketball coach and a master's degree in physical education, received suggestions on wheelchair basketball tactics and confirmation of screen-play categorization validity in this study from a former national team coach in wheelchair basketball.
The conditions set for data extraction are described in the following paragraphs. These criteria were set to guarantee the reproducibility of the results and control the conditions for checking screen plays.
Firstly, in wheelchair basketball, screen plays both in the frontcourt and backcourt are effective tactics because players cannot move laterally (13, 14). However, the effectiveness of screen plays in the frontcourt and backcourt may differ. In running basketball, screen plays are mainly described assuming they will occur primarily in the frontcourt (9, 12, 15, 16). In wheelchair basketball, there is an offensive tactic called a “back pick” that uses a screen in the backcourt (13, 17), but similar to running basketball, there is a tendency to mainly describe screen plays in the frontcourt (8, 14). This is because screen plays in the frontcourt are thought to be more directly linked to scoring than in the backcourt, since the defense has less space and time to deal with screen plays in the frontcourt. Therefore, we only analyzed screen plays occurring in the frontcourt.
Secondly, this study aimed to assess the impact of screen-play, which corresponded to 2-on-2 among offensive tactics. Therefore, we excluded the following five types of plays from the screen plays to avoid including plays that do not fit the 2-on-2 screen-play criteria and to increase reproducibility regarding data extraction: (i) plays where the user who held the ball used the screen and stopped dribbling and then dribbled again to shoot, (ii) plays where the user with the ball turned his back to the basket immediately after using a screen, and (iii) plays where the user with the ball faked immediately after using a screen and then dribbled and passed. Furthermore, we excluded (iv) plays with <14 s remaining on the shot clock at the start of offense and (v) plays that led to a direct shot from a throw-in pass at the side or end-line. In running basketball, it has been reported that players are likely to choose certain plays when the duration of the on-the-ball screen play is short (18). Thus, even in wheelchair basketball, situations (iv) and (v) could increase the possibility of using only certain types of screen-play or none at all.
Lastly, regarding the PC of the screener, screen location, and type of screen-play, we analyzed single screen plays (one screener); however, we excluded double screen plays (two screeners) since these occurred less frequently. Additionally, regarding the movement of on-the-ball screen plays, we excluded one play that did not fall into the above four types. Regarding the movement of off-the-ball screen plays, we excluded one play with different movement combinations by a double screen.
2.3 Statistical analysis
The extracted data were analyzed using the chi-square test to confirm whether there was a significant difference in the appearance frequency of each categorical variable and the shot-success rate (ratio of successful shots to the number of attempted shots) between the winning and losing teams. Additionally, to analyze the characteristics for the classification, the chi-square test was used to confirm the difference in shot-success rate for the other variables associated with each category of the PC: the PC of the shooter, user, screener, and passer.
All statistical analyses were performed using IBM SPSS Statistics for Windows version 28 (IBM Corp., Armonk, NY, USA), and all significance levels were set at p < 0.05. Furthermore, referring to the studies by Agresti (19) and Sharpe (20), in cases where a significant difference was confirmed among three or more groups, we used adjusted standardized residual (ASR) analysis to interpret the data. In this study, ASR > +2 indicated a higher frequency than the compared target, and ASR < −2 indicated a lower frequency than the compared target. In addition, as based on the study by Fritz et al. (21) regarding effect sizes, we used φ where the data was analyzed in 2 × 2 contingency tables and used Cramér's V (φc) for larger contingency tables than 2 × 2. The formulas for φ and φc are as follows, where N is the sample size and k is the number of independent variables in the analysis:
3 Results
Given the extensive and comprehensive analyses conducted in this study, detailed statistical information is provided exclusively for categories where significant differences were observed (Tables 1–7).
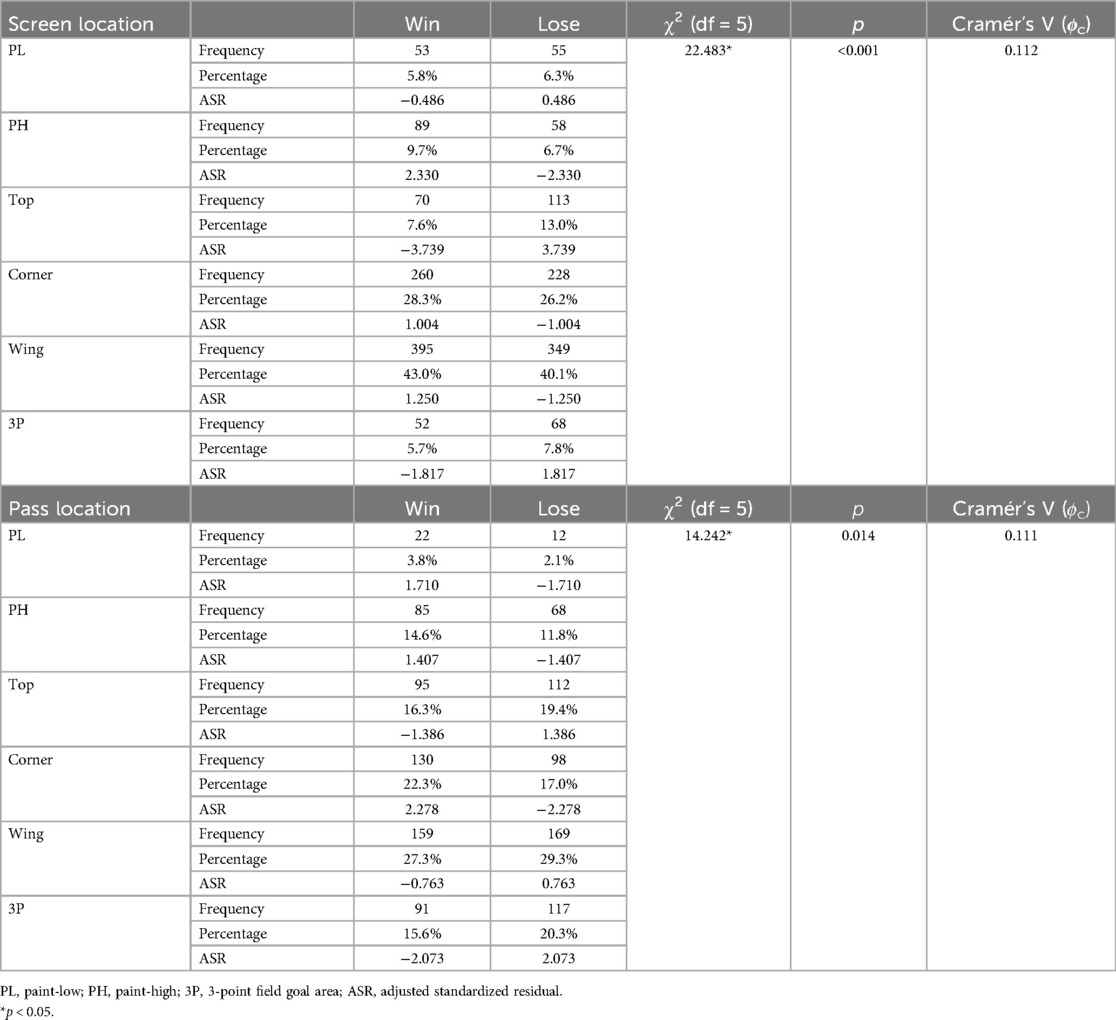
Table 1. Differences in the appearance frequency of each categorical variable in screen-play.
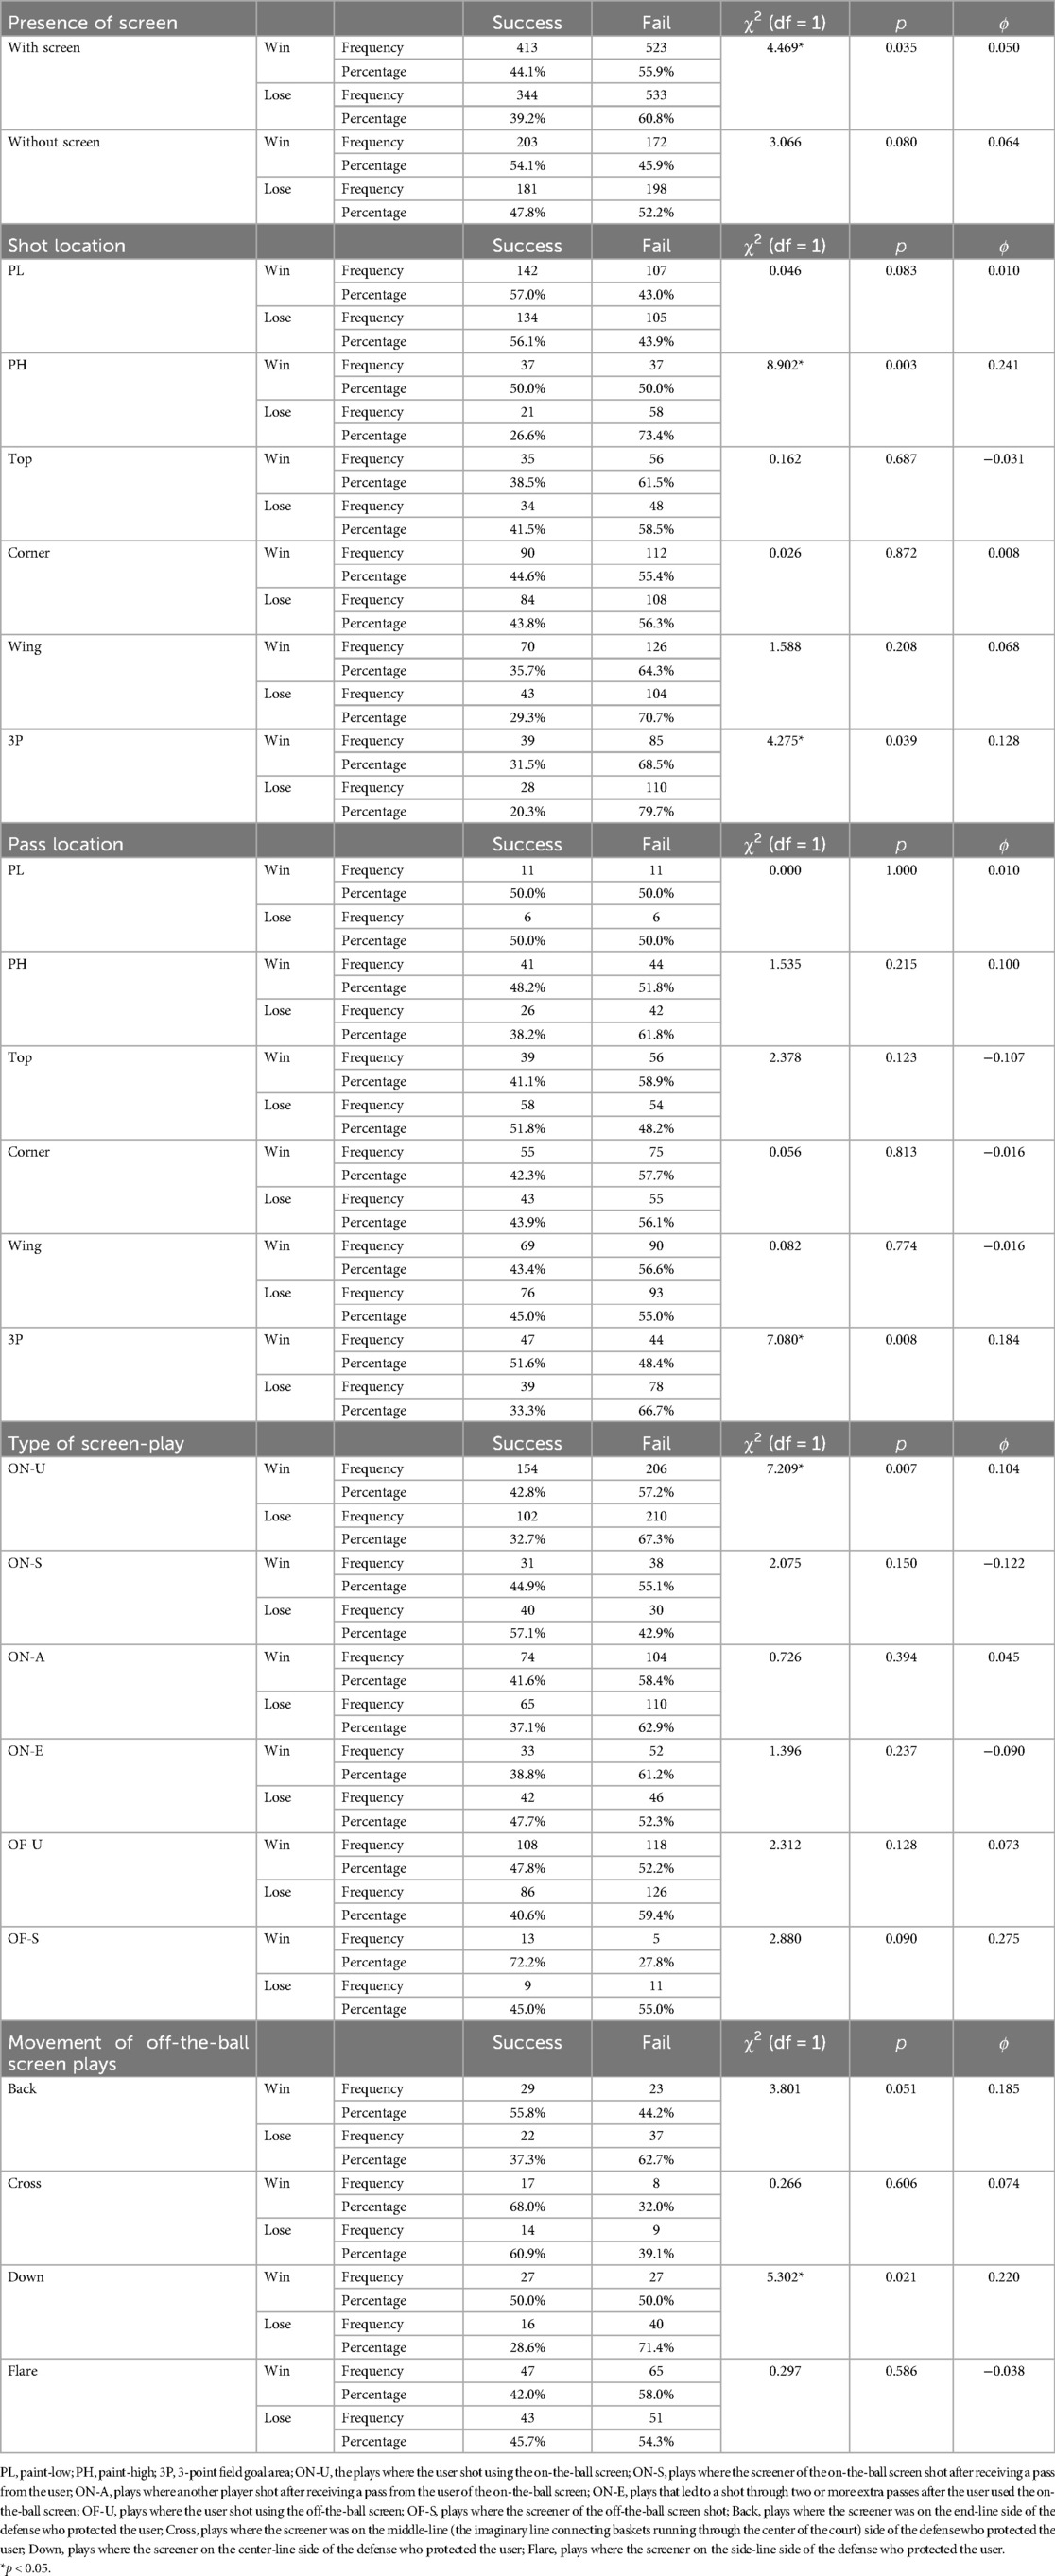
Table 2. Differences in shot-success rate of each categorical variable in screen-play.
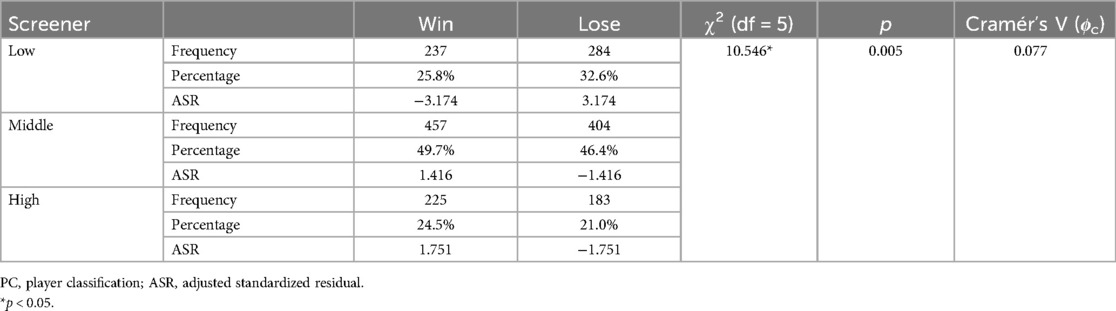
Table 3. Differences in the appearance frequency in screen-play depending on the PC.

Table 4. Differences in shot-success rate for each categorical variable depending on the PC of the shooter.
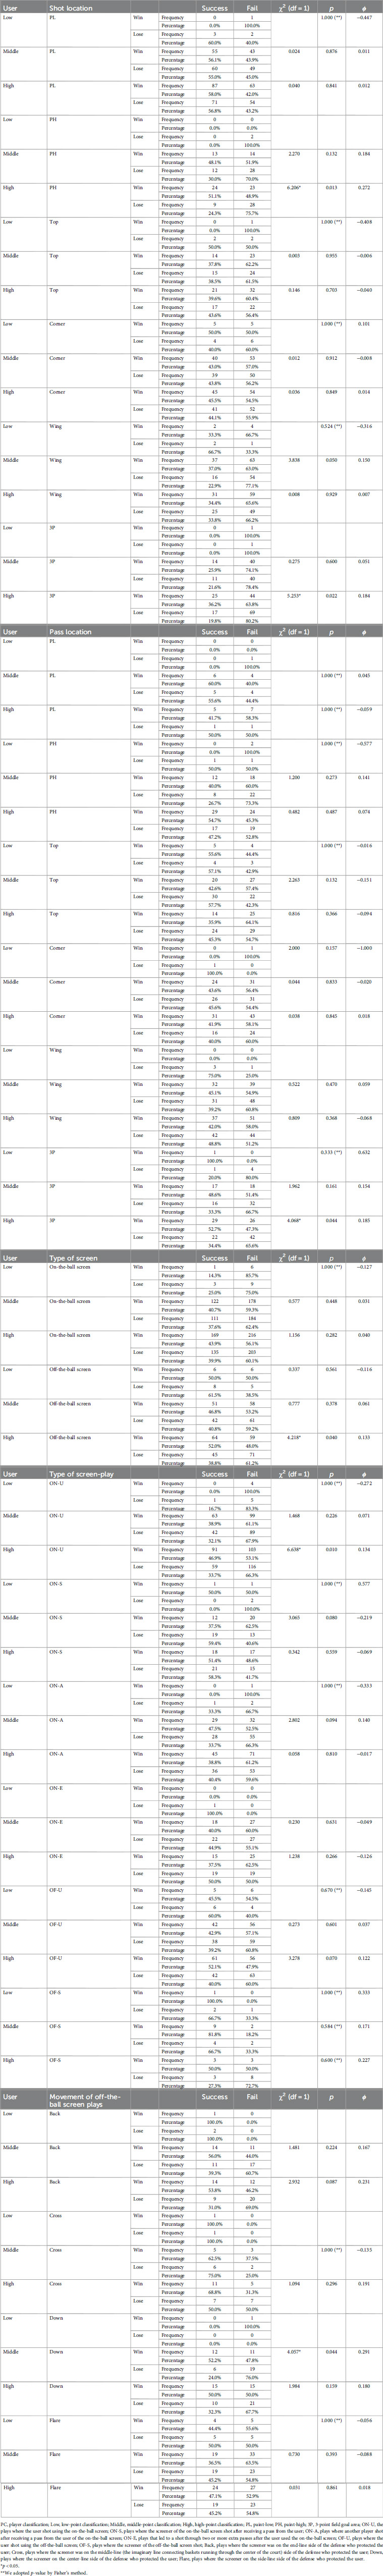
Table 5. Differences in shot-success rate for each categorical variable depending on the PC of the user.
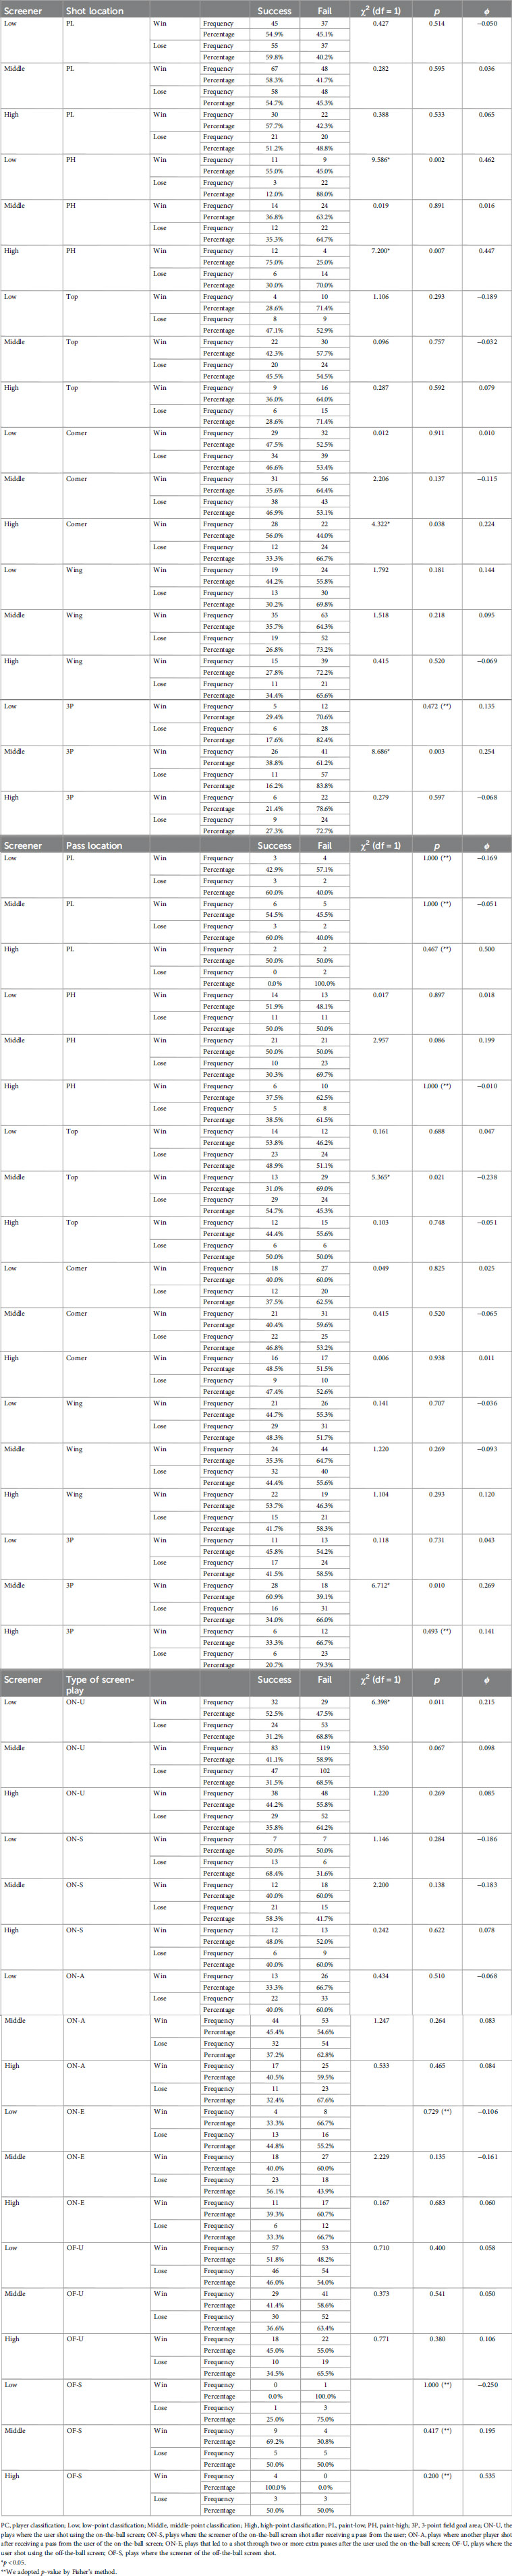
Table 6. Differences in shot-success rate for each categorical variable depending on the PC of the screener.
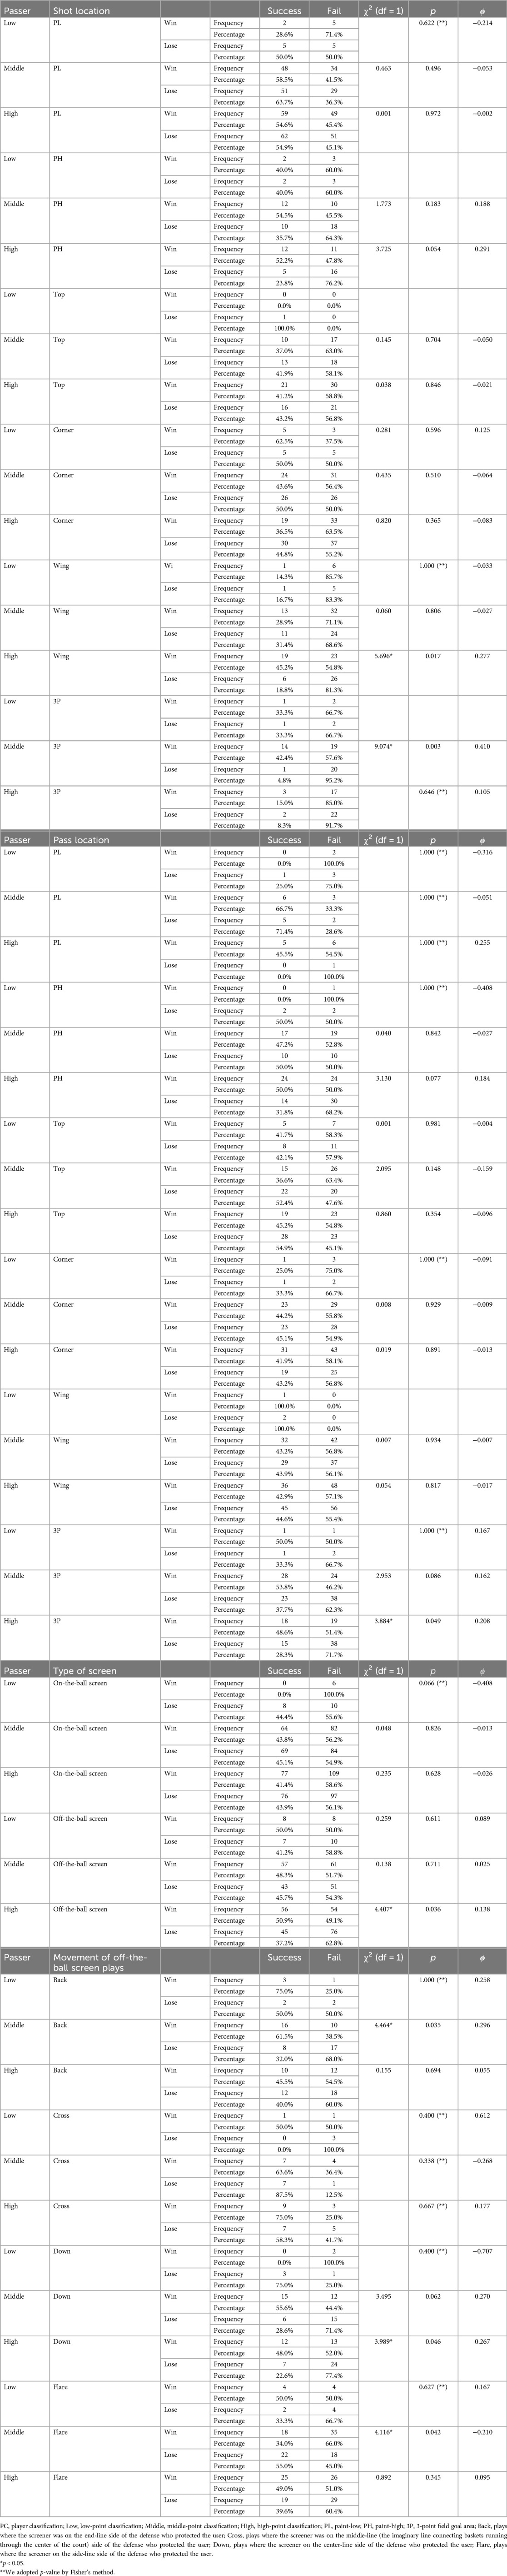
Table 7. Differences in shot-success rate for each categorical variable depending on the PC of the passer.
3.1 Differences in the appearance frequency and shot-success rate of each categorical variable in screen-play between winning and losing teams
Except for categorical variables related to PC, a comparison of the appearance frequency of the winning and losing teams confirmed a significant difference for the following two categories (Table 1): (Ⅳ) the screen location [χ2 (5) = 22.483, p < 0.001] and (V) pass location [χ2 (5) = 14.242, p = 0.014]. No significant differences were observed for other categories.
Regarding screen location, the appearance frequency in the PH was higher than expected in the winning team (ASR = 2.330), and lower than expected in the losing team (ASR = −2.330), while the appearance frequency in the Top was higher than expected in the losing team (ASR = 3.739), and lower than expected in the winning team (ASR = −3.739). Regarding pass location, the appearance frequency in the Corner was higher than expected in the winning team (ASR = 2.278), and lower than expected in the losing team (ASR = −2.278), while the appearance frequency in the 3P was higher than expected in the losing team (ASR = 2.073), and lower than expected in the winning team (ASR = −2.073).
Next, a significant difference was found in the shot-success rates of the winning and losing teams for five categories (Table 2): (Ⅱ) presence of a screen, (Ⅲ) shot location, (Ⅴ) pass location, (Ⅶ) type of screen-play, and (Ⅸ) movement of off-the-ball screen plays. No significant differences were observed for other categories.
Specifically, regarding the presence of a screen, the winning team (44.1%) had a significantly higher shot-success rate than the losing team (39.2%) (χ2 = 4.469, p = 0.035). Regarding shot location, in the plays where shots were delivered from the PH and 3P, the winning team (50.0% and 31.5%, respectively) had a significantly higher shot-success rate than the losing team (26.6% and 20.3%, respectively) (χ2 = 8.902, p = 0.003; χ2 = 4.275, p = 0.039, respectively). Regarding pass location, in the plays where the shooter received a pass from 3P, the winning team (51.6%) had a significantly higher shot-success rate than the losing team (33.3%) (χ2 = 7.080, p = 0.008). Regarding type of screen-play, for ON-U, the winning team (42.8%) had a significantly higher shot-success rate than the losing team (32.7%) (χ2 = 7.209, p = 0.007). Regarding movement of off-the-ball screen plays, in a Down movement of off-the-ball screen plays, the winning team (50.0%) had a significantly higher shot-success rate than the losing team (28.6%) (χ2 = 5.302, p = 0.021).
3.2 Differences in the appearance frequency and shot-success rate for each categorical variable between winning and losing teams, depending on the PC
3.2.1 Differences in the appearance frequency
Regarding the PC, a significant difference was found between the appearance frequency of the winning and losing teams for one category (Table 3): (Ⅻ) the PC of the screener [χ2 (2) = 10.546, p = 0.005]. No significant differences were observed for other categories.
The appearance frequency in the Low screener was higher than expected in the losing team (ASR = 3.174), and lower than expected in the winning team (ASR = −3.174).
3.2.2 PC of the shooter
Regarding the PC of the shooter on screen plays, a significant difference was confirmed in the shot-success rate between the winning and losing teams for nine categories (Table 4): (Ⅱ) presence of a screen, (Ⅲ) shot location, (Ⅳ) screen location, (Ⅴ) pass location, (Ⅵ) type of screen, (Ⅶ) type of screen-play, (Ⅷ) movement of on-the-ball screen plays, (Ⅺ) PC of the user, and (Ⅻ) PC of the screener. No significant differences were observed for other categories.
Regarding presence of a screen, when High players attempted shots on screen plays, the winning team (47.0%) had a significantly higher shot-success rate than the losing team (37.2%) (χ2 = 8.323, p = 0.004). Regarding shot location, when High players shot at the PH and 3P, the winning team (53.3% and 33.8%, respectively) had a significantly higher shot-success rate than the losing team (19.4% and 19.8%, respectively) (χ2 = 9.723, p = 0.002 and χ2 = 3.902, p = 0.048, respectively). Regarding screen location, when High players shot using a screen set on the Wing, the winning team (42.1%) had a significantly higher shot-success rate than the losing team (30.1%) (χ2 = 5.169, p = 0.023). However, when Low players attempted a shot using a screen set on the Wing, the winning team (21.1%) had a significantly lower shot-success rate than the losing team (53.8%) (χ2 = 5.602, p = 0.018). Regarding pass location, when Middle players received a pass from the Top and attempted a shot, the winning team (35.6%) had a significantly lower shot-success rate than the losing team (58.5%) (χ2 = 5.129, p = 0.024). Regarding type of screen, when High players shot using the on-the-ball screen and off-the-ball screen, the winning team (44.4% and 53.7%, respectively) had a significantly higher shot-success rate than the losing team (35.9% and 40.5%, respectively) (χ2 = 4.621, p = 0.032 and χ2 = 4.032, p = 0.045, respectively). Regarding type of screen-play, when High players selected ON-U, in the plays where the user attempted the shot as the shooter, the winning team (46.9%) had a significantly higher shot-success rate than the losing team (33.7%) (χ2 = 6.638, p = 0.010). Regarding movement of on-the-ball screen plays, in plays where High players made a shot after the user used the movement toward the center-line side, the winning team (49.6%) had a significantly higher shot-success rate than the losing team (36.0%) (χ2 = 4.722, p = 0.030). Regarding PC of the user, in plays where both the shooter and user were High players, the winning team (47.7%) had a significantly higher shot-success rate than the losing team (36.9%) (χ2 = 8.304, p = 0.004). Regarding PC of the screener, in plays where the shooter was a High player and the screener was a Middle player, the winning team (47.5%) had a significantly higher shot-success rate than the losing team (35.5%) (χ2 = 5.503, p = 0.019).
3.2.3 PC of the user
Regarding the PC of the user on screen plays, we confirmed a significant difference in the shot-success rate between the winning and losing teams for five categories (Table 5): (Ⅲ) shot location, (V) pass location, (Ⅵ) type of screen, (Ⅶ) type of screen-play, (Ⅸ) movement of off-the-ball screen plays. No significant differences were observed for other categories. Since ON-U is a play where the user attempts the shot as the shooter, the result of analyzing ON-U according to (Ⅶ) type of screen-play on this section is similar to that based on the PC of the shooter.
Regarding shot location, in the plays where the user was a High player and the shooter shot at the PH and 3P, the winning team (51.1% and 36.2%, respectively) had a significantly higher shot-success rate than the losing team (24.3% and 19.8%, respectively) (χ2 = 6.206, p = 0.013 and χ2 = 5.253, p = 0.022, respectively). Regarding pass location, in plays where the user was a High player and the shooter received a pass from the 3P immediately before the shot, the winning team (52.7%) had a significantly higher shot-success rate than the losing team (34.4%) (χ2 = 4.068, p = 0.044). Regarding type of screen, in plays where the shooter shot after a High user used the off-the-ball screen, the winning team (52.0%) had a significantly higher shot-success rate than the losing team (38.8%) (χ2 = 4.218, p = 0.040). Regarding movement of off-the-ball screen plays, in plays where the shooter shot after a Middle user used a Down movement, the winning team (52.2%) had a significantly higher shot-success rate than the losing team (24.0%) (χ2 = 4.057, p = 0.044).
3.2.4 PC of the screener
We confirmed a significant difference in the shot-success rates of the winning and losing teams according to the PC of the screener for three categories (Table 6): (Ⅲ) shot location, (Ⅴ) pass location, (Ⅶ) type of screen-play. No significant differences were observed for other categories.
Regarding shot location, in the plays where the screener was a Low player and the shooter shot at the PH, the winning team (55.0%) had a significantly higher shot-success rate than the losing team (12.0%) (χ2 = 9.586, p = 0.002). In plays involving a Middle screener and where the shooter shot at the 3P, the winning team (38.8%) had a significantly higher shot-success rate than the losing team (16.2%) (χ2 = 8.686, p = 0.003). In plays where the screener was a High player and the shooter shot at the PH and Corner, the winning team (75.0% and 56.0%, respectively) had a significantly higher shot-success rate than the losing team (30.0% and 33.3%, respectively) (χ2 = 7.200, p = 0.007 and χ2 = 4.322, p = 0.038, respectively). Regarding pass location, in plays involving a Middle screener and where the shooter shot after receiving a pass from the 3P, the winning team (60.9%) had a significantly higher shot-success rate than the losing team (34.0%) (χ2 = 6.712, p = 0.010). However, in plays involving a Middle screener and where the shooter shot after receiving a pass from the Top, the winning team (31.0%) had a significantly lower shot-success rate than the losing team (54.7%) (χ2 = 5.365, p = 0.021). Regarding type of screen-play, in plays involving a Low screener and where the shooter shot by ON-U, the winning team (52.5%) had a significantly higher shot-success rate than the losing team (31.2%) (χ2 = 6.398, p = 0.011).
3.2.5 PC of the passer
Regarding the PC of the passer on screen plays, we confirmed a significant difference in the shot-success rates of the winning and losing teams for four categories (Table 7): (Ⅲ) shot location, (Ⅴ) pass location, (Ⅵ) type of screen, (Ⅸ) movement of off-the-ball screen plays. No significant differences were observed for other categories.
Regarding shot location, in the plays where the passer was a Middle player and the shooter shot at the 3P, the winning team (42.4%) had a significantly higher shot-success rate than the losing team (4.8%) (χ2 = 9.074, p = 0.003). When the passer was a High player and the shooter shot at the Wing, the winning team (45.2%) had a significantly higher shot-success rate than the losing team (18.8%) (χ2 = 5.696, p = 0.017). Regarding pass location, in the plays where the passer was a High player and the shooter shot after receiving a pass from the 3P, the winning team (48.6%) had a significantly higher shot-success rate than the losing team (28.3%) (χ2 = 3.884, p = 0.049). Regarding type of screen, when the passer was a High player and the shooter shot after the user used the off-the-ball screen, the winning team (50.9%) had a significantly higher shot-success rate than the losing team (37.2%) (χ2 = 4.407, p = 0.036). Regarding movement of off-the-ball screen plays, when the passer was a Middle player and the shooter shot after the user used a Back movement, the shot-success rate was significantly higher in the winning team (61.5%) than in the losing team (32.0%) (χ2 = 4.464, p = 0.035). However, when the passer was a Middle player and the shooter shot after the user used a Flare movement, the winning team (34.0%) had a significantly lower shot-success rate than the losing team (55.0%) (χ2 = 4.116, p = 0.042). In the plays where the passer was a High player and the shooter shot after the user used a Down movement, the shot-success rate of the winning team (48.0%) was significantly higher than that of the losing team (22.6%) (χ2 = 3.989, p = 0.046).
4 Discussion
4.1 Differences in play style between the winning and losing teams in screen-play
The collective impact of different screen-play types creates distinct play styles between the winning and losing teams. The winning teams strategically positioned their screens in the central area of the court (relatively close to the basket) for offense, as they appeared significantly more frequently at the PH area than at the Top in terms of screen location. Additionally, for offensive passing, the winning teams predominantly utilized the side-line position (relatively close to the end-line) of the court for offense, as they appeared significantly more frequently in the Corner location than in the 3P in terms of pass location. Research of on-the-ball screen plays focusing on a running basketball team that finished runners-up in the World Championship men's games in 2006 indicates that the team tended to set a screen in the central location of the court, not the side-line side (22). However, the team tended to set their screens more in “the high court area”, a location far from the basket. Given that the winning teams set more screens at the PH, closer to the basket, there may be differences in the effective locations for setting screens between wheelchair basketball and running basketball. Furthermore, a previous study has reported that setting a screen on the side-line side is more effective in enabling users to progress toward the end-line side (12). The critical point of view common to both is using screen plays to create free space (16, 23). Therefore, although significant differences were not confirmed regarding screen plays on the side-line side (Corner, Wing), the winning team may have set screens in appropriate locations and used the free space effectively created by screen plays, as recommended in running basketball.
Considering the result of presence of a screen, the winning team used screen-play effectively to score. Regarding the shot location, the winning team made shots at a higher success rate than the losing team, not only at a location relatively close to the basket, such as PH, but also at a location far from the basket, such as 3P. Given that there is a higher tendency for more shots to be taken in the paint than in other locations in wheelchair basketball (24), it is necessary to consider the practical use of screen plays for shooting at a location close to the basket to make shots with a high success rate. However, it is also necessary to consider the practical use of screen plays for shooting at a location far from the basket due to the difference in the points obtained per shot (i.e., 2-point vs. 3-point shots). Specifically, when considering the practical use of screen plays as an offensive tactic, if there are few defenders around the basket and it is possible to penetrate there, aiming for the shot relatively close to the basket is effective in terms of shot-success rate. On the other hand, if there are many defenders around the basket and a higher shot-success rate cannot be expected, aiming for the shot at 3P is effective in terms of scoring efficiency. In recent trends in running basketball, the number of 3-point shots and shots in the paint has been rising, while the number of midrange 2-point shots has been decreasing (15, 25). The number of shots at 3P is not large in wheelchair basketball screen plays; in this study, the proportion of these shots out of the total number of shots was 13.2% (124/936) and 15.7% (138/877) for the winning and losing teams, respectively. However, increasing the number of shots at 3P may be effective, as in running basketball. This is because having the ball player farther from the basket can lure the defense away from the basket. Luring the defense may allow the ball player to easily get past the defense if the distance to the player is short and the time lag is very short (23). Moreover, there is no “double dribble” violation in wheelchair basketball, which is different from running basketball (10, 17). Therefore, for attacking near the basket in wheelchair basketball, it may also be effective to create situations where players can shoot at a 3P, luring the defense further away from the basket. Regarding the screen location, considering above results (difference between the PH and Top), in wheelchair basketball, a location relatively close to the basket is an important space that should be used not only as a location to shoot but also as a location to set a screen. Additionally, regarding the pass location, the above difference in the shot-success rate at the 3P likely affected the finding in plays where a pass was issued from the 3P to the shooter. We believe this finding might have been a direct consequence of defenses focusing on players with good shooting ability, which could create a greater possibility for other players to shoot. However, further research may be needed to verify this notion. Considering these points, when using screen plays practically in wheelchair basketball, it is essential to use the following locations to shoot, set screens, and pass: one closer to the basket in the paint and one farther from the basket at 3P.
Regarding the type of screen-play, we found that the winning team showed a higher ON-U shot accuracy. Studies on screen-play in running basketball have verified the effectiveness of a tactic, where the ball handler was the user, known as Pick & Roll (12, 16, 22, 23, 26, 27). In this study, approximately 96.4% (612/635) of screen plays using the on-the-ball screen targeted for this analysis corresponded to the Pick & Roll tactic. Some of these studies have reported that users' shots employing the Pick & Roll maneuver are effective (12, 23). However, some of these studies have also reported that the plays where the user passes after using the screen are efficient (16, 22, 27). Although the number was smaller than that of ON-U (winning team: 154/360, 42.8%; losing team: 102/312, 32.7%), the result of this study indicated that ON-S had a higher shot-success rate for both winning and losing teams (31/69, 44.9% and 40/70, 57.1%, respectively). Therefore, improving the accuracy of the Pick & Roll maneuver is crucial in wheelchair basketball, as in running basketball. Specifically, it is essential in screen-play to suppose various situations in which the user has difficulty shooting and practice repeatedly so that players can make the more appropriate choice (e.g., who to pass to). The number of plays that led to a successful shot using the on-the-ball screen (541) was significantly higher than that of those that led to a shot using the off-the-ball screen (216) (χ2 = 139.531, p < 0.001). However, since the shot-success rate in a Down movement was significantly higher for the winning team than the losing team, the winning team effectively used the off-the-ball screen plays. Furthermore, just as the off-the-ball screen should be used for purposes other than shooting in running basketball (26), it may also be necessary to consider using it for purposes other than shooting in wheelchair basketball; hence, the practical use of the off-the-ball screen should not be overlooked.
4.2 Relationship between screen-play and the PC
This study's result shows the losing team more typically assigned Low players to screeners than the winning team. Additionally, no significant difference was observed in the frequency of Low and High screeners (237/919, 25.8% and 225/919, 24.5%, respectively) in the winning team (χ2 = 0.312, p = 0.577), while a significant difference was found in this frequency (284/871, 32.6% and 183/871, 21.0%, respectively) in the losing team (χ2 = 21.844, p < 0.001). In the traditional wheelchair basketball offense, “the low pointers” are encouraged to work to set the screen to get “the high pointers” free for high-percentage shots (14). Although it is possible that “the low pointers” and “the high pointers” do not entirely match our division of Low and High, the results from the present study show that the winning team adopted a different strategy from this encouragement. Therefore, it is necessary to consider the balance with other players rather than simply fixing Low players in the role of screeners. Considering the result of differences in the appearance frequency regarding the screener depending on the PC, a practical solution may be to assign approximately 50% of screener roles to Middle players, and to balance the remainder between Low and High players. In wheelchair basketball, to represent the roles of each player with different PCs, Low, Middle, and High players are frequently categorized as guards, forwards, and centers, respectively, corresponding to running basketball positions (5, 24). In running basketball screen-play, it is more effective for the center to play the role of screener (12). Therefore, this result shows the difference in player roles in wheelchair and running basketball.
Regarding differences in the shot-success rate according to the PC of the shooter, High players primarily contributed to the winning team's successful plays. This shows a tendency similar to that reported in previous studies in wheelchair basketball (8, 24, 28). Additionally, the various results that showed a significant difference only in High players between the winning and losing teams indicate High players' contributions to screen-play. High players' contributions as shooters can be confirmed by the following results: (Ⅱ) presence of a screen (in plays with screen), (Ⅲ) shot location (in plays where shot at PH and 3P), (Ⅳ) screen location (in plays where screens set at Wing), (Ⅵ) type of screen (in plays with the on-the-ball and off-the-ball screen plays), (Ⅶ) type of screen-play (in plays where used ON-U), (Ⅷ) movement of on-the-ball screen plays (in plays where used Center-line movement), (Ⅺ) PC of the user (in plays where the users were High), and (Ⅻ) PC of the screener (in plays where the screeners were Middle). The results described in the previous section were directly influenced by whether the shooter was a High player: the winning team had a higher shot-success rate than the losing team when shooting at the PH, which is relatively close to the basket, and at 3P, which is far from the basket. However, regarding the results of screen and pass locations, when the shooter was a Low or Middle player, the shot-success rate of the losing team was higher than that of the winning team. This result is highly likely related to the findings of Gil et al. (29), who reported that differences in strength of the trunk muscles and pelvic stability due to classification affected the distance when throwing or passing a ball. Furthermore, the higher PC players tended to have a higher sitting body height (29). Therefore, their ball-release position was higher than that of lower PC players, and the ball could reach the ring even with a lower release velocity (30, 31). Thus, creating a situation where a High player can shoot is more important for ensuring a high success rate. In addition, considering the result of the type of screen, the High shooters of the winning team could use the on-the-ball screen and off-the-ball screen practically without distinction for screen plays. However, we found a significant difference in the type of screen-play only for ON-U. Thus, when the shooter is a High player, it is possible that the practical use of the on-the-ball screen, which occurs more frequently, has a more substantial effect on the outcome than that of the off-the-ball screen. Moreover, considering that setting screens to facilitate users' movement toward the central location of the court in running basketball is effective (12), the High player's Center-line movement of on-the-ball screen plays may have been more effective.
For the results of PH and 3P in shot location and the off-the-ball screen in the type of screen regarding the PC of the user, the High players of the winning team recorded a higher shot-success rate, and these results are almost identical to those regarding the shooter. Moreover, 52.0% (360/692) of the on-the-ball screen plays were ON-U, and 92.6% (226/244) of the off-the-ball screen plays were OF-U in the winning team. Since both categories refer to plays in which the user takes a shot, the user may have contributed to the winning team's success, mainly as the shooter. However, considering the result according to 3P in the pass location of the PC of the passer, it may be effective for the user to become the passer instead of the shooter. In other words, not only did the High players of the winning team make high-percentage 3-point shots, but they also made passes at 3P that led to high-percentage shots. On the other hand, in addition to the High players, other classification players also contributed as users to the team's success in the winning team. The winning team had a higher shot-success rate in a Down movement of off-the-ball screen plays than the losing team, and this result is related to the contributions of the Middle players as users. Therefore, since Middle players contribute significantly as users, it is impractical to use only High players as users.
Considering the results of PH in shot location and ON-U in the type of screen-play regarding the PC of the screener, the Low players contributed to the winning team's successful plays executing their roles as screeners. In addition, the winning team's Middle players contributed as screeners in plays where shots and passes were made at 3P, and High players contributed as screeners in plays where shots were made at PH and Corner. The result of the Low screener in the winning team may indicate the Low players' contribution in the plays mentioned so far where shots were made at PH (as shown in Table 2). Similarly, in the winning team, Middle screeners may have contributed in plays where shots were made at 3P, and High screeners may have contributed in plays where shots were made at PH. Therefore, although at different frequencies, Low, Middle, and High players contributed as screeners. Furthermore, the High players of the winning team contributed as screeners in plays where shots were made at the Corner, a priority location in wheelchair basketball for shooting a field goal in the study of Francis et al. (8). Additionally, as mentioned above, the winning team utilized the Corner as the pass location more than the losing team. Thus, our findings might indicate that the winning team follows the theory for using screen-play. In addition, in the winning team, the Middle screeners' contributions in plays where the shooter received a pass from the 3P may be related to the results of the pass location of High passers described in the previous section (as shown in Table 7). Low players in the winning team contributed as screeners to ON-U, whose importance we have previously described. In other words, High player's successful performance in screen-play as a shooter is only possible thanks to the contributions of Middle and Low players. Therefore, when practicing screen plays in wheelchair basketball, it is vital to consider the actions of Middle and Low players in the screener's role, creating a situation where the shooter can shoot with a high success rate. However, considering the result of the screener in pass location, a difference in the tendency to make practical use of screen plays between the winning and losing teams needs to be considered, even if the screener was a Middle player.
Regarding the difference in the shot-success rate from the perspective of the PC of the passer, we found that Middle and High players contributed to the winning team's success. The winning team succeeded in plays where the shooter received a pass from a Middle player and shot at 3P. Thus, Middle players contributed not only as screeners but also as passers. Additionally, in plays where the shooter shot after receiving a pass from 3P, the winning team had a higher shot-success rate when the passer was a High player. Therefore, plays might be constructed more effectively by considering the results of the PC of the shooter regarding the shot location and the PC of the user regarding the pass location, and the results of the PC of the passer additionally. For instance, if the screen user with good shooting ability holds the ball far from the basket, the defense is forced to respond to prevent the user from shooting. By creating such a situation where other players can receive the pass and shoot with a high success rate and where the user can also contribute as a passer, the offense is highly likely to construct the play effectively. Since a play with an off-the-ball screen always involves a pass, the results of type of screen and movement of off-the-ball screen plays must be considered. In the winning team's off-the-ball screen plays, a High passer contributed to the successful plays, especially those with a Down movement. On the other hand, in the plays where a Middle player was the passer, the fact that the winning team had a higher shot-success rate on the Back than on the Flare movement of off-the-ball screen plays compared to losing team indicates a difference in the tendency to make practical use of screen plays between the winning and losing teams. Moreover, these results may be related to the results of the PC of the screener regarding the pass location. Therefore, the passer should understand the type of movement that is appropriate for the screen and the location from which to pass.
Thus, this study's results clearly showed that High players make a direct and significant contribution to scoring, similar to those of previous studies (8, 24, 28). However, it is also clear that Low and Middle players in the winning team played roles as screeners and passers and contributed to the success of screen plays. Therefore, as in the report of Hindawi et al. (32), since players in highly competitive teams may have a high level of thinking and understanding of offensive tactics, it is necessary to understand the tendency in screen plays regardless of the PC. Furthermore, it is necessary to consider that the sum of the PC of the five players playing on the court in wheelchair basketball is limited to 14.0. Therefore, it is essential to pay more attention to the contribution of each of the players with different PCs in each process leading up to the shot in screen-play as offensive tactics in wheelchair basketball.
4.3 Practical application
Based on the above considerations, the following plays may hold practical value (Figure 5): when a High dribbles toward the Corner, and uses the screen of a Low screener in the Center-line movement of on-the-ball screen plays, the defense may attempt to prevent a shot of ON-U, allowing this High user to make a pass to a teammate at the Top (Figure 5A). If a defense attempts to prevent a shot at the Top further, the player receiving the pass can make another pass to the High player, who moves to the 3P using the Down movement of off-the-ball screen plays (Figure 5B). If the High player receiving a pass is expected to have a high shot-success rate at 3P, this play would be more effective. This is because the High player holding a ball may have several options to make a more effective pass besides shooting from the 3P at this time (Figures 5C,D). Thus, effective options would change depending on how a defense reacts to the movement of screen plays.
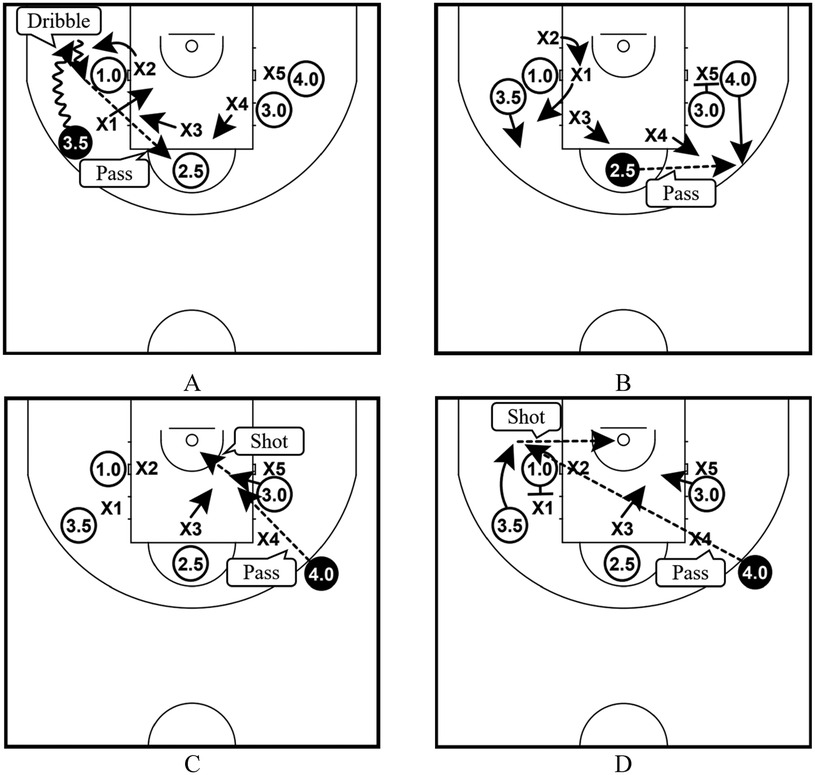
Figure 5. Example of practical application; (A) A high user uses the screen of a Low screener in the center-line movement. Against the play, a defense tries to prevent a shot of ON-U. The High user makes a pass to the teammate at the Top; (B) A defense tries to prevent a shot at the Top. The Middle player receiving the pass on Top makes a pass to the High player, who moves to the 3P using the Down movement of off-the-ball screen plays; (C) the High player receiving the pass at 3P makes a pass to the Middle screener, who dives close to the basket; (D) the High player receiving the pass at 3P makes a pass to the High user, who uses the off-the-ball screen from a Back movement.
4.4 Limitations
Our study had some limitations. First, a single observer extracted data in this study. However, we did not evaluate intra-rater reliability, which is important to ensure consistency during video analysis (33). Therefore, the actual reliability of video analysis in this study is unknown, which could have affected the quality of data extraction. Second, although we recorded 3,841 possessions, and the results of this study show a tendency similar to that reported in previous studies, the method of recording by a single observer may have increased the possibility of data recording errors in addition to the observer bias. Third, since this study primarily focused on the success rate of shots about screen-play, other critical aspects of wheelchair basketball gameplay, such as turnovers, assists, or defensive actions, may have been overlooked. Furthermore, since the results obtained in this study are limited to the men's games in the Tokyo Paralympics, some variables may have been affected by other competitions and categories. Doi et al. revealed differences between men's and women's teams regarding how offensive rebounds, number of successful field goals, steals, and turnovers affect the team's total scores (28, 34). Therefore, the limited focus on elite men's games may restrict the broader relevance and applicability of the study findings. Additionally, despite the findings that passing to a screener, who moves close to the basket, is effective in running basketball (16, 22, 27), the results regarding the type of screen-play in this study could have shown limited evidence except for the direct effects of the specific on-the-ball screen play (ON-U). Thus, there may be a discrepancy in recognizing the teaching practice. In the future, it will be necessary to conduct surveys and construct new analytical frameworks to overcome these issues.
5 Conclusion
In wheelchair basketball offenses, it may be effective to consider the following points in the scenario lead-up to a shot: Regarding the shot, screen, and pass, it could be necessary to use screen plays practically in two different spaces (in the paint and at the 3P). Moreover, it appears vital to improve the on-the-ball screen plays' accuracy, particularly ON-U, which is equivalent to a Pick & Roll maneuver that is also effective in running basketball. Furthermore, using both the on-the-ball screen and off-the-ball screen seems to be a factor in winning the game. In wheelchair basketball screen plays, it may be practical to allocate approximately 50% of the screener roles to Middle players and the rest to Low and High players, at approximately 25% each. Regarding the PC, to win the game, High players should play the roles of shooters and users; Low, Middle, and High players should act as screeners; and Middle and High players should play the roles of passers to contribute to the success of plays. Players expected to have a high shot-success rate may be able to contribute to screen plays more effectively as passers by understanding effective movement and passing options of screen plays. In wheelchair basketball screen-play, further research on the contributions of each player based on different PCs is essential.
Data availability statement
The original contributions presented in the study are included in the article/Supplementary Material, further inquiries can be directed to the corresponding author.
Ethics statement
The studies involving humans were approved by Institutional Review Board of Ibaraki Prefectural University of Health Sciences. The studies were conducted in accordance with the local legislation and institutional requirements. Written informed consent for participation was not required from the participants or the participants’ legal guardians/next of kin in accordance with the national legislation and institutional requirements.
Author contributions
TY: Conceptualization, Data curation, Formal Analysis, Investigation, Methodology, Resources, Validation, Visualization, Writing – original draft, Writing – review & editing. KT: Conceptualization, Formal Analysis, Funding acquisition, Methodology, Project administration, Resources, Supervision, Writing – review & editing. HM: Conceptualization, Formal Analysis, Funding acquisition, Methodology, Supervision, Writing – review & editing.
Funding
The author(s) declare financial support was received for the research, authorship, and/or publication of this article. This work was supported by Grants-in-Aid for Project Research (No. 2165-1 and 2470-1) from the Ibaraki Prefectural University of Health Sciences.
Acknowledgments
The authors want to acknowledge the Ibaraki Prefectural University of Health Sciences (IPUHS) for providing a research grant to fund this project and IPUHS Assistant Professor Hiroshi Yuine, who represents the project (No. 2470-1). The authors would also like to thank Editage (www.editage.com) for English language editing.
Conflict of interest
The authors declare that the research was conducted in the absence of any commercial or financial relationships that could be construed as a potential conflict of interest.
Publisher's note
All claims expressed in this article are solely those of the authors and do not necessarily represent those of their affiliated organizations, or those of the publisher, the editors and the reviewers. Any product that may be evaluated in this article, or claim that may be made by its manufacturer, is not guaranteed or endorsed by the publisher.
Supplementary material
The Supplementary Material for this article can be found online at: https://www.frontiersin.org/articles/10.3389/fspor.2024.1418130/full#supplementary-material
Abbreviations
ASR, adjusted standardized residual; PC, player classification; Middle, middle-point classification; Low, low-point classification; High, high-point classification; PL, paint-low; PH, paint-high; 3P, 3-point field goal area; ON-U, the plays where the user shot using the on-the-ball screen; ON-S, plays where the screener of the on-the-ball screen shot after receiving a pass from the user; ON-A, plays where another player shot after receiving a pass from the user of the on-the-ball screen; ON-E, plays that led to a shot through two or more extra passes after the user used the on-the-ball screen; OF-U, plays where the user shot using the off-the-ball screen; OF-S, plays where the screener of the off-the-ball screen shot.
References
1. International Wheelchair Basketball Federation. History of wheelchair basketball. (2022). Available online at: https://iwbf.org/the-game/history-wheelchair-basketball/ (Accessed October 7, 2022)
2. Silver JR. Ludwig Guttmann (1899–1980), stoke Mandeville hospital and the paralympic games. J Med Biogr. (2012) 20:101–5. doi: 10.1258/jmb.2012.012055
3. International Wheelchair Basketball Federation. Who we are. (2023). Available online at: https://iwbf.org/about-us/who-we-are/ (Accessed June 29, 2023)
4. International Wheelchair Basketball Federation. 2021 IWBF player classification rules. (2021). Available online at: https://iwbf.org/wp-content/uploads/2021/11/2021-IWBF-Classification-Rules-Version-202110-1.pdf (Accessed October 7, 2022)
5. Vanlandewijck YC, Evaggelinou C, Daly DD, Van Houtte S, Verellen J, Aspeslagh V, et al. Proportionality in wheelchair basketball classification. Adapt Phys Activ Q. (2003) 20:369–80. doi: 10.1123/apaq.20.4.369
6. Molik B, Kosmol A, Morgulec-Adamowicz N, Laskin JJ, Jezior T, Patrzalek M. Game efficiency of elite female wheelchair basketball players during world championships (gold cup) 2006. EUJAPA. (2009) 2:26–38. doi: 10.5507/euj.2009.007
7. Gómez MÁ, Pérez J, Molik B, Szyman RJ, Sampaio J. Performance analysis of elite men’s and women’s wheelchair basketball teams. J Sports Sci. (2014) 32:1066–75. doi: 10.1080/02640414.2013.879334
8. Francis JW, Owen AJ, Peters DM. Predicting field-goal success according to offensive, defensive and contextual variables in elite men’s wheelchair basketball. PLoS One. (2021) 16:e0244257. doi: 10.1371/journal.pone.0244257
9. Johnson P. Screens and screen plays. In: Gandolfi G, editor. NBA Coaches Playbook: Techniques, Tactics, and Teaching Points. Champaign, IL, United States: Human Kinetics Publishers (2008). p. 51–71.
10. International Wheelchair Basketball Federation. 2023 IWBF official wheelchair basketball rules. (2023). Available online at: https://iwbf.org/wp-content/uploads/2023/03/2023_IWBF_rules-Ver2_underlined-small.pdf (Accessed May 26, 2024)
12. Gómez MÁ, Battaglia O, Lorenzo A, Lorenzo J, Jiménez S, Sampaio J. Effectiveness during ball screens in elite basketball games. J Sports Sci. (2015) 33:1844–52. doi: 10.1080/02640414.2015.1014829
13. Wheelchair Basketball Canada. Wheelchair basketball athlete development model. (2015). Available online at: https://www.wheelchairbasketball.ca/wp-content/uploads/2015/03/LTAD-Vol-1-Final-Lowres.pdf (Accessed May 26, 2024)
14. Basketball Australia. Coaching wheelchair basketball. (2018). Available online at: https://coach.basketball.net.au/wp-content/uploads/2018/04/2017-Coaching-Wheelchair-Basketball.pdf (Accessed May 26, 2024)
15. Gómez MA, Alarcón F, Ortega E. Analysis of shooting effectiveness in elite basketball according to match status. Rev Psicol Deporte. (2015) 24:37–41.
16. Santana F, Fellingham G, Rangel W, Ugrinowitsch C, Lamas L. Assessing basketball offensive structure: the role of concatenations in space creation dynamics. Int J Sports Sci Coach. (2019) 14:179–89. doi: 10.1177/1747954118825068
17. National Wheelchair Basketball Association. 2024–2025 official case book. (2024). Available online at: https://cdn1.sportngin.com/attachments/document/7c0c-3225498/2024-2025_NWBA_Case_Book.pdf (Accessed July 29, 2024)
18. Symeonidou S, Karamousalidis G, Stavropoulos N, Ntikas T, Zavaropoulos A, Galazoulas C. Effect of pick and roll exploitation speed on mismatch situations. J Phys Educ Sport. (2021) 21:837–42. doi: 10.7752/jpes.2021.02104
19. Agresti A. An introduction to Categorical Data Analysis. 3rd ed. Hoboken, NJ: John Wiley & Sons (2019).
20. Sharpe D. Your chi-square test is statistically significant: now what? Practical assessment. Res Eval. (2015) 20:1–10. doi: 10.7275/tbfa-x148
21. Fritz CO, Morris PE, Richler JJ. Effect size estimates: current use, calculations, and interpretation. J Exp Psychol Gen. (2012) 141:2–18. doi: 10.1037/a0024338
22. Polykratis M, Tsamourtzis E, Mavridis G, Zaggelidis G. Relation of effectiveness in pick n’ roll application between the national Greek team of and its opponents during the men’s world basketball championship of 2006. J Phys Educ Sport. (2010) 29:57–67.
23. Lamas L, Junior DDR, Santana F, Rostaiser E, Negretti L, Ugrinowitsch C. Space creation dynamics in basketball offence: validation and evaluation of elite teams. Int J Perform Anal Sport. (2011) 11:71–84. doi: 10.1080/24748668.2011.11868530
24. Arroyo R, Alsasua R, Arana J, Lapresa D, Anguera MT. A log-linear analysis of efficiency in wheelchair basketball according to player classification. J Hum Kinet. (2022) 81:221–31. doi: 10.2478/hukin-2022-0022
25. Schuhmann J. NBA’s 3-point revolution: how 1 shot is changing the game. (2021). Available online at: https://www.nba.com/news/3-point-era-nba-75/ (Accessed September 22, 2023)
26. Remmert H. Analysis of group-tactical offensive behavior in elite basketball on the basis of a process orientated mod-el. Eur J Sport Sci. (2003) 3:1–12. doi: 10.1080/17461390300073311
27. Marmarinos C, Apostolidis N, Kostopoulos N, Apostolidis A. Efficacy of the “pick and roll” offense in top level European basketball teams. J Hum Kinet. (2016) 51:121–9. doi: 10.1515/hukin-2015-0176
28. Doi T, Mutsuzaki H, Tachibana K, Wadano Y, Iwai K. Contributions to the team score by male wheelchair basketball players with different physical capacities at the Rio 2016 paralympics. J Phys Ther Sci. (2018) 30:948–51. doi: 10.1589/jpts.30.948
29. Gil SM, Yanci J, Otero M, Olasagasti J, Badiola A, Bidaurrazaga-Letona I, et al. The functional classification and field test performance in wheelchair basketball players. J Hum Kinet. (2015) 46:219–30. doi: 10.1515/hukin-2015-0050
30. Goosey-Tolfrey V, Butterworth D, Morriss C. Free throw shooting technique of male wheelchair basketball players. Adapt Phys Activ Q. (2002) 19:238–50. doi: 10.1123/apaq.19.2.238
31. Malone LA, Gervais PL, Steadward RD. Shooting mechanics related to player classification and free throw success in wheelchair basketball. J Rehabil Res Dev. (2002) 39:701–9.17943672
32. Hindawi OS, Orabi S, Arjan JA, Judge LW, Cottingham M II, Bellar DM. Offensive tactical thinking level of wheelchair basketball players in Arab countries. Eur J Sport Sci. (2013) 13:622–9. doi: 10.1080/17461391.2013.771383
33. Pernigoni M, Ferioli D, Butautas R, La Torre A, Conte D. Assessing the external load associated with high-intensity activities recorded during official basketball games. Front Psychol. (2021) 12:668194. doi: 10.3389/fpsyg.2021.668194
Keywords: tactical behavior, para-sports, performance analysis, sports performances, team sports
Citation: Yasuda T, Tachibana K and Mutsuzaki H (2024) Relationship between screen-play scenarios' effectiveness and player classification in elite wheelchair basketball based on match results of Tokyo 2020 Paralympic Games. Front. Sports Act. Living 6:1418130. doi: 10.3389/fspor.2024.1418130
Received: 30 April 2024; Accepted: 22 August 2024;
Published: 13 September 2024.
Edited by:
Davide Ferioli, University of Messina, ItalyReviewed by:
Giacomo Farì, University of Bari Aldo Moro, ItalyInga Lukonaitiene, Lithuanian Sports University, Lithuania
Marco Pernigoni, Lithuanian Sports University, Lithuania, in collaboration with reviewer IL
Copyright: © 2024 Yasuda, Tachibana and Mutsuzaki. This is an open-access article distributed under the terms of the Creative Commons Attribution License (CC BY). The use, distribution or reproduction in other forums is permitted, provided the original author(s) and the copyright owner(s) are credited and that the original publication in this journal is cited, in accordance with accepted academic practice. No use, distribution or reproduction is permitted which does not comply with these terms.
*Correspondence: Taku Yasuda, eWFzdWRhdGFAaXB1LmFjLmpw