 Chiel Poffé
 Kaat Van Dael
 Reinout Van Schuylenbergh
95% of researchers rate our articles as excellent or good
Learn more about the work of our research integrity team to safeguard the quality of each article we publish.
Find out more
ORIGINAL RESEARCH article
Front. Sports Act. Living , 07 May 2024
Sec. Exercise Physiology
Volume 6 - 2024 | https://doi.org/10.3389/fspor.2024.1376876
This article is part of the Research Topic Advancements in Cycling Performance Enhancement Strategies for Cyclists: From Amateurs to Elite View all 7 articles
Introduction: The maximal lactate steady state (MLSS) is defined as the highest workload that can be maintained without blood lactate accumulation over time. The power output at MLSS (PMLSS) is regularly implemented to define training zones, quantify training progress, or predict race performance. The gold standard methodology for MLSS determination requires two to five trials of constant-load exercise, which limits the practical application in training. The INSCYD software can calculate the PMLSS (PMLSSINSCYD) based on physiological data that can be obtained during a ∼1 h laboratory visit. However, to the best of our knowledge, the validity of the most recent software version has not yet been investigated. This study aimed to assess the validity of the software's calculations on PMLSS in cycling.
Methods: The data for this study were retrieved from two published scientific sources. Thirty-one cyclists (19 males, 12 females) performed a 15 s sprint to estimate the VLamax, a ramp test for the assessment, and two to five constant-load tests to determine the PMLSS. The INSCYD software was used to calculate the PMLSS based on the , VLamax, sex, body mass, and body composition.
Results: The PMLSSINSCYD was higher than the PMLSS in the entire sample (mean difference: 4.6 W, p < 0.05, 95% CI 0.8–8.3 W) and in men (mean difference: 6.6 W, p < 0.05, 95% CI 1.3–11.8 W), but not in women (mean difference: 0.8 W, n.s., 95% CI −3.7 to 5.3 W), which was within the typical error of the PMLSS estimations (∼3%). In 12 subjects (nine males, three females), the PMLSSINSCYD differed by 3.1–7.3% compared to the MLSS. The Pearson correlations between the measured PMLSS and the calculated PMLSS (PMLSSINSCYD) were very strong in men (r = 0.974, p < 0.001, 95% CI 0.933–0.99), women (r = 0.984, p < 0.001, 95% CI 0.931–0.996), and for the entire sample (r = 0.992, p < 0.001, 95% CI 0.982–0.996).
Discussion: In conclusion, the PMLSS can be accurately calculated using the INSCYD software, but it still requires advanced testing equipment to collect valid and VLamax data.
The aim of sports science research and practice is to investigate the relationship between an athlete’s physiological response to maximal and submaximal exercise and endurance performance (1). This information can also be used to determine threshold values to demarcate training intensity zones (2), monitor training effects (3), or predict performance (1). Incremental tests are often used to determine the maximal oxygen consumption () and the lactate threshold, which aim to approximate the maximal lactate steady state (MLSS) (4). The MLSS is defined as the highest workload that can be maintained without blood lactate accumulation over time (5, 6). The MLSS appears to be a valid marker for demarcating heavy from severe exercise domain (2) and predicting endurance performance in time trial cycling (7) or triathlon (8). The determination of the power output at the MLSS (PMLSS) requires two to five constant-load tests at a relatively high intensity within a 1- to 2-week period (5, 6). The PMLSS is defined as the highest workload corresponding to a maximal blood lactate accumulation of 0.02 mmol·L−1·min−1 in the final 10 min or 0.05 mmol·L−1·min−1 in the final 20 min of a 20–30 min constant-load effort (5). To avoid such an extensive procedure, which is also tricky to fit into an athlete's schedule, the so-called “anaerobic-threshold” methods based on blood lactate profiles have been developed to predict the PMLSS from a single exercise test. The validity of these threshold methods depends on the test protocol used. In the literature, the duration of the incremental workload steps varies between 3 and 8 min, while the magnitude of the workload steps varies between 10 and 50 W (9, 10). Thus, depending on the applied test protocol, a given threshold method may either be valid or invalid for predicting the PMLSS (4, 11). Furthermore, graded exercise testing that is needed to establish these blood lactate profiles compromises the accurate assessment of the maximal oxygen consumption (), for which a total test duration of a maximum of 8–12 min is advised (12). This means that graded exercise testing does not provide practitioners with a practical solution to accurately assess both the and the PMLSS in a single-test occasion.
In the 1980s, Mader developed a theoretical mathematical model that allowed the assessment of the PMLSS as the highest power at which the lactate formation rate and the lactate combustion rate reached an equilibrium (13). However, to perform the rather complex calculation of the PMLSS, various input data and variables need to be used, including the and the maximal lactate formation rate (VLamax) of an athlete. Measuring both variables can be completed during one ∼1 h laboratory visit. Nevertheless, calculating the PMLSS from these data requires complex mathematical equations and is, therefore, not practical for coaches (14).
The INSCYD physiological performance software was recently introduced to the market as a practical tool for physiological performance assessment. The software can calculate the lactate formation rate and the lactate combustion rate as a function of exercise intensity and subsequently derive the PMLSS from this analysis. This can be done with a combination of a few submaximal and maximal efforts with lactate monitoring or with direct measurements of the athlete's and VLamax values. The validity of this application when used with a combination of a few submaximal efforts and one maximal effort has been investigated in male cyclists. Consequently, high levels of agreement were found between the measured and calculated PMLSS and values (15). On average, the calculated and measured PMLSS values differed by only 2 W (95% CI: −6 to +9 W) with a typical error of 8 W, which is well within the expected day-to-day variability (∼3%) in the PMLSS (16). Since the publication of this study (15), the software has already received an update allowing more flexibility in testing protocols. The validity of the new algorithms in calculating the PMLSS has not yet been published in the scientific literature. The performance of the first software version cannot be generalized to the updated software version; hence, the validity of the new version has yet to be demonstrated. It also remains to be determined whether or not the software can precisely calculate the PMLSS in female subjects because only male subjects were tested in the study of Podlogar et al. (15).
The objective of the current study is to assess the validity of the INSCYD physiological performance software (version 2.0) for the PMLSS calculation based on the and VLamax derived from golden standard test procedures in male and female cyclists.
A dataset of 31 cyclists (recreational, n = 17; amateur, n = 10; professional, n = 4) was retrieved from two publications on cycling performance (17, 18) (Table 1). Two female subjects did not complete the test and the MLSS trials and were excluded from the data analysis. As such, all data analyses were performed on 29 individuals. No additional experiments were performed to increase the sample size because our laboratory was not equipped with the same testing instruments. Using different test equipment would have introduced new sources of error. The study was approved by the Ethics Committee Research UZ/KU Leuven (registration: S68352).
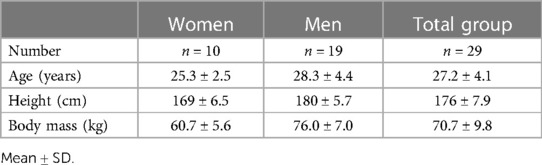
Table 1. Subjects’ characteristics.
The methodologies of the testing procedures in both datasets used here were very similar and summarized in the subsequent paragraphs.
In both studies, the subjects were instructed to refrain from strenuous physical activity 24 h before the exercise tests were performed and to adhere to a carbohydrate-rich diet. This procedure was set to prevent premature fatigue caused by glycogen depletion or hypoglycemia, which could affect the test results (19).
All subjects visited the laboratory three to four times to perform bicycle exercise tests. All exercise tests were interspersed with 24–48 h of rest or low-intensity training to allow complete recovery. The exercise tests were performed on a bicycle ergometer (four-strain gauge version, SRM, Jülich, Germany), which was calibrated according to the manufacturer's guidelines. The personal cycling position was set on the ergometer, and the subjects used their personal cycling shoe-pedal system. The seat height, seat length, and saddle slope were recorded and used for all the cycling tests. The cycling data were captured by the ergometer display (SRM PowerControl III) and stored at 0.1 s (sprint test) or 1 s (all other tests) intervals and transferred to a personal computer for further analysis.
The first visit involved the collection of anthropometric and personal information [i.e., age, height, and body mass (Seca, Hamburg, Germany] and body composition (Biamed, BiaMedizintechnik, Köln, Germany). No body composition data were available for the female subjects. The INSCYD's algorithms use body fat percentage to calculate the PMLSSINSCYD; thus, a fixed body fat percentage of 20% was used. This value was chosen based on the scientific data of female cyclists with similar body mass and size (20). The individual fat percentage may differ from the fixed value; therefore, we calculated this effect on the PMLSSINSCYD.
A 15 s sprint test was performed according to the literature to test the maximum lactate formation rate (17). The subjects performed a 12 min warm-up on the bicycle ergometer at 1.5 W·kg−1 [study of Kleinschmidt (18)] or 2 W·kg−1 [study of Weber (17)]. This workload corresponded to the easy/moderate intensity domain. The subjects were free to use their preferred cadence to minimize peripheral fatigue (21). After the warm-up, the subjects rested for 10 min by sitting on a chair. This procedure was implemented to minimize the impact of oxidative metabolism on the subsequent sprint. Meanwhile, three capillary blood lactate samples (20 µl) were taken from the earlobe to determine the resting blood lactate concentration (BLCpre) (EBIO Plus, Eppendorf, Hamburg, Germany). Thereafter, the subjects performed a 15 s all-out sprint on the bicycle ergometer (SRM, Germany). The kinetic energy of the ergometer's flywheel can be adjusted by changing the transmission ratio. The transmission ratio on the ergometer was chosen as a function of sex and individual body mass (Table 2). During the 15 s test, the subjects had to sprint from a seated position. The ergometer was set in isokinetic mode at a fixed cadence of 130 revolutions per minute. According to the scientific literature, the cadence associated with the highest power output is approximately 110–150 rev·min−1. Highly trained cyclists and elite track sprinters usually have higher optimal cadences (22–24). The subjects were verbally encouraged throughout the test. After the test, the subjects rested for 10 min by sitting still on a chair. The blood samples were collected immediately after the end of the sprint and at 1 min intervals during the next 10 min to determine the maximal lactate concentration (BLCmax) (EBIO Plus, Eppendorf, Hamburg, Germany).
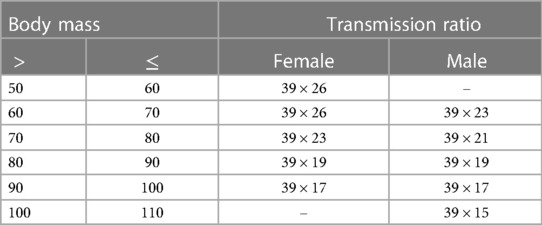
Table 2. Ergometer settings (transmission ratio) for the VLamax test as a function of sex and body mass.
The maximum lactate formation rate (VLamax) was calculated as the ratio of lactate accumulation over the time of lactate production according to the following Equation (1) (25, 26):
talac is defined as the period at the beginning of exercise for which (fictitiously) no lactate formation is assumed (26). In this work, talac is determined as the time from the beginning of the sprint (0 s) to when the maximum power decreased irreversibly by 3.5% (Figure 1). The assumption of an irreversible 3.5% power reduction seems favorable because the measurement tolerance of the used SRM system is ∼2.5%. Thus, a power reduction of 3.5% or more cannot be a measurement error of the SRM system but only a real power reduction (17). To make this methodology applicable to all subjects, the ergometer settings were adjusted to the body mass of the athlete separately for males and females to try to account for the different percentages of active muscle mass in both sexes.
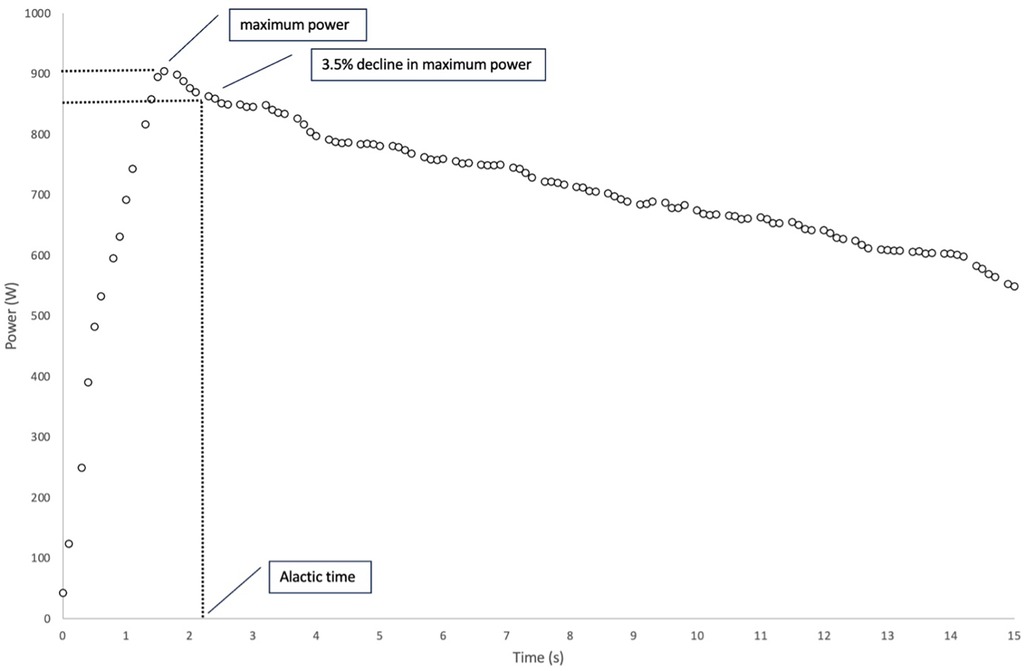
Figure 1. Example of the power output during a 15 s maximal isokinetic sprint. The alactic time (talac) is defined as the time when the power output irreversibly decreases by 3.5%.
A ramp test was performed to assess the maximal oxygen consumption rate (). The subjects cycled for 12 min at 1.5 W·kg−1 [study of Kleinschmidt (18)] or 2 W·kg−1 [study of Weber (17)] at a freely chosen cadence. After this warm-up, an initial load for the first 2 min was set according to Table 3 depending on the rider class and body mass. This was followed by the ramp test with a load increase of 25 W every 30 s and the ergometer in a speed-independent mode.
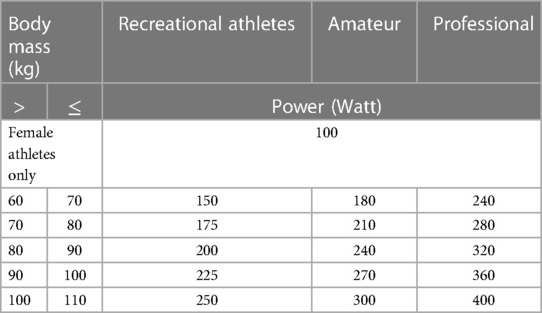
Table 3. Loads for the first 120 s in the VO2max test as a function of sex, rider class, and body mass.
Breathing gasses were collected breath-by-breath (Oxycon Alpha, Jaeger, Höchberg, Germany). The test was continued until the subjects, despite verbal encouragement, reached physical exhaustion. The test was considered successful if the following criteria were met: (1) a maximum RQ of 1.1 or higher and (2) a plateau in the (<150 ml·min−1) with a continuously increasing load (27). The was averaged from the highest 30 s values.
Based on the measured VLamax and and the subject's anthropometrics, the PMLSS was calculated using the INSCYD physiological performance software (version 2.0, INSCYD GmbH, Salenstein, Switzerland) (PMLSSINSCYD). Individual data used to run these calculations were sex, body mass, body fat %, , and VLamax. All other settings in the software, such as detailed body composition and gross efficiency, were kept at default values as a software preset. The software's algorithms normalized the VLamax to the body mass and body composition using a two-compartment model. It then calculated the energy contribution from aerobic and glycolytic energy sources under steady-state conditions. From this, a causational PMLSS is calculated as the highest power output at which the equilibrium of aerobic lactate combustion and glycolytic lactate production is achieved, hence resulting in zero net calculated lactate accumulation. To verify these calculations, we used the PMLSS as provided by Weber (17) and Kleinschmidt (18). In these two publications, the gold standard of the constant-load tests was used, that is, 20 min in Weber's work and 30 min in Kleinschmidt's work. If a steady-state BLC is found (<0.2 mmol·L−1 increase in the last 10 min of the test), the load is increased by 10 W at the next constant-load test. If the BLC increases to more than 0.2 mmol·L−1, the load is decreased by 10 W during the next constant-load test. The highest workload without a continuous increase (<0.2 mmol·L−1) in the BLC in the last 10 min of the constant-load test was considered to represent the PMLSS (5, 28). This criterium was within the accuracy of the lactate analyzer (29).
To assess the robustness of the INSCYD algorithms, we investigated the impact of the typical error and day-to-day variability of the (±3.3 ml·kg−1·min−1) and VLamax (±0.11 mmol·L−1·s−1) measurements on the PMLSS calculation (30). We had no individual data on the body composition of female subjects; hence, the effect of the body fat percentage (±6%) on the PMLSSINSCYD was evaluated.
A Shapiro–Wilk test was applied to verify the normal data distribution. All data are expressed as mean ± SD. The Pearson product correlations (r) and 95% CI were calculated to quantify the correlation between PMLSS vs. PMLSSINSCYD. The Pearson correlation coefficients were quantified as small (r < 0.4), moderate (0.40 < r < 0.59), and high (r > 0.6) (31).
A Bland–Altman plot analysis (expressed as the mean ± 1.96 SD) was used to quantify the bias and the range of agreement between the PMLSS and the PMLSSINSCYD with 95% limits of agreement. If the limits of agreement were less than 3% for the PMLSS, the PMLSSINSCYD was considered in agreement and was, therefore, interchangeable.
The difference between PMLSS vs. PMLSSINSCYD was tested using a Student’s paired t-test.
The significance level was set at p < 0.05. Statistical analyses were performed using JASP 0.16.04 (https://jasp-stats.org/, Amsterdam, Netherlands) and Microsoft Excel (Microsoft 365, Microsoft Corporation, Redmond, USA).
The physiological performance characteristics of the subjects are shown in Table 4.
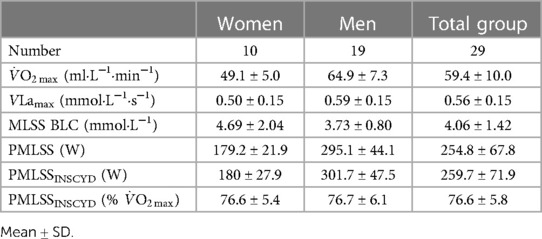
Table 4. Subjects’ physiological performance characteristics.
The PMLSSINSCYD was higher than the PMLSS in men (mean difference: 6.6 W, p < 0.05, 95% CI 1.3–11.8 W, with a range of −16 to 25 W), but not in women (mean difference: 0.8 W, n.s., 95% CI −3.7 to 5.3 W, with a range of −8 to 11 W). For the entire sample, the bias was 4.6 W (p < 0.05, 95% CI 0.8–8.3 W, with a range of −16 to 25 W). The Bland–Altman plot between the PMLSS and the PMLSSINSCYD is presented in Figure 2. The BLC at the MLSS averaged 4.06 ± 1.42 mmol·L−1 (range, 2.20–5.85 mmol·L−1).
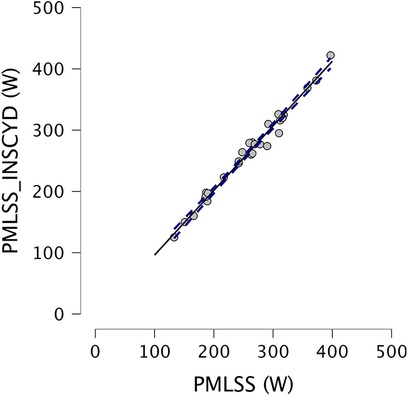
Figure 2. A Bland–Altman plot between the measured PMLSS and the calculated PMLSS (PMLSSINSCYD).
The Pearson correlations between the PMLSS and the PMLSSINSCYD were very strong in men (r = 0.974, p < 0.001, 95% CI 0.933–0.99), women (r = 0.984, p < 0.001, 95% CI 0.931–0.996), and for the entire sample (r = 0.992, p < 0,001, 95% CI 0.982–0.996) (Figure 3). The PMLSS can be calculated according to the following Equation (2):
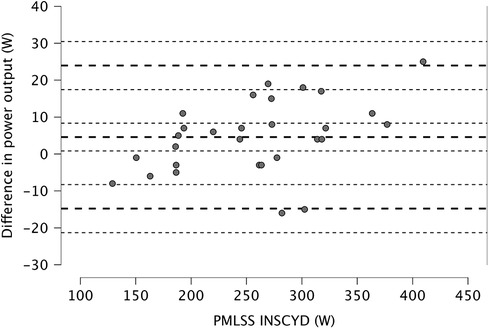
Figure 3. Correlation between the measured PMLSS and the calculated MLSS (PMLSSINSCYD). The solid line represents the regression line. The dashed lines represent 95% confidence limits.
We investigated the impact of the typical errors and the day-to-day variability of the (±3.3 ml·kg−1·min−1) and VLamax (±0.11 mmol·L−1·s−1) measurements on the PMLSSINSCYD (30). Increasing the measured with 3.3 ml·kg−1·min−1 increased the PMLSSINSCYD by 19 ± 2 W (6 ± 1% in the male subgroup, 10 ± 2% in the female subgroup). Decreasing the measured with 3.3 ml·kg−1·min−1 reduced the PMLSSINSCYD by 17 ± 4 W (7 ± 1% in both sexes). Increasing the VLamax with ±0.11 mmol·L−1·s−1 decreased the PMLSSINSCYD by 12 ± 4 W (5 ± 1% in the male subgroup, 4 ± 1% in the female subgroup). Decreasing the VLamax with ±0.11 mmol·L−1·s−1 increased the PMLSSINSCYD by 15 ± 3 W (5 ± 1% in the male subgroup, 8 ± 1% in the female subgroup). Increasing or decreasing the or VLamax increased the average bias with the measured PMLSS (±13 W) without affecting the correlation (r = 0.99, p < 0.001).
The effect of error in the body fat percentage on the calculation of the PMLSSINSCYD in the female subjects was also calculated. In the 20 ± 6% range, we found that for a Δ1% in the body fat percentage, the PMLSSINSCYD changes with ∼1 W without affecting the correlation (r = 0.98, p < 0.001).
The main objective of this study was to verify whether the INSCYD physiological performance software can precisely calculate the PMLSS in cycling exercise based on sex, anthropometric data, , and VLamax from a standardized ramp protocol and a 15 s maximal isokinetic sprint. These data can be captured in a ∼1 h single laboratory visit and could be a more practical solution for the PMLSS determination compared to golden standard procedures. In this study, we detected a good agreement between the PMLSSINSCYD and the PMLSS (Δ4.6 W). The PMLSSINSCYD was within the typical daily variation of the PMLSS when obtained from the gold standard test protocol and can thus be considered valid. Similar results were found by Podlogar et al. in 11 endurance-trained male cyclists ( 61.0 ± 7.9 ml·kg−1·min−1) (15). They observed a typical error for the PMLSSINSCYD of 8 W, which was smaller than the 3% typical day-to-day variability of PMLSS values (16). It should be noted that in the study of Podlogar et al., and VLamax were calculated from the lactate and power data of six intervals performed at various intensities and durations. Otherwise stated, they used the INSCYD physiological performance software differently with data sources that have different typical errors and different errors in the calculated PMLSS. Consequently, it is of utmost importance to use high-quality equipment and sampling techniques to minimize the error in the input data and improve the calculation accuracy. The Monte Carlo analysis can provide insight into the error of the calculated result based on the typical errors of the input data (32).
In our study, the PMLSS was assessed by applying 10 W increments in subsequent constant-load trials. Consequently, the measured PMLSS had an average accuracy level of ±5 W (33). Interestingly, the bias between the calculated and measured PMLSS (∼5 W) values corresponded well with the accuracy level of the applied PMLSS methodology. In the study of Podlogar et al., no significant bias was observed between the measured PMLSS and that derived from the INSCYD calculations (Δ2 W, n.s.) (15). They used 5 W increments for the PMLSS testing, thereby obtaining an average accuracy that was ±2.5 W (33). It can be speculated that with smaller workload increments in our PMLSS methodology, the bias with MLSSINSCYD would have been reduced. This needs to be verified in future research. Despite this methodological limitation, the bias observed in our study was still lower than the ∼3% typical day-to-day variation that can be expected from PMLSS values (16). It should be noted that in nine male subjects and three female subjects, the bias between PMLSS and PMLSSINSCYD exceeded 3% (range, 3.1–7.3%). These differences in the calculated PMLSS, when compared to the measured PMLSS, were within the range of the calculated bias caused by the day-to-day variability in the (±3.3 ml·kg−1·min−1) and VLamax (±0.11 mmol·L−1·s−1) measurements. These inaccuracies in the PMLSSINSCYD can be attributed to the inaccuracies of the input data and not necessarily to inaccurate algorithms.
Our study provides quantitative information to evaluate the accuracy of the INSCYD software in calculating the PMLSS. However, some limitations of this study should be acknowledged. To feed the algorithm of the software, measurements of age, body mass, body fat %, , and VLamax are required. In our study, and VLamax were measured using golden standard procedures with lab-accurate equipment ensuring optimal data quality. The ramp protocol was adjusted based on sex, body mass, and rider class. This procedure was implemented to ensure exhaustion times of 8–12 min, as generally recommended for testing (12). It should be noted that the availability of high-end testing equipment might be limited in practice; hence, the accuracy of PMLSSINSCYD can be affected by equipment of a lower-quality standard.
Unfortunately, the level of data quality obtained for and VLamax was not available for the body fat assessments. A bio-electrical impedance method was used for the male subjects. This technology is often used in a practical setting because of its low price and user-friendly operation. It uses the electrical properties of the body to estimate the total body water, from which the body fat mass is estimated (34). The potential error sources are variations in limb length, recent physical activity, nutrition and hydration status, tissue temperature, blood chemistry, ovulation, and electrode placement. According to the literature, bio-electric impedance methods underestimate the body fat composition in a normal-weight population in comparison with a reference method (35). Therefore, the body fat percentage derived from bio-electric impedance technologies should be interpreted with caution. No body fat measurements were available from the female subjects. Therefore, the body fat was estimated by a fixed reference value in female cyclists with similar body mass and size. Despite these methodological limitations in body fat assessment, the effect on PMLSSINSCYD is relatively small because a 1% difference in body fat results in ΔPMLSSINSCYD ∼1 W.
The current validation study was performed on 29 subjects. Although it is not uncommon in similar validation studies to use relatively small sample sizes, future research should preferably investigate larger sample sizes to increase the statistical power.
The PMLSS attracts the interest of exercise physiologists and practitioners in prescribing training zones for endurance exercises (2) and monitoring training effects (3) and as a performance prediction metric (7, 8). While golden standard MLSS protocols require typically two to five exercise tests, the data needed to feed the INSCYD algorithms can be captured in a single-test occasion of ∼1 h. Therefore, this is likely to be a more practical and time-efficient approach in an athlete population. Different from the lactate-threshold concepts, this novel calculation method is based on and VLamax. Hence, in contrast to conventional lactate profile testing using incremental loads, this approach does not only provide an accurate PMLSS but also a separate analysis of the maximum aerobic and anaerobic markers and a more complete picture of an athlete's physiology. This knowledge can aid coaches when prescribing more effective training recommendations.
To the best of our knowledge, the current study is the second study to test the validity of the INSCYD physiological performance software in calculating the PMLSS in cycling exercise and the first to include female subjects. The utility of the INSCYD software in non-athletic populations with typically lower cardiorespiratory fitness parameters (), such as in cardiac patients, must still be explored.
The data in this study demonstrate that the INSCYD physiological performance software can accurately calculate the PMLSS based on the data from a VO2max ramp protocol and a 15 s maximal isokinetic sprint in both male and female subjects. The INSCYD physiological performance software appears to be a valid and practical tool for assessing the PMLSS in a male and female endurance-trained population. However, to feed the software with valid and VLamax values, advanced testing equipment, such as a metabolic cart, a lactate analyzer, and an accurate ergometer, are still needed.
The original contributions presented in the study are included in the article/supplementary material, further inquiries can be directed to the corresponding author/s.
The studies involving humans were approved by the Ethics Committee Research UZ/KU Leuven (Registration S68352) and conducted in accordance with the local legislation and institutional requirements. The participants provided their written informed consent to participate in this study.
PC: Supervision, Writing – review & editing. VK: Data curation, Formal Analysis, Investigation, Writing – original draft. VR: Conceptualization, Project administration, Software, Writing – original draft, Writing – review & editing.
The authors declare that no financial support was received for the research, authorship, and/or publication of this article.
The data for this study were retrieved from two thesis studies (17, 18).
VR is a consultant for INSCYD GmbH.
The remaining authors declare that the research was conducted in the absence of any commercial or financial relationships that could be construed as a potential conflict of interest.
All claims expressed in this article are solely those of the authors and do not necessarily represent those of their affiliated organizations, or those of the publisher, the editors and the reviewers. Any product that may be evaluated in this article, or claim that may be made by its manufacturer, is not guaranteed or endorsed by the publisher.
The Supplementary Material for this article can be found online at: https://www.frontiersin.org/articles/10.3389/fspor.2024.1376876/full#supplementary-material
AbbreviationsBLC, blood lactate concentration; BLCmax, maximal blood lactate concentration; BLCpre, pretest blood lactate concentration; MLSS, maximal lactate steady state; PMLSS, power output at maximal lactate steady state; PMLSSINSCYD, calculated power at maximal lactate steady state with INSCYD software; talac, alactic time; VLamax, maximal lactate formation rate (mmol·L−1·s−1).
1. Billat VL, Sirvent P, Py G, Koralsztein J-P, Mercier J. The concept of maximal lactate steady state: a bridge between biochemistry, physiology and sport science. Sports Med. (2003) 33:407–26. doi: 10.2165/00007256-200333060-00003
2. Jamnick NA, Pettitt RW, Granata C, Pyne DB, Bishop DJ. An examination and critique of current methods to determine exercise intensity. Sports Med. (2020) 50:1729–56. doi: 10.1007/s40279-020-01322-8
3. Inglis EC, Iannetta D, Passfield L, Murias JM. Maximal lactate steady state versus the 20-minute functional threshold power test in well-trained individuals: “Watts” the big deal? Int J Sports Physiol Perform. (2020) 15:541–7. doi: 10.1123/ijspp.2019-0214
4. Faude O, Kindermann W, Meyer T. Lactate threshold concepts: how valid are they? Sports Med. (2009) 39:469–90. doi: 10.2165/00007256-200939060-00003
5. Beneke R. Methodological aspects of maximal lactate steady state—implications for performance testing. Eur J Appl Physiol. (2003) 89:95–9. doi: 10.1007/s00421-002-0783-1
6. Heck H, Wackerhage H. The origin of the maximal lactate steady state (MLSS). BMC Sports Sci Med Rehabil. (2024) 16:36. doi: 10.1186/s13102-024-00827-3
7. Harnish CR, Swensen TC, Pate RR. Methods for estimating the maximal lactate steady state in trained cyclists. Med Sci Sports Exerc. (2001) 33:1052–5. doi: 10.1097/00005768-200106000-00027
8. Van Schuylenbergh R, Eynde BV, Hespel P. Prediction of sprint triathlon performance from laboratory tests. Eur J Appl Physiol. (2004a) 91:94–9. doi: 10.1007/s00421-003-0911-6
9. Bentley DJ, Mcnaughton LR, Thompson D, Vleck VE, Batterham AM. Peak power output, the lactate threshold, and time trial performance in cyclists. Med Sci Sports Exerc. (2001) 33:2077–81. doi: 10.1097/00005768-200112000-00016
10. Płoszczyca K, Jazic D, Piotrowicz Z, Chalimoniuk M, Langfort J, Czuba M. Comparison of maximal lactate steady state with anaerobic threshold determined by various methods based on graded exercise test with 3-minute stages in elite cyclists. BMC Sports Sci Med Rehabil. (2020) 12:70. doi: 10.1186/s13102-020-00219-3
11. Van Schuylenbergh R, Vanden Eynde B, Hespel P. Correlations between lactate and ventilatory thresholds and the maximal lactate steady state in elite cyclists. Int J Sports Med. (2004b) 25:403–8. doi: 10.1055/s-2004-819942
12. Beltz NM, Gibson AL, Janot JM, Kravitz L, Mermier CM, Dalleck LC. Graded exercise testing protocols for the determination of VO2max: historical perspectives, progress, and future considerations. J Sports Med. (2016) 2016:1–12. doi: 10.1155/2016/3968393
13. Mader A. Eine Theorie zur Berechnung der Dynamik und des Steady State von Phosphorylierungszustand und Stoffwechselaktivitaet der Muskelzelle als Folge des Energiebedarfs. Köln: Deutsche Sporthochschule Köln (1984).
14. Mader A. Glycolysis and oxidative phosphorylation as a function of cytosolic phosphorylation state and power output of the muscle cell. Eur J Appl Physiol. (2003) 88:317–38. doi: 10.1007/s00421-002-0676-3
15. Podlogar T, Cirnski S, Bokal Š, Kogoj T. Utility of INSCYD athletic performance software to determine maximal lactate steady state and maximal oxygen uptake in cyclists. J Sci Cycling. (2022) 11:30–8. doi: 10.28985/1322.jsc.06
16. Hauser T, Bartsch D, Baumgärtel L, Schulz H. Reliability of maximal lactate-steady-state. Int J Sports Med. (2012) 34:196–9. doi: 10.1055/s-0032-1321719
17. Weber S. Calculation of Performance-determining Parameters of Metabolic Activity at the Cellular Level by Means of Cycle Ergometry [Berechnung Leistungsbestimmender Parameter der Metabolischen Aktivität auf Zellulärer Ebene Mittels Fahrradergometrischer Untersuchungen]. Köln: Dtsch. Sporthochsch (2003).
18. Kleinschmidt H. Simulative Berechnung der Dauerleistngsgrenze Anhand Fahrradergometrischer Untersuchungen bei Frauen. Köln: Dtsch. Sporthochsch (2004).
19. Ivy J, Costill D, Van Handel P, Essig D, Lower R. Alterations in the lactate threshold with changes in substrate availability. Int J Sports Med. (1981) 2(3):139–42. doi: 10.1055/s-2008-1034600
20. Lamberts RP. Predicting cycling performance in trained to elite male and female cyclists. Int J Sports Physiol Perform. (2014) 9:610–4. doi: 10.1123/ijspp.2013-0040a
21. Emanuele U, Horn T, Denoth J. The relationship between freely chosen cadence and optimal cadence in cycling. Int J Sports Physiol Perform. (2012) 7:375–81. doi: 10.1123/ijspp.7.4.375
22. Koninckx E, Van Leemputte M, Hespel P. Effect of a novel pedal design on maximal power output and mechanical efficiency in well-trained cyclists. J Sports Sci. (2008) 26:1015–23. doi: 10.1080/02640410801930184
23. Dunst A, Grüneberger R, Holmberg H-C. Modeling optimal cadence as a function of time during maximal sprint exercises can improve performance by elite track cyclists. Appl Sci. (2021) 11:12105. doi: 10.3390/app112412105
24. Nascimento EMF, Klitzke Borszcz F, Ventura TP, Caputo F, Guglielmo LGA, De Lucas RD. Reliability and validity of cycling sprint performance at isolinear mode without torque factor: a preliminary study in well-trained male cyclists. Res Q Exerc Sport. (2024):1–8. doi: 10.1080/02701367.2023.2298752
25. Mader A. Energiestoffwechselregulation, erweiterungen des theoretischen konzepts und seiner begründungen—nachweis der praktischen nützlichkeit der simulation des energiestoffwechsels. In: Mader A, Allmer H, editors. Computersimulation. Möglichkeiten zur Theoriebildung und Ergebnisinterpretation. Sankt Augustin: Brennpunkte der Sportwissenschaft (1994) 8. p. 124–62.
26. Heck H, Schulz H, Bartmus U. Diagnostics of anaerobic power and capacity. Eur J Sport Sci. (2003) 3:1–23. doi: 10.1080/17461390300073302
27. Balady GJ, Arena R, Sietsema K, Myers J, Coke L, Fletcher GF, et al. Clinician’s guide to cardiopulmonary exercise testing in adults: a scientific statement from the American Heart Association. Circulation. (2010) 122:191–225. doi: 10.1161/CIR.0b013e3181e52e69
28. Haverty M, Kenney WL, Hodgson JL. Lactate and gas exchange responses to incremental and steady state running. Br J Sports Med. (1988) 22:51–4. doi: 10.1136/bjsm.22.2.51
29. Baldari C, Bonavolontà V, Emerenziani GP, Gallotta MC, Silva AJ, Guidetti L. Accuracy, reliability, linearity of accutrend and lactate pro versus EBIO plus analyzer. Eur J Appl Physiol. (2009) 107:105–11. doi: 10.1007/s00421-009-1107-5
30. Adam J, Oehmichen M, Oehmichen E, Rother J, Müller U, Hauser T, et al. Reliability of the calculated maximal lactate steady state in amateur cyclists. Biol Sport. (2014) 32:97–102. doi: 10.5604/20831862.1134311
31. Sullivan GM, Feinn R. Using effect size—or why the P value is not enough. J Grad Med Educ. (2012) 4:279–82. doi: 10.4300/JGME-D-12-00156.1
32. Banack HR, Hayes-Larson E, Mayeda ER. Monte Carlo simulation approaches for quantitative bias analysis: a tutorial. Epidemiol Rev. (2021) 43:106–17. doi: 10.1093/epirev/mxab012
33. Jones AM, Burnley M, Black MI, Poole DC, Vanhatalo A. The maximal metabolic steady state: redefining the ‘gold standard.’. Physiol Rep. (2019) 7:e14098. doi: 10.14814/phy2.14098
34. Borga M, West J, Bell JD, Harvey NC, Romu T, Heymsfield SB, et al. Advanced body composition assessment: from body mass index to body composition profiling. J Investig Med. (2018) 66:1–9. doi: 10.1136/jim-2018-000722
Keywords: maximal lactate steady state, mathematical modeling, VLamax, bicycle exercise, INSCYD
Citation: Poffé C, Van Dael K and Van Schuylenbergh R (2024) INSCYD physiological performance software is valid to determine the maximal lactate steady state in male and female cyclists. Front. Sports Act. Living 6:1376876. doi: 10.3389/fspor.2024.1376876
Received: 26 January 2024; Accepted: 17 April 2024;
Published: 7 May 2024.
Edited by:
José Antonio de Paz, University of León, SpainReviewed by:
Hugo Cerda-Kohler, MEDS Clinic, Chile© 2024 Poffé, Van Dael and Van Schuylenbergh. This is an open-access article distributed under the terms of the Creative Commons Attribution License (CC BY). The use, distribution or reproduction in other forums is permitted, provided the original author(s) and the copyright owner(s) are credited and that the original publication in this journal is cited, in accordance with accepted academic practice. No use, distribution or reproduction is permitted which does not comply with these terms.
*Correspondence: Reinout Van Schuylenbergh cmVpbm91dC52YW5zY2h1eWxlbmJlcmdoQGt1bGV1dmVuLmJl
Disclaimer: All claims expressed in this article are solely those of the authors and do not necessarily represent those of their affiliated organizations, or those of the publisher, the editors and the reviewers. Any product that may be evaluated in this article or claim that may be made by its manufacturer is not guaranteed or endorsed by the publisher.
Research integrity at Frontiers
Learn more about the work of our research integrity team to safeguard the quality of each article we publish.