
95% of researchers rate our articles as excellent or good
Learn more about the work of our research integrity team to safeguard the quality of each article we publish.
Find out more
ORIGINAL RESEARCH article
Front. Sports Act. Living , 11 August 2023
Sec. Elite Sports and Performance Enhancement
Volume 5 - 2023 | https://doi.org/10.3389/fspor.2023.1240252
 Andrew R. Jagim1,2*
 Grant M. Tinsley3
 Brandon R. Merfeld2Abby Ambrosius2Chinguun Khurelbaatar2Christopher Dodge2Makenna Carpenter2Joel Luedke1Jacob L. Erickson1
 Jennifer B. Fields4,5
 Margaret T. Jones5,6
Intoduction: To cross-validate skinfold (SKF) equations, impedance devices, and air-displacement plethysmography (ADP) for the determination of fat-free mass (FFM).
Methods: Male and female youth athletes were evaluated (n = 91[mean ± SD] age: 18.19 ± 2.37 year; height: 172.1 ± 9.8 cm; body mass: 68.9 ± 14.5 kg; BMI: 23.15 ± 3.2 kg m−2; body fat: 19.59 ± 6.9%) using underwater weighing (UWW), ADP, and SKF assessments. A 3-compartment (3C) model (i.e., UWW and total body water) served as the criterion, and alternate body density (Db) estimates from ADP and multiple SKF equations were obtained. Validity metrics were examined to establish each method's performance. Bioelectrical impedance analysis (BIA), bioimpedance spectroscopy (BIS), and the SKF equations of Devrim-Lanpir, Durnin and Womersley, Jackson and Pollock (7-site), Katch, Loftin, Lohman, Slaughter, and Thorland differed from criterion.
Results: For females, Pearson's correlations between the 3C model and alternate methods ranged from 0.51 to 0.92, the Lin's concordance correlation coefficient (CCC) ranged from 0.41 to 0.89, with standard error of the estimate (SEE) ranges of 1.9–4.6 kg. For SKF, the Evans 7-site and J&P 3 Site equations performed best with CCC and SEE values of 0.82, 2.01 kg and 0.78, 2.21 kg, respectively. For males, Pearson's correlations between the 3C model and alternate methods ranged from 0.50 to 0.95, CCC ranges of 0.46–0.94, and SEE ranges of 3.3–7.6 kg. For SKF, the Evans 3-site equation performed best with a mean difference of 1.8 (3.56) kg and a CCC of 0.93.
Discussion: The Evans 7-site and 3-site SKF equations performed best for female and male athletes, respectively. The field 3C model can provide an alternative measure of FFM when necessary.
Body composition measurement is an important assessment technique in sports. Body composition parameters can provide valuable information regarding the amount and ratios of certain tissue components within the body, depending on the instrumentation used. In general, parameters such as body fat percentage, fat-free mass, and lean body mass are measured directly, or estimated based on prediction equations or indirect measurements. In athletic settings, laboratory-grade equipment is often not available or a feasible option due to cost, technician requirements, and time, particularly in high school or collegiate settings. Therefore, several field-based methodologies have been used to provide estimates of body composition parameters. Skinfold measurements and bioimpedance devices are examples of field-based assessment techniques that have been cross-validated against criterion measures in youth athletes and young adult populations with mixed findings (1–7). Skinfold measurement utilizes a caliper to obtain a measure of subcutaneous adiposity (i.e., skinfold thickness) at select sites throughout the body, using a double fold of gripped skin. These measures are then summed and used in prediction equations to estimate body density and subsequently fat mass (7). Bioimpedance methods can be classified as single (bioelectrical impedance analysis) vs. multi-frequency (bioimpedance spectroscopy) devices, and rely on the use of electrical current transmission through the body to calculate impedance and reactance of the current (6). BIA devices then utilize regression equations to estimate specific body composition compartments, whereas BIS devices use Cole modeling (8) and mixture theories (9) to estimate body water and other body compartments, of which the latter is often regarded as the more accurate of the two for evaluating body composition parameters (6).
Body weight and composition assessment can play a pivotal role in certain sports (e.g., weight-category sports and combat sports). For example, during the pre-season, wrestlers are required to complete a body composition assessment (most commonly via skinfold measures) to estimate body fat percentage, which is then used to calculate minimal wrestling weight (MWW) as part of a weight certification program. At the time of assessment, a wrestler's weight and body fat percentage are used to extrapolate what their weight would be (assuming no changes in fat-free mass), if they were to wrestle at a body fat percentage of 7% (5% at the collegiate level) and 12% for males and females, respectively, for determination of their MWW. Despite recommendations for safe and conservative weight loss strategies, research shows that wrestlers and weight-class athletes still rely on unhealthy practices including extended fasting periods, dehydration strategies, excessive exercise, and weight loss pills or laxatives (10–12), which can pose a significant risk to athlete health and well-being. Therefore, the establishment of accurate body composition assessment strategies to determine safe and appropriate weight class decisions for wrestlers is imperative.
The accuracy of skinfold prediction equations and other body composition methodologies for the measurement of body fat percentage has previously been evaluated (13–17); however, concerns have been raised in regard to the accuracy of this process (18), as there are potential sources for error. In wrestling, this could result in athletes being allowed to compete in too low of a weight class. Concerns include the accuracy of the prediction equations used to estimate body density, testing error, and the potential for variability when using skinfold measures for body fat percentage determination (19–21). For example, previous research in children reported significant sources of error and directional bias when utilizing skinfold thickness to estimate body fat percent (22). Similar conclusions have been reported in highly trained young adult populations, in that skinfold-derived measures of body fat percent do not yield accurate measures of fat mass and fat-free mass; particularly when used to track changes in body composition parameters (23). Furthermore, several of the skinfold equations may not be valid for young female athletes.
In an effort to improve the weight certification program, there have been investigations into the accuracy of skinfold prediction equations along with other minimally invasive and cost-efficient modes of body composition assessment (16, 24–26). At the collegiate level, the examination of various modes of body composition assessment for MWW determination have yielded differences in minimum weights up to 3.3 kg, which may result in inappropriately categorized wrestlers. Cutrufello et al. (25) recently found standard error of estimate values ranging from 2.4 to 3.2 kg when determining MWW, depending upon the technique used. Similar discrepancies have been reported when comparing body fat percent values derived from 12 different skinfold prediction equations among Olympic wrestlers (26), indicating the selection of body composition technique, or equations, might influence the resulting MWW values.
Advancements in body composition assessment techniques may improve the accuracy of field-based measures. By cross-validating prior methods using a 3-compartment model as a criterion measure, while also exploring novel techniques, improvements to the weight certification program may be possible. As a result, there may be opportunities to refine the current process for MWW determination within the sport of wrestling. Therefore, the purpose of the current study was threefold: (A) to determine the most accurate skinfold prediction equations for young male and female athletes, respectively, using a three-compartment model of body composition assessment; (B) to examine the utility of alternative modes of body composition assessment compared to criterion measures; and (C) to identify the number of athletes that may be mis-categorized to a certain weight-class when current methods are compared to criterion measures.
Subjects completed a battery of body composition assessments during a single morning of testing, including skinfold (SKF), underwater weighing (UWW), air displacement plethysmography (ADP), bioimpedance spectroscopy (BIS), multi-frequency BIA (MFBIA), and two single-frequency BIA (SFBIA) analyzers. Prior to testing, subjects were asked to refrain from intense activity (>24 h.) and food (>8 h.). Upon arrival, subjects provided a urine sample to determine adequate hydration status (USG < 1.02). Athletes with a urine specific gravity (USG) > 1.02 the morning of testing were re-scheduled. Three-component model estimates of %BF (%BF3C) included total body water from BIS measurement, and body density by UWW. Skinfold (SKF) measures at 8 sites were completed in triplicate. Fat-free mass (FFM) was assessed via each mode of body composition analysis and used to calculate minimum wrestling weight based on a 7.0% minimum body fat for males and 12.0% body fat for females. A body fat percentage value was also assessed using a field-based 3-compartment model of body composition, derived from the SKF and BIA results. Cross-validation occurred for all modes of body composition assessment, using the 3C measures of FFM and MWW as criterion measures. Target outcomes included FFM and MWW.
Ninety-one male and female youth athletes (age range: 14–24 years of age) were evaluated (female, n = 51; [mean ± SD] age: 18.19 ± 2.37 year; height: 172.1 ± 9.8 cm; body mass: 68.9 ± 14.5 kg; BMI: 23.15 ± 3.2 kg/m2; body fat: 19.59 ± 6.9%) participated. Because of the novelty of female wrestling and subsequent limited sample size available, athletes of all sport types were recruited from local high schools and Universities in the southwest region of Wisconsin, USA. All interested participants and their parents or guardians were invited to attend an informational meeting at which time, the details of the study, participant involvement, benefits, risks, and projected outcomes were discussed. Participants who were actively cleared to participate in a high school (n = 41) or collegiate (n = 50) sports were included in the study. Further inclusion criteria included being between the ages of 14–25 years of age. Exclusion criteria included pregnancy or breastfeeding, and currently being treated for or diagnosed with a cardiac, respiratory, circulatory, autoimmune, musculoskeletal, metabolic, hematological, neurological, or endocrine disorder or disease. Athletes from baseball (n = 7), wrestling (n = 9), football (n = 12), basketball (n = 4), soccer (n = 28), track/cross-country (n = 10), weight/power lifting (n = 4), volleyball (n = 5), gymnastics (n = 5), dance (n = 1), softball (n = 2), tennis (n = 1), CrossFit (n = 1), skiing (n = 1), and hockey (n = 1) were represented. 40 (43.9%) athletes participated in two sports, 19 (20.8%) in three sports, and 3 (3.3%) in four sports. The study was conducted according to the Declaration of Helsinki guidelines, and procedures were approved by the University's Institutional Review Board for use of human subjects in research. All participants signed an informed consent or assent (for those <18 years of age) document prior to participation. Parental/guardian consent was provided for participants <18 years of age.
Body mass and height were initially assessed using a self-calibrating physician's scale and stadiometer to the nearest 0.1 kg and 0.5 cm, respectively. Skinfold measures were conducted three times (to the nearest 0.1 mm) using a Harpenden Skinfold caliper across an 8-site model (subscapular, triceps, chest, midaxillary, suprailiac, abdominal, thigh and biceps). Skinfold technician test-retest reliability in the current study was ICC: 0.991 (95% CI: 0.987, 0.994).
Residual volume was determined in the UWW tank with subjects immersed at shoulder level using a closed-circuit oxygen dilution method (27). Prior to each test, the system was calibrated, and the rebreathing bag was flushed out with oxygen and emptied with a vacuum pump. An electronic nitrogen analyzer (Med Science 505 Nitralyzer, Needham Heights, MA) was used to measure gas exchange while the subject was inspiring and expiring through the bag for multiple cycles. Next, the subject was instructed to place a nose clip on and to seal their lips tightly around the mouthpiece and breathe normally. The subject was then instructed to forcefully expire as much air as possible. When the subject expired all their air, they signaled the technician, and then a valve was opened, which connected the subject to the rebreathing bag. Once connected, the subject was instructed to deeply breathe in, followed by deep, rapid breaths in and out until an equilibrium was displayed on the electronic dashboard. The residual volume was then calculated using the following equation from Wilmore 1969 (27):
VO2 = Initial volume of O2 in spirometer system including dead space between breathing valve and spirometerbell (.034 L); EN = Percent nitrogen at equilibrium; IN = Impurity of nitrogen; AN = Percent of alveolar nitrogen; FN = Percent of final nitrogen; RVDS = mouthpiece dead space (.070 L).
Electronic load cells suspended an underwater chair to assess the subject's weight underwater. An automated computer program converted the voltage measured at the load cell into weight in kilograms. The computer used an average of 100 readings per trial to determine a value that represented the subject's weight while submerged in the water. The UWW weighing chair was calibrated prior to each test. Following determination of residual volume, the subject stepped off the chair placed their back against the side of the tank with the water level at the neck. With the subject off the chair, and motionless, the computer zeroed the UWW chair. Next, two 2 kg weights were placed on each side of the chair while the system calibrated the load cells to 4 kg. After calibration, the weights were removed, and the subject assumed the position in the UWW chair. The subject was then instructed to exhale as much air as possible, while slowly submerging until their head was totally submerged (5–10 cm below water level). Once air bubbles stopped appearing, the computer recorded the weight and the technician tapped on the side of the tank, signaling to the subject to come up for air. This procedure was repeated 5–10 times in order for the subject to produce a consistent UWW with an average of 2–4 trials (within 0.5 kg) calculated for the final UWW.
Body composition variables (i.e., %BF, fat-free mass, fat mass and body density) were assessed using air displacement plethysmography (BOD POD model 2000A; BOD POD; Cosmed USA, Concord, CA) according to standard operating procedures. Athletes were instructed to wear spandex or form-fitting clothing and wore a lycra swim cap. All jewelry was removed prior to testing. Thoracic gas volume was predicted using manufacture settings. Previous test-to-test reliability results for the use of ADP assessment in athletes has yielded high reliability for BM (r = 0.999), body fat percent (r = 0.994), and FFM (r = 0.998) in our laboratory.
Whole body SFBIA measurements were assessed using a 50 kHz device (Quantum IV, RJL systems, Clinton MI) to determine resistance (R), which was used to estimate body composition through select validated equations as later described. Total body water (TBW), extracellular water (ECW) and intracellular water (ICW) were assessed using BIS (SFB7, ImpediMed, Carlsbad, CA) with 256 measurement frequencies to model the fluid content of the body by obtaining total body water estimates. BIS utilizes Cole modeling (8) and mixture theories (9) to predict body fluids rather than regression equations used by BIA techniques. Coefficients utilized for males (ρe = 273.9, ρi = 937.2) and females (ρe = 235.5, ρi = 894.2), as well as body density, body proportion and hydration values (1.05, 4.30 and 0.732, respectively) were the same as those utilized in previous investigations with the selected BIS analyzer (28, 29). These SFBIA and BIS measurements were taken with the participant in the supine position prior to assessment using manufacturer-recommended hand-to-foot electrode arrangement. Alcohol wipes were used prior to placement of the adhesive electrodes. Previous research has indicated that TBW measures derived from similar BIS units have yielded strong agreement (r = 0.90; SEE = 2.65l; TE = 2.6l) compared with deuterium dilution criterion measures (30), with test-to-retest reliability producing a SEM of 0.48 L and an ICC of 0.99 (31). Body composition was also assessed using a consumer-grade MFBIA device, the H20N scale (InBody Inc., Cerritos, CA) and a foot-to-foot SFBIA device [(F2FBIA) Tanita BF-679W, IL, USA]. Subjects completed two measurements on each device with an average of the two used for analysis.
Body density (Db) values expressed in kg/L were obtained from UWW, ADP, and multiple SKF equations (Table 1).
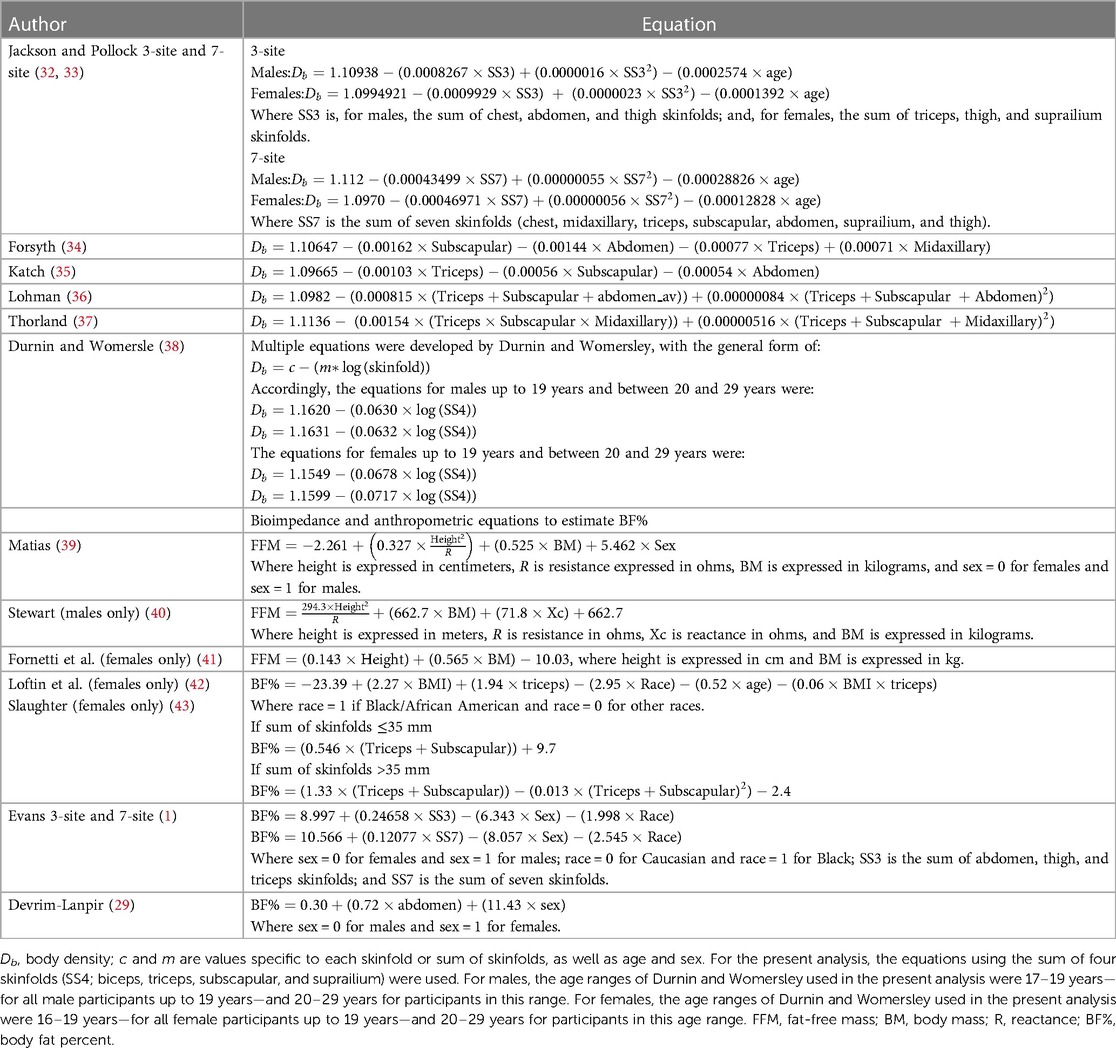
Table 1. Summary of equations to predict body density or body fat percent.
Data from UWW, ADP, and SKF were used in several body composition estimation equations. For all equations producing a BF% value, the corresponding FFM value was then calculated manually as follows:
For UWW and ADP, BF% values were produced using the Siri (44) and Brozek (45) equations, respectively:
For the remaining SKF Db equations, BF% and subsequent FFM estimates were obtained using the Siri 2C equation only.
Body composition estimates from F2FBIA (Tanita), MFBIA (InBody), and BIS (ImpediMed) were used, along with additional estimates obtained using SFBIA (RJL) raw bioimpedance in two FFM prediction equations (Table 1). Several equations predicting BF% utilizing anthropometric parameters were also employed (Table 1).
For the criterion 3C model, Db was taken from UWW, TBW was taken from BIS, and BM was taken from the calibrated scale. A field-based 3C model, Db was taken from SKF, TBW was estimated from bioelectrical resistance from SFBIA (RJL), and BM was taken from the calibrated scale. The TBW estimate from SFBIA (RJL) was obtained using the Matias et al. equation (46):
Where sex = 0 for females and sex = 1 for males.
Two estimates were produced using the Siri 3-compartment model equation (47):
This 3-compartment model has been previously used in college-aged men and women, with a total error of measurement value of 0.1152%fat and 0.1152%fat, respectively (48, 49).
For all methods, BF% estimates were used to calculate minimum wrestling weight (MWW) based on the minimum requirement of 7% body fat for males and 12% body fat for females. MWW was estimated as:
Separate analyses were performed for males and females. The same statistical analysis procedures were performed for fat-free mass and minimal wrestling weight estimates. To determine which methods differed from the criterion method (3C model with UWW Db and BIS TBW), a one-way analysis of variance (ANOVA) test with repeated measures was performed, with the body composition assessment method specified as a within-subjects factor. Significant effects were followed up with pairwise t-tests, with the criterion 3C model specified as the reference group and using the Holm adjustment for multiple comparisons. This analysis was performed using the rstatix package for R (v. 4.1.2) (50). Additionally, equivalence testing was performed to determine which methods were statistically equivalent to the criterion method. The TOSTER (51) R package was used for this analysis, and equivalence intervals were set at ±2 kg. The entire 90% two one-sided test (TOST) confidence interval was required to fall within the specified equivalence interval for equivalence to be demonstrated.
Bland–Altman analysis (52) with linear regression was performed to identify proportional bias, and the 95% limits of agreement were calculated to indicate individual-level error. The mean difference between the criterion and alternate methods was also calculated. Correlations between the criterion method and alternate methods were established using Pearson's r and Lin's concordance correlation coefficient (CCC) (53, 54). The standard error of the estimate (SEE) was estimated via regression procedures. An a priori power analysis determined that a sample size of 46 subjects per group (male and female) would be needed for a Type I error at α = 0.05 and a power of 80%, for an expected Pearson correlation coefficient of r = 0.60 based on previous studies evaluating the reliability of body composition assessment methods (25, 55). All analyses were performed in R (v. 4.1.2), and statistical significance was accepted at p < 0.05.
FFM estimates are displayed in Table 2.
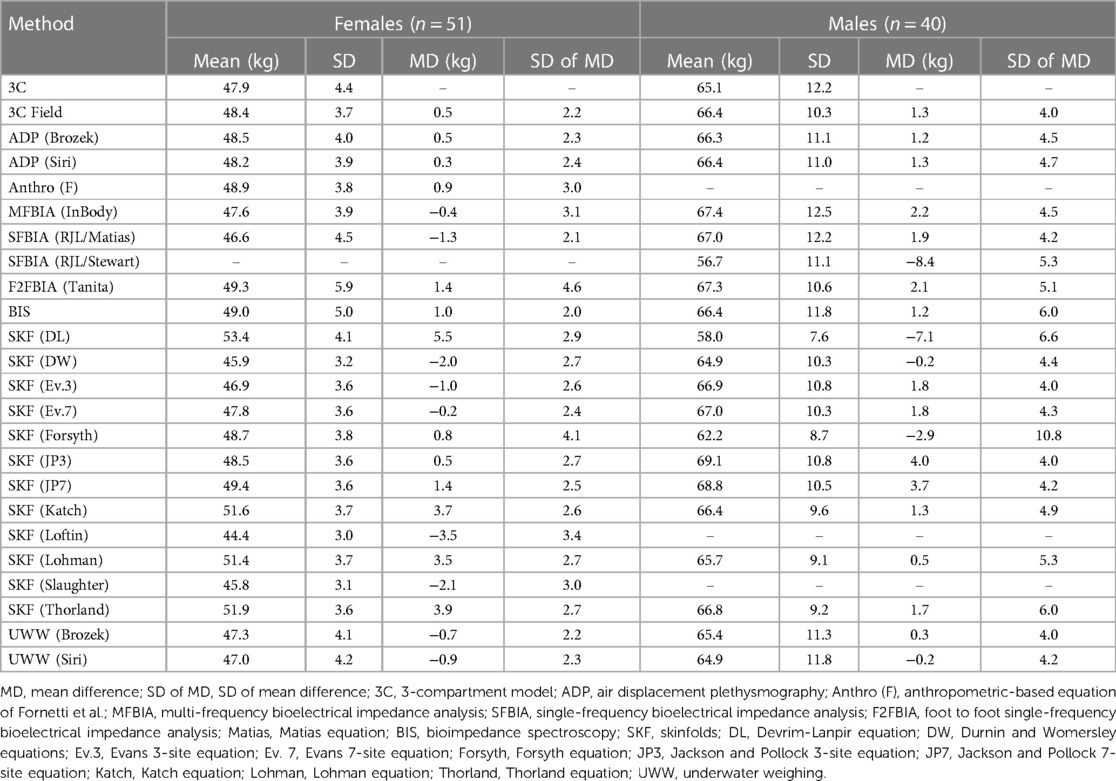
Table 2. Fat-free mass estimates for male and female athletes.
The ANOVA test indicated significant differences for FFM estimates in females, indicating the following methods differed from the 3C model: SFBIA [RJL/Matias et al. equation (56)], BIS, and the SKF equations of Devrim-Lanpir (26), Durnin and Womersley (38), Jackson and Pollock (7-site) (33), Katch (35), Loftin (42), Lohman (16, 36), Slaughter (43), and Thorland (16, 37) (Figure 1). Equivalence testing indicated that several methods demonstrated equivalence with the reference 3C model based on the ±2 kg equivalence interval. These included: 3C Field, UWW [both Siri (44) and Brozek (45) equations], ADP [both Siri (44) and Brozek (45) equations], BIS, MFBIA (InBody), SFBIA [RJL/Matias equation (56)], the skinfold equations of Forsyth (34), Jackson and Pollock (3-site) (32, 33), Evans (3-site; 7-site) (1), and the anthropometric equation of Fornetti (41).

Figure 1. Comparison of fat-free mass values in female athletes. Estimates were compared using one-way analysis of variance with repeated measures. The significant effect of method was followed up with pairwise t-tests, using the 3C model as the reference group. The Holm adjustment was performed to correct for multiple comparisons. **Indicates a p value between 0.01 and 0.001 and ****indicates a p value <0.0001. See footnote on Table 1 for abbreviations.
For female athletes, the Pearson's correlations between the reference 3C model and alternate methods ranged from 0.51 to 0.92, the CCC ranged from 0.41 to 0.89, and the SEE ranged from 1.9 to 4.6 kg (Figure 2).
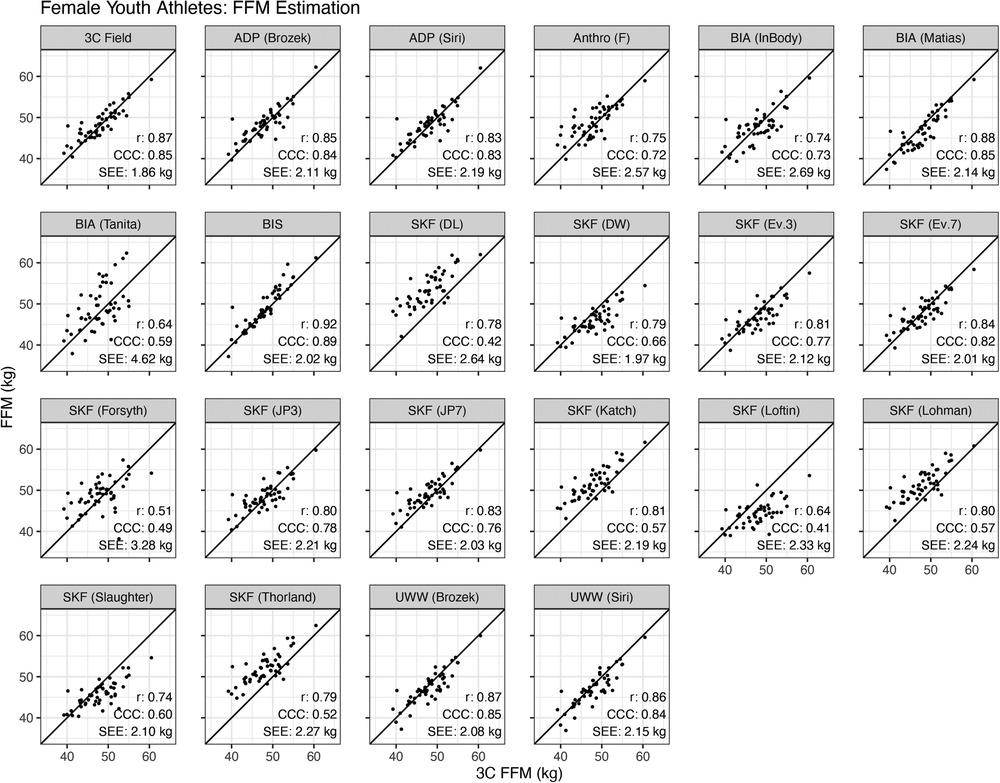
Figure 2. Validity of fat-free mass estimates in female athletes. Each specified method was compared to the reference 3-compartment (3C) model. The Pearson's correlation (r), Lin's concordance correlation coefficient (CCC), and standard error of the estimate (SEE) are displayed.
Bland–Altman analysis indicated that proportional bias was present (i.e., the slope of the linear regression line significantly differed from 0) for the following methods: 3C Field, F2FBIA (Tanita), BIS, and the skinfold equations of Durnin and Womersley (38), Evans 3-site and 7-site equations (1), Jackson and Pollock 3-site and 7-site equations (32, 33), Katch equation (35), Loftin equation (42), Lohman equation (16, 36), Slaughter equation (43), and Thorland equation (16, 37) (Figure 3).

Figure 3. Bland–Altman analysis of fat-free mass estimates in female athletes. Horizontal dashed lines indicate the 95% limits of agreement (i.e., 1.96 times the standard deviation of the difference between methods), and the solid horizontal line indicates the mean difference between methods. The diagonal line indicates the linear relationship between the difference between methods (y) and the average of the methods (x). A slope significantly different from zero indicates proportional bias. See text for more information.
Significant differences existed for FFM estimates in males (Table 2), indicating that the following methods differed from the 3C model: SFBIA (RJL/Stewart et al.) and the SKF equations of Devrim-Lanpir (26) and Jackson and Pollock (both 3-site and 7-site equations) (32) (Figure 4). Equivalence testing indicated that four methods—UWW [both Siri equation (44) and Brozek equation (45)] and the SKF equations of Lohman (36) and Durnin and Womersley (38)—demonstrated equivalence with the reference 3C model based on the ±2 kg equivalence interval.
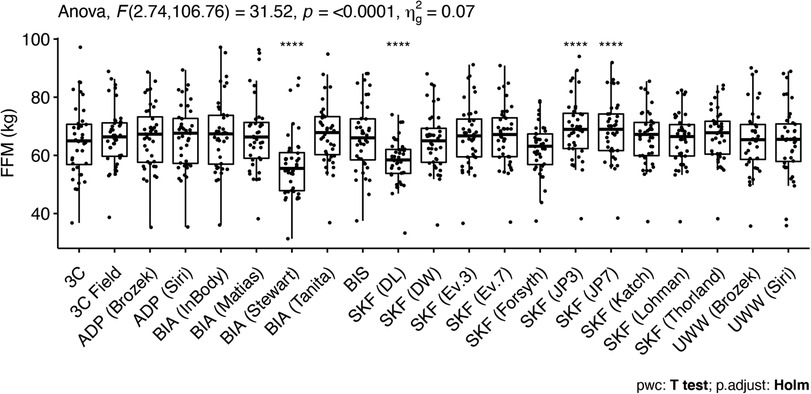
Figure 4. Comparison of fat-free mass values in male athletes. Estimates were compared using one-way analysis of variance with repeated measures. The significant effect of method was followed up with pairwise t-tests, using the 3C model as the reference group. The Holm adjustment was performed to correct for multiple comparisons. ****Indicates a p value <0.0001. See Figure 1 caption for abbreviations. Stewart, Stewart equation (40).
For male athletes, the Pearson's correlations between the reference 3C model and alternate methods ranged from 0.50 to 0.95, the CCC ranged from 0.46 to 0.94, and the SEE ranged from 3.3 to 7.6 kg (Figure 5).
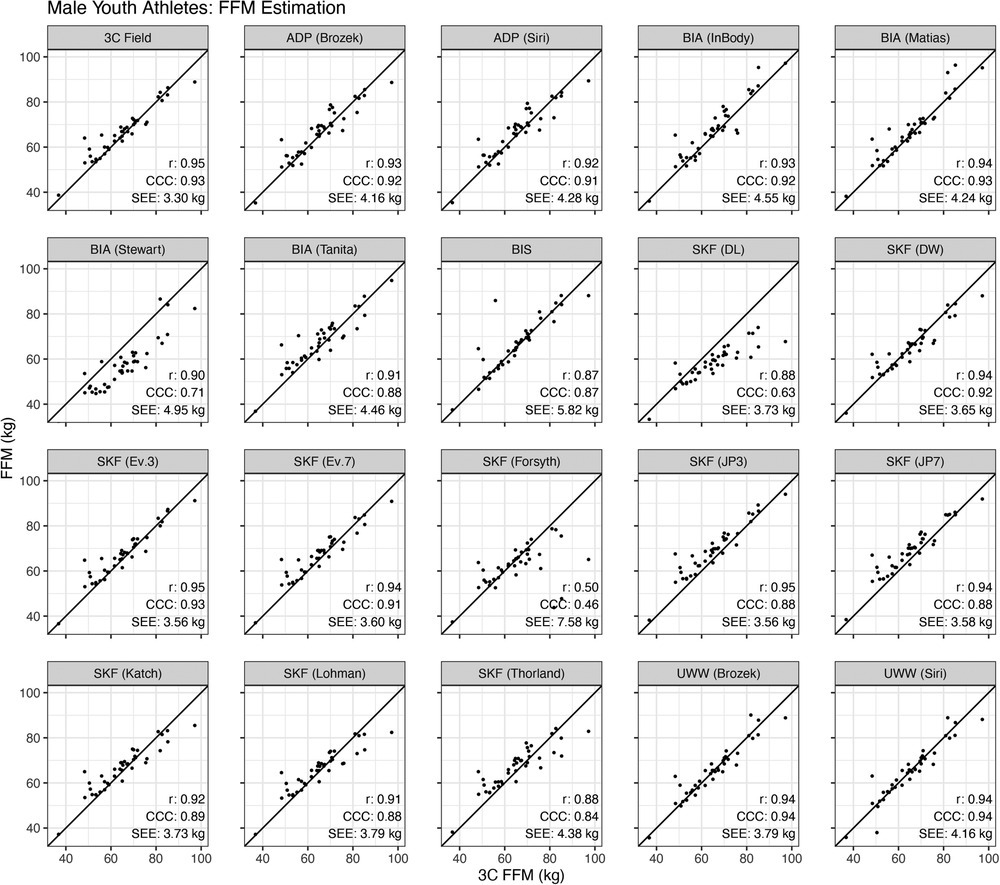
Figure 5. Validity of fat-free mass estimates in male athletes. Each specified method was compared to the reference 3-compartment (3C) model. The Pearson's correlation (r), Lin's concordance correlation coefficient (CCC), and standard error of the estimate (SEE) are displayed.
Bland–Altman analysis indicated that proportional bias was present for the following methods: 3C Field, SFBIA (Tanita), and the skinfold equations of Devrim-Lanpir (26), Durnin and Womersley (38), Evans 3-site and 7-site equations (1), Forsyth (34), Jackson and Pollock 3-site and 7-site equations (32, 33), Katch equation (35), Lohman equation (16, 36), and Thorland equation (16, 37) (Figure 6).
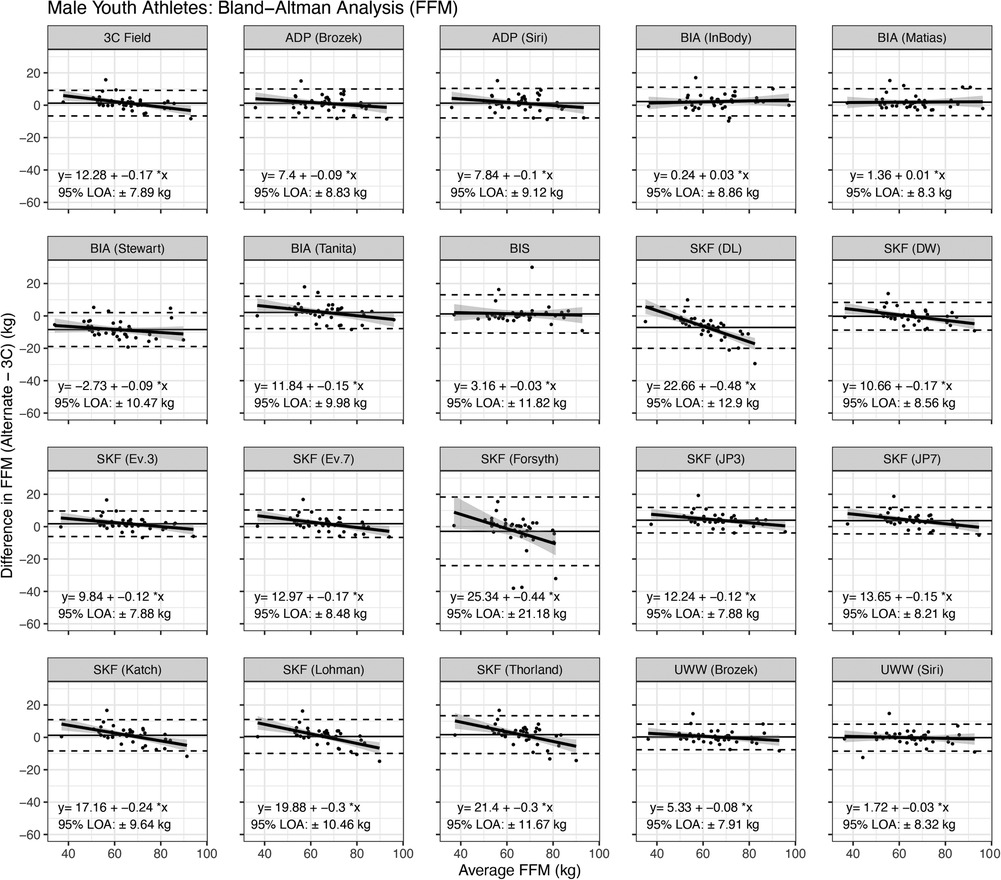
Figure 6. Bland–Altman analysis of fat-free mass estimates in male athletes. Horizontal dashed lines indicate the 95% limits of agreement (i.e., 1.96 times the standard deviation of the difference between methods), and the solid horizontal line indicates the mean difference between methods. The diagonal line indicates the linear relationship between the difference between methods (y) and the average of the methods (x). A slope significantly different from zero indicates proportional bias. See text for more information.
As minimal wrestling weight is calculated using measures derived from FFM estimates, the MWW results (see SDC1 for results regarding differences in MWW based upon skinfold prediction equation and impedance analysis device used) are presented in Supplementary Materials only (see SDC2 for Table S5: Minimum Wrestling Weight Estimates for Male and Female Athletes and SDC3 (Figure S7. Comparison of Minimum Wrestling Weight Values in Female Athletes); SDC4 (Figure S8. Validity of Minimum Wrestling Weight Estimates in Female Athletes); SDC5 (Figure S9. Bland–Altman Analysis of Minimum Wrestling Weight Estimates in Female Athletes.); SDC6 (Figure S10. Comparison of Minimum Wrestling Weight Values in Male Athletes.); SDC7 (Figure S11. Validity of Minimum Wrestling Weight Estimates in Male Athletes); and SDC8 (Figure S12. Bland–Altman Analysis of Minimum Wrestling Weight Estimates in Male Athletes.), in an effort to avoid redundancy.
The current study had two primary aims: (A) to determine the most accurate skinfold prediction equations for young male and female athletes using a three-compartment model of body composition assessment; and (B) to examine the utility of alternative modes of body composition assessment compared to criterion measures. This is the first study to examine the validity of skinfold prediction equations in young male and female athletes. The main findings indicate multiple discrepancies in FFM estimates for female and male athletes when compared to the 3C model. In females, The Evans 3 and 7-site, Forsyth, and Jackson and Pollock (3-site) SKF prediction equations performed best, while the Evans 3-site equation appeared to perform best when determining FFM in male athletes. Additionally, the field 3C model can provide a suitable alternative measure of FFM for both male and female athletes when laboratory-grade criterion measures are not available.
In females, the SKF prediction equations of Devrim-Lanpir (26), Durnin and Womersley (38), Jackson and Pollock (7-site) (33), Katch (35), Loftin (42), Lohman (16, 36), Slaughter (43), and Thorland (16, 37) differed from the 3C model (Figure 1). However, equivalence testing indicated that the equations of Forsyth (34), Jackson and Pollock (3-site) (32, 33), Evans (3-site and 7-site) (1), and the anthropometric equation of Fornetti (41) demonstrated equivalence with the reference 3C model based on the ±2 kg equivalence interval. In the context of wrestling and MWW determination, this suggests the estimates of FFM and subsequently MWW are likely to fall within the limits of each weight class division (often in 5.4 kg increments) utilizing these SKF equations. However, this could impact wrestlers who are on the threshold of a certain MWW and weight class. There was evidence of proportional bias for the skinfold equations of Durnin and Womersley (38), Evans 3-site and 7-site equations (1), Jackson and Pollock 3-site and 7-site (32, 33), Katch (35), Loftin (42), Lohman (16, 36), Slaughter (43), and Thorland (16, 37) (Figure 3). The Evans 3 and 7-site, Forsyth, and Jackson and Pollock (3-site) SKF prediction equations performed best with mean differences (SEE) values of −1.0 (2.12) kg, −0.2 (2.01) kg, 0.8 (3.28), and 0.5 (2.21), respectively. When taking concordance correlation coefficient (CCC) values into consideration, the Evans 7-site SKF equation performed best (CCC = 0.82). Collectively, these findings indicate the Evans 7-site equation appears to perform best among SKF prediction equations for female athletes when determining FFM. If a 3-site method is preferred for ease of use, the J&P and Evans 3-site equations produced the next highest CCC values of 0.78 and 0.77, respectively, and with mean differences (SEE) of 0.5 (2.21) kg and −1.0 (2.12) kg.
The current MWW certification process for girls' high school wrestling in Wisconsin requires the use of the Slaughter SKF equation (43), which resulted in a mean difference (SEE) of −2.1 kg (2.1) kg, a CCC value of 0.60 when compared to criterion measures in the current study. Additionally, there was a proportional bias towards a greater underestimation of FFM for athletes with higher FFM values, which could subsequently result in a higher estimate of BF% and lower MWW. This could potentially allow a female wrestler to compete in a lower weight class than what would be allowed if FFM was assessed more accurately. When evaluating the number of female athletes that would be mis-categorized when determining MWW, the current method would allow 31/51 (60.8%) of the current female athletes to compete in a weight class that would be different from the criterion-derived MWW and resultant weight class.
Among the remaining body composition assessment modalities, no differences were observed between 3C Field, ADP [both Siri (44) and Brozek (45) equations], nor the UWW (Brozek and Siri equations) compared to the criterion 3C model when determining FFM for females. The 3C Field resulted in a mean difference (SEE) of 0.5 (1.86) kg and the highest CCC (0.85) among all methods. However, there was proportional bias for the 3C Field, indicating that the model tended to overestimate FFM in those with low FFM levels but underestimate FFM in those with higher FFM. However, it should also be noted that the performance of the Field 3C model is dependent upon the field methods used to estimate Db and TBW, so alternate versions of this model may produce dissimilar results. The 3C Field, UWW [both Siri (44) and Brozek (45) equations], ADP [both Siri (44) and Brozek (45) equations] all demonstrated equivalence with the reference 3C model. For impedance analysis, the SFBIA [RJL/Matias et al. equation (56)], and BIS differed from the 3C model; however, equivalence testing indicated the BIS, MFBIA (InBody), and SFBIA [RJL/Matias equation (56)] all demonstrated equivalence with the reference 3C model using the 2.5 kg threshold when determining FFM for female athletes. However, there was also proportional bias for the F2FBIA (Tanita), and BIS, which again indicates a tendency to overestimate measures of FFM in those with higher FFM.
In male athletes, the FFM values derived from the SKF equations of Devrim-Lanpir (26) and Jackson and Pollock (both 3-site and 7-site equations) (32) differed from the 3C model (Figure 4) while proportional bias was present for the Devrim-Lanpir (26), Durnin and Womersley (38), Evans 3-site and 7-site (1), Forsyth (34), Jackson and Pollock 3-site and 7-site (32, 33), Katch (35), Lohman (16, 36), and Thorland equations (16, 37) (Figure 6). The equations of Lohman (36) and Durnin and Womersley (38) demonstrated equivalence with the reference 3C model based on the ±2 kg equivalence interval and the Evans 3-site equation appeared to perform best with a mean difference (SEE) of 1.8 (3.56) kg and a CCC of 0.93. The current MWW certification process for high school boys wrestling in Wisconsin utilizes the Lohman equation, which comparatively, resulted in a mean difference (SEE) of 0.5 (3.79) kg and a CCC of 0.88. Additionally, the Lohman equation tended to overestimate FFM, which would subsequently underestimate BF% and result in a higher MWW than would occur with a more accurate measure of FFM. When evaluating the number of male athletes that would be mis-categorized when determining MWW, the current method would allow 29/41 (72.5%) of the current male athletes to compete in a weight class that would be different from the criterion-derived MWW and resultant weight class.
When estimating FFM for the male athletes using the alternative methods, equivalence testing indicated that UWW [both Siri equation (44) and Brozek equation (45)] demonstrated equivalence with the reference 3C model based on the ±2 kg equivalence interval. The Field 3C model resulted in a mean difference (SEE) of 1.3 (3.30) kg and a CCC of 0.93, serving as a suitable alternative for a laboratory-grade 3C model. However, proportional bias was present for the 3C Field, with a tendency to overestimate FFM in those with lower FFM but underestimate FFM in those with higher FFM. For impedance analysis, only the SFBIA [RJL/Stewart et al. (40)] differed from the 3C model suggesting that the impedance devices used in the current study appear to be more accurate for the determination measures of FFM in male athletes compared to females, with correlation coefficients ranging from 0.87 to 0.94, CCC values of 0.88–0.93 and SEE ranging from 4.24 to 5.82 kg. Proportional bias was present for the F2FBIA (Tanita) indicating greater underestimation of FFM values in those with higher FFM. FFM was underestimated for most males by Tanita and became more pronounced as FFM increased as indicated by the negative slope of the Bland–Altman line (Figure 6).
Previous research in college-age men (25) reported discrepancies in MWW values with SEEs of 3.2, 3.4, and 2.4 kg for ADP, DXA, and ultrasound, respectively when compared with SKF. Further, compared to DXA and ultrasound measures, reliance on SKF-derived MWW would allow wrestlers to certify at a lower weight class 64% and 33% of the time, respectively, which is in opposition of what weight certification programs are designed to accomplish (57). When comparing the current NCAA approved methods (SKF and ADP) for MWW determination, approximately 50% of the male subjects would have certified at a different weight class depending on the method used (57). These findings, in addition to the ones from the current study indicate the potential variability in FFM, and subsequently MWW, through the use of different methods of BF% assessment.
When evaluating more practical methods of BF% assessment in high school athletes, no differences were reported in high school wrestlers between a similar MFBIA unit as the one used in the current study and the UWW criterion methods with a SEE for FFM of 2.73 kg and correlation coefficient of r = 0.96 (3). Clark et al. (58) reported similar mean values (72.2 ± 9.7 vs. 72.2 ± 10.3 kg), and a high correlation (r = 0.94) between BIA and a criterion 4C model. However, the authors (58) reported large individual differences and systematic bias across the range of MWW values. Additionally, the BIA was able to predict MWW within 3.5 kg 68% of the time and within 7.0 kg 95% of the time. Others reported no differences in MWW from UWW (70.5 ± 7.3 kg, P = 0.57), SKF (70.5 ± 7.2 kg, P = 0.29), BIA (70.6 ± 7.6 kg, P = 0.39), DXA (70.3 ± 7.5, P = 0.97), and the 4C criterion (70.3 ± 7.4 kg) in male collegiate wrestlers (59). The UWW and SKF exhibited the highest degree of precision (lowest SEE) with SEE values of 1.31 and 1.72 kg, respectively, compared to the 4C criterion. Therefore, it is possible that with more advanced models used for criterion measures, there is more agreement between alternative BF% assessment techniques thereby resulting in a more appropriate minimal wrestling weight. In most high school settings, SKF is likely the modality of choice because of its low cost and ease of use. When limiting the scope to SKF and Db prediction equations used to estimate BF%, previous research (26) in Olympic wrestlers (age: 12–20 years) found that the Stewart and Hannan equation (40) for male wrestlers and the Durnin and Womersley equation (38) for female wrestlers were the most accurate, least biased, and positively correlated with the criterion measure using ADP. Conversely, Clark et al. (14) found that Lohman1 (r = 0.961; TE = 2.2 kg), Lohman2 (r = 0.920; TE = 2.6 kg) and Katch (r = 0.969; TE = 1.7 kg) equations were the most accurate with smaller mean differences, smaller total error, and higher correlation compared to three other SKF prediction equations when estimating MWW in male high school wrestlers compared to UWW. A similar study in collegiate male wrestlers found the Lohman equation to be a valid measure of BF% (SEE = 2.32 kg; TE = 2.49 kg), which is the currently accepted method for NCAA collegiate wrestling. In high school wrestlers, the Lohman SKF equation was found to be a valid measure of FFM with a SEE of 2.66 kg and correlation coefficient of r = 0.97. It is possible the physiques and anthropometric characteristics of youth athletes may have changed over the past decades, thereby influencing the ability of certain SKF prediction equations or alternative modalities to accurately estimate BF%. Furthermore, impedance devices may have limitations with athletic populations, as previous research has indicated that generalized impedance-based equations underestimate body fluids in athletes, potentially influencing measures of FFM. Future investigations in a large, mixed-sex group could provide new equations (SKF and impedance) for estimating FFM in youth athletes.
Results from the current study indicate the Evans 7-site and 3-site SKF equations performed best for female and male athletes, respectively. The current MWW certification process for girls' high school wrestling in Wisconsin does not appear to utilize the best SKF prediction equation available for this population. Additionally, there was a proportional bias towards an underestimation of FFM, which could subsequently result in a higher estimate of BF% and lower MWW. This could permit a female wrestler to compete in a lower weight class than what would be allowed if FFM was assessed more accurately. For male wrestlers in Wisconsin, the Lohman equation is currently used, which provided an adequate estimate of FFM yet was not the best performing SKF prediction equation. Additionally, the Lohman equation tended to overestimate FFM, which would subsequently underestimate BF% and result in a higher MWW than would occur with a more accurate measure of FFM. The field 3C model can provide a suitable alternative measure of FFM for both male and female athletes when laboratory-grade criterion measures are not available. Athletic organizations, specifically wrestling programs, should explore the feasibility of implementing field-based 3C models of SKF in conjunction with BIA units to improve upon the current assessment of BF%.
The datasets associated with the current manuscript are not readily available as additional analysis is pending. Partial data may be available upon request.
The studies involving humans were approved by University of Wisconsin—La Crosse. The studies were conducted in accordance with the local legislation and institutional requirements. Written informed consent for participation in this study was provided by the participants' legal guardians/next of kin for those under the age of 18 years of age.
Conceptualization, AJ, GT, CD, JL, and JE; methodology, AJ, GT, CD, JL, and JE formal analysis, AJ, and GT; data collection: AJ, AA, CK, CD, MK writing—original draft preparation, AJ, GT, BM, AA, CK, CD, MC, JL, JE, JF, and MJ; writing—review and editing, AJ, GT, BM, AA, CK, CD, MC, JL, JE, JF, and MJ; project administration, AJ, CD, JL, and JE. The authors declare that the results of the study are presented clearly, honestly, and without fabrication, falsification, or inappropriate data manipulation. All authors contributed to the article and approved the submitted version.
This project was supported from an internal grant from Mayo Clinic Health System and the University of Wisconsin—La Crosse.
We would like to thank the young athletes for participating in this project.
GT has received support for his research laboratory, in the form of research grants or equipment loan or donation, from manufacturers of body composition assessment devices, including Size Stream LLC; Naked Labs Inc.; Prism Labs Inc.; RJL Systems; MuscleSound; and Biospace, Inc.
The remaining authors declare that the research was conducted in the absence of any commercial or financial relationships that could be construed as a potential conflict of interest.
All claims expressed in this article are solely those of the authors and do not necessarily represent those of their affiliated organizations, or those of the publisher, the editors and the reviewers. Any product that may be evaluated in this article, or claim that may be made by its manufacturer, is not guaranteed or endorsed by the publisher.
The Supplementary Material for this article can be found online at: https://www.frontiersin.org/articles/10.3389/fspor.2023.1240252/full#supplementary-material
1. Evans EM, Rowe DA, Misic MM, Prior BM, Arngrímsson SA. Skinfold prediction equation for athletes developed using a four-component model. Med Sci Sports Exerc. (2005) 37(11):2006–11. doi: 10.1249/01.mss.0000176682.54071.5c
2. Oliver JM, Lambert BS, Martin SE, Green JS, Crouse SF. Predicting football players’ dual-energy x-ray absorptiometry body composition using standard anthropometric measures. J Athl Train. (2012) 47(3):257–63. doi: 10.4085/1062-6050-47.3.12
3. Utter AC, Lambeth PG. Evaluation of multifrequency bioelectrical impedance analysis in assessing body composition of wrestlers. Med Sci Sports Exerc. (2010) 42(2):361–7. doi: 10.1249/MSS.0b013e3181b2e8b4
4. Esco MR, Nickerson BS, Fedewa MV, Moon JR, Snarr RL. A novel method of utilizing skinfolds and bioimpedance for determining body fat percentage via a field-based three-compartment model. Eur J Clin Nutr. (2018) 72(10):1431–8. doi: 10.1038/s41430-017-0060-3
5. Esco MR, Olson MS, Williford HN, Lizana SN, Russell AR. The accuracy of hand-to-hand bioelectrical impedance analysis in predicting body composition in college-age female athletes. J Strength Cond Res. (2011) 25(4):1040–5. doi: 10.1519/JSC.0b013e3181cc224a
6. Moon JR. Body composition in athletes and sports nutrition: an examination of the bioimpedance analysis technique. Eur J Clin Nutr. (2013) 67(Suppl 1):S54–9. doi: 10.1038/ejcn.2012.165
7. Kasper AM, Langan-Evans C, Hudson JF, Brownlee TE, Harper LD, Naughton RJ, Close GL. Come back skinfolds, all is forgiven: a narrative review of the efficacy of common body composition methods in applied sports practice. Nutrients. (2021) 13(4). doi: 10.3390/nu13041075
8. Cole KS. Permeability and impermeability of cell membranes for ions. Cold Spring Harb Symp Quant Biol. (1940) 8:110–22. doi: 10.1101/SQB.1940.008.01.013
9. Hanai T. Electrical properties of emulsions, emulsion science. London, New York: Academic Press (1968).
10. Lakicevic N, Reale R, D'Antona G, Kondo E, Sagayama H, Bianco A, Drid P. Disturbing weight cutting behaviors in young combat sports athletes: a cause for concern. Front Nutr. (2022) 9:67. doi: 10.3389/fnut.2022.842262
11. Reale R, Slater G, Burke LM. Acute-weight-loss strategies for combat sports and applications to olympic success. Int J Sports Physiol Perform. (2017) 12(2):142–51. doi: 10.1123/ijspp.2016-0211
12. Reale R, Slater G, Burke LM. Weight management practices of Australian olympic combat sport athletes. Int J Sports Physiol Perform. (2018) 13(4):459–66. doi: 10.1123/ijspp.2016-0553
13. Oppliger RA, Tipton CM. Iowa wrestling study: cross-validation of the tcheng-tipton minimal weight prediction formulas for high school wrestlers. Med Sci Sports Exerc. (1988) 20(3):310–6. doi: 10.1249/00005768-198806000-00016
14. Clark RRK JM, Oppliger RA. The Wisconsin wrestlin minimal weight project: cross-validation of prediction equations. Pediatr Exerc Sci. (1992) 4:117–27. doi: 10.1123/pes.4.2.117
15. Oppliger RA, Harms RD, Herrmann DE, Streich CM, Clark RR. The Wisconsin wrestling minimum weight project: a model for weight control among high school wrestlers. Med Sci Sports Exerc. (1995) 27(8):1220–4. doi: 10.1249/00005768-199508000-00017
16. Thorland WG, Tipton CM, Lohman TG, Bowers RW, Housh TJ, Johnson GO, Tcheng TK. Midwest wrestling study: prediction of minimal weight for high school wrestlers. Med Sci Sports Exerc. (1991) 23(9):1102–10. doi: 10.1249/00005768-199109000-00017
17. Hetzler RK, Kimura IF, Haines K, Labotz M, Smith JA. A comparison of bioelectrical impedance and skinfold measurements in determining minimum wrestling weights in high school wrestlers. J Athl Train. (2006) 41(1):46–51. PMID: 16619094.16619094
18. Loenneke JP, Wilson JM, Barnes JT, Pujol TJ. Validity of the current NCAA minimum weight protocol: a brief review. Ann Nutr Metab. (2011) 58(3):245–9. doi: 10.1159/000330574
19. Lohman T. Advances in body composition assessment: current issues in exercise science. Champaign, IL: Human Kinetics (1992).
20. Morrow JR, Fridye T, Monaghen SD. Generalizability of the AAHPERD health related skinfold test. Research Q Exerc Sport. (1986) 57:187–95. doi: 10.1080/02701367.1986.10605396
21. Oppliger RA, Clark RR, Kuta JM. Efficacy of skinfold training clinics: a comparison between clinic trained and experienced testers. Res Q Exerc Sport. (1992) 63(4):438–43. doi: 10.1080/02701367.1992.10608767
22. Reilly JJ, Wilson J, Durnin JV. Determination of body composition from skinfold thickness: a validation study. Arch Dis Child. (1995) 73(4):305–10. doi: 10.1136/adc.73.4.305
23. Silva AM, Fields DA, Quitério AL, Sardinha LB. Are skinfold-based models accurate and suitable for assessing changes in body composition in highly trained athletes? J Strength Cond Res. (2009) 23(6):1688–96. doi: 10.1519/JSC.0b013e3181b3f0e4
24. Clark RR, Oppliger RA, Sullivan JC. Cross-validation of the NCAA method to predict body fat for minimum weight in collegiate wrestlers. Clin J Sport Med. (2002) 12(5):285–90. doi: 10.1097/00042752-200209000-00005
25. Cutrufello PT, Landram MJ, Venezia AC, Dixon CB. A comparison of methods used to determine percent body fat, Minimum wrestling weight, and lowest allowable weight class. J Strength CondRes. (2021) 35(3):633–7. doi: 10.1519/JSC.0000000000003929
26. Devrim-Lanpir A, Badem EA, Işık H, Çakar AN, Kabak B, Akınoğlu B, Knechtle B. Which body density equations calculate body fat percentage better in olympic wrestlers? Comparison study with air displacement plethysmography. Life (Basel). (2021) 11(7):707. doi: 10.3390/life11070707
27. Wilmore JH. A simplified method for determination of residual lung volumes. J Appl Physiol. (1969) 27(1):96–100. doi: 10.1152/jappl.1969.27.1.96
28. Moon JR, Tobkin SE, Roberts MD, Dalbo VJ, Kerksick CM, Bemben MG, Stout JR. Total body water estimations in healthy men and women using bioimpedance spectroscopy: a deuterium oxide comparison. Nutr Metab (Lond). (2008) 5:1–6. doi: 10.1186/1743-7075-5-7
29. Tinsley GM. Five-component model validation of reference, laboratory and field methods of body composition assessment. Br J Nutr. (2021) 125(11):1246–59. doi: 10.1017/S0007114520003578
30. Kerr A, Slater G, Byrne N, Chaseling J. Validation of bioelectrical impedance spectroscopy to measure total body water in resistance-trained males. Int J Sport Nutr Exerc Metab. (2015) 25(5):494–503. doi: 10.1123/ijsnem.2014-0188
31. Moon JR, Eckerson JM, Tobkin SE, Smith AE, Lockwood CM, Walter AA, Stout JR. Estimating body fat in NCAA division I female athletes: a five-compartment model validation of laboratory methods. Eur J Appl Physiol. (2009) 105(1):119–30. doi: 10.1007/s00421-008-0881-9
32. Jackson AS, Pollock ML. Generalized equations for predicting body density of men. Br J Nutr. (1978) 40(3):497–504. doi: 10.1079/BJN19780152
33. Jackson AS, Pollock ML, Ward A. Generalized equations for predicting body density of women. Med Sci Sports Exerc. (1980) 12(3):175–81. doi: 10.1249/00005768-198023000-00009
34. Forsyth HL, Sinning WE. The anthropometric estimation of body density and lean body weight of male athletes. Med Sci Sports. (1973) 5(3):174–80.4747639
35. Katch FI, McArdle WD. Prediction of body density from simple anthropometric measurements in college-age men and women. Hum Biol. (1973) 45(3):445–55.4750412
36. Lohman TG. Skinfolds and body density and their relation to body fatness: a review. Hum Biol. (1981) 53(2):181–225.7239496
37. Thorland WG, Johnson GO, Tharp GD, Housh TJ, Cisar CJ. Estimation of body density in adolescent athletes. Hum Biol. (1984) 56(3):439–48.6489989
38. Durnin JV, Womersley J. Body fat assessed from total body density and its estimation from skinfold thickness: measurements on 481 men and women aged from 16 to 72 years. Br J Nutr. (1974) 32(1):77–97. doi: 10.1079/BJN19740060
39. Matias CN, Campa F, Santos DA, Lukaski H, Sardinha LB, Silva AM. Fat-free mass bioelectrical impedance analysis predictive equation for athletes using a 4-compartment model. Int J Sports Med. (2021) 42(1):27–32. doi: 10.1055/a-1179-6236
40. Stewart AD, Hannan WJ. Prediction of fat and fat-free mass in male athletes using dual x-ray absorptiometry as the reference method. J Sports Sci. (2000) 18(4):263–74. doi: 10.1080/026404100365009
41. Fornetti WC, Pivarnik JM, Foley JM, Fiechtner JJ. Reliability and validity of body composition measures in female athletes. J Appl Physiol. (1999) 87(3):1114–22. doi: 10.1152/jappl.1999.87.3.1114
42. Loftin M, Nichols J, Going S, Sothern M, Schmitz KH, Ring K, Stevens J. Comparison of the validity of anthropometric and bioelectric impedance equations to assess body composition in adolescent girls. Int J Body Compos Res. (2007) 5(1):1–8. PMID: 18163160.18163160
43. Slaughter MH, Lohman TG, Boileau R, Horswill CA, Stillman RJ, Van Loan MD, Bemben DA. Skinfold equations for estimation of body fatness in children and youth. Hum Biol. (1988) 60(5):709–23.3224965
44. Siri WE. The gross composition of the body. Adv Biol Med Phys. (1956) 4:239–80. doi: 10.1016/B978-1-4832-3110-5.50011-X
45. Brožek J, Grande F, Anderson JT, Keys A. Densitometric analysis of body composition: revision of some quantitative assumptions. Ann N Y Acad Sci. (1963) 110:113–40. doi: 10.1111/j.1749-6632.1963.tb17079.x
46. Matias CN, Santos DA, Júdice PB, Magalhães JP, Minderico CS, Fields DA, Silva AM. Estimation of total body water and extracellular water with bioimpedance in athletes: a need for athlete-specific prediction models. Clin Nutr. (2016) 35(2):468–74. doi: 10.1016/j.clnu.2015.03.013
47. Siri WE. Body composition from fluid spaces and density: analysis of methods. In: Brožek JHA, editors. Techniques for measuring body composition. Washington DC: Natl Acad Sciences/Natl Res Council (1961). p. 223–44.
48. Moon JR, Tobkin SE, Smith AE, Roberts MD, Ryan ED, Dalbo VJ, Stout JR. Percent body fat estimations in college men using field and laboratory methods: a three-compartment model approach. Dyn Med. (2008) 7(1):1–9. doi: 10.1186/1476-5918-7-7
49. Moon JR, Hull HR, Tobkin SE, Teramoto M, Karabulut M, Roberts MD, Stout JR. Percent body fat estimations in college women using field and laboratory methods: a three-compartment model approach. J Int Soc Sports Nutr. (2007) 4(1):1–9. doi: 10.1186/1550-2783-4-16
50. Core Team R. R: A language and environment for statistical computing. Vienna, Austria: R Foundation for Statistical Computing (2019).
51. Lakens D. Equivalence tests: a practical primer for t-tests, correlations, and meta-analyses. Soc Psychol Personal Sci. (2017) 1:1–8. doi: 10.1177/1948550617697177
52. Bland JM, Altman DG. Statistical methods for assessing agreement between two methods of clinical measurement. Lancet. (1986) 1(8476):307–10. doi: 10.1016/S0140-6736(86)90837-8
53. Lin LIK. A concordance correlation coefficient to evaluate reproducibility. Biometrics. (1989) 45(1):255–68. doi: 10.2307/2532051
55. Velázquez-Alva MC, Irigoyen-Camacho ME, Zepeda-Zepeda MA, Rangel-Castillo I, Arrieta-Cruz I, Mendoza-Garcés L, Gutiérrez-Juárez R. Comparison of body fat percentage assessments by bioelectrical impedance analysis, anthropometrical prediction equations, and dual-energy x-ray absorptiometry in older women. Front Nutr. (2022) 9:978971. doi: 10.3389/fnut.2022.978971
56. Matias CN, Campa F, Santos DA, Lukaski H, Sardinha LB, Silva AM. Fat-free mass bioelectrical impedance analysis predictive equation for athletes using a 4-compartment Model. Int J Sports Med. (2020) 42(01):27–32. doi: 10.1055/a-1179-6236
57. NCAA. Wrestling Rules of the Game 2022 (2022). Available from: https://www.ncaa.org/sports/2013/12/5/wrestling-rules-of-the-game.aspx (Cited September 14, 2022).
58. Clark RR, Bartok CYNTHIA, Sullivan JC, Schoeller DA. Is leg-to-leg BIA valid for predicting minimum weight in wrestlers? Med Sci Sports Exercise. (2005) 37(6):1061–8. PMID: 15947734.
Keywords: body composition, skinfold, fat-free mass, youth athlete, minimum wrestling weight
Citation: Jagim AR, Tinsley GM, Merfeld BR, Ambrosius A, Khurelbaatar C, Dodge C, Carpenter M, Luedke J, Erickson JL, Fields JB and Jones MT (2023) Validation of skinfold equations and alternative methods for the determination of fat-free mass in young athletes. Front. Sports Act. Living 5:1240252. doi: 10.3389/fspor.2023.1240252
Received: 15 June 2023; Accepted: 26 July 2023;
Published: 11 August 2023.
Edited by:
Brad Schoenfeld, Lehman College, United StatesReviewed by:
Clayton L. Camic, Northern Illinois University, United States© 2023 Jagim, Tinsley, Merfeld, Ambrosius, Khurelbaatar, Dodge, Carpenter, Luedke, Erickson, Fields and Jones. This is an open-access article distributed under the terms of the Creative Commons Attribution License (CC BY). The use, distribution or reproduction in other forums is permitted, provided the original author(s) and the copyright owner(s) are credited and that the original publication in this journal is cited, in accordance with accepted academic practice. No use, distribution or reproduction is permitted which does not comply with these terms.
*Correspondence: Andrew R. Jagim amFnaW0uYW5kcmV3QG1heW8uZWR1
Disclaimer: All claims expressed in this article are solely those of the authors and do not necessarily represent those of their affiliated organizations, or those of the publisher, the editors and the reviewers. Any product that may be evaluated in this article or claim that may be made by its manufacturer is not guaranteed or endorsed by the publisher.
Research integrity at Frontiers
Learn more about the work of our research integrity team to safeguard the quality of each article we publish.