 Jason D. Vescovi
 Elton Fernandes
 Alexander Klas1,2
- 1Faculty of Kinesiology and Physical Education, University of Toronto, Toronto, ON, Canada
- 2Graduate School of Exercise Science, University of Toronto, Toronto, ON, Canada
Female soccer players are exposed to specific physical demands during matches, which vary according to the standard of play. Existing studies have largely focused on quantifying the distances covered for professional and international level players. This approach is limited in scope regarding the broader aspects around physical demands and is detached from development pathway models. An understanding of the demands across all standards will provide valuable insights about appropriate player development and help ensure physical readiness for the demands of the sport. The aim of this perspective paper is to describe the physical demands experienced during women's soccer matches across the developmental spectrum. A combination of evidence from the literature and data from the author's research (JDV) is presented. Specifically highlighted are the trends for locomotor distances, acceleration and deceleration frequency, and metabolic power metrics for youth (≤U17), college (NCAA/U20), professional (domestic) and international standards of women's soccer. In addition, the changes in match demands between levels of play are used to help illustrate gaps that must be overcome in order to successfully achieve physical readiness to compete at higher levels. The evidence demonstrates the importance of training appropriate attributes to prepare female soccer players who are striving to play at progressively higher standards.
Introduction
Female soccer players are exposed to specific physical demands during matches, which vary according to the level/standard of play. To date, researchers and sport scientists have generally focused on the highest-level teams (i.e., elite) in order to develop strategies aimed at optimizing the physical readiness of these players and ultimately winning League titles, World Championships, or Olympic medals. Solely focusing match analysis at this level certainly has benefits for broadening our knowledge of the demands experienced by the best players (and teams), but is simultaneously disconnected from player development models, where gaps in technical, tactical, and fitness capabilities are routinely evaluated. Therefore, a comprehensive understanding of the physical demands of women's soccer matches across a wider range of standards is an essential element for enhancing player development pathways. There has been increased attention at some lower levels (i.e., U21, college), but there is still a paucity of research available describing the physical demands of youth matches.
Despite the recent interest and popularity in describing the physical demands of women's soccer matches, there are two substantial challenges to overcome for organizations, coaches, and sport science practitioners when examining published studies. First, outcomes between (i.e., video, GPS) and within (e.g., GPS 1, 5, and 10 Hz) systems are not interchangeable (Buchheit and Simpson, 2017), so some latitude is warranted when attempting to compare studies. Second, there is currently no consensus regarding the thresholds used for establishing discrete bands for key performance indicators (e.g., locomotor distances) (Bradley and Vescovi, 2015; Park et al., 2019). As a result, it is difficult to make direct comparisons within the published literature and subsequently create a cohesive view across the entire developmental spectrum for match demands. Recognizing these limitations, the aim of the current perspective paper is to describe match demands of women's soccer across the developmental spectrum in two ways. First, by presenting and comparing (when possible) published studies and second, by including data from the author (JDV) that uniquely spans youth, college, professional, and international women's soccer matches. The benefit of including these data is that they were collected using identical technology (5 Hz GPS) and applied the same thresholds for all reported variables–thus, direct comparisons can be made across all standards of play within this dataset.
Methods
A literature search of Pubmed and Google Scholar was conducted using a combination of the following terms: women's soccer, match demands, running distance, metabolic power, acceleration, deceleration, youth soccer, college soccer, professional soccer, elite soccer, and international soccer. Additionally, the references of identified studies were searched for other citations not found in the electronic search. Both studies and reports were included that described the locomotor distances, acceleration and deceleration profiles, and/or metabolic power metrics for women's soccer matches at any standard of play. Despite the limitations of comparing various data collection technologies, papers were selected regardless of the methodology used to quantify match demands (i.e., video, GPS, etc.). To simplify and help facilitate comparisons of locomotor metrics between published studies, we focused on total distance, movement rate (distance per minute), and high-intensity distances (inclusive of sprinting) since the latter has been identified as a key indicator that differentiates between levels of play in women's soccer (Mohr et al., 2008; Andersson et al., 2010). We recognize that positional differences in physical demands exist; however, an examination of this component was beyond the scope of the current perspective.
Data from the author's (JDV) previous research is included, which contains locomotor distance, acceleration and deceleration frequencies, and metabolic power metrics. These particular data are presented for descriptive purposes only and do not represent an experimental study; therefore, statistical analyses were not applied. Players competed across four standards: youth (U15 to U17), college, professional (PRO), and elite international (INT). All matches were played on regulation sized soccer fields with referees. Youth players (U15 = 21, player-matches = 21; U16 = 69, player-matches = 85; U17 = 32, player-matches = 32) were involved in a high-level tournaments or talent identification camps with varying match durations (35–45 min halves) depending on the specific age-group. Matches at the other three standards had 45 min halves. College players (n = 51, player-matches = 71) competed in regular season NCAA Division I matches. Professional players (n = 83, player-matches = 205) competed in regular season (domestic) matches for a professional league. In addition to domestic players, each team included several international players from their respective national teams. Elite international players (n = 12, player-matches = 39) were from a top ranked FIFA women's national team and competed in “friendly” matches against other ranked FIFA women's national teams.
Players wore a GPS unit (SPI Pro 5-Hz, GPSports, Canberra, Australia) that is valid and reliable for measuring sprint distance and speed (Petersen et al., 2009; Waldron et al., 2011). Between 8 and 12 satellites were available for signal transmission (Jennings et al., 2010). Horizontal-dilution-of-precision values > 4 were automatically removed by the Team AMS software, which is below the maximum value (50) reported to result in inaccurate outcomes (Witte and Wilson, 2004). A digital watch that received satellite time identified the start and end of each half, as signaled by the referee's whistle. Data were extracted using the manufacturer software (GPSports, Team AMS R1 2015.10J) for analysis. The outcomes are presented in the current paper using the following thresholds for locomotor distance (Bradley and Vescovi, 2015), metabolic power (Osgnach et al., 2010), and acceleration/deceleration (manufacturer default setting):
- Locomotor distance: ≤ 6.0 kph (Zone 1), 6.1–8.0 kph (Zone 2), 8.1–12.0 kph (Zone 3), 12.1–16.0 kph (Zone 4), 16.1–20.0 kph (Zone 5), and > 20.0 kph (Zone 6)
- Metabolic power: ≤ 10.0 W/kg (Zone 1), 10.1–20.0 W/kg (Zone 2), 20.1–35.0 W/kg (Zone 3), 35.1–55.0 W/kg (Zone 4), and >55 W/kg (Zone 5)
- Acceleration and deceleration: 1.80–3.60 m/s2 (Zone 1), 3.61–5.40 m/s2 (Zone 2), and 5.41–7.20 m/s2 (Zone 3)
Locomotor Demands
Locomotor demands are the most popular metrics in soccer and have been widely reported for several decades. Some of the pioneering work in this space included manually coding video of recorded games (Bangsbo et al., 1991), whereas today there are automated video systems permanently installed in stadiums as well as GPS technology that afford teams a mobile option that can be used almost anywhere. These technological advances have enabled the continued expansion of data collection, which ultimately allow practitioners to capture data more easily and report the distances covered within various velocity bands.
Youth
To date, there are five studies describe the demands of female youth soccer matches (Barbero-Alvarez et al., 2008; Vescovi, 2014; Orntoft et al., 2016; Ramos et al., 2019; Harkness-Armstrong et al., 2020). The youngest age groups to be reported is U11-U12; however, the modified structure (see Table 1) makes direct comparisons to the literature impossible (Barbero-Alvarez et al., 2008; Orntoft et al., 2016). Still, the 20 and 50-min games resulted in ~1,600 and 3,963 m of total distance, respectively, and a corresponding movement rate of about 80 m/min (Barbero-Alvarez et al., 2008; Orntoft et al., 2016), which is expectedly lower than movement rates for older age groups. A study during a youth national championship tournament (domestic) reported the demands of U15 to U17 players competing in typical match configurations (11v11 for 80–90 min) (Vescovi, 2014). The U15 players covered 6,961, 458, and 76 m for total, high-intensity (15.6–20.0 kph) and sprinting (>20 kph) distances, respectively, which were lower than the distances reported for U16 (8,024, 611, 185 m) and U17 (8,558, 658, and 235 m) age-group matches. These age-group differences persisted even after accounting for match duration with lower movement rates for U15 (86 m/min) compared to U16 and U17 (93–95 m/min) players. Talent pathway league matches for U14 and U16 teams showed average total distances of 7,148 and 7,679 m, respectively, with 217 and 247 m of high-intensity running (>19.0 kph) (Harkness-Armstrong et al., 2020). During the women's U17 South American championships (international), the players for Brazil covered 8,270, 485, and 191 m for total, high-intensity (15.6–20 kph), and sprint distances (>20 kph), respectively (Ramos et al., 2019). In general, there seems to be comparable total distances and movement rates for the same age groups, but the two studies using the same velocity thresholds showed high-intensity distances were about 24% lower during the international event (676 m) (Ramos et al., 2019) than the domestic event (893 m) (Vescovi, 2014). This difference could be attributable to the GPS technology used (5 vs. 10 Hz), environmental conditions, as well as game tactics (e.g., formation, style of play, etc.). Overall, it seems progressively greater movement rates occur across age-group youth soccer matches and is likely a reflection of improved physical capacities of players (Mujika et al., 2009) while holding match contextual factors constant.
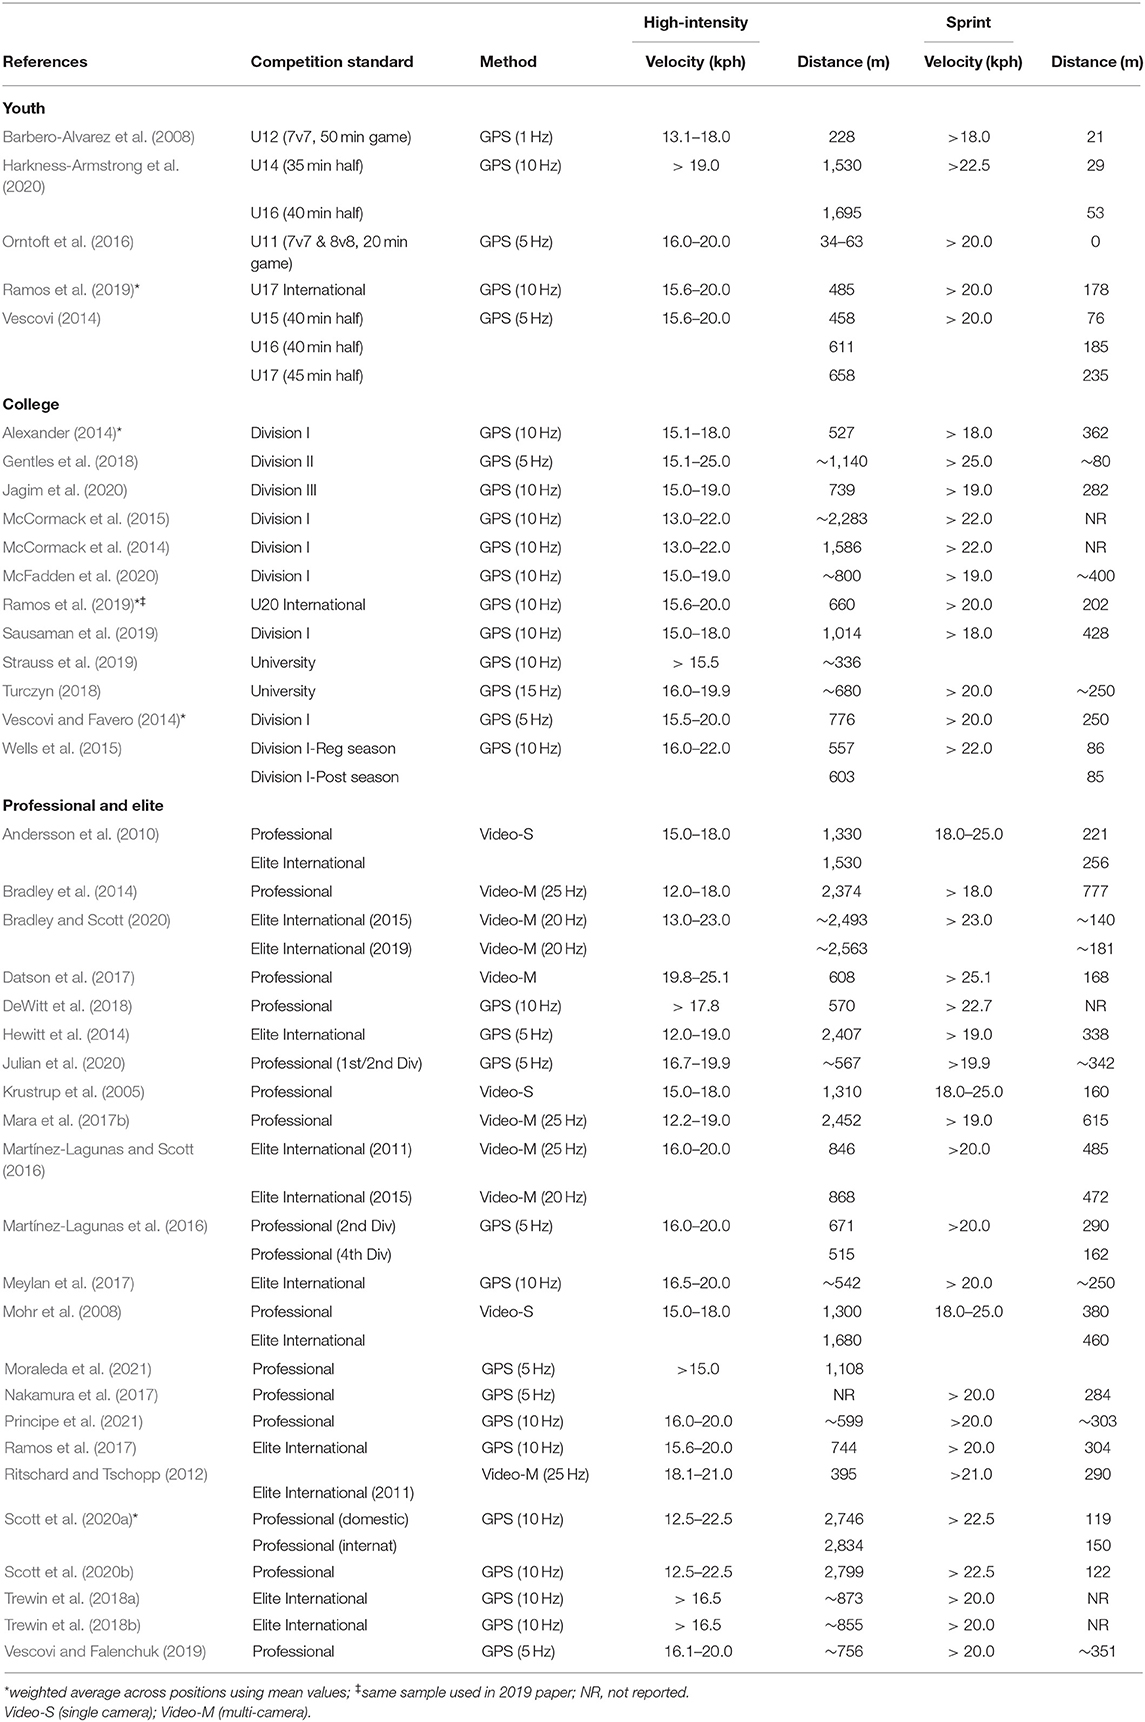
Table 1. Velocity thresholds and distances for high-intensity running and sprinting across standards.
College
Research examining the demands of women's college soccer matches has gained attention during the past few years. An important distinction to note about NCAA matches is that they do not follow international standards for substitutions. So, researchers tend to either include players that competed in full matches (which limits the sample size) or “create” 90-min matches from multiple players (which tends to alter movement rates). This is evident from a study comparing Division I regular season and post-season matches, which showed a 10% increase in total distance with a corresponding 6.5% decrease in movement rate (Wells et al., 2015). Nevertheless, total distances reported for NCAA Division I (~9,000–9,900 m) (McCormack et al., 2014; Vescovi and Favero, 2014; Sausaman et al., 2019), Division II (~10,000) (Gentles et al., 2018), Division III (~9,600–9,800 m) (Jagim et al., 2020) as well as Canadian University matches (~8,800–9,600 m) (Turczyn, 2018) are fairly similar, with subsequent movement rates of ~100–110 m/min. Despite slightly different velocity thresholds used to define high-intensity running, it seems that when the velocity band spans only 3–4 kph the amount of distance covered is within a range of ~600–800 m (Vescovi and Favero, 2014; Wells et al., 2015; Ramos et al., 2017; Turczyn, 2018; Jagim et al., 2020) with a notable exception reaching ~1,000 m (Sausaman et al., 2019). For sprint distances, increasing the lower limit velocity threshold from 18 to 19 kph (~280–420 m) (Alexander, 2014; Sausaman et al., 2019; Jagim et al., 2020; McFadden et al., 2020) to 20 kph (~200–250 m) (Vescovi and Favero, 2014; Ramos et al., 2017) and 22 kph (<100 m) (Wells et al., 2015) has the expected reduction of reported distances.
Investigators have also examined the impact of contextual factors (e.g., altitude, match frequency, etc.) on locomotor demands in college matches. Moderate altitude (1,839 m) had a negative effect on total (121 vs. 106 m/min) and high-intensity (28 vs. 25 m/min) movement rates (Bohner et al., 2015), suggestive that hypoxic conditions adversely impacted locomotor activity. When college soccer matches end in a draw, the teams play two 10-min extra-time periods. The additional 20 min result in a 22–23% increase in total distances for extra-time matches compared with 90-min matches (Williams et al., 2019). Surprisingly, the total distances covered during extra-time were equivalent (~1,100 m) between players who competed in the entire match or only a portion of the match. The NCAA soccer match schedule can be considered congested, where multiple games are oftentimes played with minimal days off in between. One study demonstrated that regular Friday and Sunday matches throughout the season resulted in lower total (120 vs. 106 m/min) and high-intensity (25 vs. 22 m/min) movement rates during the second game (McCormack et al., 2015). Similarly, Canadian women's soccer matches showed a ~13% reduction in high-intensity (16–20 kph) and sprint (>20 kph) distance when games were on back-to-back days (Turczyn, 2018). Interestingly, there was no impact of poor sleep on match demands in these players (Turczyn, 2018). In contrast to the impact of match schedule, no differences were observed for high-speed or sprint distances between NCAA Division I regular-season and playoff matches (Wells et al., 2015), suggestive that players were able to continue playing with similar intensity throughout an entire season. Overall, these studies highlight how contextual factors might impact game demands for female college soccer players and the need to monitor these metrics in order to manage the physical demands players experience during the season.
Professional and International
There is substantially more evidence describing the locomotor demands of elite female soccer with a fairly even distribution between professional (domestic) (Krustrup et al., 2005; Mohr et al., 2008; Andersson et al., 2010; Bradley et al., 2014; Martínez-Lagunas et al., 2016; Datson et al., 2017; Mara et al., 2017b; Nakamura et al., 2017; DeWitt et al., 2018; Vescovi and Falenchuk, 2019; Julian et al., 2020; Scott et al., 2020a; Moraleda et al., 2021; Principe et al., 2021) and international matches (Mohr et al., 2008; Andersson et al., 2010; Ritschard and Tschopp, 2012; Hewitt et al., 2014; Martínez-Lagunas and Scott, 2016; Trewin et al., 2018a,b; Ramos et al., 2019; Bradley and Scott, 2020; Scott et al., 2020a,b).
The average total distances reported among professional (~8,200–11,000 m) and international (~9,300–11,000 m) level matches are generally similar. The majority of studies have demonstrated movement rates between 100 and 120 m/min (Krustrup et al., 2005; Mohr et al., 2008; Andersson et al., 2010; Bradley et al., 2014; Hewitt et al., 2014; Datson et al., 2017; Mara et al., 2017b; Trewin et al., 2018a,b; Julian et al., 2020; Scott et al., 2020b) with only a few showing movement rates below 100 m/min (Martínez-Lagunas et al., 2016; DeWitt et al., 2018; Moraleda et al., 2021; Principe et al., 2021) and one above 120 m/min (Datson et al., 2017). Interestingly, only the top finishing teams in the 2015 and 2019 FIFA Women's World Cups had movement rates that were aligned (105–113 m/min) with the general consensus from the literature, whereas the bottom finishing teams were between 86 and 94 m/min (Bradley and Scott, 2020). Additionally, there was a sizeable gap in movement rate between German teams in the 2nd division (~104 m/min) and 4th division (~91 m/min) (Martínez-Lagunas et al., 2016). The differences between top and bottom teams within a given standard of play (i.e., divisions in a professional league or international events like the World Cup) could be the result of contextual factors (e.g., lower-level teams making tactical decision to largely play defense). It is also possible these outcomes highlight supportive evidence for the link between fitness levels and distances covered during women's soccer matches (Krustrup et al., 2005).
There is a substantial range describing the high-speed running and sprinting distances in elite women's matches, which is directly attributable to the wide variety of thresholds used to define these particular metrics (see Table 1). For example, some studies have used 12.0–12.5 kph as the lower limit for a given threshold (e.g., high-intensity running) (Bradley et al., 2014; Hewitt et al., 2014; Mara et al., 2017b; Scott et al., 2020a,b), but the upper limit has ranged between 18.0 and 22.5 kph. Subsequently, the reported distances vary from ~2,300–2,450 m (Bradley et al., 2014; Hewitt et al., 2014; Mara et al., 2017b) when using 18.0 kph, compared with ~2,800 m being captured as a result of using 22.5 kph (Scott et al., 2020a,b). Three studies have examined both professional and international women's matches; despite similar total distances between standards (within their respective studies) (Mohr et al., 2008; Andersson et al., 2010; Scott et al., 2020a), two studies reported 15–29% more high-intensity running during international matches (Mohr et al., 2008; Andersson et al., 2010), whereas the other found only a 3% difference (Scott et al., 2020a). The wider velocity zone (12.5–22.5 kph) (Scott et al., 2020a) may have impacted the outcomes because smaller differences in distance are seen between standards at slower speeds (e.g., 6–16 kph), thus potentially washing out an effect that was observed when using a smaller velocity zone (15–18 kph) (Mohr et al., 2008; Andersson et al., 2010). On the other hand, it is possible that differences between international and professional matches dissipate when players at both levels compete together. Thus, elevated international match demands may be the result of contextual factors inherent to the competition itself (i.e., higher stakes, greater motivation), rather than as unique physiological characteristics of international level players. Lastly, the influence of natural (~660 m) and synthetic (~770 m) turf on high-intensity running during women's matches has also been reported (Vescovi and Falenchuk, 2019) and demonstrates how this contextual factor might impact match demands at this standard of play.
Sprinting distances between studies also varies widely because of the different velocity thresholds. Several studies have used >20 kph and found sprint distances between ~250 and ~350 m per match (Martínez-Lagunas et al., 2016; Meylan et al., 2017; Nakamura et al., 2017; Trewin et al., 2018a,b; Ramos et al., 2019; Vescovi and Falenchuk, 2019; Julian et al., 2020; Principe et al., 2021), with substantially smaller distances shown (120–180 m) when higher thresholds are used (22.5–25.1 kph) (Datson et al., 2017; Bradley and Scott, 2020; Scott et al., 2020a,b). These differences between studies are expected since the impact of implementing various high-velocity thresholds on these locomotor distances has been previously demonstrated in professional women's matches (Vescovi, 2012; Bradley et al., 2014). Nevertheless, players competing in international matches have 16–26% more sprint distances than during professional matches (Mohr et al., 2008; Andersson et al., 2010; Scott et al., 2020a). An examination of the previous three FIFA Women's World Cups indicates nearly identical sprint distances between 2011 and 2015 (485 vs. 472 m; using >20 kph) (Martínez-Lagunas and Scott, 2016), but a 21% increase from 2015 to 2019 (~558 vs. ~677 m; using >19 kph) (Bradley and Scott, 2020). Taken together and despite the difficulty of making direct comparisons between published studies, greater high-intensity demands are evident at the highest standard.
Developmental Perspective
Table 2 displays the total distance, movement rate and distances in each velocity band across the developmental spectrum. In general, total match distances are aligned with data from the literature for the respective cohorts and shows a strong linear increase from youth (~7.0–8.7 km) to professional and international matches (~10 km) (Figure 1). This relationship remained even after taking match duration into account, although after the NCAA a plateau of movement rate occurred for professional (domestic) and international matches. The movement rates for professional and international matches are similar to the top teams that competed in the 2011 (106–120 m/min) (Ritschard and Tschopp, 2012), 2015 (108–113 m/min) (Martínez-Lagunas and Scott, 2016), and 2019 (105-110 m/min) FIFA Women's World Cup (Bradley and Scott, 2020) tournaments. As a proportion of total distance, Zone 2 (~12–13%) and Zone 3 (~27.5–29.5%) remained fairly constant between all standards of play. However, there was a larger change in the relative distances for lower (Zone 1) and higher (Zone 5+6) speed movements, demonstrating that younger players perform greater proportions of walking and smaller proportions of high-intensity movement compared to higher standards (Figure 2). So, young players will be exposed to greater demands progressing through age-groups and then again if they progress to play at the college level. The greater demands through youth and into college will be somewhat connected to increased match duration, but more important, also linked with higher match tempos. College athletes seeking to compete at even higher standards will be required to have ~10% faster movement rates in order to match the tempo of professional and international players. This will result from a substantially greater percent change for high-intensity distances (Zones 5+6) compared with total distance. For example, the relative changes between U17 and NCAA Division I is 12% for total distance and 19% for high-intensity running. Similarly, 6% and 13% increases are evident when transitioning between Division I and professional matches for total and high-intensity distance, respectively. These are critical pieces to understand when designing the physical preparation component of player development models.
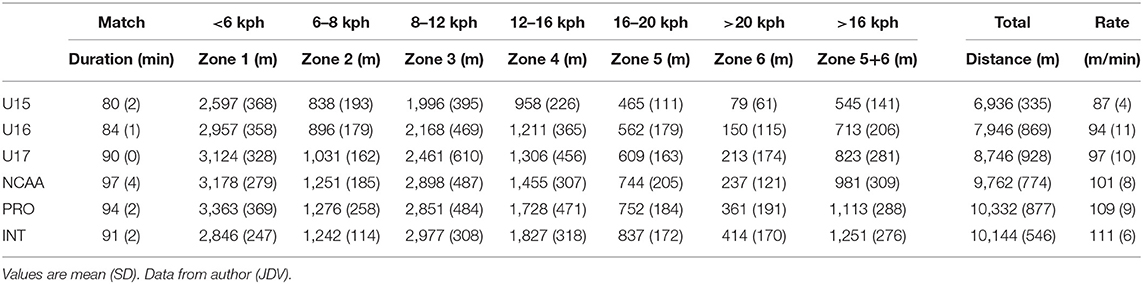
Table 2. Locomotor distances and movement rate across standards.
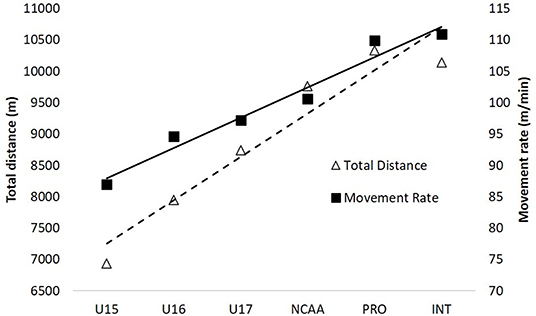
Figure 1. Average total distance and movement rate across standards. Data from author (JDV).
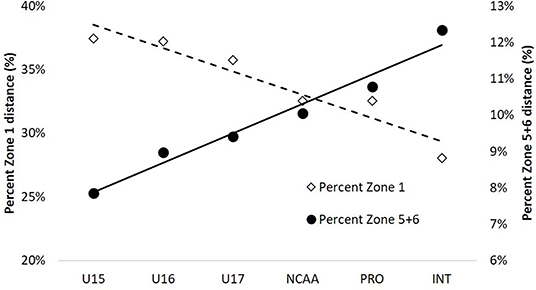
Figure 2. Average percent distance of Zone 1 and Zone 5+6 across standards. Data from author (JDV).
Acceleration and Deceleration Demands
Quantifying the distance covered and movement rate of soccer matches only describes a portion of the demands experienced by players since the intermittent nature of the game requires frequent changes of speed. The positive (acceleration) and negative (deceleration) changes in speed impose additional demands on the body than when moving at a constant velocity (Osgnach et al., 2010). These changes in speed may be brief and not meet the duration (e.g., >1 s) or speed (e.g., >20 kph) requirements that would result in the activities being labeled as high-velocity running activities within GPS systems. Nevertheless, they are still high-intensity actions based on acceleration (Akenhead et al., 2013; Mara et al., 2016; Nakamura et al., 2017). Therefore, it is important for practitioners to give consideration to the quantity and intensity of accelerations and decelerations when examining match demands of women's soccer.
Youth
There is a single study describing the acceleration profile for youth women's soccer matches (Ramos et al., 2019). The physical demands of seven matches from the U17 National Brazilian team demonstrated that, on average, players performed 150–200 accelerations (>1 m/s2) and 85–122 decelerations (> −1 m/s2) during an international event.
College
Several research groups have described acceleration profiles (Ramos et al., 2017, 2019; Jagim et al., 2020) as well as accelerometer derivative metrics (e.g., player load) (Wells et al., 2015; Gentles et al., 2018; Strauss et al., 2019) for college age-group matches. The accelerometer derivatives might be useful metrics because they can account for movements such as jumping; however, these do not directly reflect changes in horizonal speed and thus are not considered here.
Categorizing movements into specific bins demonstrated the vast majority of accelerations and decelerations were low intensity (± 0.5–1.99 m/s2, 953 vs. 1,010, respectively), when compared with moderate (± 2.00–2.99 m/s2, 64 vs. 69, respectively), and high-intensity (± 3.00–50.0 m/s2, 10 vs. 17, respectively), counts for Division III NCAA matches (Jagim et al., 2020). During a U20 international tournament players performed 172–196 accelerations and 108–145 decelerations (>1 m/s2) (Ramos et al., 2019); however, these values were substantially reduced when the threshold was increased to >2 m/s2 (13–17 and 11–25, respectively), in the same group (Ramos et al., 2017).
Professional and International
Several studies have reported acceleration (Meylan et al., 2017; Trewin et al., 2018a,b; Principe et al., 2021) and deceleration profiles (Mara et al., 2017a; Ramos et al., 2019; Principe et al., 2021) for elite female soccer players. Three studies were conducted by the same group and implemented the same definition (>2.26 m/s2) to quantify the frequency of accelerations that occurred during matches (Meylan et al., 2017; Trewin et al., 2018a,b). In general, the number of accelerations performed was about 1.8/min (~162 for 90 min match) (Meylan et al., 2017; Trewin et al., 2018b). They also demonstrated contextual factors (hot environment had lowest count = 1.73/min or ~156; draws vs. lower teams had highest count = 2.07/min or ~186) influenced the number of accelerations performed (Trewin et al., 2018a,b).
A few studies described both acceleration and deceleration profiles (Ramos et al., 2019; Moraleda et al., 2021; Principe et al., 2021). The Brazilian women's national team was monitored during the Rio 2016 Olympic Games and had average acceleration and deceleration counts ranging from 201–218 to 161–182 per match, respectively (Ramos et al., 2019). These outcomes demonstrate acceleration counts are about 16–38% higher when using a substantially lower threshold (1 m/s2) (Ramos et al., 2019) than reported above. Professional Brazilian players had substantially lower acceleration and deceleration frequencies (also used >1 m/s2 - ~155 and ~157, respectively) (Principe et al., 2021) than their national team counterparts, highlighting the distinction between these two standards of play. Another study implemented a threshold of 2 m/s2 but uniquely described accelerations and decelerations by the starting and finishing speed associated with the movement and classified the frequency counts in six different zones (Mara et al., 2017a). They reported a total of 423 and 430 accelerations and decelerations, respectively, with the majority of them (~250 each) having a low starting and ending speed (<3.4 m/min). Interestingly, this study found substantially greater counts of accelerations and decelerations in elite women's matches (about double) despite using a threshold that was between other research groups (1.0 vs. 2.0 vs. 2.26 m/s2). Perhaps the video system (25 Hz) is more sensitive than GPS technology (10 Hz) for quantifying these match demands. When monitoring acceleration counts for elite matches practitioners need to consider match-to-match variation (12–21%) (Meylan et al., 2017; Trewin et al., 2018a).
Developmental Perspective
The acceleration and deceleration profiles shown in Table 3 highlight several key features across the developmental spectrum. First, more than 95% of accelerations and 85% of decelerations occurred between 1.8 and 3.6 m/s2. These thresholds are the manufacturer defaults, nevertheless the skewed distribution suggests that alternative values are likely needed if practitioners want to qualify these metrics as low, moderate and high-intensity. Improved quantification of frequency counts might require assessment of acceleration ability across the developmental spectrum to identify appropriate thresholds. Second, the total accelerations for professional and international matches (145–158 or 1.6–1.8/min) appear somewhat aligned with previous studies using GPS technology, despite implementing different thresholds (1 and 2.26 m/s2) (Meylan et al., 2017; Trewin et al., 2018a,b; Ramos et al., 2019). It is unclear what could cause this but is likely a result of subtle differences in vendor software calculations. Lastly, the largest change in acceleration (~34%) and deceleration (~26%) frequency occurs between youth and NCAA matches. This highlights a substantial component for player development pathways aimed at athletes making the transition from high school to college.
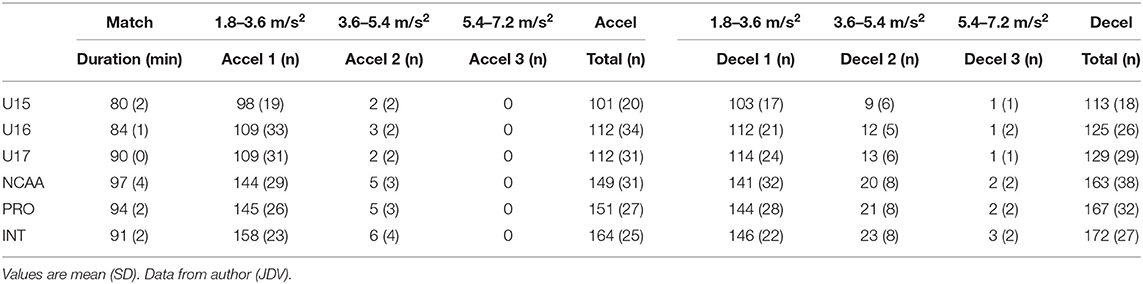
Table 3. Acceleration and deceleration frequencies across standards.
Metabolic Power Demands
The introduction of metabolic power (di Prampero et al., 2005) and subsequent application to soccer match analysis (Osgnach et al., 2010) has integrated acceleration and deceleration data to define additional metrics. This method has been suggested to better represent match demands than relying upon velocity based demands alone, especially for high-intensity work (Gaudino et al., 2013). The outcomes include distances within various metabolic power bands (similar to establishing velocity bands for locomotor distances) as well as the energetic cost (internal load metric). An important note, unlike velocity thresholds, the originally proposed metabolic power thresholds (Osgnach et al., 2010) have been consistently applied in the literature, which are: <10 (low), 10–20 (moderate), 20–35 (high), 35–55 (elevated), and > 55 (maximal) W/kg. Although updated algorithms have been developed to improve the accuracy of this method (di Prampero and Osgnach, 2018; Osgnach and di Prampero, 2018), it should be noted that studies reporting on metabolic power in women's soccer are scarce and have applied the original approach (di Prampero et al., 2005).
Youth
As of this writing, there are no published studies examining the metabolic power demands of youth female soccer matches.
College
Two studies have examined metabolic power in women's college soccer matches (Wells et al., 2015; Williams et al., 2019) but described limited outcome variables despite the ability to quantify several more (Osgnach et al., 2010). In one study, the mean high-metabolic power distance (>20 W/kg) in NCAA Division I matches was 1,839 and 440 m for regulation and extra-time, respectively (Williams et al., 2019). The total for that study (2,279 m total) is similar to unpublished data from NCAA matches (2,126 m–Table 3) that also includes stoppage-time (mean match duration, 97 min). An important consideration for practitioners is that stoppage and extra-time can substantially elevate the amount of high-metabolic power distance (Williams et al., 2019), therefore recovery strategies from those matches become more important, especially if there is little time before the next match as often is the case with the NCAA soccer schedule.
Using this method (Osgnach et al., 2010) also allows for an estimation of energetic demands. One study reported a 10% increase in energy expenditure between regular season (34 kj/kg) and post-season (38 kj/kg) college matches which was linked to an additional 700 m of total distance (Wells et al., 2015). The energetic demands were greater (48 kj/kg) in another group of Division I players (Williams et al., 2019) and even higher for NCAA teams in Table 4 (53 kj/kg). Although all were NCAA Division I teams, the ones included in Table 4 had a high national ranking (e.g., six of nine teams ranked top 30 and three ranked top 10). Similar to the differences described for locomotor movement rates between top and bottom teams in FIFA Women's World Cup (Bradley and Scott, 2020) there are likely variations in the tempo of play across NCAA Division I that could subsequently impact energetic demands of these matches. Furthermore, the implementation of the metabolic power methodology could be modified by commercially available GPS systems (Williams et al., 2019) in order to have a proprietary competitive advantage, which could have also influenced the reported outcomes between studies (Terziotti et al., 2018). Additionally, when converting the relative energetic demands from these studies into calorie expenditure (520–770 kcal) (Wells et al., 2015; Williams et al., 2019), they are substantially lower than values obtained using heart rate derived equivalents (~1,100–1,400 kcal) (Jagim et al., 2020; McFadden et al., 2020), thus it does not appear the outcomes from various methods can be used interchangeably.
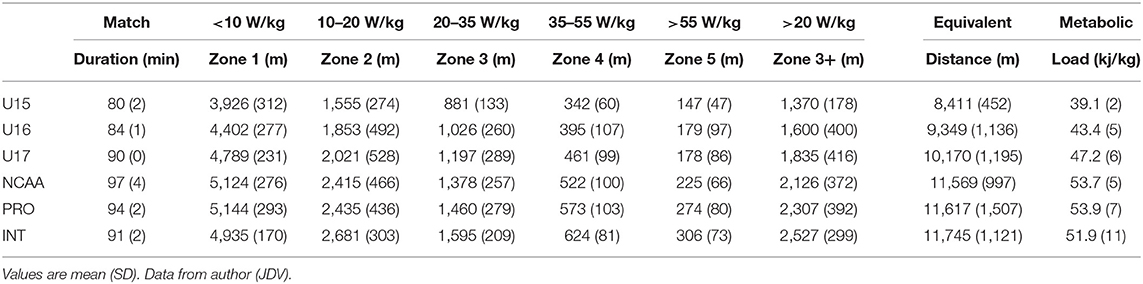
Table 4. Metabolic power distances and load across standards.
Professional and International
To date there are two published studies that include metabolic power demands for female players. Both studies evaluated professional domestic match play and included the same cohort of players from the WPS league (Vescovi, 2016; Vescovi and Falenchuk, 2019). Playoff matches showed greater mean metabolic power (10.2 W/kg) than regular season matches (9.2 W/kg), which corresponded to ~23, 26, and 29% more relative distance covered in high (19.4 vs. 15.8 m/min), elevated (7.2 vs. 5.7 m/min) and maximal (2.2 vs. 1.7 m/min) metabolic power categories, respectively (Vescovi, 2016). There was little impact on metabolic power metrics when examining various contextual factors (i.e., home vs. away, natural vs. artificial turf, and match outcome) (Vescovi and Falenchuk, 2019). The only notable difference was greater high-metabolic power distance when matches were played on artificial turf (16.3 m/min) than on natural turf (14.4 m/min). When the top three categories are taken together (>20 W/kg) the distances covered on natural and artificial turf were ~2,070 and 2,313 m (Vescovi and Falenchuk, 2019), which are greater than the value previously described for college matches (regulation-time 1,839 m) (Wells et al., 2015).
The energetic demands of players competing at higher standards have also been described. During a modified match structure (3 × 20 min), female players had a relative energetic load of 37 kj/kg (~2,400 kj) (Mara et al., 2015a). Even higher values have been reported from professional regular-season and post-season matches (51–58 kj/kg) (Vescovi, 2016; Moss et al., 2020). This equates to ~900 kcal expenditure during professional women's soccer matches, which is greater than measured values (~744 kcal) reported for professional German players during a 90-min training game (Martínez-Lagunas, 2013). However, the overall movement demands were lower (total distance ~ 7,230 m and distance >16 kph ~631 m) than values typically observed during regulation matches and so lower energy expenditure values would be expected. Nonetheless, these data highlight the overall energetic needs for female players is likely between 750 and 900 kcal per match.
Developmental Perspective
The data provided in Table 4 fills some of the gaps identified in the literature surrounding metabolic power and also includes a derived metric, equivalent distance. The equivalent distance is a way to express the distance an athlete would have traveled at a steady pace on grass by using the total energy expended during the entire match (Osgnach et al., 2010). The ratio of equivalent distance to total distance (called equivalent distance index–EDI) has been previously defined for convenience to be ~1.20 (Osgnach et al., 2010). The equivalent distance and its index may be metrics of interest because they represent the overall volume and metabolic intensity a player experiences during a match, respectively (di Prampero and Osgnach, 2018; Osgnach and di Prampero, 2018). It is evident that there are steadily increasing values for several metrics such as metabolic load, movement rate, and equivalent distance from youth and into the NCAA matches, which then seem to plateau at higher standards. Similar to Table 2, the percent change among standards for high-metabolic power distance (Zone 3+ >20 W/kg) is substantially larger than the corresponding percent change between levels for equivalent distance (9–17 vs. 1–14%, respectively). The reason this occurred is unknown, but since these metrics take into account acceleration/deceleration, their distribution might offer insights into potential links. Currently, the skewed distribution of this dataset obstructs an understanding on this topic - perhaps applying different acceleration/deceleration thresholds would be better suited to investigate this in the future. Nonetheless, metabolic power outcomes provide supportive evidence for giving attention to developing the ability to perform greater amounts of high-intensity effort across the developmental spectrum.
Practical Considerations and Applications
The data presented highlights the physical demands of women's soccer matches across the developmental spectrum. This information can be used by clubs, leagues and federations for player development within and between levels of play. It could also be used for return to play protocols for injured players during the rehabilitation process. It is beyond the scope of this paper to detail the specific ways to go about incorporating this into the daily training environment and rehabilitation settings. However, coaches and fitness practitioners can likely focus on two overarching objectives with respect to effectively using information on the physical demands of women's matches. The first way is to help players achieve the match demands within their current standard. For example, players on a particular team or teams within a given level (e.g., U15, NCAA Division III) will demonstrate a range of physical match demands for any of the metrics described above. Improving the physical fitness qualities of players/teams that are at the lower end of the range can subsequently have a positive impact on performance during matches. The second focus for coaches and practitioners is to prepare athletes/teams who are looking to transition to the next higher standard (i.e., a player going from college to professional, or a team being promoted from a lower to higher professional division). In these circumstances, the physical preparation must be targeted at the demands for the higher level with care taken to implement a periodized plan over a sufficient amount of time to elicit the desired (beneficial) physiological adaptations.
A general heuristic often followed in endurance training is for athletes to perform ~2.0–2.5 times the competition distance as total weekly training volume. Translated to women's soccer, that would mean if total distances during matches were ~7 km (youth), ~9 km (college), or ~11 km (professional/elite), then total weekly volume should roughly be 14–18, 18–22, and 22–28 km, respectively. These theoretical targets for total weekly training distance seem to be somewhat aligned with what has been reported for professional teams (~16–22 km, exclusive of matches) (Mara et al., 2015b; Moraleda et al., 2021). Please note, the ratio (2.0–2.5X) would only be applied to total volume since evidence-based recommendations on other metrics (i.e., sprint distance, volume of accelerations, metabolic power) do not currently exist. These distances could be programmed into the weekly training sessions and incorporated directly into practice with soccer-specific drills and small-sided games that target particular attributes of interest (e.g., very short maximal accelerations [<5 m], achievement of maximal velocity [15–20 m], etc.). This type of approach enables technical, tactical and physical components to be developed simultaneously and reduces the need for additional (off-field) work.
Moving Forward
There has been a steady increase in the number of published studies describing the physical demands of women's soccer matches. The advancements in video capture systems and GPS technology have enabled the expansion of insights about a broad spectrum of movement demands. Still, there are gaps specific to women's soccer that have been noted by others (Martínez-Lagunas et al., 2014) and need to be addressed. First, there is a lack of standardized thresholds for quantifying locomotor distances as well as acceleration and deceleration profiles. This prevents a unified understanding of match demands across the developmental spectrum. The use of physiological (Bradley and Vescovi, 2015; Trewin et al., 2018a) and mathematical (Park et al., 2019) approaches have been suggested but still have not been embraced (e.g., different thresholds implemented in previous three Women's World Cup events) (Ritschard and Tschopp, 2012; Martínez-Lagunas and Scott, 2016; Bradley and Scott, 2020). Second, there is a tremendous gap in research describing the physical demands of youth soccer matches (≤U17). In order to provide comprehensive training recommendations for developmental pathways additional attention is required. Work has been initiated in this area (Harkness-Armstrong et al., 2020), but needs to continue through National Sport Organizations and professional academies that have the necessary resources to monitor players within their ecosystem, but effort is also required by researchers to partner with women's youth domestic leagues in order to broaden the scope of understanding. Lastly, there is limited data about the metabolic power metrics in women's soccer, which now exist in most commercially available GPS systems. Therefore, if metabolic power provides insights beyond velocity-based movement demands, then researchers should begin to include these outcomes in published studies. Overall, the direction of research in women's soccer is very promising and continued advancements to fill these gaps will ensure that better, evidence-based recommendations are applied to the physical developmental component of female player pathway models.
Data Availability Statement
The datasets presented in this article are not readily available because of pre-existing legal agreements. Requests to access the datasets should be directed to Dr. Jason Vescovi.
Ethics Statement
The studies involving human participants were reviewed and approved by York University, Office of Research Ethics. Written informed consent to participate in this study was provided by the participants' legal guardian/next of kin.
Author Contributions
JDV was responsible for manuscript concept, data collection, writing, and revision of the paper. EF and AK were responsible for conducting the literature search, writing, and revision of the paper. All authors contributed to the article and approved the submitted version.
Conflict of Interest
The authors declare that the research was conducted in the absence of any commercial or financial relationships that could be construed as a potential conflict of interest.
Acknowledgments
Thanks to all of the players who participated in the author's research (JDV). Thanks to the coaches and managers for their interest and support. Finally, thanks to the federations (Canada Soccer, US Soccer Federation), committees (NCAA soccer coach's and referee's committees) and leagues (WPS and ECNL) for providing permission to conduct these first of a kind studies. I'm humbled for having these opportunities and been able to contribute to the understanding of women's soccer across the developmental spectrum.
References
Akenhead, R., Hayes, P. R., Thompson, K. G., and French, D. (2013). Diminutions of acceleration and deceleration output during professional football match play. J. Sci. Med. Sport 16, 556–561. doi: 10.1016/j.jsams.2012.12.005
Alexander, R. P. (2014). Physical and Technical Demands of Women's Collegiate Soccer. PhD, East Tennessee State University.
Andersson, H. A., Randers, M. B., Heiner-Moller, A., Krustrup, P., and Mohr, M. (2010). Elite female soccer players perform more high-intensity running when playing in international games compared with domestic league games. J. Strength Condition. Res.24, 912–919. doi: 10.1519/JSC.0b013e3181d09f21
Bangsbo, J., Norregaard, L., and Thorso, F. (1991). Activity profile of competition soccer. Canad. J. Sport Sci. 16, 110–116.
Barbero-Alvarez, J. C., Lopez, M. G., Barbero-Alvarez, V., Granda, J., and Castagna, C. (2008). Heart rate and activity profile for young female soccer players. J. Human Sport Exerc. 3, 1–11. doi: 10.4100/jhse.2008.32.01
Bohner, J. D., Hoffman, J. R., McCormack, W. P., Scanlon, T. C., Townsend, J. R., Stout, J. R., et al. (2015). Moderate altitude affects high intensity running performance in a collegiate women's soccer game. J. Hum. Kinet. 47, 147–154. doi: 10.1515/hukin-2015-0070
Bradley, P., and Scott, D. (2020). Physical Analysis of the FIFA Women's World Cup France 2019™. Zurich: FIFA.
Bradley, P. S., Dellal, A., Mohr, M., Castellano, J., and Wilkie, A. (2014). Gender differences in match performance characteristics of soccer players competing in the UEFA Champions League. Hum. Mov. Sci. 33, 159–171. doi: 10.1016/j.humov.2013.07.024
Bradley, P. S., and Vescovi, J. D. (2015). Velocity thresholds for women's soccer matches: sex specificity dictates high-speed running and sprinting thresholds - female Athletes in Motion (FAiM). Int. J. Sports Physiol. Perform. 10, 112–116. doi: 10.1123/ijspp.2014-0212
Buchheit, M., and Simpson, B. M. (2017). Player-tracking technology: half-full or half-empty glass? Int. J. Sports Physiol. Perform. 12, S235–S241. doi: 10.1123/ijspp.2016-0499
Datson, N., Drust, B., Weston, M., Jarman, I. H., Lisboa, P. J., and Gregson, W. (2017). Match physical performance of elite female soccer players during international competition. J. Strength Condition. Res. 31, 2379–2387. doi: 10.1519/JSC.0000000000001575
DeWitt, J. K., Gonzales, M., Laughlin, M. S., and Amonette, W. E. (2018). External loading is dependent upon game state and varies by position in professional women's soccer. Sci. Med. Football 2, 225–230. doi: 10.1080/24733938.2018.1447142
di Prampero, P. E., Fusi, S., Sepulcri, L., Morin, J. B., Belli, A., and Antonutto, G. (2005). Sprint running: a new energetic approach. J. Experi. Biol. 208, 2809–2816. doi: 10.1242/jeb.01700
di Prampero, P. E., and Osgnach, C. (2018). Metabolic power in team sports - Part 1: an update. Int. J. Sports Med. 39, 581–587. doi: 10.1055/a-0592-7660
Gaudino, P., Iaia, F. M., Alberti, G., Strudwick, A. J., Atkinson, G., and Gregson, W. (2013). Monitoring training in elite soccer players: systematic bias between running speed and metabolic power data. Int. J. Sports Med. 34, 963–968. doi: 10.1055/s-0033-1337943
Gentles, J. A., Coniglio, C. L., Besemer, M. M., Morgan, J. M., and Mahnken, M. T. (2018). The demands of a women's college soccer season. Sports 6:16. doi: 10.3390/sports6010016
Harkness-Armstrong, A., Till, K., Datson, N., and Emmonds, S. (2020). Whole and peak physical characteristics of elite youth female soccer match-play. J. Sports Sci. 30, 1–10. doi: 10.1080/02640414.2020.1868669
Hewitt, A., Norton, K., and Lyons, K. (2014). Movement profiles of elite women soccer players during international matches and the effect of opposition's team ranking. J. Sports Sci. 32, 1874–1880. doi: 10.1080/02640414.2014.898854
Jagim, A. R., Murphy, J., Schaefer, A. Q., Askow, A. T., Luedke, J. A., Erickson, J. L., et al. (2020). Match demands of women's collegiate soccer. Sports 8:87. doi: 10.3390/sports8060087
Jennings, D., Cormack, S., Coutts, A. J., Boyd, L., and Aughey, R. J. (2010). The validity and reliability of GPS units for measuring distance in team sport specific running patterns. Int. J. Sports Physiol. Perform. 5, 328–341. doi: 10.1123/ijspp.5.3.328
Julian, R., Skorski, S., Hecksteden, A., Pfeifer, C., Bradley, P. S., Schulzw, E., et al. (2020). Menstrual cycle phase and elite female soccer match-play: influence on various physical performance outputs. Sci. Med. Football. doi: 10.1080/24733938.2020.1802057. [Epub ahead of print].
Krustrup, P., Mohr, M., Ellingsgaard, H., and Bangsbo, J. (2005). Physical demands during an elite female soccer game: importance of training status. Med. Sci. Sports Exerc. 37, 1242–1248. doi: 10.1249/01.mss.0000170062.73981.94
Mara, J. K., Thompson, K. G., and Pumpa, K. L. (2015a). Assessing the energy expenditure of elite female soccer players: a preliminary study. J. Strength Condition. Res. 29, 2780–2786. doi: 10.1519/JSC.0000000000000952
Mara, J. K., Thompson, K. G., and Pumpa, K. L. (2016). Physical and physiological characteristics of various-sided games in elite women's soccer. Int. J. Sports Physiol. Perform. 11, 953–958. doi: 10.1123/IJSPP.2015-0087
Mara, J. K., Thompson, K. G., Pumpa, K. L., and Ball, N. B. (2015b). Periodization and physical performance in elite female soccer players. Int. J. Sports Physiol. Perform. 10, 664–669. doi: 10.1123/ijspp.2014-0345
Mara, J. K., Thompson, K. G., Pumpa, K. L., and Morgan, S. (2017a). The acceleration and deceleration profiles of elite female soccer players during competitive matches. J. Sci. Med. Sport 20, 867–872. doi: 10.1016/j.jsams.2016.12.078
Mara, J. K., Thompson, K. G., Pumpa, K. L., and Morgan, S. (2017b). Quantifying the high-speed running and sprinting profiles of elite female soccer players during competitive matches using an optical player tracking system. J. Strength Condition. Res. 31, 1500–1508. doi: 10.1519/JSC.0000000000001629
Martínez-Lagunas, V. (2013). Physiologlsche Beanspruchung eines Frauenfußballspiels. Leipziger Sportwissenschaftliche Beiträge 54, 122–127.
Martínez-Lagunas, V., Niessen, M., and Hartmann, U. (2014). Women's football: player characteristics and demands of the game. J. Sport Health Sci. 3, 258–272. doi: 10.1016/j.jshs.2014.10.001
Martínez-Lagunas, V., Niessen, M., and Hartmann, U. (2016). “GPS performance analysis of women's soccer competitive matches of the second and fourth German leauges,” in International Research in Science and Soccer II, eds. T. G. Favero, B. Drust, and B. Dawson. (London: Routledge), 93–103.
Martínez-Lagunas, V., and Scott, D. (2016). Physical Analysis of the FIFA Women's World Cup Canada 2015™. Zurich: FIFA.
McCormack, W. P., Hoffman, J. R., Pruna, G. J., Scanlon, T. C., Bohner, J. D., Townsend, J. R., et al. (2015). Reduced high-intensity-running rate in collegiate women's soccer when games are separated by 42 hours. Int. J. Sports Physiol. Perform. 10, 436–439. doi: 10.1123/ijspp.2014-0336
McCormack, W. P., Stout, J. R., Wells, A. J., Gonzalez, A. M., Mangine, G. T., Fragala, M. S., et al. (2014). Predictors of high intensity running capacity in collegiate women during a soccer game. J. Strength Condition. Res. 28, 964–970. doi: 10.1519/JSC.0000000000000359
McFadden, B. A., Walker, A. J., Bozzini, B. N., Sanders, D. J., and Arent, S. M. (2020). Comparison of internal and external training loads in male and female collegiate soccer players during practices vs. games. J. Strength Condition. Res. 34, 969–974. doi: 10.1519/JSC.0000000000003485
Meylan, C., Trewin, J., and McKean, K. (2017). Quantifying explosive actions in international women's soccer. Int. J. Sports Physiol. Perform. 12, 310–315. doi: 10.1123/ijspp.2015-0520
Mohr, M., Krustrup, P., Andersson, H., Kirkendal, D., and Bangsbo, J. (2008). Match activities of elite women soccer players at different performance levels. J. Strength Condition. Res. 22, 341–349. doi: 10.1519/JSC.0b013e318165fef6
Moraleda, B. R., Nedergaard, N. J., Morencos, E., David Casamichana, D., Ramirez-Campillo, R., and Vanrenterghem, J. (2021). External and internal loads during the competitive season in professional female soccer players according to their playing position: differences between training and competition. Res. Sports Med. doi: 10.1080/15438627.2021.1895781. [Epub ahead of print].
Moss, S. L., Randell, R. K., Burgess, D., Ridley, S., ÓCairealláin, O., Allison, R., et al. (2020). Assessment of energy availability and associated risk factors in professional female soccer players. Eur. J. Sport Sci. 6, 1–10. doi: 10.1080/17461391.2020.1788647
Mujika, I., Santisteban, J., Impellizzeri, F. M., and Castagna, C. (2009). Fitness determinants of success in men's and women's football. J. Sports Sci. 27, 107–114. doi: 10.1080/02640410802428071
Nakamura, F. Y., Pereira, L. A., Loturco, I., Rosseti, M., Moura, F. A., and Bradley, P. S. (2017). Repeated-sprint sequences during female soccer matches using fixed and individual speed thresholds. J. Strength Condition. Res. 31, 1802–1810. doi: 10.1519/JSC.0000000000001659
Orntoft, C., Larsen, M. N., Andersen, T. B., Rasmussen, L. S., Povoas, S. C., Randers, M. B., et al. (2016). Technical actions, heart rate, and locomotor activity in 7v7 and 8v8 games for female youth soccer players. J. Strength Condition. Res. 30, 3298–3303. doi: 10.1519/JSC.0000000000001434
Osgnach, C., and di Prampero, P. E. (2018). Metabolic power in team sports - Part 2: aerobic and anaerobic energy yields. Int. J. Sports Med. 39, 588–595. doi: 10.1055/a-0592-7219
Osgnach, C., Poser, S., Bernardini, R., Rinaldo, R., and di Prampero, P. E. (2010). Energy cost and metabolic power in elite soccer: a new match analysis approach. Med. Sci. Sports Exerc. 42, 170–178. doi: 10.1249/MSS.0b013e3181ae5cfd
Park, L. A. F., Scott, D., and Lovell, R. (2019). Velocity zone classification in elite women's football: where do we draw the lines? Sci. Med. Football 3, 21–28. doi: 10.1080/24733938.2018.1517947
Petersen, C., Pyne, D., Portus, M., and Dawson, B. (2009). Validity and reliability of GPS units to monitor cricket-specific movement patterns. Int. J. Sports Physiol. Perform. 4, 381–393. doi: 10.1123/ijspp.4.3.381
Principe, V. A., Seixas-da-Silva, I. A., Vale, R. G. D. S., and Nunes, R. D. A. M.. (2021). GPS technology to control of external demands of elite Brazilian female football players during competitions. Retos 40, 18–26. doi: 10.47197/retos.v1i40.81943
Ramos, G. P., Nakamura, F. Y., Penna, E. M., Wilke, C. F., Pereira, L. A., Loturco, I., et al. (2019). Activity profiles in U17, U20 and senior women's Brazilian national soccer teams during international competitions: are there meaningful differences? J. Strength Condition. Res. 33, 3414–3422. doi: 10.1519/JSC.0000000000002170
Ramos, G. P., Nakamura, F. Y., Pereira, L. A., Junior, W. B., Mahseredjian, F., Wilke, C. F., et al. (2017). Movement patterns of a U-20 national women's soccer team during competitive matches: influence of playing position and performance in the first half. Int. J. Sports Med. 38, 747–754. doi: 10.1055/s-0043-110767
Ritschard, M., and Tschopp, M. (2012). Physical Analysis of the FIFA Women's World Cup Germany 2011™. Zurich: FIFA.
Sausaman, R. W., Sams, M. L., Mizuguchi, S., DeWeese, B. H., and Stone, M. H. (2019). The physical demands of NCAA division I women's college soccer. J. Funct. Morphol. Kinesiol. 4:73. doi: 10.3390/jfmk4040073
Scott, D., Haigh, J., and Lovell, R. (2020a). Physical characteristics and match performances in women's international versus domestic-level football players: a 2-year, league-wide study. Sci. Med. Football 4, 211–215. doi: 10.1080/24733938.2020.1745265
Scott, D., Norris, D., and Lovell, R. (2020b). Dose-response relationship between external load and wellness in elite women's soccer matches: do customized velocity thresholds add value? Int. J. Sports Physiol. Perform. 1–7. doi: 10.1123/ijspp.2019-0660
Strauss, A., Sparks, M., and Pienaar, C. (2019). The use of GPS analysis to quantify the internal and external match demands of semi-elite level female soccer players during a tournament. J. Sports Sci. Med. 18, 73–81.
Terziotti, P., Sim, M., and Polglaze, T. (2018). A comparison of displacement and energetic variables between three team sport GPS devices. Int. J. Perform. Analy. Sport 18, 823–834. doi: 10.1080/24748668.2018.1525650
Trewin, J., Meylan, C., Varley, M. C., and Cronin, J. (2018a). The match-to-match variation of match-running in elite female soccer. J. Sci. Med. Sport 21, 196–201. doi: 10.1016/j.jsams.2017.05.009
Trewin, J., Meylan, C., Varley, M. C., Cronin, J., and Ling, D. (2018b). Effect of match factorson the running performance of elite female soccer players. J. Strength Condition. Res. 32, 2002–2009. doi: 10.1519/JSC.0000000000002584
Turczyn, D. (2018). Running Performance and Sleep Patterns in Canadian Female University Soccer Players. Master of Science, University of Manitoba.
Vescovi, J. D. (2012). Sprint profile of professional female soccer players during competitive matches: Female Athletes in Motion (FAiM) study. J. Sports Sci. 30, 1259–1265. doi: 10.1080/02640414.2012.701760
Vescovi, J. D. (2014). Motion characteristics of youth women soccer matches: Female Athletes in Motion (FAiM) study. Int. J. Sports Med. 35, 110–117. doi: 10.1055/s-0033-1345134
Vescovi, J. D. (2016). “Physical demands of regular season and playoff matches in professional women's soccer: a pilot from the Female Athletes in Motion (FAiM) study,” in International Research in Science and Soccer II, eds. T. G. Favero, B. Drust, and B. Dawson (New York, NY: Routledge), 81–92.
Vescovi, J. D., and Falenchuk, O. (2019). Contextual factors on physical demands in professional women's soccer: Female Athletes in Motion study. Eur. J. Sport Sci. 19, 141–146. doi: 10.1080/17461391.2018.1491628
Vescovi, J. D., and Favero, T. G. (2014). Motion characteristics of women's college soccer matches: Female Athletes in Motion (FAiM) study. Int. J. Sports Physiol. Perform. 9, 405–414. doi: 10.1123/ijspp.2013-0526
Waldron, M., Worsfold, P., Twist, C., and Lamb, K. (2011). Concurrent validity and test-retest reliability of a global positioning system (GPS) and timing gates to assess sprint performance variables. J. Sports Sci. 29, 1613–1619. doi: 10.1080/02640414.2011.608703
Wells, A. J., Hoffman, J. R., Beyer, K. S., Hoffman, M. W., Jajtner, A. R., Fukuda, D. H., et al. (2015). Regular- and postseason comparisons of playing time and measures of running performance in NCAA division I women soccer players. Appl. Physiol. Nutr. Metabol. 40, 907–917. doi: 10.1139/apnm-2014-0560
Williams, J. H., Hoffman, S., Jaskowak, D. J., and Tegarden, D. (2019). Physical demands and physiological responses of extra time matches in collegiate women's soccer. Sci. Med. Football 3, 307–312. doi: 10.1080/24733938.2019.1609694
Keywords: women's soccer, match demands, running distance, metabolic power, acceleration
Citation: Vescovi JD, Fernandes E and Klas A (2021) Physical Demands of Women's Soccer Matches: A Perspective Across the Developmental Spectrum. Front. Sports Act. Living 3:634696. doi: 10.3389/fspor.2021.634696
Received: 28 November 2020; Accepted: 22 March 2021;
Published: 16 April 2021.
Edited by:
Clare Minahan, Griffith University, AustraliaReviewed by:
Cosme Franklim Buzzachera, University of Pavia, ItalyVanessa Martinez Lagunas, University of Manitoba, Canada
Copyright © 2021 Vescovi, Fernandes and Klas. This is an open-access article distributed under the terms of the Creative Commons Attribution License (CC BY). The use, distribution or reproduction in other forums is permitted, provided the original author(s) and the copyright owner(s) are credited and that the original publication in this journal is cited, in accordance with accepted academic practice. No use, distribution or reproduction is permitted which does not comply with these terms.
*Correspondence: Jason D. Vescovi, VmVzY292aUpAYW9sLmNvbQ==