 Sven J. Steinert
 Paul Zabel
 Dominik Quantius2
- 1School of Engineering and Design, Technical University of Munich (TUM), Munich, Germany
- 2Institute of Space Systems, Systemanalyse Raumsegment, German Aerospace Center (DLR), Bremen, Germany
Given the increasing relevance of lunar activities, the location selection for in situ resource utilisation (ISRU) facilities is necessary for identifying the most suitable configuration during mission planning. To gather information about the dominant location dependencies, a scenario is established wherein an ISRU product is exported to an orbital depot and its mass costs are used for classification. In the selected scenario, oxygen is produced in an ilmenite reduction plant and subsequently exported to the lunar gateway via an oxygen–hydrogen fuelled launcher operated in a round-trip to refuel oxygen at the lunar surface and hydrogen at the lunar gateway. This showed that the transport cost variations could be avoided entirely or have a recessive influence on the mission’s total costs over an extended period of time, such as 20 years. The identification of the top-10 most optimal locations for various resolutions was altered only slightly upon consideration of flight costs as compared to considering only the ISRU factors; this indicates the insignificance of flight cost dependencies for the analysed case.
1 Introduction
The Moon and its currently unused resources hold great potential in terms of economics and development for the human presence. A large collaborative field study by Kornuta et al. (2019) showed that an undertaking of this magnitude is technologically feasible, which was presented in a commercial architecture. In contrast to Kornuta et al. (2019), who focus on the water ice in the permanently shadowed regions near the poles as the sources of hydrogen and oxygen via electrolysis, oxygen may also be obtained through extraction from regolith. This involves downsides as oxygen is only one component of the propellant and requires large machinery for regolith handling; however, the opportunities are vast as oxygen is abundantly available in regolith, with a combined weight percent of up to 45% as measured from the Apollo return samples (Papike et al., 1982). This oxygen is bonded to various elements, which is where an extraction method such as hydrogen reduction of ilmenite that focuses on a single specific bond is an effective procedure for processing. Therefore, propellant production need not be restricted to the polar regions, especially when a fully robotic in situ resource utilisation (ISRU) plant is feasible on the lunar surface without the requirement of life support systems and their water resources. Optimisation can therefore be based on the process factors to pick the most optimal location globally. Accordingly, the goal of this study was to identify the significance of two types of process factors, namely ISRU efficiency and transport efficiency. In the case where one of these influences is deemed insignificant, prioritisation is provided for future mission analyses for similar scenarios.
2 Materials and methods
The influences are determined using an example scenario in which both the ISRU hardware costs and flight costs can be combined within a joint model, through which comparisons may be drawn using the mass costs as the central unit. The example scenario comprises an ISRU oxygen plant on the lunar surface and an orbital fuel depot to which a comparable launcher delivers and consumes the produced oxygen, while the consumed hydrogen is supplied externally.
2.1 ISRU efficiency
When the optimal location is chosen on the basis of the highest ISRU efficiency, the entire production line has to be inspected first for location-dependent factors. These factors include raw material concentration, solar irradiance, temperature, flat surface conditions, and further scenic requirements. Here, the production method is decisively sensitive to the location-dependent factors. One of the prominent extraction methods used is the hydrogen reduction of ilmenite, as already been demonstrated by Sargeant et al. (2020). In this process, the chemical bonds of FeTiO3 are broken down by hydrogen, as shown in Eq. (1); the resulting water is then electrolysed, from which the hydrogen is fed back so that the net reaction leaves pure oxygen.
Hydrogen reduction of ilmenite is chosen as the production method for analysis, which is expected to have high dependency on the raw material concentration; therefore, there is strong location dependency owing to the inhomogeneity of ilmenite distribution. An alternative extraction method would be molten regolith electrolysis as regolith distribution is mostly invariant over the lunar surface; this is why all results presented here are applicable only to the chosen production method.
2.1.1 Model
To reduce complexity, the model includes only the raw material concentration factor as the argument, i.e., the ilmenite weight ratio wilmenite. While this does not cover all influences, the raw material concentration accounts for a major part of the location dependency and therefore serves as an approximation to a full location-dependent model of the hydrogen reduction of ilmenite. The hardware mass that has to be moved to the lunar surface for ISRU operation serves as the criterion to be minimised. In a previous work by Guerrero-Gonzalez and Zabel (2023), this hardware mass mhardware dependent on ilmenite concentration was determined for a combined plant producing low-carbon steel and oxygen. This production plant was sized for an annual output of 23.9 t of oxygen and 25 t of low-carbon steel. The model comprises several subsystems, as defined in Eq. (2) (Guerrero-Gonzalez and Zabel, 2023). These subsystems entail all the processing steps of the infrastructure required to extract metals as well as oxygen from lunar regolith. The power law equations are then the fitted results of sensitivity analysis, so that the size of a given subsystem can be estimated to be explicitly dependent on the input parameter wilmenite, i.e., weight percent (wt%) of ilmenite concentration.
In the proposed scenario, only oxygen production is relevant, and the additional subsystems for metal processing are scaled similar to the rest of the system such that the spread between the low and high values of wilmenite is not distorted significantly (88.69% spread to the maximum value vs. 89.97% spread without metal processing, for 1 wt% ≤ wilmenite ≤ 11 wt%). Furthermore, this combined production plant may still be a viable choice for the synergistic effects of shared infrastructure. This is the reason for choosing the present model as the reference production plant in its entirety rather than trimming the subsystems. Therefore, the proposed model is expressed using Eq. (2) as well.
2.1.2 Data processing
To determine the cost for each location on the Moon, a global lunar map of ilmenite weight ratio is required. In a previous work, Sato et al. (2017) created an almost global TiO2 abundance map, where the values of the wt% for TiO2 are used as equivalents for ilmenite. The resulting map has an applied mask leaving out only the lunar Mare regions, with limited latitude coverage from −70° to 70°. The coverage limit originates from the orbiter sensor data and its limitations when measuring at increasingly steep sunlight irradiation angles towards the poles. The initial data were obtained using the Lunar Reconnaissance Orbiter Camera (LROC) wide-angle camera (WAC), which is the starting point for recreating a similar dataset as that used by Sato et al. (2017) but on a global scale. The original WAC data segments are joined together as shown in Figure 1.
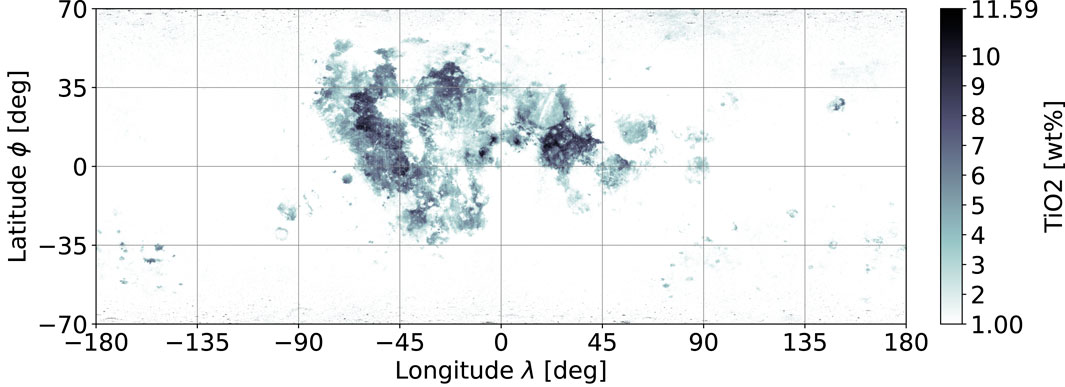
Figure 1. Combined original TiO2 data on the wide-access camera (WAC) (Sato et al., 2017).
2.1.2.1 Cleanup and estimation
The first problem with the acquired data is the unusually high measurements towards the poles that are considered as incremental noise scattered over the entire longitudinal axis. The second problem is incomplete coverage along the latitude and hence the poles themselves. To estimate the missing information along the latitudinal region, the following strategy is applied. If ilmenite abundance is correlated with the classification of the highlands/Mare regions and if the pole region geology features highland characteristics, then the expected values of the known highland regions serve as estimates of the ilmenite content at the poles.
As shown in Figure 2, the distribution characteristics of these two regions deviate considerably, where the average abundances also vary from 3.38 wt% in Mare to 1.1 wt% in the highland regions. Therefore, the ilmenite content correlation is given, and the estimates over the missing latitudinal areas of the highlands are set to 1 wt%; this matches with the original assumption of the WAC for values under the detection ratio. To remove the incremental noise at the extreme latitudes, a mask is created from the Mare boundaries as per the method of Nelson et al. (2014) and merged with a constant separation at ϕ = ±56°. The replacement values for the mask are set equally to 1 wt%. After applying both estimates, a low-noise global ilmenite map is obtained as shown in Figure 3.
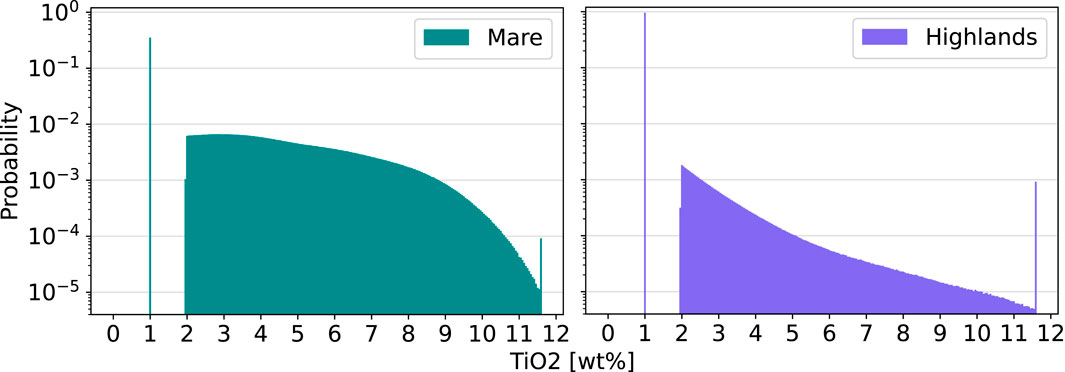
Figure 2. Distribution of ilmenite content clustered into the Mare and highland regions (equirectangular corrected) for the combined WAC data with Mare boundaries from Nelson et al. (2014).
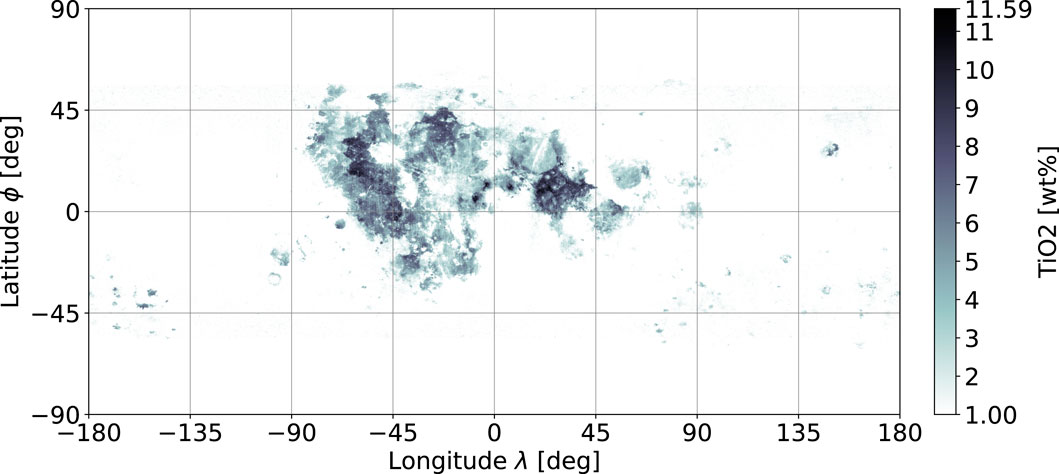
Figure 3. Global lunar ilmenite map in weight percent through TiO2 based on WAC data and estimates.
2.1.2.2 ISRU mass cost map
The global ilmenite abundance map of Figure 3 is now used as the input to Eq. (2), which results in the location-dependent ISRU hardware mass shown in Figure 4.
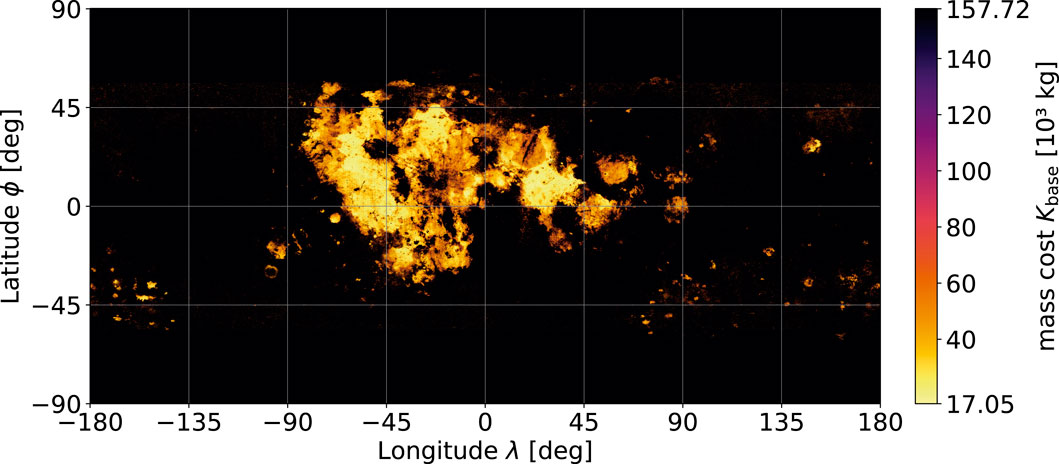
Figure 4. Location-dependent ISRU hardware mass cost Kbase in its base configuration of 23.9 t of oxygen annually.
2.2 Transport efficiency
2.2.1 Mission planning
The mission was designed to be carried out by a single-stage launcher that loops between the lunar surface and target orbit destination. The oxygen fuel component and oxygen payload are refilled on the lunar ground at the ISRU production plant. However, the hydrogen fuel component is refilled at the fuel depot to which the oxygen payload is delivered additionally. This hydrogen is supplied from a different process, where Earth is the assumed origin for the associated equivalent mass costs later on. This effectively results in exchange of the delivered oxygen to the deducted hydrogen from the station. A multi-stage launcher or a shuttle exchange system was neglected in this analysis but would potentially help increase the transport efficiency.
2.2.2 Orbital fuel depot location
The primary requirement for the fuel depot location is accessibility from both the supplying and consuming units. For an interplanetary or cis-lunar logistic hub near Earth, the liberation points are especially suitable, as considered in a previous study by Perrin and Casler (2016). Similar to the liberation points, their corresponding halo orbits also offer the benefit of accessibility. In the case of an interplanetary logistic hub near Earth, which is supplied by the lunar surface, the currently planned lunar gateway on its near-rectilinear halo orbit (NRHO) is a suitable fit as a theoretical test bed. An NRHO fuel depot was also considered in the commercial lunar propellant export study by Kornuta et al. (2019); this is why the lunar gateway orbit is chosen for analysis as the export destination and considered a fuel depot.
2.2.3 Target orbit
For the selected fuel depot location at the lunar gateway, the target orbit is a specific NRHO that is in a 9:2 lunar synodic resonance with an average perilune of hperi = 3557 km and average orbital period of T = 6.562 days (Lee, 2019). It is worth mentioning that this orbit has a variable polar crossing as well as other time-dependent changes in its trajectory that are often simplified to more static conditions during analyses (Whitley et al., 2018).
2.2.4 Delta-v estimation
First, regardless of the mission or the trajectory, the planetary conditions such as ground elevation and surface velocity influence the required Δv. These influences are briefly assessed for the Moon to determine their relevance.
2.2.4.1 Celestial influences
The initial radial distance to the Moon’s centre of mass r(ϕ, λ) influences the ideal Δv demand directly, as shown in Eq. (3), for ascent into a circular orbit at rorbit with standard gravity g0 and standard gravitational parameter μ.
The global ground elevation data are now used in the form of a displacement map (Wright and Petro, 2019), which originates from the Lunar Orbiter Laser Altimeter (LOLA) measurements (Smith, 2015). The elevation ranges from −9.115 km to 10.757 km with regard to the reference radius rref of 1737.4 km and therefore defines r(ϕ, λ) globally. The displacement map is shown in Figure 5.
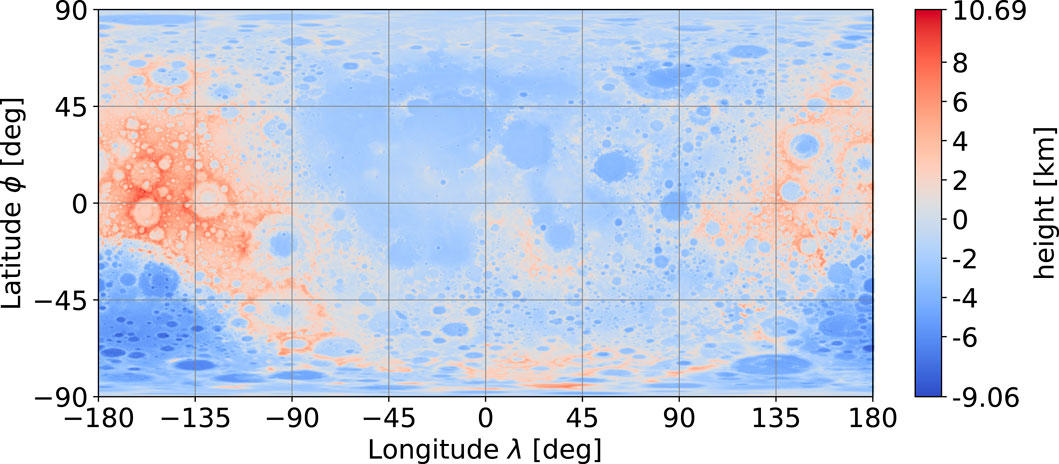
Figure 5. Lunar displacement map for reference radius (rref = 1737.4 km). Data from NASA CGI Kit (Wright and Petro, 2019) based on Smith (2015).
Evaluating the extreme values on a low lunar orbit (LLO) at 100 km altitude (rorbit = 1837.4 km) using Eq. (3) yields
The influence of ground elevation on Δv is therefore of the order of 0.001%, which is extremely low.
The second celestial influence, namely, the initial surface velocity v0, is either an additional Δv demand or a Δv reduction depending on the shared velocity components in the launch direction. Together with the sidereal rotation period and assumption of a spherical lunar surface of rref, the surface velocity can be derived as a function of the latitude ϕ, as displayed in Eq. (4).
Evaluating the extreme points of the polar and equatorial locations on Eq. (4) yields
Comparing this range |Δvmax| − Δvmin with the ascent from the reference radius to a circular LLO of 100 km as
2.2.4.2 Transfer options
Explicit transfer from any lunar geodetic point to an NRHO and vice versa entail a high-fidelity problem that is usually solved non-analytically, as in Trofimov et al. (2020). Additionally, there are multiple transfer strategies that can be deployed for different optimisation goals. Between optimisation of the required Δv and transfer time, two transfer options were analysed for the chosen scenario.
First, a long-duration transfer that features a very low required Δv of only 664.9
Oftentimes, a transfer time of 100 days is simply too long for certain applications as it may, for example, induce general system lag times and therefore poor dynamics in propellant delivery adjustments for the target missions. For this reason, a second transfer option is analysed as a direct transfer trajectory between the NRHO and surface as per Trofimov et al. (2020), featuring the shortest transfer time of only hours but at the cost of a higher Δv and greater location dependency. The direct transfer, illustrated in Figure 6, is the subject of the analyses hereafter and serves as a worst-case scenario for an NRHO transfer in terms of the location dependency.
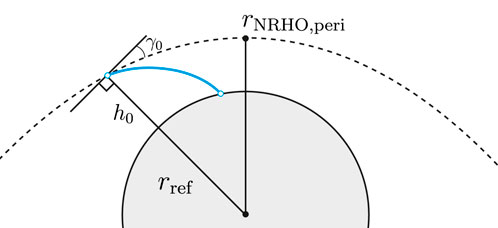
Figure 6. Direct descent trajectory scheme according to Trofimov et al. (2020).
2.2.4.3 Data processing
In the previous work by Trofimov et al. (2020), a set of possible direct descent trajectories and their associated landing points and Δv demand were identified. The resulting map of scatter points for the southern 9:2 NRHO was taken as the starting point to derive a global Δv map. As this result does not contain the solutions of the cheapest trajectory for each location but rather all the solutions for direct descent, the data points can have both low- and high-cost solutions for the same location. Since the lowest cost option of a location is chosen during mission planning, a minimum estimation is performed by splitting the map into 20° square tiles, where constancy is assumed and the lowest value is set for the entire tile. This tiling on an equirectangular projected map gives higher resolutions towards the poles causing the problem; accordingly, the solution coverage is so low in the southern polar region that only high-cost solutions are present in a tile even if the neighbouring tiles may feature low-cost solutions. To mitigate this, the data were removed from particular high-cost trajectories of
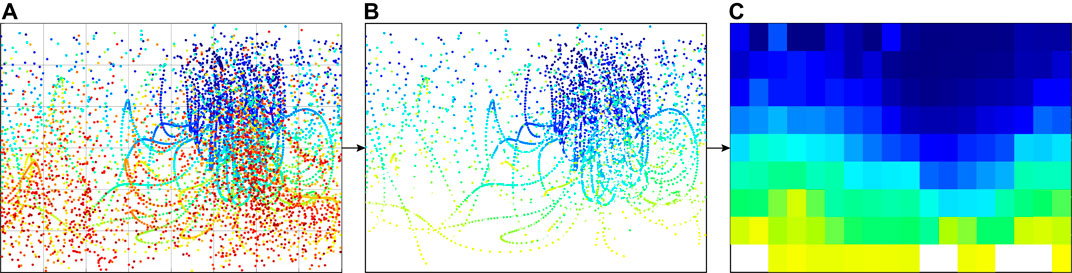
Figure 7. Processing of results from Trofimov et al. (2020) (A) to reduce data (B) into a minimum of 20° square tiles (C).
The non-defined tiles are estimated from their longitudinal neighbouring tiles via linear interpolation, which is only necessary in tiles at the southern polar region where there is already a higher geodetic resolution. This results in the final Δv map depicted in Figure 8.
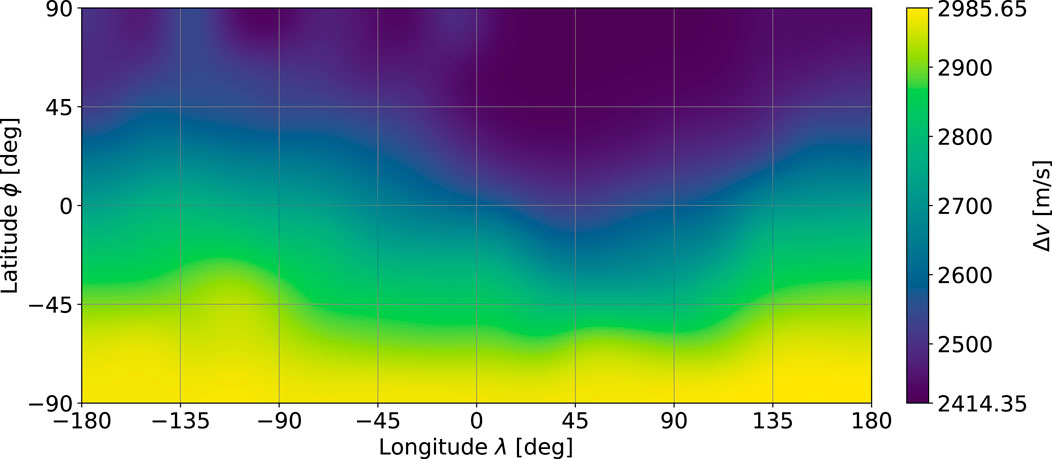
Figure 8. Required Δv for direct descent from the southern 9:2 near-rectilinear halo orbit (NRHO) to the lunar surface (bicubic interpolation).
2.2.4.4 Delta-v map
Even though the data in Figure 8 are computed for the descent only, they also serve as estimates for the ascent, which is biased because these problems are not entirely symmetric. Additionally, it should be mentioned that even though a
2.2.5 Transport carrier
2.2.5.1 Reference launcher
To derive the associated transport mass costs, the previously determined Δv has to be applied to a specific launcher. The Argonaut, formerly known as the European Large Logistics Lander (EL3), is chosen as a starting point for this scenario. Its initial configuration is based on the published information from the European Space Agency (2023) of wet mass of 10,000 kg, dry mass of 1,600 kg, and payload of 2,100 kg as of the time of writing this article. Additionally, a hydrogen and oxygen propulsion system with an oxidiser fuel ratio of 6 and a specific impulse of 400 s is assumed. When this original configuration is applied the proposed mission with Δvmax, the fuel is depleted before the round-trip can be completed. Therefore, the launcher configuration has to be altered according to the needs of the scenario.
2.2.5.2 Launcher upscaling
Launcher upscaling is performed by maintaining the dry mass constant at 1,600 kg but adding fuel until the mission can be completed. The minimal viable system features an empty H2 tank upon arrival at the gateway and an empty O2 tank at the lunar surface. The iteration scheme for upscaling is visualised in Figure 9, which can converge to a minimal viable launcher for any given payload. The iteration commences with an undersized launcher starting from the moon with “initial H2” as the amount of hydrogen in the tank at the lunar surface, “wet mass” that together with a constant dry mass indirectly represents the amount of oxygen in the tank on the lunar surface, and “refill H2” as the amount of hydrogen refuelled upon arrival at the lunar gateway. When Δv is applied to this simulated round-trip, the undersized launcher experiences one of the defined failure cases, which indicates a particular missing propellant at some point of the mission. “O2 empty” and “H2 empty” describe the depletion of the oxygen and hydrogen tanks during flight, which results in an increase of the desired propellant for the next iteration, at which point “O2 leftover” and “H2 leftover” trigger the analogue opposite. “H2 insufficient” is a less obvious failure case in which the launcher returns to the lunar surface but does not have enough hydrogen to perform the next round-trip run as it can only be refuelled at the lunar gateway and not on the ground. Owing to the fact that the launcher used in the iteration is undersized, the value of “refill H2” may be considered unidirectionally while still reaching convergence with a small enough increment of the propellant.
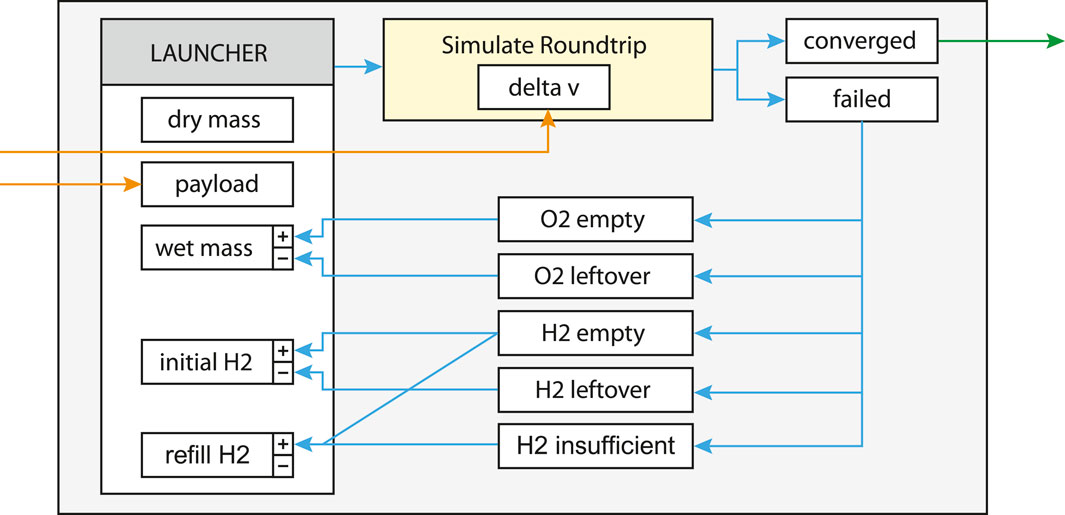
Figure 9. Launcher iteration scheme to converge a round-trip for a given payload and Δv.
Since this method of upscaling effectively increases the mass ratio
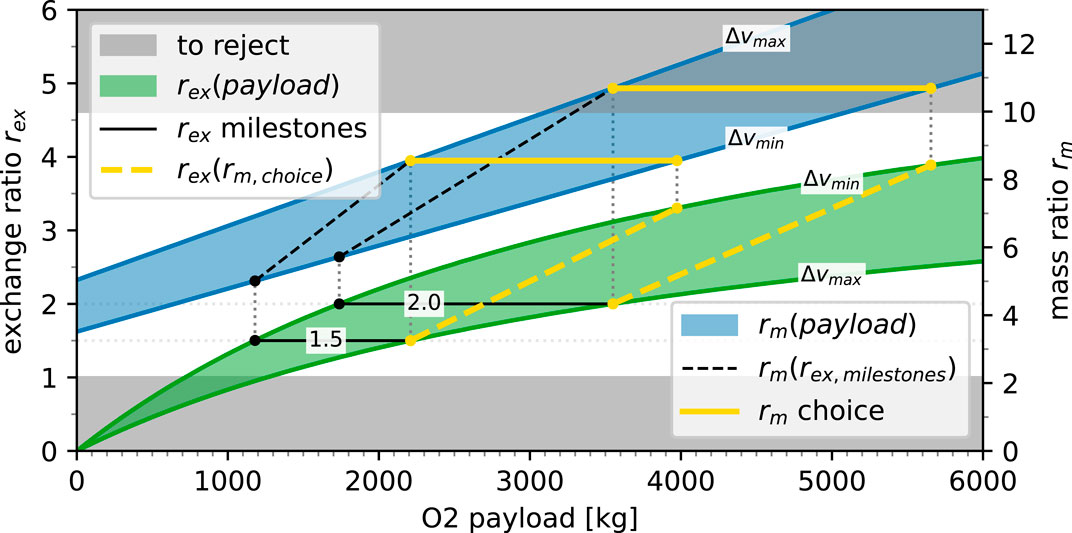
Figure 10. Exchange ratio rex and mass ratio rm depending on the payload size of the launcher over the Δv range.
Here, two sections are greyed out, where rex < 1 for economic reasonableness and rm > 10 as the soft border of the mass ratio for a realistic single-stage launcher. The chosen launcher frames were selected through a sequence of movements in the parameter space, starting with economically reasonable exchange ratios of 1.5 and 2.0 (solid black lines, also called milestones) that are then projected to their required mass ratios (dashed black lines). This currently holds a set of constant exchange ratios over the Δv range; however, to obtain comparable results, the mass ratio rm has to be constant over one set as it represents the efficiency of the launcher. Therefore, the maximum value of the mass ratio (at Δvmax) is maintained constant over the Δv range to yield the chosen frame for the mass ratio (solid yellow line). When this set is then back-projected onto the exchange ratio (yellow dashed line), a span of exchange ratios can be achieved over the Δv range.
This determines the two chosen frames (yellow lines) as
Analysing the problem on two frames with different mass ratios provides insights into the sensitivity towards more efficient launchers in general and their influences on location selection.
2.2.5.3 Spent fuel
Using another iteration scheme targeting the chosen mass ratio rm, a launcher can be converged for any Δv. The expended fuel is directly drawn from the simulated round-trip and normalised by the payload size, which can be combined into a direct mapping from the required Δv to spent fuel kFlight in kg per kg of the payload. This dependency can be seen in Figure 11 for both mass ratios rm = 8.6 and rm = 10.7. In this comparison, the higher mass ratio rm = 10.7 features a smaller absolute and relative growth, indicating that the differences in the spent fuel decrease with increasing launcher efficiencies.
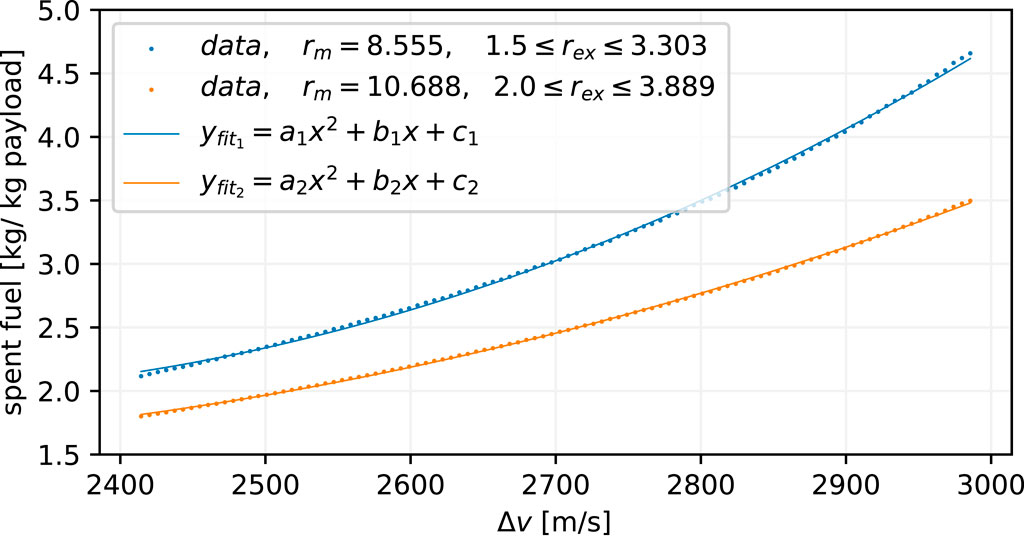
Figure 11. Relationship between required Δv and spent fuel kFlight for two mass ratios.
2.3 Joint model
2.3.1 Total cost modelling
When both the efficiency influences are combined, the comparable mass costs have to be drawn from the mission scenario. Rather than assuming all the expended fuel as the transport cost, the fuel components may be separated with the reason that oxygen is not shipped from the Earth but rather fully supplied by the ISRU facility.
2.3.1.1 Fix costs
To meet the additional demand for oxygen that the launcher requires for transport every year, the ISRU facility is upscaled linearly by its ISRU costs per kilogram oxygen kISRU for each location and corresponding fuel requirements. The scaling factor originates from the base configuration cost in Figure 4 and the annual base production of mbase = 23.9 t, which gives
2.3.1.2 Dynamic costs
The expended hydrogen is fully considered as a mass cost since it is retrieved from the lunar gateway depot and assumed to be delivered from Earth. Here, the cost levels of the lunar gateway and lunar surface are simplified to be equal to those from the Earth for comparability, which rather overestimates the cost of hydrogen compared to costs on the lunar surface when supplied from Earth. Therefore, the dynamic costs representing the mass of hydrogen supplied from the Earth to the lunar gateway every year t are determined through Eq. 6
2.3.1.3 Total costs
Combining both KFix and KDynamic, the final total costs of the mission over the location and time are
Applying Eq. (7) to the earlier location-dependent results gives the total cost maps for the mission time of 20 years for rm = 8.6 (Figure 12) and rm = 10.7 (Figure 13). In a direct comparison between Figures 12 and 13, the flight cost influence is visibly less pronounced for the higher mass ratio. Moreover, a reduced variation in the total mission cost is observed.
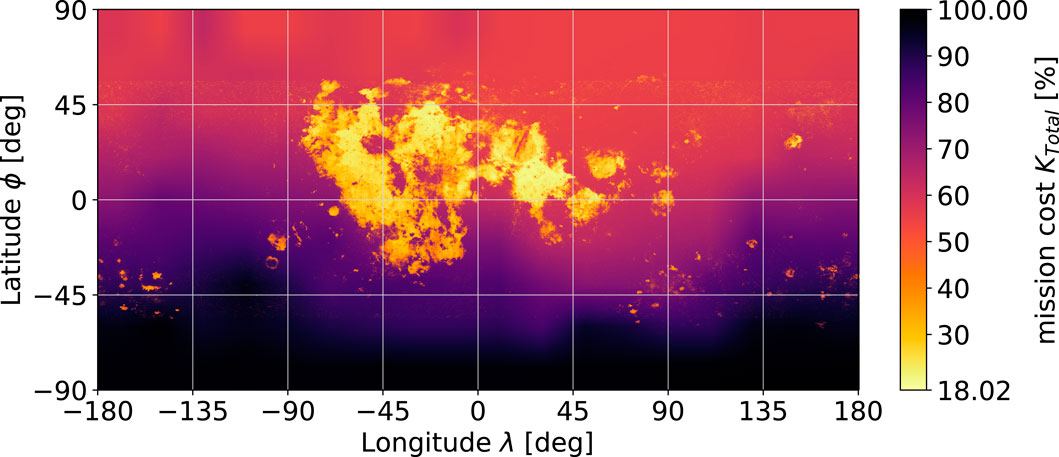
Figure 12. Location-dependent total mission cost KTotal in % for t = 20 years and rm = 8.6.
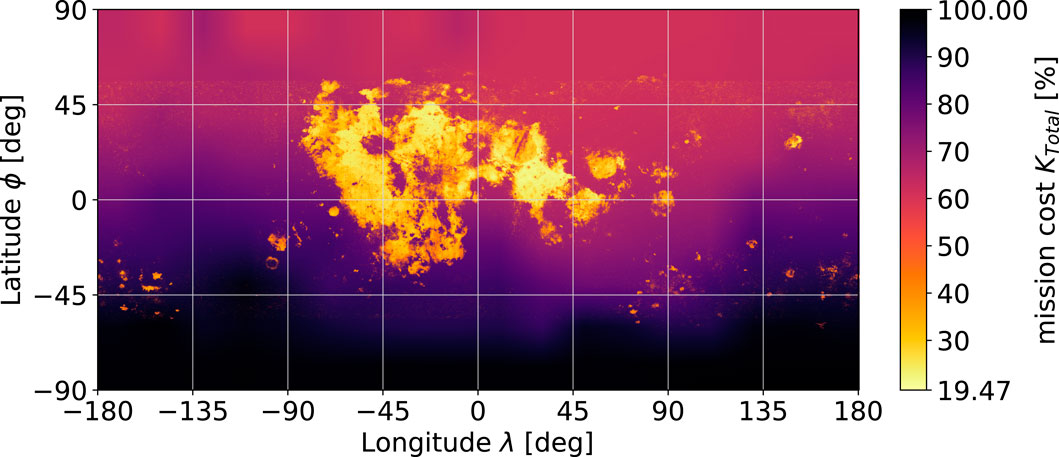
Figure 13. Location-dependent total mission cost KTotal in % for t = 20 years and rm = 10.7.
3 Results
3.1 Flight cost influences
In the case of availability of long-duration transfer (Section 2.2.4.2) for which location dependencies can be diminished almost completely as well as insignificant celestial influences (Section 2.2.4.1), the effects on mission location selection are eliminated by an assumable uniform Δv requirement.
Under only the short-duration transfer strategy of a direct descent, the location-dependent Δv requirements are prominent (Section 2.2.4.4), translating to a significant difference in the spent fuel (Section 2.2.5.3). However, under ISRU influence, ilmenite reduction introduces vast location dependencies (Section 2.1.2.2) that overshadow the differences in the spent fuel, resulting in a total cost dominated by ISRU features when both influences are combined (Section 2.3.1.3).
3.2 Flight cost insignificance
To provide insights into the errors induced when the flight costs are neglected completely, the best locations from the ISRU model (Section 2.1) are compared with the best locations from the joint model (Section 2.3). To limit the possible locations, the location-dependent results of both models are reduced to geodetic square tiles of 15°, 5°, and 1° (ϕ, λ) to compare the behaviours at multiple resolutions; the tiles Tϕ index,λ index were created by considering the pixel-area relation to yield index resolutions of 12 × 24, 36 × 72, and 180 × 360. From these tiles, the top-10 choices were ranked and compared for the models. The top-10 choices constitute the top 3.47% for the 15° tiles, top 0.39% for the 5° tiles, and top 0.015% for the 1° tiles. Table 1 shows these tiles that are colourised by the ranking of the ISRU model, with green being the most optimal to orange being the less optimal location, to provide a baseline for comparisons of the ordered and featured tiles. The joint model is also shown in the table in tree time steps of 0, 10, and 20 years, providing a sense of the temporal evolutions of the featured tiles.
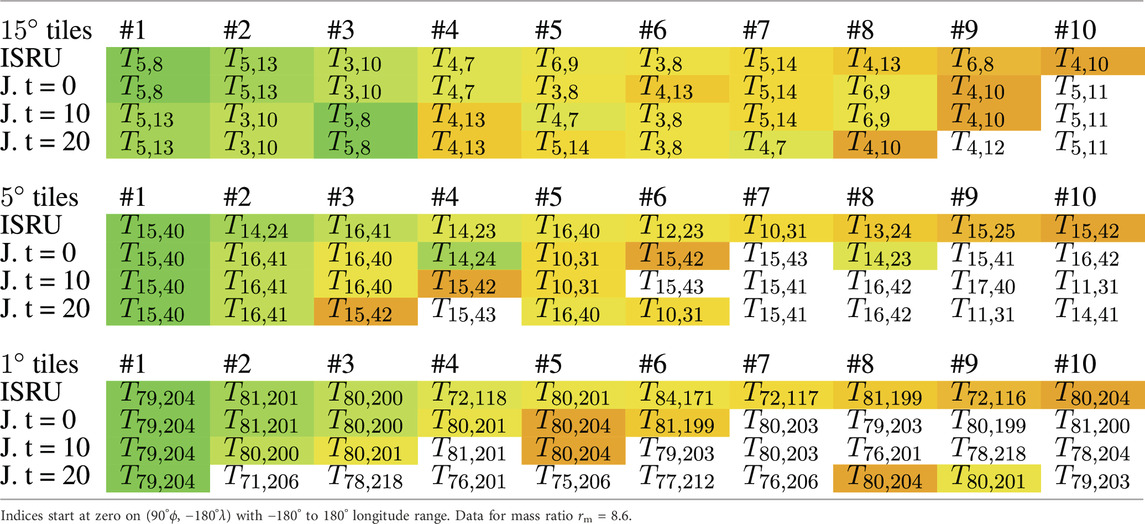
Table 1. Top-10 best mission locations compared between the ISRU and joint (J.) models after t years in pixel-area-relation-resized square tiles (Tϕ index,λ index), with resolutions ϕ, λ of 15° (top), 5° (middle), and 1° (bottom).
The induced errors of the flight cost neglect increases over the mission time; nevertheless, even for a long time span of 20 years, the top-10 choices of the joint model feature many tiles that are also in the top-10 choices based on ISRU ranking. The greater conservation of the highest ranked tiles can be explained by the coincidental overlap between low flight costs and low ISRU costs. At higher resolutions, fewer tiles are shared but the top-10 choices constitute the entire set given the differences in percentage, so the shared tiles remain substantial. Therefore, from Table 1, it is concluded that the induced errors during location selection are small enough that a simplification of considering only the ISRU effects may be valid even with larger differences in Δv, as in the analysed case.
4 Discussion
Identifying the features of secondary relevance and even neglecting the flight costs in the selected mission scenario cannot be generalised directly without considering the requirements because other ISRU production methods may be influenced by the target orbits, trajectories, or mass ratios, which may differ greatly from those in the present analysis.
However, given the case of ilmenite reduction and transport properties that are comparable to or weaker than those of the analysed case, the flight cost differences can be assumed to be insignificant. In particular, the major influence that can be verified by a quick assessment of a general case involves estimating the difference in Δv requirements, which should be less than that of the analysed case, i.e.,
Although the significant difference in the accessibility of the southern hemisphere is a result of the direct descent trajectory, it must be noted that this does not imply worse accessibility from the NRHO to the southern hemisphere in general. In the chosen set of trajectories, no options were considered for intermediate parking orbits that could reduce the differences between the northern and southern hemispheres, as seen from the 1-day transfer reported by May et al. (2020) that shows entirely different characteristics.
As global lunar data are increasingly available, problems as these can be analysed and optimised close to their entirety over the entire lunar surface. In particular, when infrastructure is yet to be deployed on the lunar surface at this point in time, location selection can be performed by optimisation instead of dependencies on prior infrastructure.
To avoid a prior infrastructure restriction, the plan for mankind’s presence, economics, and even sustainability on the Moon should be expanded and considered from the perspective of greater scope as much as possible. As an oxygen propellant facility is just one entity in an economics network, its most optimal location may move away completely from its presently analysed location under a larger context. Such a large-scale technical investigation would also make for a compelling future study.
Data availability statement
The original contributions presented in the study are included in the article/supplementary material; further inquiries can be directed to the corresponding author.
Author contributions
SS: data curation, formal analysis, investigation, methodology, resources, software, visualization, and writing–original draft. PZ: conceptualization, funding acquisition, supervision, and writing–review and editing. DQ: writing–review and editing.
Funding
The authors declare that financial support was received for the research, authorship, and/or publication of this article. The publication fees are covered by the publication fund of the German Aerospace Center (DLR) in support of open access publishing.
Conflict of interest
The authors declare that the research was conducted in the absence of any commercial or financial relationships that could be construed as a potential conflict of interest.
Publisher’s note
All claims expressed in this article are solely those of the authors and do not necessarily represent those of their affiliated organizations, or those of the publisher, the editors, and the reviewers. Any product that may be evaluated in this article, or claim that may be made by its manufacturer, is not guaranteed or endorsed by the publisher.
References
European Space Agency (2023). Argonaut - technical details. Available at: https://www.esa.int/Science_Exploration/Human_and_Robotic_Exploration/Exploration/Argonaut.
Guerrero-Gonzalez, F. J., and Zabel, P. (2023). System analysis of an ISRU production plant: extraction of metals and oxygen from lunar regolith. Acta Astronaut. 203, 187–201. doi:10.1016/j.actaastro.2022.11.050
Kornuta, D., Abbud-Madrid, A., Atkinson, J., Barr, J., Barnhard, G., Bienhoff, D., et al. (2019). Commercial lunar propellant architecture: a collaborative study of lunar propellant production. REACH 13, 100026. doi:10.1016/j.reach.2019.100026
Lee, D. E. (2019). White paper: Gateway destination orbit model: a continuous 15 year nrho reference trajectory (National Aeronautics and Space Administration (NASA)). Tech. Rep. Doc. ID 20190030294.
May, Z. D., Qu, M., and Merrill, R. (2020). “Enabling global lunar access for human landing systems staged at earth-moon l2 southern near rectilinear halo and butterfly orbits,” in AIAA scitech 2020 forum (America: American Institute of Aeronautics and Astronautics). doi:10.2514/6.2020-0962
Nelson, D. M., Koeber, S. D., Daud, K., Robinson, M. S., Watters, T. R., Banks, M. E., et al. (2014). Mapping lunar maria extents and lobate scarps using lroc image products. Lunar Planet. Sci. 45, 2861.
Papike, J. J., Simon, S. B., and Laul, J. C. (1982). The lunar regolith: chemistry, mineralogy, and petrology. Rev. Geophys. 20, 761–826. doi:10.1029/RG020i004p00761
Perrin, T. M., and Casler, J. G. (2016). “Architecture study for a fuel depot supplied from lunar resources,” in Aiaa space 2016 (America: American Institute of Aeronautics and Astronautics). doi:10.2514/6.2016-5306
Sargeant, H., Abernethy, F., Barber, S., Wright, I., Anand, M., Sheridan, S., et al. (2020). Hydrogen reduction of ilmenite: towards an in situ resource utilization demonstration on the surface of the moon. Planet. Space Sci. 180, 104751. doi:10.1016/j.pss.2019.104751
Sato, H., Robinson, M. S., Lawrence, S. J., Denevi, B. W., Hapke, B., Jolliff, B. L., et al. (2017). Lunar mare tio 2 abundances estimated from uv/vis reflectance. Icarus 296, 216–238. doi:10.1016/j.icarus.2017.06.013
Smith, D. E. (2015). 2009 lunar orbiter laser altimeter radiometry data set, lro-l-lola-3-radr-v1.0. doi:10.17189/1520639
Trofimov, S., Shirobokov, M., Tselousova, A., and Ovchinnikov, M. (2020). Transfers from near-rectilinear halo orbits to low-perilune orbits and the moon’s surface. Acta Astronaut. 167, 260–271. doi:10.1016/j.actaastro.2019.10.049
Whitley, R., Davis, D., Burke, L., McCarthy, B., Power, R., McGuire, M., et al. (2018). Earth-moon near rectilinear halo and butterfly orbits for lunar surface exploration
Wright, E., and Petro, N. (2019). SVS: CGI moon Kit — svs. Available at: https://svs.gsfc.nasa.gov/4720.
Keywords: in situ resource utilisation, orbital fuel depot, delta-v map, lunar outpost, location selection, ilmenite reduction, lunar gateway, near-rectilinear halo orbit
Citation: Steinert SJ, Zabel P and Quantius D (2024) Location-dependent flight cost difference from the lunar surface to an orbital fuel depot and its influence on in situ resource utilisation location selection. Front. Space Technol. 5:1352213. doi: 10.3389/frspt.2024.1352213
Received: 07 December 2023; Accepted: 19 February 2024;
Published: 29 May 2024.
Edited by:
Yue Wang, Beihang University, ChinaReviewed by:
Shuhao Cui, Beihang University, ChinaLuiz S. Martins-Filho, Federal University of ABC, Brazil
Copyright © 2024 Steinert, Zabel and Quantius. This is an open-access article distributed under the terms of the Creative Commons Attribution License (CC BY). The use, distribution or reproduction in other forums is permitted, provided the original author(s) and the copyright owner(s) are credited and that the original publication in this journal is cited, in accordance with accepted academic practice. No use, distribution or reproduction is permitted which does not comply with these terms.
*Correspondence: Sven J. Steinert, c3Zlbi5qdWxpdXMuc3RlaW5lcnRAb3V0bG9vay5jb20=