 Christian Gscheidle
 Thilo Witzel
 Alexander Smolka
 Philipp Reiss
94% of researchers rate our articles as excellent or good
Learn more about the work of our research integrity team to safeguard the quality of each article we publish.
Find out more
ORIGINAL RESEARCH article
Front. Space Technol., 10 January 2024
Sec. Space Exploration
Volume 4 - 2023 | https://doi.org/10.3389/frspt.2023.1303180
This article is part of the Research TopicTechnologies for Prospecting, Extraction, and Utilization of Space ResourcesView all 11 articles
Permittivity sensors measure the electric permittivity (formerly known as the dielectric constant) of a sample between its electrodes and offer a reliable method to characterize the subsurface of planetary bodies in situ. One potential application is the identification and mapping of water ice at the poles of the Moon. In this paper, the scientific background and heritage of the permittivity sensor concept are discussed, and the implemented electronic architecture is introduced, focusing on the novel patch electrodes. The data processing approach for the measurements is based on Fourier transformation, and numerical simulation setups are used for performance predictions. The calibration of the sensor validates the functionality of the electronics, and the results from both simulations and characterization experiments show that the concept is applicable in the exploration scenario. Considering both engineering and scientific aspects, the results highlight the permittivity sensor’s suitability for lunar and planetary exploration missions, albeit further points for improvement are identified.
With the renaissance of human exploration beyond low Earth orbit, in situ resource utilization becomes highly relevant as it enables sustainable, long-duration missions by drastically reducing their cost. Regolith and cold-trapped volatiles in permanently shadowed regions (PSRs) at the lunar poles or on other planetary objects are potential resources for human exploration; however, their nature is not well understood yet. Precise knowledge of the density, porosity, and composition of the lunar regolith, as well as the distribution, abundance, and physical state of volatiles, is crucial for planning future missions to the Moon and beyond. The data obtained from numerous remote sensing missions around the Moon have provided evidence for large reserves of water or water-equivalent hydrogen (Colaprete et al., 2010; Li and Milliken, 2017). Nevertheless, ground truth data for model verification and correlation from the lunar poles are missing (European Space Agency, 2019). Although upcoming exploration missions, such as the National Aeronautics and Space Administration’s (NASA) Volatiles Investigating Polar Exploration Rover (VIPER) (Andrews, 2022) and the European Space Agency’s (ESA) Package for Resource Observation and in Situ Prospecting for Exploration, Commercial exploitation and Transportation (PROSPECT) instrument on a commercial lander (Fisackerly et al., 2023), will hopefully improve ground truth data availability, a broader coverage and finer spatial resolution are still necessary (Lucey et al., 2021).
In this context, measuring the regolith’s electric properties (conductivity and permittivity) is a relatively simple and scientifically valuable technique to quickly determine the state and abundance of water ice and characterize the geotechnical properties of the subsurface. The implementation of such a sensor considered in this work consists of an electronics unit with two electrodes between which the sample is located. The material through which the electric field propagates (a mixture including regolith and volatiles) acts as a dielectric and influences the effective capacitance between the electrodes. The sensor measures potentials and/or currents over the capacitive element in a resistive–capacitive (RC) circuit. The circuit is excited in a frequency range relevant to the specific investigation, typically ranging from a few Hz (extremely low frequency (ELF)) to several kHz. In this study, frequencies ranging from 6.25 Hz to 10 kHz were investigated. With known resistance and excitation potential, the capacitance can be inferred, and the properties of the sample can be deduced.
The physical phenomenon exploited by the proposed permittivity sensor is that water, regolith, and vacuum have distinct relative electrical permittivity ɛr (electric permittivity normalized by vacuum’s electric permittivity ɛr = ɛ/ɛ0 with ɛ0 = 8.854 × 10⁻¹² F/m), both in magnitude and in the frequency domain. At low frequencies, water has a distinct electric permittivity curve over frequency, which drops approximately from 100 to 3 at approximately 3 kHz, depending on the temperature (Lethuillier, 2016). Dry lunar regolith has a comparably low relative permittivity of 3.5 and a very low electrical conductivity (Heiken et al., 1991). Vacuum has, by definition, a relative permittivity of 1. By measuring the capacitance of a system, which is a function of the constituents’ individual permittivities (C = f (ɛr)), and calculating the effective relative permittivity for various frequencies, the values can be fitted to previously determined (non-linear) mixing models to infer porosity and water content.
Several successful missions to celestial bodies have shown the usefulness of permittivity probes. The Huygens Atmospheric Structure Instrument–Permittivity and Electromagnetic Wave Analyzer (HASI-PWA) instrument on the Huygens lander of NASA’s Cassini–Huygens mission monitored Titan’s atmosphere using a mutual impedance probe (Grard et al., 1995; Fulchignoni et al., 2002). The Thermal and Electrical Conductivity Probe (TECP) on NASA’s Phoenix lander was designed to measure temperatures and detect water at the polar caps of Mars using electrical measurements (Zent et al., 2009). The instrument “successfully measured the thermal and electrical properties of the martian regolith at the Phoenix site” (Zent et al., 2010, p.21). The Surface Electric Sounding and Acoustic Monitoring Experiment–Permittivity Probe (SESAME-PP) instrument on the Philae lander of ESA’s Rosetta featured a mutual impedance probe (Seidensticker et al., 2007). Although the landing was not nominal, the SESAME-PP was able to return valuable scientific data using its impedance spectroscopy probe (Lethuillier et al., 2016).
ESA’s upcoming PROSPECT instrument package “includes a miniaturized sensor for measuring the dielectric constant of lunar subsurface materials by means of low-frequency alternating currents injected into the regolith” (Trautner et al., 2021, p.1). The sensor electrode and its front-end electronics are integrated into the ProSEED drill element of PROSPECT. It can be inserted into the subsurface to a depth of up to 60 cm (Trautner et al., 2021) and constrain the radial distribution of volatiles in the borehole at the electrode’s depth. However, due to the mission configuration using a lander, the sensor is constrained to measurements at a single location.
Other concepts for permittivity sensors have been proposed, for example, for usage on Mars by Trautner et al. (2003) or on the Moon by Nurge (2012). A permittivity probe, initially planned to be part of the Heat Flow and Physical Properties Package (HP3) (Kargl et al., 2011), was developed and tested up to a technology readiness level 5 before the mission was terminated (Stiegler, 2011).
The novel permittivity sensor concept developed at the Technical University of Munich (TUM) and described in this paper implements an approach with the electrodes being arranged in a flat configuration, called the patch electrode, as shown in Figure 1A. This configuration enables applications in several mission scenarios and opens new design choices for flexible integration and operation.
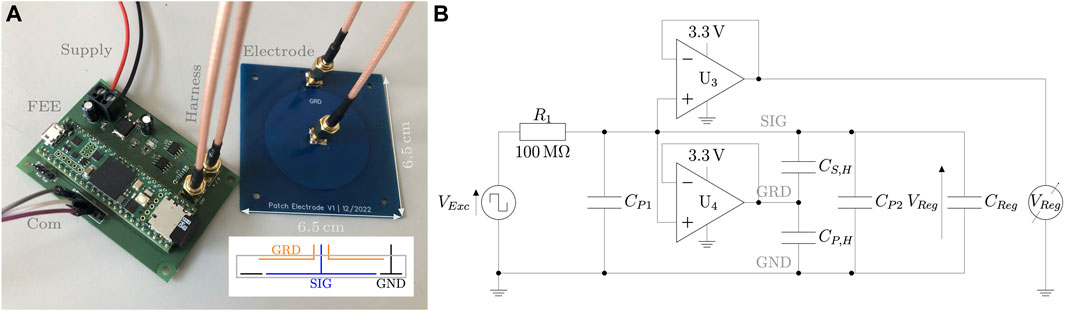
FIGURE 1. Patch electrode and electronics investigated in this study. (A) Picture of the patch electrode with a custom electronics board and annotations of major elements. The inset depicts the schematic cross section of the electrode. (B) Schematic of the sensor electronics with parasitic capacitances denoted with subscript P.
The sensor concept relies on an electrode connected to a custom front-end electronics (FEE), which can be controlled by a generic back-end electronics unit. In contrast to a frequency-sweeping approach, measurements are performed in the time domain and then transformed into the frequency domain.
Figure 1A depicts both a patch electrode prototype and combined front-end and back-end electronics implemented onto a printed circuit board.
The electronics configuration for the sensor in this study is based on an RC circuit. In the sensor schematic, depicted in Figure 1B, measurement resistor R1 and sample capacitance Creg form the central RC circuit. Capacitors CP1 and CP2 model parasitic capacitance in the electronics and electrode, respectively. CS,H and CP,H describe capacitances of the harness between the electronics and the electrode. Operational amplifier U3 functions as a high differential impedance buffer stage
Figure 2 shows the measurement procedure in the upper part. The excitation signal VExc is generated by the controlling unit with a commercial micro-controller (Teensy 4.1). For future mission developments, however, a dedicated sensor, front-end electronics, and the central processing unit are intended to be used. Its square wave character is generated by switching an output channel on and off using the internal clock of the micro-controller. Switching the excitation voltage programmatically via software has the advantage of being able to adjust the sensor resolution during a mission. As switching and read-out are performed at frequencies
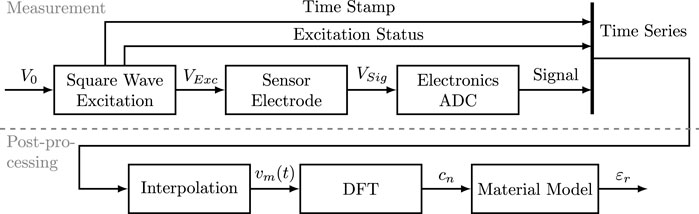
FIGURE 2. Measurement and post-processing approach: the permittivity sensor measures a time series, which is then post-processed.
The measurement of signal voltage at the capacitive sensor is performed by the back-end electronics with an adjustable frequency, and thus VSig = VReg. The current baseline is 20 kHz, enabling a frequency of up to 10 kHz in the final spectrum when considering the Nyquist–Shannon criterion. The analog-to-digital converter (ADC) is set to 12-bit measurements. Along with each voltage reading, the time since the start of the measurement and the binary status of the excitation output are recorded. This setup results in 4 bytes per measurement with significant optimization and compression potential.
The prototype electrode investigated is a flat, rectangular, two-layer printed circuit board with a signal, ground, and guard electrode. The side length is 6.5 cm, and the total system weight is 18 g. Albeit the sensor needs no direct contact with the soil, it must be in close proximity, as the electric field quickly weakens with distance. Therefore, the electronics can be accommodated separately from the electrode with a shielded harness connecting these two elements, for example, in an individual electronics box or combined with the platform electronics. Qualitatively, a gap between the electrode and the soil is detrimental to the sensor’s performance, for instance, if it is placed on rough surfaces. The quantitative influence still needs to be investigated. Thus, the sensor should ideally be placed in contact with a flat surface in parallel.
The sensor measures a time series of capacitor voltage and excitation status. However, the concept is based on frequency-dependent information, and frequency information has to be extracted from the time series using its Fourier transform. Figure 2 shows the data processing approach in the bottom part. The coefficients for the complex Fourier transform of the square wave excitation signal VExc (with base frequency fB) are provided in Eq. 1:
with n being the dimensionless harmonics iterator and V0 being the excitation voltage magnitude. Note that the coefficient’s magnitude does not depend on the base frequency.
Applying Kirchhoff’s circuit laws to the measurement loop (assuming no current flows through operational amplifiers and therefore negligible parasitic capacitances), the complex voltage across the capacitive element is determined as follows:
By applying the complex Fourier transform to the excitation signal, the Fourier coefficients of the ideal signal voltage can be obtained by substituting them into Eq. 2, and they are expressed in Eq. 3.
All even, non-zero coefficients disappear, and the magnitude of all odd coefficients decreases with increasing frequency. The ideal, predicted signal time series can be reconstructed by the summation of (infinitely) many Fourier coefficients. Additionally, the dependence of the capacitance on the frequency is visible in the signal’s Fourier coefficients.
The measurement’s (discrete) Fourier coefficients can analogously be found by applying the discrete Fourier transform (DFT) to the measured time series (Brunton and Kutz, 2022). This returns coefficients at discrete values, and a properly chosen base frequency is a multiple of the Fourier frequency, allowing for a simplified further analysis. The FFTW-Julia library was used to calculate the coefficients in the signal analysis (Frigo and Johnson, 2005). For noise reduction in the measured signal, especially reduced frequency jitter, the raw time series was interpolated onto a regularly spaced time vector with identical intervals compared to the sampling intervals using a linear scheme. After the transformation, the Fourier coefficients at the non-zero harmonics were selectively analyzed, equaling a Fourier filtering technique.
The capacitance values for a given frequency can then be obtained by solving Eq. 4 using the value of the complex Fourier coefficients and taking the real part of the result.
Numerically, the difference between the magnitudes of coefficients was minimized with respect to the given frequency f to determine the capacitance (min (|cn,measured(f)| − |cn,Sig (C, f)|)).
Additionally, a mixing rule is necessary to model the effective electric permittivity of mixtures depending on their composition and subsequently deduce the content of water. Sihvola (2000) listed multiple approaches to describe this highly non-linear phenomenon. In this study, a power law mixing rule with coefficients of 1/3, also known as the Looyenga formula, has been used:
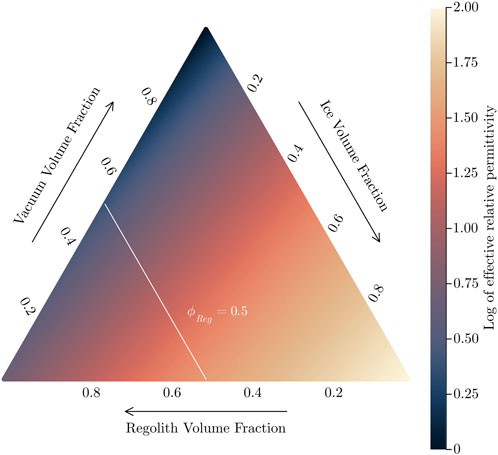
FIGURE 3. Exemplary representation of the used power law mixing rule (Log10-scaling) illustrating the dependence of the relative permittivity on the volume share of the three considered components at −20°C. A constant regolith volume share of 0.5 is highlighted.
Experiments were conducted to calibrate and characterize the sensor both with known capacitances and mixtures imitating lunar soil with various amounts of water. Generic quartz sand and lunar regolith simulant (JSC-1A) were used to mimic lunar regolith in the experiments. The electrode was placed parallel to the surface with no gap between the sample and the electrode by holding it down. The samples were large enough with a thickness of at least 10 cm to minimize boundary effects. Considering the experiments with JSC-1A, the sample was not intentionally compressed, resulting in a measured porosity of approximately 0.5. In the calibration of the electronics, generic ceramic capacitors ranging from open circuit to 220 pF with 10% uncertainty were used. The characterization experiments used the patch electrode, as shown in Figure 1.
The switching frequency was set to 12.5 Hz, with sampling occurring at 20 kHz, and the measurement duration was 2 s (note that these values were chosen based on initial tests and can be optimized). One measurement consisted of the elapsed time in µs since the measurement start, the (binary) excitation state, and the signal voltage from ADC, resulting in a 570-kbyte file. The measurements were conducted under atmospheric pressure, as air and vacuum have very similar relative permittivity (Haynes et al., 2016), and no phase transition for water is expected. The temperature of the setup ranged from −40°C to 40°C. Each measurement was repeated five times to show reproducibility and for statistical evaluation.
A COMSOL multi-physics model was developed to predict the electric characteristics of the sensor because no simple analytic formula exists for the proposed geometry. As the investigated patch electrode is rotational symmetric, a 2D simulation with rotational symmetry was used with zero-charge boundary conditions far away from the electrode so that the domain size did not influence the simulation. Generally, the simulation can return data on expected overall capacitances and subsurface field geometry. Both quantities are crucial for designing sufficient electronics and scaling the electrode. First, the maximum capacitance mainly influences the selection of an appropriate measurement resistor (R1 in Figure 1B). A too small or too large resistor would make meaningful sensor readings impossible, as the circuit’s time constant would be too dissimilar to the sampling period. Second, the field geometry influences the sensor’s sensing depth and its scientific potential. Therefore, one major application of the simulation is the analysis of the depth to which the sensor is able to sense and characterize the subsurface. This sensing depth was taken to be the depth at which the electric potential is reduced to 10% of its maximum value directly below the center of the electrode (r = 0 mm).
Additionally, a COMSOL multi-physics model with coupled heat and mass transfer and superposed electrical field simulations is under development based on the model by Reiss (2018) and adapted to 2D domains and depth-dependent properties. This model is necessary to analyze the sensor’s behavior in changing environments, as demonstrated in Gscheidle et al. (2022). Here, changes in temperature release volatiles and thus change the electric permittivity. Analysis of these changes in capacitance reveals changes in subsurface composition over time, which is especially valuable for applications on a lander as the conditions change over time and not spatially.
Furthermore, a generic Simulation Program with Integrated Circuit Emphasis (SPICE) model with a circuit, as shown in Figure 1, has been used to analyze internal electric characteristics of the sensor. The model includes realistic properties of all components supplied by the manufacturer, and the necessary input currents and internal parasitic effects of these components can be analyzed.
Materials used for the characterization of the sensor are listed in Table 1. For reference, expected values of lunar soil are also provided.
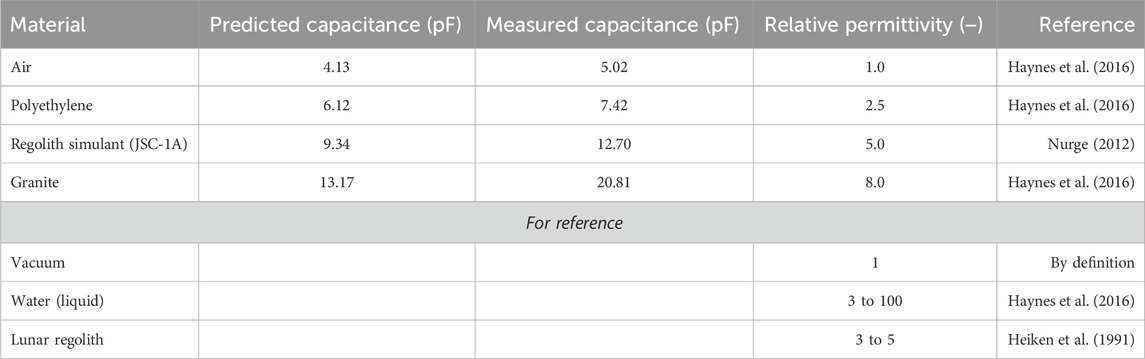
TABLE 1. Materials used in the experiments and predictions for these setups from simulation. References refer to the relative permittivity values.
Figure 4 shows the results of the calibration experiments with capacitances of 0 pF, 10 pF, 100 pF, and 220 pF. The capacitances of test capacitors were assumed to be constant over the investigated frequency domain, and 10% nominal uncertainty is displayed. The linear fit with unity slope (r2 = 0.997) returns a parasitic capacitance of 8.565 pF for the electronics board.
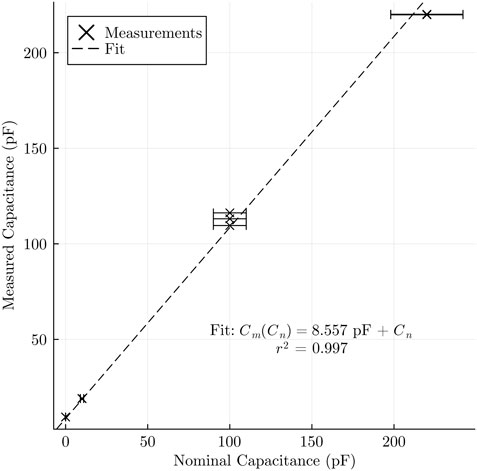
FIGURE 4. Correlation of measured over nominal capacitance for the electronics calibration.
Figure 5 shows the result of the electrical simulations performed for the patch electrodes. The electric potential decreases with depth and distance from the signal electrode. Furthermore, the influence of the guard electrode is visible as the potential between the signal and guard electrode is constant, meaning that no charge is stored in this capacitance. The subplot in Figure 5 shows the decline in the electric potential with depth at the rotational axis for the evaluation of the sensing depth. The patch electrode with an electrode diameter of 60 mm has a sensing depth of 5 cm. In general, an increase in the electrode size results in an increase in sensing depth while also increasing the sensor electrode mass.
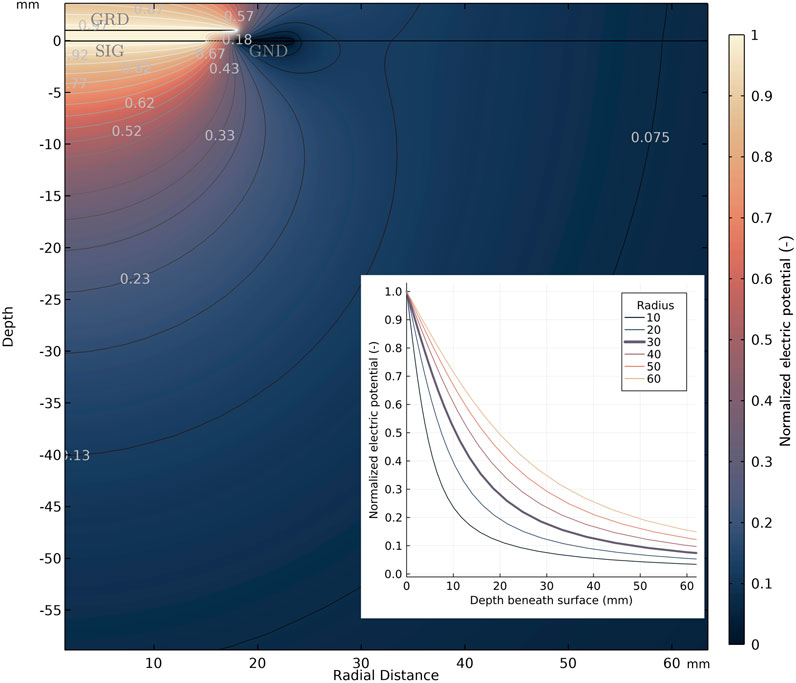
FIGURE 5. Simulated electric field normalized to its maximum excitation voltage (3.3 V) for the patch electrode (30 mm outer radius) from COMSOL simulations. The subplot shows the decline in the electric potential over depth at the central axis (r = 0 mm) for different electrode radii (in mm) used in the sensing depth analysis. The bold line corresponds to the depicted field.
In Table 1, predicted capacitances between the signal and ground electrodes are listed based on the assumed relative permittivities of the samples. The predicted capacitances increase, and the offset for vacuum is in a reasonable range when compared to analytical models with similar characteristics, such as size and basic geometry, without the guard electrode. Predicted and measured capacitances have a correlation coefficient of 0.992.
Based on parameter studies using the simulation, the expected sensing depth increases with an increase in the electrode size, accompanied by a simultaneous increase in the expected capacitance. This correlation is in accordance with the large sensing volume of mutual impedance probes due to their spatially separated electrodes. Practically, no dependence of sensing depth on relative permittivity was observed with the current setup. However, this is expected to change once additional layers are added, for example, an air gap between regolith and electrode or an electrode protection layer.
Figure 6 shows the results of the characterization experiments. Raw measurements are shown in Figure 6A. The curves for different materials can be clearly distinguished from one another, and the repeatability of measurements is shown. The resulting Fourier spectrum is shown in Figure 6B. Here, the characteristic peaks in the signal spectrum at
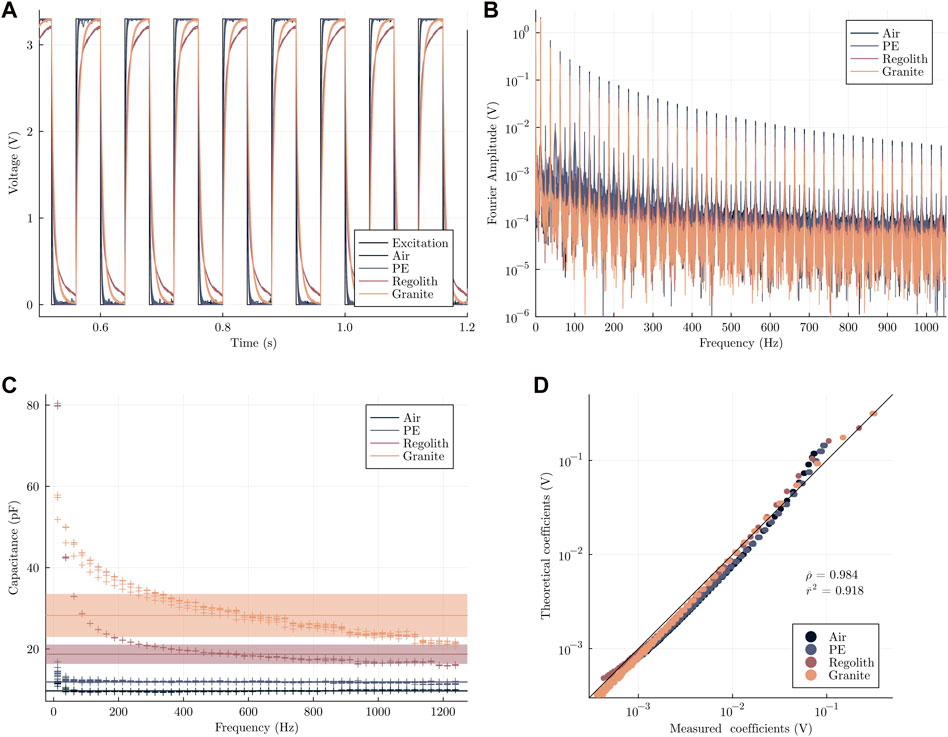
FIGURE 6. Results of the calibration with materials of known relative permittivity. (A) Measured time series. (B) Processed frequency spectrum of the time series. (C) Processed frequency-dependent capacitance. The ribbon shows the respective average value and one standard deviation. (D) Cross-plot of the measured vs predicted Fourier coefficients.
Figure 7 shows the resulting correlation between the relative permittivity and measured average capacitance. A linear fit to the data returns an additional parasitic capacitance of 5.948 pF and a slope of dCm/dɛ = 2.709 with r2 = 0.987. This highlights the sensitivity of the investigated patch electrode setup with respect to changes in the sample’s effective relative permittivity.

FIGURE 7. Correlation of measured capacitance over static relative permittivity. Relative permittivity error bars indicate 10% uncertainty, and capacitance error bars show 1 σ for the analysis.
The presented results show the feasibility of the novel concept of using a permittivity sensor with a patch electrode for the characterization of soil properties in the lunar exploration context. The current sensor’s sensitivity is sufficient to analyze the composition and detect possible changes in the subsurface. The internal parasitic capacitance for the most recent electronics is in the same order of magnitude as the sample’s capacitance. Experiments with different samples show that the capacitance can be expressed as a function of the effective relative permittivity of the sample. The good signal-to-noise ratio in the frequency spectrum shows that unwanted noise sources can be filtered out in the data post-processing unless the noise spectrum is similar to the excitation spectrum.
Simulation and experiments show good agreement with respect to the capacitance magnitude in the low pF range and its increase with increasing relative permittivity. However, the comparison between capacitances from experiments and simulations reveals discrepancies for offset and sensitivity. The experimental data show a higher offset parasitic capacitance, which can be explained by the harness capacitance. The discrepancy in the slope can be attributed to abstractions in the numerical model, such as an omitted air gap, and to possible boundary effects in the experimental setup.
Considering the porosity values assumed for the study, these fit the mixing model to a good degree. JSC-1A in the experiments had an average porosity of approximately 0.5 and a measured capacitance between the theorized values of air and JSC-1A, which is in good agreement with the mixing rule for a stony material (such as granite) and vacuum/air. The sensor uncertainty nevertheless needs to be reduced to achieve an intended resolution of 1% for water, which will be achieved through precise sensor characterization, noise source elimination, and improved shielding.
With a maximum sensing depth of approximately 5 cm using the central depth metric, the shallow subsurface can be investigated. Albeit other sensing depth metrics could also have been used, this metric is simple to determine and interpret. Influences of non-homogeneous mixtures, such as boulders or pockets filled with ice, have not been investigated but should be detectable as the sensor measures its entire sensing domain. In these cases, a significantly different frequency response and overall porosity magnitude can be expected. Regarding the necessary sensing depth, the depth of ice stability predicted using orbital measurements and older numerical models based on these observations was greater than the sensor’s sensing depth (for example, Paige et al. (2010) or Schorghofer and Aharonson (2014)). However, more recent numerical simulations exceeding the limited spatial resolution of orbital measurements, for example, by Hayne et al. (2020) or Reiss et al. (2021), predicted potential water accumulations in micro-cold traps in the shallow subsurface in lunar polar regions within the sensor’s sensing depth. Therefore, the permittivity sensor has the potential to investigate the lateral distribution on these scales and confirm the existence of micro-cold traps on the Moon.
The presented sensor setup and measurement technique offer numerous advantages for lunar and planetary exploration, as their interfaces are designed with a focus on simplicity and ease of integration.
• The system has a low mass (a small backend electronics box, light electrodes on the exterior, and light harness), with the current system weighing below 100 g, including the harness.
• The electric characteristics are flexible. No specific voltage levels are required to operate the sensor as the measurements are normalized. The power required for its operation is low (currently, mostly for electronics and data processing; however, it is negligible when using an onboard computer, according to the SPICE model). The system, with its non-optimized back-end electronics, consumed an average of 1.5 W.
• Data volume is low, and handling is easily manageable as the measurements are time series data with moderate sampling frequency and duration. In addition, real-time transfer is not necessary, and compressing/optimizing the data is feasible. One uncompressed measurement has a size in the order of 500 kbyte.
• Thermal requirements are non-critical and mostly affect the electronics. Thermal tests have shown that the sensor is operational from −40°C to 60°C electronics temperature. Considering the harsh thermal conditions at the lunar poles to which sensor electrodes will be exposed (see, e.g., Paige et al., 2010), these flight models will also be tested at cryogenic temperatures to ensure mechanical and functional aptitude. Differences in the materials’ coefficient of thermal expansion will be analyzed, and suitable adhesives will be used.
• With the instrument operating in ELF, noise susceptibility is low, and known sources can be filtered out during the Fourier analysis in post-processing. Additionally, the use of ELF bands reduces complexity in electronics design.
• The scientific requirement on the landing site is non-critical as the instrument can work anywhere and return data on the local subsurface. However, areas with elevated predicted surface/near-surface ice abundances are preferable for high-potential scientific return.
In comparison to the values of previous instruments given in Table 2 of Trautner et al. (2021) , the presented system’s values are mostly of the same magnitude and reasonable considering the different applications. The major differences compared to the other designs are the electronics design, single electrode type, and intended accommodation. Particularly, the ability to alter the excitation frequency via software enables investigations of several frequency domains in one sample. As the signal-to-noise ratio is best close to the base frequency and gets worse with an increase in frequency, a switch of the excitation base frequency to a higher value can help characterize higher frequencies with a better signal-to-noise ratio, hence with increased confidence.
Based on the presented feasibility study, several science targets and investigation cases are conceivable. Following Biswas et al. (2020), multiple possible sites at which a mobile instrument could be used are reasonable. These include analysis around the instrument landing site to characterize the influence of the landing surface alteration and contamination, around a boulder for transient changes over a lunation, and the vicinity or interior of a permanently shadowed region for a high probability of detecting significant amounts of volatiles. These locations are also reasonable targets for a permittivity sensor system. The collected data can be used to constrain and answer the following questions:
• What is the spatial distribution of water ice on the lunar surface? Precise knowledge of the local distribution will enable better estimations of how much water ice is in the near-subsurface lunar regolith on a larger scale in correlation with remote sensing observations.
• How do the volatile distribution and state change over time? Transient analyses will allow us to further constrain and characterize the lunar water cycle and the migration of volatiles through the lunar exosphere or subsurface. Ideally, this analysis will provide further insights into how potential cold-trapped water ice reservoirs, expected at the lunar poles, have formed and what their age might be.
• What is the density-over-depth profile of the subsurface? Data on the subsurface geotechnical properties, such as density and porosity, are not only valuable for a general understanding of the surface but also for determining its traversability and for the future applicability of in situ construction and in situ resource utilization. By measuring the bulk capacitance at various frequencies, the instrument, in principle, integrates all materials within its measurement domain. For this, the influential parameter is the relative permittivity, under the assumption that the material of the boulders is the same as the regolith (due to local scale, fragmentation, and gardening). The presence of a solid boulder within a regolith layer will effectively decrease the porosity of the sample. Furthermore, as the instrument does not penetrate the surface, boulders in the very shallow subsurface do not inhibit measurements (Bandfield et al., 2011).
Particularly, on a mobile system, the non-intrusive character of the instrument and its short duration for a single measurement are major benefits, as the path the rover takes can be closely analyzed, for example, once every wheel revolution. This can provide a very fine spatial profile of the subsurface properties for multiple conditions. In addition, as the sample is not physically disturbed by the measurement, the pristine character and transient processes can be observed in their natural state (for example, diurnal changes in volatile concentrations). Therefore, we consider rovers the preferred deployment option for the patch permittivity sensors.
Other instruments and scientific payloads can also benefit from the permittivity measurement. For ground-penetrating radars, measurement of permittivity is required to calibrate the depth information, and for sampling devices, measurement of permittivity allows us to determine or constrain the mass and density of acquired samples. Apart from its implementation as a patch electrode, the permittivity sensor concept can also be implemented in other instruments, potentially also in other bodies in the Solar System. The Lunar Volatiles Scout (LVS) is a drilling instrument with an integrated heater (Biswas et al., 2020), and the Lunar Volatiles Scout–Polar Ice Explorer (LVS-PIE) project has shown that LVS can be mounted on a small rover (Gscheidle et al., 2022). With this instrument, vertical surveys at multiple points can be performed, and the volatiles can be analyzed both in quantity and composition. Furthermore, the electrodes can be integrated into penetrators to increase the scientific return and meaningfulness of such instruments. Including additional sensors, such as thermometers and force gauges, subsurface geotechnical composition can be investigated with reasonable engineering complexity. Such sensor packages could then be used for asteroid characterization or on the icy moons of the gas giants.
Permittivity sensors are valuable additions to planetary exploration missions with few technical budget requirements. Experimental results for the novel patch electrode show sufficient sensitivity and manageable parasitic capacitance with a stable frequency response and low overall noise levels. Considering the low engineering threshold for integrating the sensors, they can be mounted even on small rovers or landers as an additional payload, providing enhanced science return. Apart from the investigated patch electrode, many different electrode geometries and configurations are possible, opening up a wide variety of mission scenarios in the planetary exploration context for which these sensors are applicable. For example, thin electrodes on penetrators, curved electrodes on wheels, or multi-pole electrodes on lander foot pads can be envisioned.
Considering these possible future flight applications, there are several fields currently under investigation for improvement: the shielding concept and noise susceptibility and the prevention of failure propagation must be further analyzed. This will enhance the general performance of the sensor and increase the concept’s reliability. On the experimental side, further investigations are planned with better defined calibration materials to analyze the possibility of detecting stratification in the subsurface. The influence of the temperature range on both the measurement and instrument operation must be further analyzed. Furthermore, a heater could be included to avoid relaxation time problems. A technology readiness level of 6 is planned to be achieved within the next year.
The raw data supporting the conclusion of this article will be made available by the authors without undue reservation.
CG: conceptualization, formal analysis, investigation, methodology, project administration, and writing–original draft. TW: formal analysis, investigation, methodology, and writing–review and editing. AS: formal analysis and writing–review and editing. PR: conceptualization, supervision, and writing–review and editing.
The author(s) declare that financial support was received for the research, authorship, and/or publication of this article. The study was performed at TUM with no additional external funding. Financial support for open access publication was provided by TUM’s University Library.
The authors thank the two reviewers for their valuable comments and suggestions that led to significant improvement of this article. The authors thank the Chair of Astronautics at TUM for the internal cooperation.
The authors declare that the research was conducted in the absence of any commercial or financial relationships that could be construed as a potential conflict of interest.
All claims expressed in this article are solely those of the authors and do not necessarily represent those of their affiliated organizations, or those of the publisher, the editors, and the reviewers. Any product that may be evaluated in this article, or claim that may be made by its manufacturer, is not guaranteed or endorsed by the publisher.
Andrews, D. (2022). “VIPER: mission design and development,” in Proceedings of the 73th International Astronautical Congress (Paris, France). IAC-22,A3,2A,x67570, Baku, Azerbaijan, 2-6 October, 2023.
Bandfield, J. L., Ghent, R. R., Vasavada, A. R., Paige, D. A., Lawrence, S. J., and Robinson, M. S. (2011). Lunar surface rock abundance and regolith fines temperatures derived from LRO diviner radiometer data. J. Geophys. Res. 116, E00H02. doi:10.1029/2011je003866
Biswas, J., Sheridan, S., Pitcher, C., Richter, L., Reganaz, M., Barber, S. J., et al. (2020). Searching for potential ice-rich mining sites on the moon with the lunar volatiles Scout. Planet. Space Sci. 181, 104826. doi:10.1016/j.pss.2019.104826
Brunton, S. L., and Kutz, J. N. (2022). Data-driven science and engineering. second edition. Cambridge: Cambridge University Press. doi:10.1017/9781009089517
Colaprete, A., Schultz, P., Heldmann, J., Wooden, D., Shirley, M., Ennico, K., et al. (2010). Detection of water in the LCROSS ejecta plume. Science 330, 463–468. doi:10.1126/science.1186986
European Space Agency (2019). ESA strategy for science on the moon, European Space Agency. Paris: ESA. Available at: https://exploration.esa.int/web/moon/-/61371-esa-strategy-for-science-at-the-moon (Accessed 18.12.2023).
Fisackerly, R. K., Trautner, R., Heather, D., Houdou, B., Nicolae, L., Meogrossi, G., et al. (2023). “PROSPECT drilling and instrumentation package: status and next steps for flight on NASA-CLPS,” in 11th European lunar symposium.
Frigo, M., and Johnson, S. G. (2005). The design and implementation of FFTW3. Proc. IEEE 93, 216–231. doi:10.1109/jproc.2004.840301
Fulchignoni, M., Ferri, F., Angrilli, F., Bar-Nun, A., Barucci, M. A., Bianchini, G., et al. (2002). The characterisation of Titan’s atmospheric physical properties by the Huygens atmospheric structure instrument (hasi). Space Sci. Rev. 104, 395–431. doi:10.1023/a:1023688607077
Grard, R., Svedhem, H., Brown, V., Falkner, P., and Hamelin, M. (1995). An experimental investigation of atmospheric electricity and lightning activity to be performed during the descent of the Huygens Probe onto Titan. J. Atmos. Terr. Phys. 57, 575–585. doi:10.1016/0021-9169(94)00082-y
Gscheidle, C., Biswas, J., Ivanov, D., Fernandes, D., Calzada-Diaz, A., Lamamy, J.-A., et al. (2022). Challenges of operating a drilling instrument on a small rover at the lunar poles - LVS-PIE phase A study results. Planet. Space Sci. 212, 105426. doi:10.1016/j.pss.2022.105426
Hayne, P. O., Aharonson, O., and Schörghofer, N. (2020). Micro cold traps on the Moon. Nat. Astron. 5, 169–175. doi:10.1038/s41550-020-1198-9
Haynes, W. M., Lide, D. R., and Bruno, T. J. (2016). CRC handbook of chemistry and physics. 97th edn. (Boca Raton, Florida, United States: CRC Press). doi:10.1201/9781315380476
Heiken, G. H., Vaniman, D. T., and French, B. M. (1991). Lunar sourcebook: a users guide to the moon (Cambridge England New York: Cambridge University Press).
Kargl, G., Stiegler, A., and Berghofer, G. (2011). “Measuring the permittivity on Mars: the permittivity sensor of the HP3 instrument,” in EPSC-DPS joint meeting 2011, 1749.
Lethuillier, A. (2016). “Characterization of planetary subsurfaces with permittivity probes: analysis of the SESAME-PP/Philae and PWA-MIP/HASI/Huygens,”. Ph.D. thesis (Paris: Université Paris-Saclay).
Lethuillier, A., Gall, A. L., Hamelin, M., Schmidt, W., Seidensticker, K. J., Grard, R., et al. (2016). Electrical properties and porosity of the first meter of the nucleus of 67P/Churyumov-Gerasimenko. Astronomy Astrophysics 591, A32. doi:10.1051/0004-6361/201628304
Li, S., and Milliken, R. E. (2017). Water on the surface of the moon as seen by the moon mineralogy mapper: distribution, abundance, and origins. Sci. Adv. 3, e1701471. doi:10.1126/sciadv.1701471
Looyenga, H. (1965). Dielectric constants of heterogeneous mixtures. Physica 31, 401–406. doi:10.1016/0031-8914(65)90045-5
Lucey, P. G., Petro, N., Hurley, D. M., Farrell, W. M., Prem, P., Costello, E. S., et al. (2021). Volatile interactions with the lunar surface. Geochemistry 82, 125858. doi:10.1016/j.chemer.2021.125858
Nurge, M. A. (2012). In situ dielectric spectroscopy for water detection on the lunar surface. Planet. Space Sci. 65, 76–82. doi:10.1016/j.pss.2012.01.010
Paige, D. A., Siegler, M. A., Zhang, J. A., Hayne, P. O., Foote, E. J., Bennett, K. A., et al. (2010). Diviner lunar radiometer observations of cold traps in the moon’s south polar region. Science 330, 479–482. doi:10.1126/science.1187726
Reiss, P. (2018). A combined model of heat and mass transfer for the in situ extraction of volatile water from lunar regolith. Icarus 306, 1–15. doi:10.1016/j.icarus.2018.01.020
Reiss, P., Warren, T., Sefton-Nash, E., and Trautner, R. (2021). Dynamics of subsurface migration of water on the moon. J. Geophys. Res. Planets 126, 6742. doi:10.1029/2020je006742
Schorghofer, N., and Aharonson, O. (2014). The lunar thermal ice pump. Astrophysical J. 788, 169. doi:10.1088/0004-637x/788/2/169
Seidensticker, K. J., Möhlmann, D., Apathy, I., Schmidt, W., Thiel, K., Arnold, W., et al. (2007). Sesame – an experiment of the Rosetta lander Philae: objectives and general design. Space Sci. Rev. 128, 301–337. doi:10.1007/s11214-006-9118-6
Sihvola, A. (2000). Mixing rules with complex dielectric coefficients. Subsurf. Sens. Technol. Appl. 1, 393–415. doi:10.1023/a:1026511515005
Stiegler, A. (2011). “Mars permittivity probe calibration and instrument performance validation,”. Master’s thesis (Graz: Graz University of Technology).
Trautner, R., Grard, R., and Hamelin, M. (2003). Detection of subsurface ice and water deposits on Mars with a mutual impedance probe. J. Geophys. Res. 108, 2008. doi:10.1029/2002je002008
Trautner, R., Reiss, P., and Kargl, G. (2021). A drill-integrated miniaturized device for detecting ice in lunar regolith: the PROSPECT permittivity sensor. Meas. Sci. Technol. 32, 125117. doi:10.1088/1361-6501/ac261a
Zent, A. P., Hecht, M. H., Cobos, D. R., Campbell, G. S., Campbell, C. S., Cardell, G., et al. (2009). Thermal and electrical conductivity probe (TECP) for Phoenix. J. Geophys. Res. 114, 3052. doi:10.1029/2007je003052
Keywords: permittivity (dielectric constant), moon, regolith, instrument development, volatiles
Citation: Gscheidle C, Witzel T, Smolka A and Reiss P (2024) Permittivity sensor development for lunar and planetary surface exploration. Front. Space Technol. 4:1303180. doi: 10.3389/frspt.2023.1303180
Received: 27 September 2023; Accepted: 18 December 2023;
Published: 10 January 2024.
Edited by:
Yosuke Yamashiki, Kyoto University, JapanReviewed by:
Noriyuki Namiki, National Astronomical Observatory of Japan (NAOJ), JapanCopyright © 2024 Gscheidle, Witzel, Smolka and Reiss. This is an open-access article distributed under the terms of the Creative Commons Attribution License (CC BY). The use, distribution or reproduction in other forums is permitted, provided the original author(s) and the copyright owner(s) are credited and that the original publication in this journal is cited, in accordance with accepted academic practice. No use, distribution or reproduction is permitted which does not comply with these terms.
*Correspondence: Christian Gscheidle, Yy5nc2NoZWlkbGVAdHVtLmRl
Disclaimer: All claims expressed in this article are solely those of the authors and do not necessarily represent those of their affiliated organizations, or those of the publisher, the editors and the reviewers. Any product that may be evaluated in this article or claim that may be made by its manufacturer is not guaranteed or endorsed by the publisher.
Research integrity at Frontiers
Learn more about the work of our research integrity team to safeguard the quality of each article we publish.