
95% of researchers rate our articles as excellent or good
Learn more about the work of our research integrity team to safeguard the quality of each article we publish.
Find out more
ORIGINAL RESEARCH article
Front. Space Technol. , 15 July 2022
Sec. Space Debris
Volume 3 - 2022 | https://doi.org/10.3389/frspt.2022.933340
This article is part of the Research Topic Space Environment Characterization View all 7 articles
Knowledge about the space radiation environment is crucial for the design and selection of materials and components used for space applications. This environment is characterized not only by the Sun’s electromagnetic radiation but also by charged particles categorized into solar wind, solar energetic particles (SEP) and galactic cosmic rays (GCR). Especially for material engineering and qualification testing, differential and integral spectra for particle energies ranging from keVs to GeVs are required. Up to now, a wide variety of models is available, whereas it is difficult to keep the overview. Although, e.g., the European Cooperation for Space Standardization (ECSS) standard includes instructions on how to investigate particle radiation, it does not provide an overall view. This paper shall support those in need of a comprehensive overview and provide comprehensive information about proton radiation spectra that can potentially be of use for space engineering tasks ranging from mission analysis to material and component design as well as qualification testing. The publicly accessible platforms OLTARIS, SPENVIS, and OMERE were examined for available proton spectra to be used. Exemplary, the particle radiation of solar cycle 23 is considered, which comprehends the years 1996–2008. A common drawback of the available models is their restriction to the MeV-range. Particularly when materials are directly exposed to the space environment, low energetic particles, specifically, the keV-range, are of high interest, since these particle transfer all their energy to the material. Therefore, additional data sources were used in order to include the usually neglected low energy protons into the derived spectrum. The data was transferred to common set of units and eventually could be compared and merged together. This includes a comparison of the most common models, incorporating data foundation, applicability, and accessibility. As a result, extensive and continues spectra are fitted that take all different models with its different energies and fluxes into account. Each covered year is represented by a fitted spectrum including confidence level as applicable. For solar active and quite times spectra are provided.
The interplanetary environment is constituted of vacuum, electromagnetic and corpuscular radiation. Among the particles are protons, electrons and a wide range of ions with varies degrees of ionisation. Energies can range from fractions of keVs up to EeVs (The Pierre Auger Collaboration, 2017). Satellites exposed to this environment can suffer loss of performance. Functional surfaces, such as insulating materials, solar shields, sails and arrays, are altered and physical properties may deteriorate (Sznajder et al., 2020). Concerning human crew, radiation doses can built up over time and bear health risks. As a consequence sufficient knowledge of the radiation environment is a necessity for the crew safety of manned spacecrafts and ensuring of equipment functionality. Furthermore, extensive radiation spectra can improve understanding of physical processes (Nymmik, 2007).
When charged particles, such as protons, electrons, and positive ions, pass through materials, they lose energy and slow down. The deceleration, or rather energy transfer, thereby increases with decreasing energy. According to the Bragg peak, the maximum deceleration is reached close before the particles energy drops to zero. This means, that incoming low energy particles get stuck and deposit all their energy in shielding. Higher energy particles travel through, transfer less energy into the shielding and reach the inner area, where they can harm crew and devices.
Adequate knowledge of flux spectra enables the determination of the fluence over mission lifetime which is needed for the simulation of the likelihood of Single Event Effects (SEEs), which describes the effect of ionising radiation on semiconductor components. Further radiation dose on equipment and especially human crew can be calculated. Furthermore, the deterioration of surfaces can be investigated, e.g., by estimating the decrease of reflection on a solar sail in dependence of hydrogen blistering caused by irradiated protons (Sznajder et al., 2020). Eventually, the reproduction of the same fluence in laboratory radiation testing gains knowledge on the materials behaviour for a given scenario.
Existing models, especially those for interplanetary space [Solar Energetic Particles (SEP) and Galactic Cosmic Rays (GCR)], overlook energies below approximately 1 MeV in favour for SEEs and dose calculation. The lack of models for solar wind, makes it necessary to use solar observatory data, which are sparse. Solar wind flow data is provided by Advanced Composition Explorer (ACE), Global Geospace Science’ Wind (WIND), Solar and Heliospheric Observatory (SOHO) and Deep Space Climate Observatory (DSCOVR). Of these four satellites, only SOHO provides uninfluenced solar wind flux data throughout the entire solar cycle 23, whose data will be used for the calculation of this publication. WIND was also launched before start of solar cycle 23, but remained inside the influence of Earth’s magnetic field, thus does not provide complete data. ACE was only launched in late 1997, started providing data in the beginning of 1998 and thus does not cover the entire cycle under investigation.
Particle flux throughout the varies publications and data platforms is given in various units. It is a number of particles crossing a sphere of unit cross-sectional area per unit time (Royal Belgian Institute for Space Aeronomy, 2018). Upon further investigation, subcategories can be differentiated. At first, there is the directionality. Mathematically flux is a vector field. In case the flux is independent from its direction, its called omnidirectional. Directionality of vector fields can be normalized by using solid angles, the unit used is steradiant [sr], which is analogous to radians but with an added dimension. Unfortunately, not all sources state their directionality which leaves room for interpretations. Usually flux data is published preprocessed. When using the data, one has to trust that conversions, e.g., uni- to omnidirectional flux, have been conducted correctly.
As a remark on the directionality, in the context of this work, if no directionality is given, GCR flux is assumed to be omnidirectional [e.g., Slaba and Whitman (2020)] and later converted to directional flux through division by 4π. Solar wind and SEP flux is different due to its origin in the Sun. This flux can not be assumed to be omnidirectional, but does not emit from a point-like sources either (Gloeckler et al., 2008). All considered SEP models state their directionality, solar wind was reported to reference to 2π (Sznajder, 2021).
Spectra are typically given either in the integral or differential form. The differential form, with respect to energy, will be used throughout this work in units of [particles cm−2sr−1s−1 (MeV/nuc)−1]. The integral form is derived thereof and is calculated by
where fd and fi denote the differential and integral flux respectively. The particle energy is ascribed to Ep. The usual scenario to use the integral form is, when particles below a certain energy can be neglected due to shielding. The upper boundary of the integral can also be finite, when only a certain energy range is of interest, because e.g., for higher energies can not be tested, or their energy deposition rate can be neglected due to thin films. The actual integration limits can vary, but the here introduced form is the most common usage.
The content of this paper is split into several parts. At first the reader will gain an insight into the main proton types encountered in the Solar System. Followed by an description of the existing modelling approaches and spectrum models in the same section. See Section 2. Afterwards, a continuous spectrum is modelled and introduced in Section 3. Eventually, the continuous spectrum is compared to existing models and discussed in Section 4. Furthermore, the appendix provides data files for the developed spectra and parameter files to recreate these.
The following section shall give the reader an impression of the three main particle sources that are differentiated, solar wind, SEP, and GCR, as well as the influence of the solar activity on these three.
The sources of interplanetary energy particles may be classified into solar and galactic. Solar may be further divided into solar wind and SEP. Figure 1 shows the particle categorization. Further it can also be seen, that SEPs can be subdivided according to their acceleration mechanisms. All of whom vary their fluxes along with the level of solar activity. The predominant source, the Sun, has a roughly 11-year activity cycle. While at solar maximum SEP and solar wind fluxes increase, GCR decreases, and the other way round for solar minimum. The cause will be explained further below.
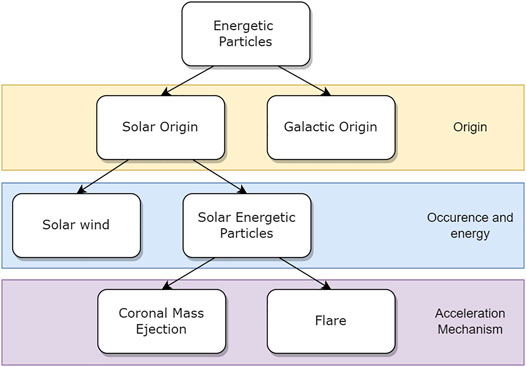
FIGURE 1. Classification scheme for energetic particles to be found in the solar system. To the right, the classification criteria are written.
Solar wind is a low-energy particle flux emerging from the Sun. Although the flux varies slightly during the solar cycle, the solar wind is said to be quasi-stationary (von Steiger et al., 2000). Its particle energies are reaching up to approx. 10 keVs. It rises to a plateau around few keVs. The higher energy edge of this plateau is generally considered as the fast solar wind and the opposing edge as slow solar wind (Mason and Gloeckler, 2012). The average flux due to solar wind only varies slightly during the solar cycle. In Figure 2A the annual averaged solar wind flux measured by SOHO is plotted. What can be seen, during the solar active phase, the grey coloured area, the solar wind flux fluctuates and drops during times of low activity to approximately half of the average value.
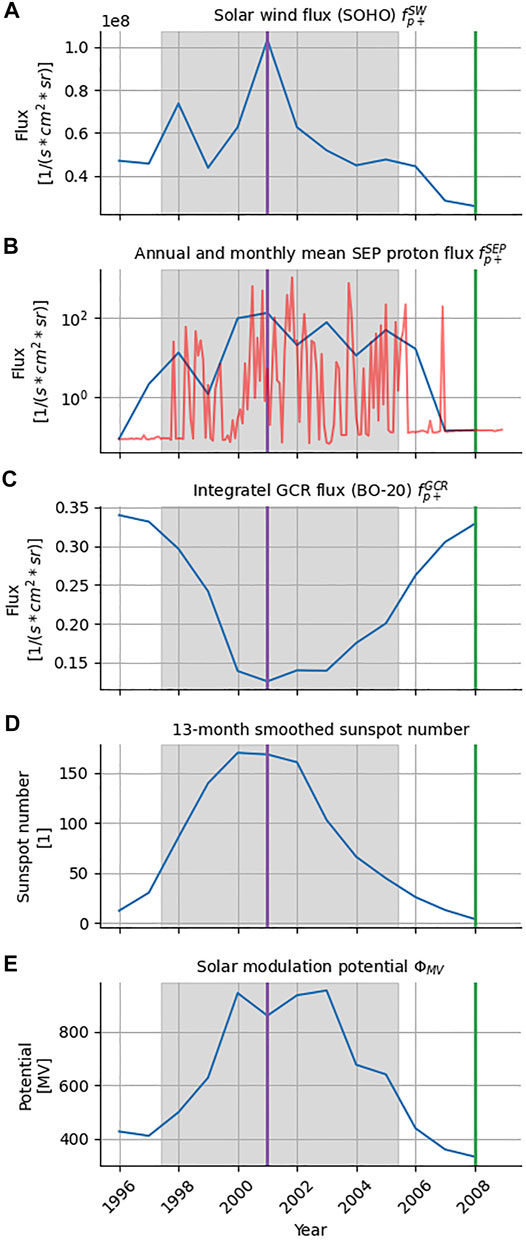
FIGURE 2. Flux and modulation properties over the course of an solar cycle. The grey coloured area marks the solar active times as defined by Feynman et al. (1993). The purple and green vertical lines denote the solar maximum and minimum respectively as provided by SILSO (2022). In (B), red is the monthly and blue the annual mean SEP proton flux. Note the logarithmic scale in (B). See the text for a more detailed description.
Directly to solar wind, pickup ions adjoin in the energy spectrum. These are previously neutral particles that have been ionized by either electromagnetic radiation or solar wind (Isenberg, 1987). Along the energy spectrum, pickup ions are followed by the suprathermal tail. These ions can be observed during solar inactive times, as they are otherwise overshadowed by SEP event fluxes (Fisk and Gloeckler, 2008). Their distribution can be described using the power law (Gloeckler et al., 2012). For these particle types, only sparse data is available.
SEPs originate from Coronal Mass Ejections (CMEs) and flares. As the names indicate, CMEs eject mass, namely charged particles, into interplanetary space, while flares describe sudden increases in electromagnetic radiation. Both attribute to magnetic instabilities where energy is released (Kallenrode, 2003). Furthermore, although their main ejecta differentiates, they both accelerate charged particles, which than later show up as SEP event.
These so-called SEP events are the main source for energy particles in the range from few MeV up to several hundred MeVs. They can be impulsive and sudden or gradual. The transition between one another is continuous due to their acceleration mechanisms, which can occur together or individual (Kallenrode, 2003).
SEP flux does not only vary on an annual scale. Due to the heavily fluctuating, event-like occurrence if this type of particles, the flux fluctuates by several magnitudes between events. In Figure 2B the annual and monthly mean flux are plotted. Firstly, the graph shows, that the blue annual mean SEP flux decreases by a factor of two towards solar minimum. Secondly, the red monthly mean SEP flux fluctuates over several magnitudes, which is even increased for shorter averaging periods. Month with higher event rates can be easily identified.
How events are perceived, is coupled to the position of the observer. In Figure 3 events caused by a CME are plotted for various observer positions in the Solar System. Onset and maximum vary for every position. Consequently, even if the particles have been accelerated due to one of the mechanisms, the event does not necessarily have to look impulsive or gradual. Meaning, the same event fluence can come with high and lower peak fluxes, which is important for the interpretation of SEP models with respect to their confidence intervals.
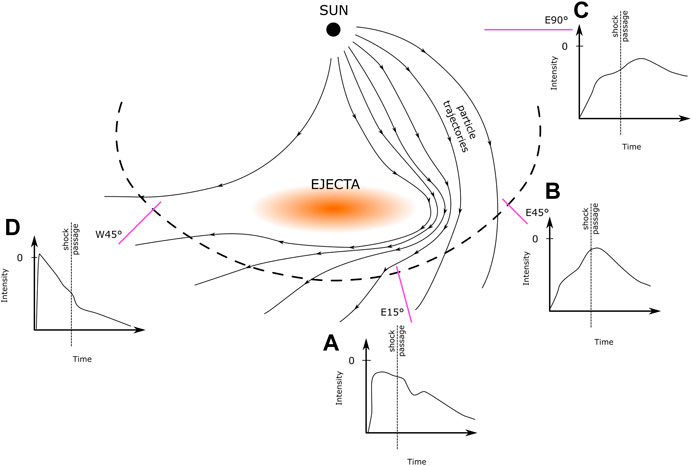
FIGURE 3. Depending on the observers position a SEP event looks different and the flux experienced changes. Positions A, B, C and D are all located on the ecliptic plane and equidistant from the sun. Their angular position is marked in each plot. Picture adapted from Cane et al. (1988).
Other distinctive features are the composition, e.g., ratio of iron to oxygen or hydrogen to helium, the duration, hours up to days, and at what rates these occur, from thousands down to only few per year. For instance, events caused by CMEs tend to be gradual, last for days, consist mainly of protons and occur usually only once a month (Kallenrode, 2003).
Galactic Cosmic Rays (GCR) flux differs from solar particles sources in a number of ways. First of all, it behaves inverse proportional to solar activity. During solar quiet times, its influence increases which can be seen in Figure 2C. GCR particles reach our Solar System from outside, until recently their definite source was controversial (Bell, 2013; The Pierre Auger Collaboration, 2017; Abeysekara et al., 2021). GCR flux dominates the particle spectrum for energy of approximately 1 GeV and upwards. There do arrive lower-energy particles from outside, but these get lost in the SEP flux. Furthermore, its mainly these particle, that get modulated by the Sun activity, that the remaining GCR flux can be assumed to be constant [e.g., Matthiä et al. (2013)]. According to the force field model, the suns modulation potential, is the essential influence on the GCR spectrum (McCracken, 2004). The higher the solar activity the higher the modulation potential. This can be seen in Figures 2D,E. The higher the modulation potential the more are the GCR particle hindered to enter the Solar System depending on their energy, charge and mass.
There are also so-called Anomalous Cosmic Rays (ACR) particles, which are counted as a sub-category of GCRs. These are neutral particles entering the Solar System without hindrance since neither solar magnetic field nor the modulation potential have influence on them (Adams et al., 1991; Jokipii and Giacalone, 1998). Approaching the Sun, they get ionized by mainly electromagnetic radiation. Now charged, they are accelerated to energies up to that of SEPs but with a lower flux density (Tylka et al., 1997).
The three flux types have been discussed. Together they cover the complete energy range of interest for space applications. Starting with the very low energy solar wind, mainly responsible for surface alteration, proceeding with SEP for medium and GCR for higher energies, each important for dose calculation on crew and equipment.
This section shall give the reader a rough overview of the available models and how they work in short. There is a wide variety of models for SEP and GCR available. As for European qualification of space applications, the ECSS standard (European Cooperation for Space Standardization, 2020a) is the main source for models to use. Unfortunately solar wind is not represented in the standard, nor in the model variety. Thus, outer materials, especially Sun shields, Multilayer Insulation (MLI) and solar arrays, only see electromagnetic radiation testing for qualification in order to check for materials alteration.
The sheer amount of models is shown in Figure 4. The graphic does not claim completeness, but shows models available in SPace ENVironment Information System (SPENVIS), OMERE and On-Line Tool for the Assessment of Radiation in Space (OLTARIS).
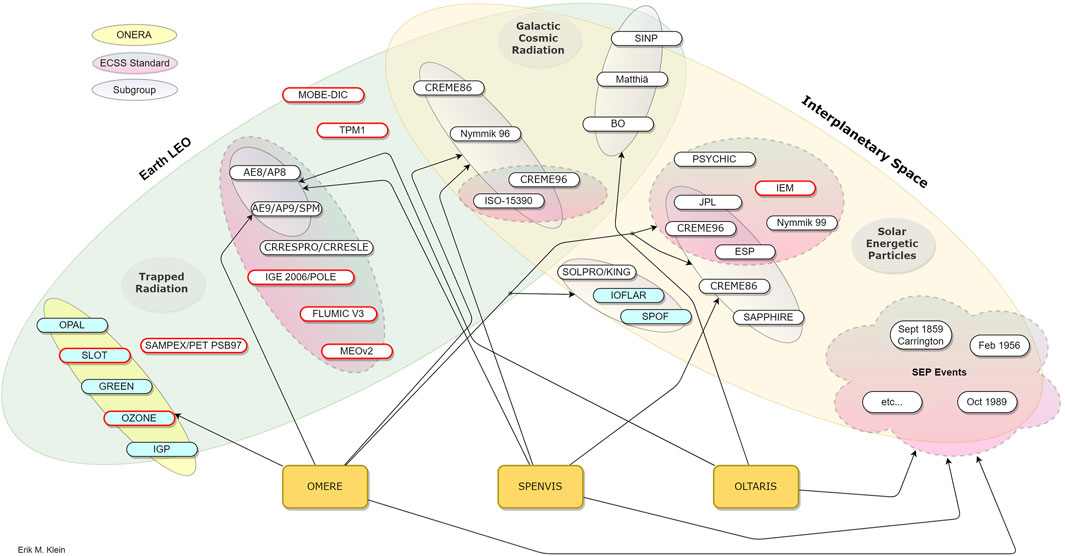
FIGURE 4. Available proton radiation models. Models with an red surrounding are electron models, which are added for the sake of completeness. So are the models for particle flux inside the influence of Earth’ magnetic field, see Earth LEO. To maintain clarity, models are divided into subgroups. Subgroups with a colour gradient are mentioned in the ECSS. Turquoise background denotes to models by ONERA, which are only available in OMERE.
Concerning the risk assessment of classical satellite systems, solar wind does play a secondary role. This is because the main concern is on functionality of electronics, that are inside the spacecraft and therefore shielded from solar wind particles. Mainly for this reason, solar wind proton energy spectra models have never been developed. The Interplanetary Monitoring Platform (IMP) and Geostationary Operational Environmental Satellite (GOES) series are in the area of influence of the Earth’ magnetic field and the solar probes with the fitting equipment are spread throughout the Solar System, see for instance Voyager or the Helios probes. Only starting with ACE, SOHO and WIND in the 90s suiting data was available. Later DSCOVR joined. To create flux spectra, raw data from SOHO, ACE, WIND, and DSCOVR Faraday cups (FCs) measurements has been unified and translated.
For the adjoined pickup ions and suprathermal tail, no data was available for this publication. Some information is provided by ACE, but as already mentioned, ACE data does not cover the entire solar cycle 23 and is therefore rejected, but will be included in spectra modelling of succeeding cycles. See e.g., Zeldovich et al. (2021) for suprathermal ion data.
Due to the quasi-random event-like nature of the SEP fluxes, models for this particle type use statistical methods to describe the average flux and fluence (King, 1974).
One of the oldest models in use is KING. Developed by King (1974) at that time using data only from solar cycle 20, which was significantly weaker than the previous cycle 19 and the succeeding cycle 21. A further drawback is the low number of considered events for the statistical basis. Additionally, one anomalously large (AL) event is responsible for about 70% of the total
Basically, probabilities are used to estimate the likeliness that a specified fluence of particles f, that have energies greater than some threshold E, is exceeded during a mission of a given duration t. Mathematically expressed as p (>f, E, t). Thus, KING provides a model, that specifies in dependence of fluence, energy, and duration, the probability of exceeding this named fluence. Or, using the confidence interval as input, it returns a spectrum (fluence over energy) that fits this for the given duration. And this is basically the same procedure for all of the SEP models with more or less sophisticated data bases and event depiction.
The JPL-85 model was one to use KING’s base and build upon it. The precedented differentiation between AL and ordinary events was abolished. Additionally the underlying data base was extended and included than observations from 1963 up to 1985, which is three times longer than KING’s and includes three solar cycles (Feynman et al., 1990; Royal Belgian Institute for Space Aeronomy, 2018). While KING does not differentiate between solar active and quiet times, the JPL-85 model introduced this distinction. Feynman et al. (1990) estimated the Sun to be active 2.5 years before and 4.5 years after its maximum is reached, leaving 4 years of so-called quiet time inside the 11 years solar cycle. JPL-85 assumes, that during the latter 4 years no flux is produced due to SEP events. As the database used in JPL-85 stilled lacked a sufficient number of larger events, JPL-91 disposed of this shortcoming. Feynman et al. (2002) issued the continuing validity by comparison with new data since JPL-91 has been published. Hence, JPL-91 was referred to as the JPL model. Later, Rosenqvist et al. (2005) and Glover et al. (2008) have shown, that JPL underestimates the fluence in certain energy bands and published an updated version, which is available in SPENVIS as Rosenqvist et al. (2005). Depending on the mission duration, Kazama and Goka (2008) recommends to use higher confidence levels for shorter and 50%–75% for durations longer than 7 years when using JPL.
In Xapsos et al. (1999a) were few shortcomings of JPL approached. One being to extend the energy range towards lower energies to access the range, that is interesting for solar array alteration. Another shortcoming, was that none of the previous models included data of full three solar cycles. Each cycle is different from one another, for instance did have cycle 20 only one AL event, while cycle 22 had several and was overall very active. Thus, the more data can be included the more solid becomes the statistical base (Royal Belgian Institute for Space Aeronomy, 2018). Xapsos et al. (2000) assigned reasonable agreement of the created ESP model with JPL-91.
An available software package is CREME. It comprises radiation estimation for various environments including Earth orbits and interplanetary space. Part of the CREME suit is a collection of flare fluxes, that can be used to estimate SEE rates. It is not suitable for long-term accumulated fluence calculation, since it only provides peak flux spectra recorded during SEP events. The CREME suit will be further discussed below in the GCR section.
The SAPPHIRE model was the first to extend the definition of events. While in previous considerations, SEP events have been assumed to be point-like occurrences in time with a given fluence, Jiggens et al. (2011) extended their properties to have a duration and peak flux. It is assumed events can be adequately described by a triangle distribution (Jun et al., 2007). The model also covers the widest range of energy, going as low as 0.1 MeV/nuc and up to 1 GeV/nuc. Jiggens et al. (2018) documents it thoroughly.
There are further solar proton models developed by ONERA which shall be mentioned here for the sake of completeness but not further elaborated, due to insufficient available documentation. Models for SEP particles, only available in OMERE, are SPOF and IOFLAR.
Previous models calculated the average flux by estimating the event frequency and fluence. To define events, flux is filtered. Is an threshold exceeded for a certain duration, an event is recorded. Consequently flux below this threshold, is considered to be noise and left out. SPOF has a different approach (ONERA, 2021). Instead of assuming, as done in the JPL, ESP, and SAPPHIRE models, that during solar quiet time, no SEP flux is experienced, SPOF provides spectra for the radiation noise that disappears during active times in the SEP flux or is below the threshold that would otherwise set of an event in the statistical models. IOFLAR works similar to CREME and provides event flux spectra for protons and heavier ions on the assumption that all have similar distributions ONERA (2021).
Additionally to various listed models, event flux data are generally provided. These include the measured peak fluxes of events usually labelled as e.g., “August 1972” or “October 1989.” These shall be mentioned here for the sake of completeness, but will not be considered for modelling. They are used for worst-case rate estimations, similar to IOFLAR and CREME’s flare spectra.
Recommend model by the ECSS standard for mission fluence, or rather average flux, is ESP. For event peak fluxes, CREME96 is approved.
GCR particles can reach up to very high energy, contrary to solar wind. They have far higher energies, but are also rare particles to experience. Their distribution peaks around 1 GeV. Their high energies make it impossible to shield against them, as it is already the cause for parts of SEPs. Consequently, the better the knowledge of the GCR flux, the better the risk for space missions can be estimated and if necessary accounted for.
The available models for GCR differ mainly in one aspect (Royal Belgian Institute for Space Aeronomy, 2018). For energies above 1,000 MeV their spectra are considerably identical, but differ increasingly for energies below the mentioned threshold.
The first extensive GCR model to be available, was Adams, (1986). In 1996 Tylka et al. (1997) published a revised version. Both models are denoted CREME86 and -96 respectively. CREME86 estimated the influence of the Sun by a crude sinus function, assuming the solar cycle to be 10.9 years long. As we now know, each cycle can largely differ from its predecessor (Vipindas et al., 2018, for instance). The updated version was based on Nymmik et al. (1992), which removed this drawback by modelling the solar cycle using the monthly averaged Wolf-number, which describes the amount of sunspots, which is approximately proportional with the solar activity (Gueymard, 2004).
Based on Nymmik et al. (1996) and International Organization for Standardization (2004) (ISO 15390:2004) was published, which is up to today the recommended standard by the ECSS to calculate the GCR flux. Nymmik et al. (1992), Nymmik et al. (1996) and CREME96 consider ACR for historical reasons. In the beginning of GCR modelling, ACR was thought to have a bigger influence on the radiation environment than it eventually had (Tylka et al., 1997).
Recently Matthiä et al. (2013) published a model based upon only one parameter, the solar modulation potential. Further, the model covers heavier nuclei. Also applicable on Satellite mission analysis, the main purpose of the model is to support the simulation of processes inside the heliosphere.
In 1996 Badhwar and O’Neill (1992) published a model of the GCR that was based on the standard diffusion-convection theory and fitted to observed spectral measurements. The error of this models was then already three times smaller than that of CREME86. Throughout the years the Badhwar-O’Neill (BO) model got subsequently improved by Badhwar and O’Neill (1996); Badhwar (2001), O’Neill (2006, 2010), O’Neill et al. (2015), Slaba and Whitman (2020). Its covered energy range is wider than that of the other existing models, such as ESP and JPL.
To form a single continuous spectrum for easier simulation and testing purposes, of each of the three particle categories one spectrum model has been chosen. These have been merged on the following progress by fitting a polynomial in the log-log space. This process will be elaborated in the following section. To automate this process, from model input to fitting, a python framework has been written, which will be further elaborated in the following section.
The intention of this publication is to provide an extensive, accurate and simple spectrum for a wide base of applications. Due to the wide range of software and programming languages used, the best accessible approach is to share the fitting function and parameters. The criteria for the best possible function are a minimum set of independent parameters and an optimized coefficient of determination R2. Emphasis shall be on simplicity of the function and flexibility of the shape. Since, with a growing number of independent parameters, R2 also increases, the minimum sufficient R2 was chosen to be 0.8. See Section 3.4 for further information.
For solar wind, the collected and unified data by Sznajder (2021) of SOHO was used. Available are minima, average and maxima spectra, 0, 50 and 100% confidence level respectively.
For SEP protons, SAPPHIRE was chosen. Reasons being.
• the good agreement with ECSS models, such as ESP and JPL,
• SAPPHIRE being the latest published model for SEPs and
• covering theoretically the wides energy range. The available range in SPENVIS is smaller, than that proposed in Jiggens et al. (2018).
Available are confidence levels between 50 and 99.99% (Jiggens et al., 2018).
For GCR the latest BO model has been chosen. Again, this model is the most up-to-date, but also is extensively documented and compared with measurements. Slaba and Whitman (2020) proofs that it is reasonably accurate. Further, similar to SAPPHIRE, it is in good agreement with ECSS models. Available is only the mean spectrum, or rather confidence level of 50%. But due to the low fluctuation of the GCR flux, this is sufficient.
All of the chosen models are publicly available via OLTARIS, SPENVIS and Solar Energetic Particle Environment Modelling (SEPEM).
The implementation of ECSS models into the database has been considered, but rejected due to the availability of more up-to-date models. Nonetheless, the chosen models agree well with the ECSS spectra.
The chosen confidence interval for this exemplary radiation situation was 50%, or rather the average flux. The only available confidence interval for all of the spectra types is 50%. The produced continuous spectra shall therefore depict the mean flux and its annual fluctuations due to solar activity.
The spectra input format is determined by the output of SPENVIS, OLTARIS, and OMERE. The python framework has been extended to be able to import most of the common file formats with their individual flux units and transform these into an unified spectrum format. See Figure 5, the model and spectrum classes. If available, differential flux is always preferred over integral. Otherwise the model is rejected. Fortunately most models support both flux types. Fluence and average flux is easily converted given the mission duration. As already mentioned, flux data without statements on their directionality is referred back to their sources solid angle.
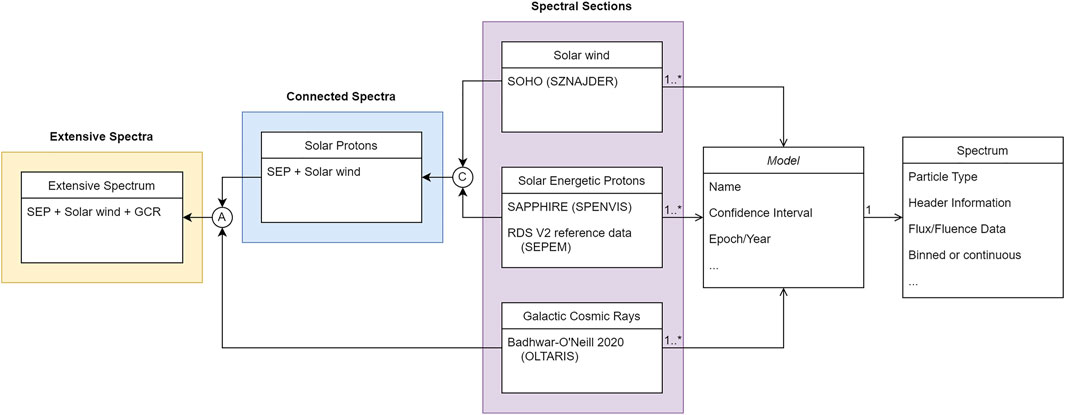
FIGURE 5. Process of merging the models for different particle types. “C” denotes Connection, and “A” Addition. Sources for the spectral sections are given in brackets.
When trying to merge the three distinguished particles types, two problems arise. First of all, the gap between solar wind and SEP has to be closed. Since solar wind and SEPs both emerge from the Sun, it is assumed that they must be connected by a continuous, smooth spectrum. This hypothesis is supported by Mason and Gloeckler (2012) for ionized oxygen. Since SEP can be decently fitted by the truncated power law, as elaborated in Xapsos et al. (1999b), Xapsos et al. (2000), the power law will be used to extend the SEP range towards solar wind. Subsequently the gap is interpolated and data points are added for least-square fitting. Secondly, SEP and GCR overlap. Since they originally come from different source, but have similar properties, such that both are omnidirectional (European Cooperation for Space Standardization, 2020b), they can be added in the overlapping region to form a mutual spectrum.
Unfortunately SAPPHIRE does not provide data for solar quiet years including 1996 and 2005–2009. To cover the data gap, the original data, which SAPPHIRE is based on, is used in the analysis. The data used is the RDS V2 H reference data which is made up of cross-calibrated measurements from IMP and GOES satellites (SEPEM reference proton dataset, 2019).
The data is being processed using python. Classes have been constructed to represent models and their spectra as seen on the right side of Figure 5. Each model class possesses exactly one spectrum class. Together they carry all information of one specific model for one specific mission, e.g. interplanetary near Earth environment, without magnetic shielding and over 1 year. Magnetic fields, such as Earth’s, deflect charged particles and thus can hinder particles from reaching objects surrounded by these fields. Models of one type (solar wind, SEP, and GCR) can be merged into spectral sections.
As elaborated, the solar wind and SEP sections are connected via interpolated data to form the solar proton spectrum. GCR data does not have to be processed further before adding it to the solar protons. The sum of this sets up the extensive spectrum. This is repeated for each year. The described process is shown via the coloured boxes in Figure 5.
Fitting of the chosen models is crucial, in order not to alter contained data, but also combine them into one spectrum. In Figure 6 few exemplary models and raw data are plotted for the year 2001, where the solar maximum took place.
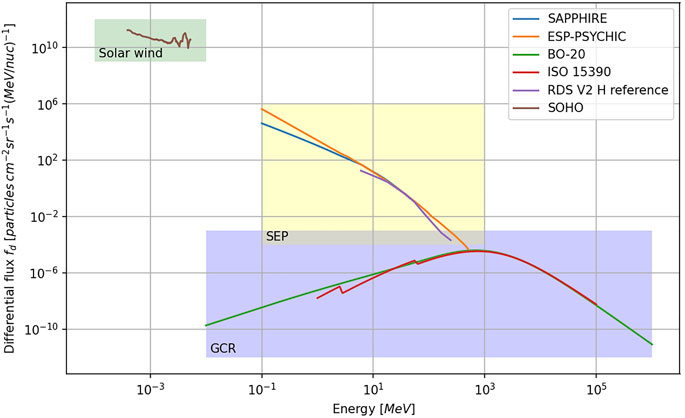
FIGURE 6. Models that contributed to the database are plotted: SAPPHIRE, SOHO data, RDS V2 reference data and BO-20. Additionally the recommended models ESP and ISO 15390 are plotted for reference. Used confidence interval is 50% of 2001.
Before merging, all spectra are interpolated to standardize the energetic resolution. As with the interpolation of the gap between solar wind and SEP, the data is interpolated via power law. Data points are distributed logarithmically, e.g. 200 points per magnitude. This becomes necessary, as to not overweight certain spectra due to higher point density given by the input file. Having equalized the solar protons and GCR spectra, addition can be executed.
The fitting function itself has to be able to adapt to various distributions. SEP can be described by the truncated power law (Xapsos et al., 1999b, 2000). Mason and Gloeckler (2012) states that a simple power law can describe the SEP energy range during solar quiet times. For high energies, GCR can be described by using the power law as well, for lower energy regions, this does not hold up (Matthiä et al., 2013). SEP and GCR seen individually can be described using either the truncated or normal power law. Yet, when merged, a combined power law fails to fit tightly to the transition zones. For the solar wind spectrum, the power law can not be applied. Figure 6 shows how a simple truncated power law can not align with the complex shape of all sources, the solar wind plateau, skipping of the SEP range and the higher energy GCR bump.
A simple power law function can not adjust to the complex shape of the extensive spectrum. Extension by addition of truncated power law functions improved the fitting behaviour, but unsatisfactory and increased complexity and number of independent parameters of the function. Consequently, the power law functions were dismissed and will not be further elaborated.
Due to the double-logarithmic behaviour, meaning that the flux spectra span over several magnitudes in flux density and energy, the various phenomena can best be described by an logarithmic polynomial, shown below:
E and fd denoting the energy and flux respectively and ai being the fitting parameters. This form of an polynomial has been chosen, since the normal polynomial is not able to adjust to the dynamic range of the particles spectrum. The final adjustment of the polynomial is done by a least-square fit to unified data.
In Figure 8 an overview of the fitted spectra is shown. The years 1996–2008, which cover solar cycle 23, are plotted. Further, the fitting parameters, introduced in the previous section, that were found, are listed in Table 2, including the coefficient of determination R2 of each fit. In order to by able to adapt to the individual behaviour of each particle type, an analysis has been conducted, whose results have been plotted in Figure 7. The minimum value for R2 was chosen to be 0.8 for all years which is the case for polynomial order of 15. Furthermore, it is noteworthy, that certain years can be well described using the standard power law. See the peak for polynomial order one. These years are the solar active years, 1998 through 2002, whose R2 values ranges from 0.2 to 0.9.
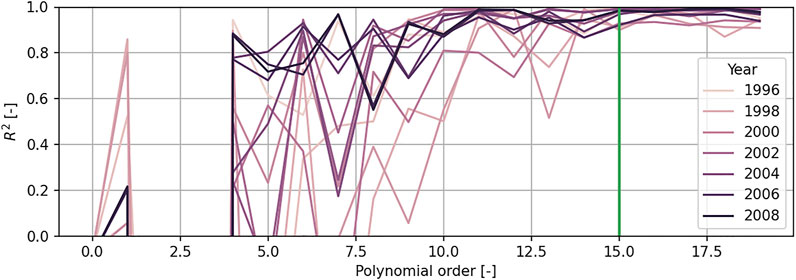
FIGURE 7. R2 plotted over polynomial order of fit. Marked in green is the final chosen order, for which all fitted polynomials provide a R2 of 0.8 or higher.
In Table 1 the created continuous spectra are compared with the ECSS standard models ESP and ISO15930, since they are recommended for qualification testing and thus the active measure. Compared is the energy flux. For energies below 0.1 MeV, ECSS models do not provide any information on the irradiation of satellites. Thus the here introduced continuous spectra are the only spectrum models available for this range. For the chosen higher energy range, ECSS model and the created continuous spectra are in the same order of magnitude but differ due to usage of different models (SAPPHIRE vs. ESP, see also Figure 6 for comparison). For solar minimum, ESP does not provide data. Therefore the energy flux is underestimated. What is remarkable, is that the previously neglected lower energies carry significantly more energy.
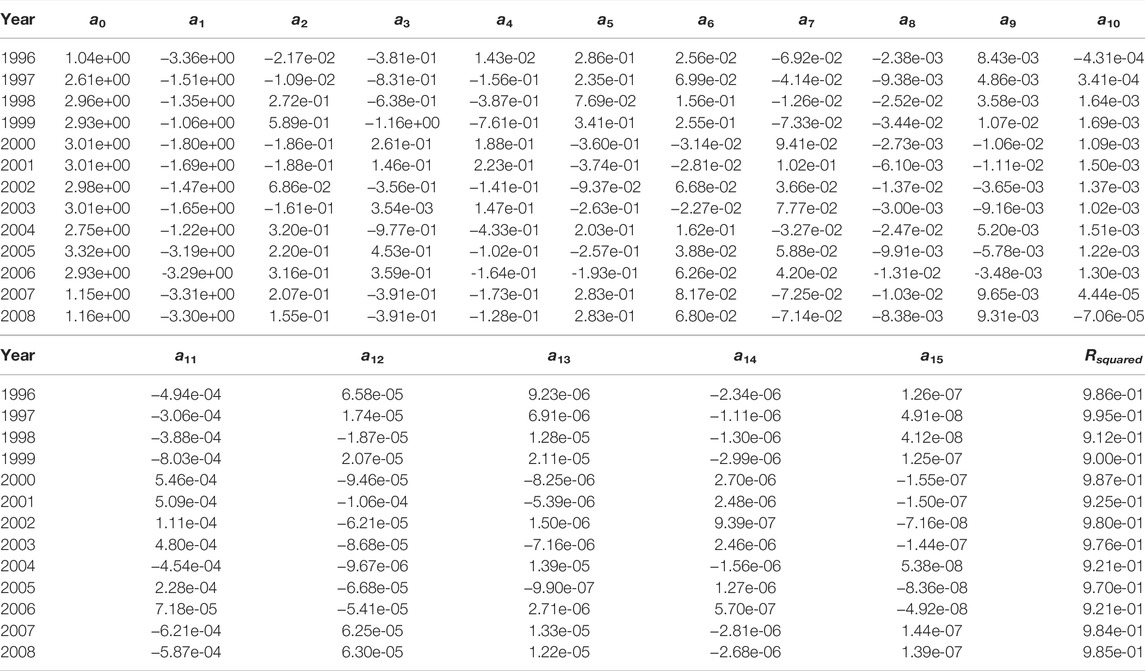
TABLE 1. Fitted parameters for the continuous spectra. The spectra can be reproduced by inserting the fitting parameters into Eq. 2. The parameters are made available online as CSV file. See the Supplemental Materials.

TABLE 2. Comparison of fluencies for low and high energetic proton radiation. The low energy regime contains particle energies up to 100 keV, the high consequently all above this threshold. The low energy regime contains the previously neglected share. For the calculation of the ECSS flux, the recommended ESP and ISO 15390:2004 models have been used.
It shall be determined how many protons do impact on a 60 by 60 mm big functional outer surface of few microns thickness in interplanetary space. The considered energy shall be for instance 1–100 keV, due to higher energies traversing and lower energies being neglected. Further, these are the energies that can be reproduced by the Complex Irradiation Facility (CIF) situated at the German Aerospace Center (DLR) Bremen. See the grey coloured area in Figure 8. Previously the design engineer had no accessible tool to quickly obtain the spectrum and calculated the protons flux. Now, with this spectra available, the fluence can easily be produced and laboratory tests can be commissioned. Using the spectra in Figure 8, the yearly fitted functions are integrated over the coloured area covering the specified energies. Eq. 3 gives than: 1.52 1017 protons with an average energy of 3.58 keV do strike the surface under consideration.
where ΔtM, A and Ω denote the duration, area and solid angle of the setup respectively. Np+ is the total number of protons than. The total energy is calculated by following equation:
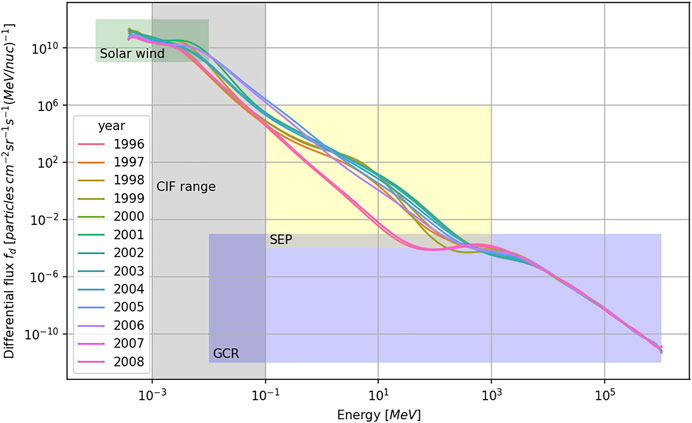
FIGURE 8. Fitted continuous proton spectra for solar cycle 23. Grey coloured is the energy range available by the CIF, operated by the IRS of the DLR Bremen.
Eventually, the average energy is calculated by division of Ep+ by Np+
Given an e.g. 1 μA mono-energetic proton beam current inside of a laboratory test facility, the estimated irradiation duration would be 7.3 days. In terms of throughput time this is long, but feasible. Fluencies in LEO are known to be much lower, due to magnetic shielding, therefore cause shorter irradiation cycles. Fluencies are by one or two magnitude lower here and can be conducted in a fraction of the time. The material damage and alteration can be further investigated afterwards, risks can be better estimated due to experimental validation of material properties. Microscope and spectroscopy measurements before and after can contain statements on the surface deterioration after irradiation.
Solar cycle 23 was chosen for several reasons. First of all, concerning the solar activity, it is a conservative estimate of the average solar activity. Solar cycle 24 was weaker than its predecessor. it is estimated that the following cycle will be similar to solar cycle 23 (SILSO, 2022). Thus, when using the evaluated polynomial parameters, the resulting flux is a good estimate for the average future flux throughout the solar cycle. Secondly, solar wind data is available for this entire time interval of solar cycle 23.
The newly created model extends the available energy range further towards lower energies down to a fraction of keVs. The newly supplied spectrum data can be used to investigate alterations of functional surfaces, such as solar sails, arrays and for instance MLI foil, and conduct qualification testing of these materials. As shown in Table 1, the previously neglected share for surface materials is by several magnitudes bigger than the considered high energetic share. Therefore, for qualification of surfaces, that are directly exposed to the interplanetary radiation environment, the authors propose to use the here included proton spectra.
In the previous section it was shown, that data was successfully fitted to merged partial spectra of various particles sources and their models. For the fitted polynomial of order 15, the minimum coefficient of determination R2 is 0.9 and therefore, the fits can be said to be sufficiently in agreement with the input models. Fitting of ordinary power law returned both, negative and close to 1 R2 values. The energy spectra throughout solar active years, was able to align to the power law, while during quiet time, the decrease in SEP flux increased the deviation from a power law.
The model has build-in deficits, such as the assumptions necessary to connect solar wind and SEP, on which the deviation from the true spectrum is not well known due to sparse available measurements, although publications exist indicating the connecting spectrum has indeed a power-law distribution (Mason and Gloeckler, 2012).
Years 2005 and 2006 show this deficit most dominantly, due to usage of the RDS reference data during quiet years. SAPPHIRE does not provide any data for these years, but the flux provided by the reference data for these years is still at a higher flux level than minimum and covers higher energies than SAPPHIRE does, see Figure 6. Connecting these sections than, RDS and solar wind data, via a simple power law, causes the overestimation of the protons flux between these two. It is unlikely, that the actual proton spectrum matches this shape. This should be kept in mind when using these years and this particular energy range.
Due to the polynomial fitting function, the edges of the fitted range, tend to over- or undershoot, which can be seen in Figure 8 left and right. Therefore, when choosing small energy regimes on the edges, the given flux has to be taken with care. Further the polynomial can under- or overestimate the flux periodically over the energy. This is especially remarkable for the GCR flux. This polynomial characteristic can cause deviations from the input models but is, due to the high coefficient of determination R2, estimated to be of secondary importance.
Clearly the solar active years (1997–2004) can be distinguished from the quiet years. The GCR peak at approx. 1,000 MeV is highest at solar minimum in 2008 and 1996. Conversely, the SEP flux is lowest at the same time. The truncated power law distribution, used by SAPPHIRE to describe the SEP, can clearly be seen during solar active years. The fast solar wind edge is easily detectable.
The here introduced spectra shall give the mission planner an image of the predominant space radiation environment at one AU in dependence of the solar activity for a conservative estimate of the average solar cycle. The proclaimed particle regimes have been merged to allow a fluence estimate just by consulting one model, instead of various different, each with possibly different units and assumptions. The chosen years cover solar maximum and minimum and therefore the entire range of solar activity. Although restricted to one solar cycle, the main purpose of these spectra, to give a sufficient estimate of the chosen energy spectra at a quick glance, is fulfilled. Using the spectra for upcoming solar cycle 25 is valid and a conservative estimate.
Figure 8 clearly shows the drop of SEP flux in its energy range, while both, solar wind and GCR stay approximately constant. Similarly to a skipping rope, the SEP range fluctuates throughout the solar cycle.
Nonetheless, this spectra enables the satellite designer, to pick his range of interest and proceed with it as he wants. For instance, when looking at solar sail alteration due to proton radiation, only the very low energy particles in the range of few keV’s are of interest. This energy range, which has not been available before in the form of a spectrum, can now easily be accessed and further computed or entered as parameters for a simulation using e.g. Geometry and Tracking (GEANT4).
Future development of the framework can be, the depiction of the fitting parameters in dependence of a solar activity parameter such as the Wolf-number. This would enable the mission planner to initially approximate the expected flux density over the energy range of interest by using predictions of the Wolf-number for the time interval of interest. Furthermore, the logarithmic polynomial can be fitted to other environments, such as Earth orbits and Mars or Moon surface radiation spectra.
The original contributions presented in the study are included in the article/Supplementary Material, further inquiries can be directed to the corresponding author.
All authors listed have made a substantial, direct, and intellectual contribution to the work and approved it for publication.
The authors declare that the research was conducted in the absence of any commercial or financial relationships that could be construed as a potential conflict of interest.
All claims expressed in this article are solely those of the authors and do not necessarily represent those of their affiliated organizations, or those of the publisher, the editors and the reviewers. Any product that may be evaluated in this article, or claim that may be made by its manufacturer, is not guaranteed or endorsed by the publisher.
The authors would like to thank Peter Spietz for many fruitful discussions. We acknowledge financial support through the APF project “Materials on Demand” within the “Humans on Mars” Initiative funded by the Federal State of Bremen and the University of Bremen.
The Supplementary Material for this article can be found online at: https://www.frontiersin.org/articles/10.3389/frspt.2022.933340/full#supplementary-material
Abeysekara, A. U., Albert, A., Alfaro, R., Alvarez, C., Camacho, J. R. A., Arteaga-Velázquez, J. C., et al. (2021). HAWC Observations of the Acceleration of Very-High-Energy Cosmic Rays in the Cygnus Cocoon. Nat. Astron. 5, 465–471. doi:10.1038/s41550-021-01318-y
Adams, J. H. J., Garcia-Munoz, M., Grigorov, N. L., Klecker, B., Kondratyeva, M. A., Mason, G. M., et al. (1991). The Charge State of the Anomalous Component of Cosmic Rays. ApJ 375, L45. doi:10.1086/186084
Badhwar, G. D. (2001). Galactic Cosmic Radiation Environment Models. AIP Conf. Proc. 2001, 1179–1184. doi:10.1063/1.1358069
Badhwar, G. D., and O'Neill, P. M. (1992). An Improved Model of Galactic Cosmic Radiation for Space Exploration Missions. Int. J. Radiat. Appl. Instrum. Part D. Nucl. Tracks Radiat. Meas. 20, 403–410. doi:10.1016/1359-0189(92)90024-P
Badhwar, G. D., and O'Neill, P. M. (1996). Galactic Cosmic Radiation Model and its Applications. Adv. Space Res. 17, 7–17. doi:10.1016/0273-1177(95)00507-B
Bell, A. R. (2013). Cosmic Ray Acceleration. Astropart. Phys. 43, 56–70. doi:10.1016/j.astropartphys.2012.05.022
Cane, H. V., Reames, D. V., and von Rosenvinge, T. T. (1988). The Role of Interplanetary Shocks in the Longitude Distribution of Solar Energetic Particles. J. Geophys. Res. 93, 9555. doi:10.1029/JA093iA09p09555
European Cooperation for Space Standardization (2020b). ECSS-E-ST-10-04C Rev.1 – Space Environment (15 June 2020). Tech. Rep.
Feynman, J., Armstrong, T. P., Dao-Gibner, L., and Silverman, S. (1990). New Interplanetary Proton Fluence Model. J. Spacecr. Rockets 27, 403–410. doi:10.2514/3.26157
Feynman, J., Ruzmaikin, A., and Berdichevsky, V. (2002). The JPL Proton Fluence Model: an Update. J. Atmos. Solar-Terrestrial Phys. 64, 1679–1686. doi:10.1016/S1364-6826(02)00118-9
Feynman, J., Spitale, G., Wang, J., and Gabriel, S. (1993). Interplanetary Proton Fluence Model: JPL 1991. J. Geophys. Res. 98, 13281–13294. doi:10.1029/92JA02670
Fisk, L. A., and Gloeckler, G. (2008). Acceleration of Suprathermal Tails in the Solar Wind. Astrophysical J. 686, 1466–1473. doi:10.1086/591543
Gloeckler, G., Fisk, L. A., Mason, G. M., Hill, M. E., Li, G., Hu, Q., et al. (2008). Formation of Power Law Tail with Spectral Index-5 inside and beyond the Heliosphere. AIP Conf. Proc. 2008, 367–374. doi:10.1063/1.2982473
Gloeckler, G., Fisk, L. A., Mason, G. M., Roelof, E. C., and Stone, E. C. (2012). Analysis of Suprathermal Tails Using Hourly-Averaged Proton Velocity Distributions at 1 AU. AIP Conf. Proc., 136–143. doi:10.1063/1.4723601
Glover, A., Hilgers, A., Rosenqvist, L., and Bourdarie, S. (2008). Interplanetary Proton Cumulated Fluence Model Update. Adv. Space Res. 42, 1564–1568. doi:10.1016/j.asr.2007.08.023
Gueymard, C. A. (2004). The Sun's Total and Spectral Irradiance for Solar Energy Applications and Solar Radiation Models. Sol. Energy 76, 423–453. doi:10.1016/j.solener.2003.08.039
International Organization for Standardization (2004). ISO 15390:2004 Space Environment (Natural and Artificial) — Galactic Cosmic Ray Model. Tech. Rep. 2004, 15390.
Isenberg, P. A. (1987). Evolution of Interstellar Pickup Ions in the Solar Wind. J. Geophys. Res. 92, 1067. doi:10.1029/JA092iA02p01067
Jiggens, P. T. A., Gabriel, S. B., Heynderickx, D., Crosby, N., Glover, A., and Hilgers, A. (2011). “ESA SEPEM Project: Peak Flux and Fluence Model,” in 2011 12th European Conference on Radiation and Its Effects on Components and Systems. Editor I. Staff (Piscataway, NJ, USA: IEEE), 549–564. doi:10.1109/RADECS.2011.6131436
Jiggens, P., Varotsou, A., Truscott, P., Heynderickx, D., Lei, F., Evans, H., et al. (2018). The Solar Accumulated and Peak Proton and Heavy Ion Radiation Environment (SAPPHIRE) Model. IEEE Trans. Nucl. Sci. 65, 698–711. doi:10.1109/TNS.2017.2786581
Jokipii, J. R., and Giacalone, J. (1998). The Theory of Anomalous Cosmic Rays. Space Sci. Rev. 83, 123–136. doi:10.1023/A:100507762987510.1007/978-94-017-1189-0_11
Jun, I., Swimm, R. T., Ruzmaikin, A., Feynman, J., Tylka, A. J., and Dietrich, W. F. (2007). Statistics of Solar Energetic Particle Events: Fluences, Durations, and Time Intervals. Adv. Space Res. 40, 304–312. doi:10.1016/j.asr.2006.12.019
Kallenrode, M.-B. (2003). Current Views on Impulsive and Gradual Solar Energetic Particle Events. J. Phys. G. Nucl. Part. Phys. 29, 965–981. doi:10.1088/0954-3899/29/5/316
Kazama, Y., and Goka, T. (2008). A New Modeling Method of Solar Energetic Proton Events for ISO Specification. Adv. Space Res. 42, 1293–1299. doi:10.1016/j.asr.2007.12.012
King, J. H. (1974). Solar Proton Fluences for 1977-1983 Space Missions. J. Spacecr. Rockets 11, 401–408. doi:10.2514/3.62088
Mason, G. M., and Gloeckler, G. (2012). Power Law Distributions of Suprathermal Ions in the Quiet Solar Wind. Space Sci. Rev. 172, 241–251. doi:10.1007/s11214-010-9741-0
Matthiä, D., Berger, T., Mrigakshi, A. I., and Reitz, G. (2013). A Ready-To-Use Galactic Cosmic Ray Model. Adv. Space Res. 51, 329–338. doi:10.1016/j.asr.2012.09.022
McCracken, K. G. (2004). A Phenomenological Study of the Long-Term Cosmic Ray Modulation, 850-1958 AD. J. Geophys. Res. 109. doi:10.1029/2004JA010685
Nymmik, R. A. (2007). Improved Environment Radiation Models. Adv. Space Res. 40, 313–320. doi:10.1016/j.asr.2006.12.028
Nymmik, R. A., Panasyuk, M. I., Pervaja, T. I., and Suslov, A. A. (1992). A Model of Galactic Cosmic Ray Fluxes. Int. J. Radiat. Appl. Instrum. Part D. Nucl. Tracks Radiat. Meas. 20, 427–429. doi:10.1016/1359-0189(92)90028-T
Nymmik, R. A., Panasyuk, M. I., and Suslov, A. A. (1996). Galactic Cosmic Ray Flux Simulation and Prediction. Adv. Space Res. 17, 19–30. doi:10.1016/0273-1177(95)00508-C
O'Neill, P. M. (2010). Badhwar-O'Neill 2010 Galactic Cosmic Ray Flux Model-Revised. IEEE Trans. Nucl. Sci. doi:10.1109/TNS.2010.2083688
O’Neill, P. M. (2006). Badhwar-O'Neill Galactic Cosmic Ray Model Update Based on Advanced Composition Explorer (ACE) Energy Spectra from 1997 to Present. Adv. Space Res. 37, 1727–1733. doi:10.1016/j.asr.2005.02.001
O’Neill, P. M., Golge, S., and Slaba, T. C. (2015). Badhwar–O’Neill 2014 Galactic Cosmic Ray Flux Model.
Rosenqvist, L., Hilgers, A., Evans, H., Daly, E., Hapgood, M., Stamper, R., et al. (2005). Toolkit for Updating Interplanetary Proton Cumulated Fluence Models. J. Spacecr. Rockets 42, 1077–1090. doi:10.2514/1.8211
[Dataset] Royal Belgian Institute for Space Aeronomy (2018). Spenvis Documentation. Uccle, Belgium: Royal Belgian Institute for Space Aeronomy.
[Dataset] SILSO (2022). World Data Center for the Production, Preservation and Dissemination of the International Sunspot Number. Bedford, UK: SILSO.
Slaba, T. C., and Whitman, K. (2020). The Badhwar‐O'Neill 2020 GCR Model. Space weather. 18. doi:10.1029/2020SW002456
Stassinopoulos, E. G. (1975). SOLPRO: A Computer Code to Calculate Probabilistic Energetic Solar Proton Fluences.
[Dataset] Sznajder, M. (2021). Personal Communication: Solar Wind H+ Fluxes at 1 AU for Solar Cycles 23 and 24.
Sznajder, M., Seefeldt, P., Spröwitz, T., Renger, T., Kang, J. H., Bryant, R., et al. (2020). Solar Sail Propulsion Limitations Due to Hydrogen Blistering. Adv. Space Res.
The Pierre Auger Collaboration (2017). Observation of a Large-Scale Anisotropy in the Arrival Directions of Cosmic Rays above 8 × 10¹⁸ eV. Science 357, 1266–1270. doi:10.1126/science.aan4338
Tylka, A. J., Adams, J. H., Boberg, P. R., Brownstein, B., Dietrich, W. F., Flueckiger, E. O., et al. (1997). CREME96: A Revision of the Cosmic Ray Effects on Micro-electronics Code. IEEE Trans. Nucl. Sci. 44, 2150–2160. doi:10.1109/23.659030
Vipindas, V., Gopinath, S., and Girish, T. E. (2018). A Study on the Variations in Long-Range Dependence of Solar Energetic Particles during Different Solar Cycles. Proc. IAU 13, 47–48. doi:10.1017/S1743921318001692
von Steiger, R., Schwadron, N. A., Fisk, L. A., Geiss, J., Gloeckler, G., Hefti, S., et al. (2000). Composition of Quasi-Stationary Solar Wind Flows from Ulysses/Solar Wind Ion Composition Spectrometer. J. Geophys. Res. 105, 27217–27238. doi:10.1029/1999JA000358
Xapsos, M. A., Barth, J. L., Stassinopoulos, E. G., Burke, E. A., and Gee, G. B. (1999a). Space Environment Effects: Model for Emission of Solar Protons (ESP)–Cumulative and Worst-Case Event Fluences. Washington, DC: NASA Center for Aerospace Information.
Xapsos, M. A., Summers, G. P., Barth, J. L., Stassinopoulos, E. G., and Burke, E. A. (2000). Probability Model for Cumulative Solar Proton Event Fluences. IEEE Trans. Nucl. Sci. 47, 486–490. doi:10.1109/23.856469
Xapsos, M. A., Summers, G. P., Barth, J. L., Stassinopoulos, E. G., and Burke, E. A. (1999b). Probability Model for Worst Case Solar Proton Event Fluences. IEEE Trans. Nucl. Sci. 46, 1481–1485. doi:10.1109/23.819111
Keywords: interplanetary radiation, SEP, GCR, protons, qualification testing, material engineering, solar wind
Citation: Klein EM, Sznajder M and Seefeldt P (2022) Proton Spectra for the Interplanetary Space Derived From Different Environmental Models. Front. Space Technol. 3:933340. doi: 10.3389/frspt.2022.933340
Received: 30 April 2022; Accepted: 30 May 2022;
Published: 15 July 2022.
Edited by:
Yukihito Kitazawa, Japan Aerospace Exploration Agency (JAXA), JapanReviewed by:
Tateo Goka, Japan Aerospace Exploration Agency (JAXA), JapanCopyright © 2022 Klein, Sznajder and Seefeldt. This is an open-access article distributed under the terms of the Creative Commons Attribution License (CC BY). The use, distribution or reproduction in other forums is permitted, provided the original author(s) and the copyright owner(s) are credited and that the original publication in this journal is cited, in accordance with accepted academic practice. No use, distribution or reproduction is permitted which does not comply with these terms.
*Correspondence: E. M. Klein, ZXJpay5rbGVpbkB1bmktYnJlbWVuLmRl
Disclaimer: All claims expressed in this article are solely those of the authors and do not necessarily represent those of their affiliated organizations, or those of the publisher, the editors and the reviewers. Any product that may be evaluated in this article or claim that may be made by its manufacturer is not guaranteed or endorsed by the publisher.
Research integrity at Frontiers

Learn more about the work of our research integrity team to safeguard the quality of each article we publish.