 Dimitrios Tsifakis
 Christine Charles
 Rod Boswell
95% of researchers rate our articles as excellent or good
Learn more about the work of our research integrity team to safeguard the quality of each article we publish.
Find out more
ORIGINAL RESEARCH article
Front. Space Technol. , 27 April 2021
Sec. Space Propulsion
Volume 2 - 2021 | https://doi.org/10.3389/frspt.2021.632358
Reliable measurements of thrust from systems to be flown on satellites are essential to ensure repeatable maneuvering capability of small nanosatellites. Thrusters can be used to vary spacecraft orientation, detumbling, and orbit change. Tests have been conducted in a low-pressure vacuum system using a cold gas prototype thruster and two independently calibrated methods: a four-point pendulum with a laser interferometer displacement sensor and a load cell, both of which have measurement capabilities from tens of micronewtons to tens of millinewtons. The agreement is very good, lending confidence in both methods. The advantages and disadvantages of both methods will be discussed. They include absolute accuracy, low thrust accuracy, temporal resolution, simplicity of operation, cost, and sensitivity to vibrations generated by laboratory equipment such as pumps, fans, bumps, and human movement.
Small satellites having unit dimensions of
One of the most typical techniques used for thrust measurement involves the concept of the pendulum. In its simplest form, a pendulum thrust balance can be based on a hanging pendulum (Charles et al., 2016; Wong et al., 2012), an inverted pendulum (Haag, 1991; Kokal and Celik, 2017; Asakawa et al., 2020), or be a torsional balance (Ziemer, 2001; Zhou et al., 2013; Soni and Roy, 2013; Little and Jugroot, 2019; Tang et al., 2011; Zhang et al., 2017). There are also more complicated implementations of this, such as the stand for vertically oriented thrust measurement system described in Moeller and Polzin (2010). In all cases, the application of thrust results in a displacement which is a function of the thrust. The displacement is commonly measured with a laser interferometer or a linear differential voltage transformer (LDVT). The theory of operation of all of these methods is described in detail by Polk et al. (2017). In order to keep the test platform stable and horizontal, it is common to attach rigid arms with metallic flexures at both ends, to each corner of a rectangular plate; the other end of the arms is fixed some distance vertically above. The metallic flexures are oriented such that the movement caused by the action of the thruster is allowed. Together with gravity, the flexures contribute to the restoring force of the pendulum. When the thruster is activated, the distance away from the normal can be determined with a laser interferometer and when correctly calibrated, yields a thrust proportional to displacement. The sensitivity of the system is proportional to the suspended mass, which includes the mass of the thruster under test. An elementary characteristic of a pendulum is that it will oscillate, and given that there is no air friction in vacuum, it may take a very long time for the system to come to rest. These oscillations can be damped actively using solenoids or simply with a magnet generating eddy currents in a metal tube. An alternative to using the displacement of a pendulum for thrust measurement is placing a solenoid and a magnet in a feedback loop which supplies the current required to prevent all motion. In this case, the force of the thruster will be proportional to the current through the solenoid necessary to prevent movement. A benefit of this method is that the natural frequency of the pendulum does not affect the measured values; however, the measurement bandwidth will be limited by the frequency of the feedback loop.
An indirect method of measuring thrust consists in measuring the momentum flux of the exhausted material impinging on a target placed near the exhaust of the thruster. The force measured on the target together with modeling of the exhaust plume of the thruster can then be used to infer the thrust produced by the thruster under test. In this method, care needs to be taken to ensure the target does not interfere with the normal operation of the thruster. Typical measurements of momentum thrust have been performed by Chavers and Chang-Díaz (2002), West et al. (2009), and Takahashi et al. (2015), the latter containing a comparison between direct and indirect thrust measurements, concluding in this case that the two methods produce very similar results.
Load cells are force to electrical signal converters, also known as force transducers or force sensors. They are frequently found in electronic scales measuring weight, and they have a range varying from micrograms to tons. They are commonly used to measure thrust from conventional chemical rockets. They can also be used to measure thrust from microthrusters producing less than a millinewton of thrust. One way to achieve thrust measurement using a load cell is to construct a standard weight scale and place the thruster on it with the nozzle facing up (gravitational force is parallel to the thrust force and has the same sign). Since the thruster exhaust faces up, the scale will record an increase in the measured value when the thruster is switched on, which is equal to the thrust. Examples of such thrust stand are given by Conde et al. (2020) and Karadag et al. (2018). The disadvantage of this method is that the measurement system must be able to measure the weight of the thruster FW, which is typically many orders of magnitude larger than the thrust FT. The selected load cell must be capable of supporting and measuring FW, which results in decreased resolution when measuring thrust in the submillinewton range.
A strain gauge or a load cell can also be used to measure the thrust directly in a pendulum stand. Examples of such application have been published for torsional pendulums (Frieler and Groll, 2018) and inverted pendulums (Stephen et al., 2001). The present study describes the direct thrust measurement taken by using a load cell in a conventional hanging pendulum, where the thruster is placed in the hanging pendulum thrust stand and a load cell is placed between the pendulum and a rigid point, along the axis of expected pendulum movement when the thrust force is applied. Measuring the thrust directly instead of measuring the displacement has the advantage that the sensitivity of the metering system is not as strongly dependent on the mass of the thruster that is suspended on the hanging pendulum. This is due to the fact that the movement of the pendulum when configured with the load cell is much less than when it is configured with the laser system. When measuring displacement, the deflection angle θ (and therefore the displacement) caused by a thrust FT from a pendulum with a combined suspended mass m causing a gravity force
The hanging pendulum with the load cell configuration can be seen diagrammatically in Figure 1. The load cell is equipped with an adjustment screw which is rotated until contact is made with the pendulum. The pendulum is pushed away from its rest position, and it applies a force to the load cell. The screw is then further adjusted until the measured force is about half of the maximum force allowed on the load cell, allowing enough headroom for the expected thrust. This allows the use of a very sensitive load cell with a low maximum force, which is more suitable for submillinewton measurements. In the present study, thrust is generated and controlled using a well-studied cold gas thruster using argon as the propellant (Ho et al., 2017).
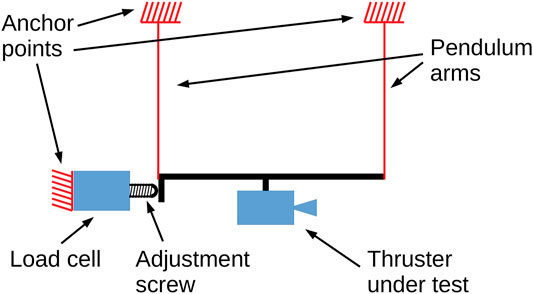
FIGURE 1. Diagram of thrust balance configured for measurements using the load cell. Only two out of the four pendulum arms are shown. The adjustment screw is firmly attached to the load cell, and it is extended until contact is made with the pendulum frame. It is then extended a second time until the indication on the load cell shows approximately half of its rated full force.
The thrust measurements were conducted in the Wombat space simulation chamber (Charles et al., 2016; Charles et al., 2013) shown in Figure 2, comprising a 1 m diameter, 2 m long vacuum chamber fitted with a dry vacuum pumping system (scroll, turbomolecular, and cryogenic pumps) along with a suite of access and viewing ports for space qualification testing. The vessel is pumped down to a base pressure of about 10−6 using the 70 m3/h scroll and 1,800 l/s turbomolecular pumps but not the cryogenic pump. Wombat is routinely used for the experimental testing of various types of thrusters and their propellant and electric subsystems (Tsifakis et al., 2020) and is equipped with a thrust balance validated in-house (Charles et al., 2013; Charles et al., 2016) and in a number of laboratories (Pottinger et al., 2011; Takahashi et al., 2011).
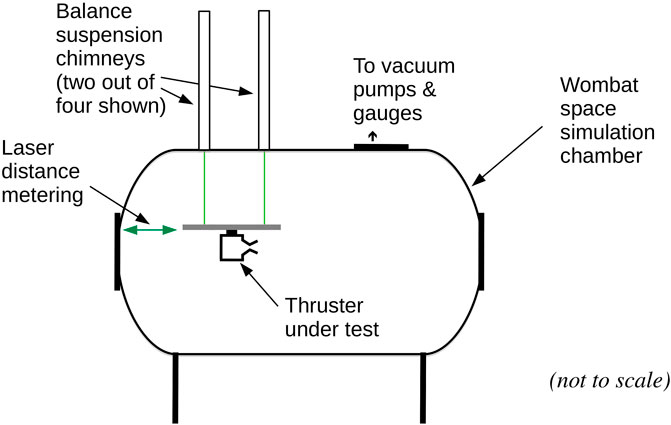
FIGURE 2. Diagram of the laser distance metering (interferometer) thrust balance in the Wombat space simulation chamber. The cold gas thruster is shown suspended on the balance.
An electrically grounded chassis can be suspended from the top of 4 ‘chimneys’ and either be made to act as a thrust balance or be locked onto the vacuum vessel. The thrust balance consists of a four-arm pendulum suspended frame with the thruster being mounted on the frame. In operation, the thruster produces a displacement from the rest position, which is proportional to the thrust force, which can be measured by an ILD7100 laser triangulation displacement sensor with a resolution of
The argon cold gas thruster used for the tests consists of a 4 mm inner diameter ceramic tube which is fed with a user selectable argon flow rate. The argon is stored in a pressure cylinder located outside the vacuum chamber, and the flow is controlled by using an Alicat Scientific mass flow controller. The mass flow rates used in this experiment range from 25 to 200 SCCM and result in choked flow conditions, as described in Ho et al. (2017) and Tsifakis et al. (2020). A calibration measurement is done at the beginning and end of each measurement campaign to ensure that the correct translation is performed from displacement to thrust, taking into account the exact mass of the thruster as installed for the measurement.
When a constant force is applied to the frame by the thruster, the pendulum moves from its rest position and starts oscillating with a period of about 1 s, which can be damped over a few seconds using a magnet attached to the balance moving in a copper tube. The typical effect of the magnetic damper can be seen in Figure 3, where the cold gas thruster is setup to perform two 20 S burns at 500 SCCM, followed by two burns at 200 SCCM. The top trace (green) shows the interferometer output with the damper removed from the balance, exhibiting a constant oscillation at the pendulum’s resonant frequency, which is about 1 Hz. The bottom trace (purple) shows the same thruster sequence with the damper installed. In this case, the oscillation is mostly dampened quickly with a damping factor
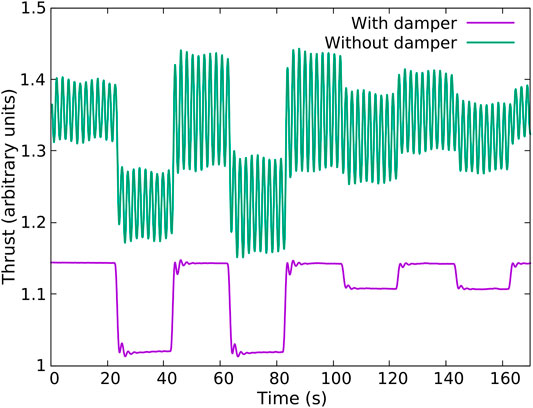
FIGURE 3. Effect of the magnetic damper when used in the laser interferometer pendulum. The top trace (purple) was recorded without the damper, and the bottom trace (green) was recorded with the damper configuration. In both cases, the cold gas thruster on the stand was setup to do two 20 s burns at 500 SCCM, followed by two 20 s burns at 200 SCCM. In both cases, the sampling is set to 312.5 Hz, with a moving average depth of 256.
To evaluate the direct thrust measurement performance of a load cell, the Wombat thrust balance was modified as follows. A load cell was removed from a diamond pocket scale, which is a low-cost jeweler’s scale, purchased online. There were no identifying marks on the load cell, making it impossible to get further information from the manufacturer. However, an assessment of the range and resolution could be made from the advertised properties of the scale. The scale had an advertised maximum allowed weight of 20 g and a resolution of 1 µg. The force FW resulting from the mass m placed on the scale due to gravity could be calculated by using the formula
The amplifier/digitizer was installed inside the Wombat vacuum chamber, very close to the load cell, in order to minimize electrical noise pickup. Although a cold gas thruster does not produce any direct electrical interference, in a lab environment, there are many sources of conducted and radiated noise including large electric motors, switched mode power supplies, and apparatus using radio frequency (RF). A photo of the load cell installation can be seen in Figure 4, where the load cell can be seen (center of photo) rigidly attached to the chamber via an L-bracket on its right side. On the left side of the load cell, the screw that allows precise contact with the pendulum frame is seen. The purpose of the screw is to allow for a high level of control over the preloading of the load cell by pushing against the pendulum. In the photo, the amplifier/digitizer can also be seen on the right side. The digital signals are routed outside the chamber via appropriate feedthrough connectors and are read by using an external microcontroller. The microcontroller is programmed to read the load cell values at a constant rate limited to 10 samples per second by the digitizer and to make them available via a serial port to a computer. The existing calibration system, used for the interferometer calibration and described earlier, was also used to perform the calibration for the load cell.
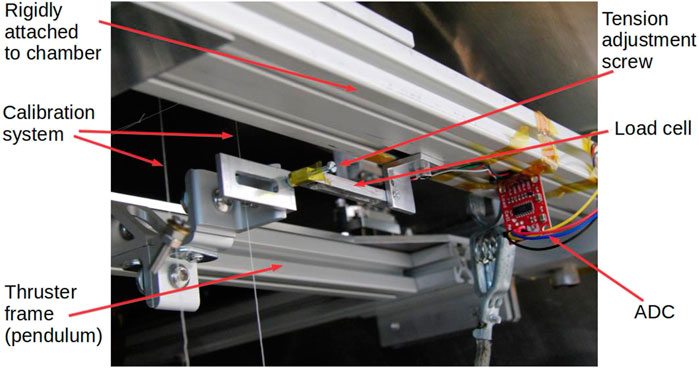
FIGURE 4. Photo of the load cell installed on the thrust balance. In this photo, the load cell can be seen in the center. The right side of the load cell is rigidly connected to the chamber via an L-bracket, and the left end touches the hanging pendulum via an adjustable screw. The load cell amplifier/digitizer red printed circuit board can be seen in the middle right of the photo. Part of the calibration mechanism can be seen in the middle left of the photo.
Before beginning the comparison of the two systems (load cell and laser interferometer) with an operating thruster, measurements of noise were conducted with the thruster installed but with no gas flowing. In both cases, a
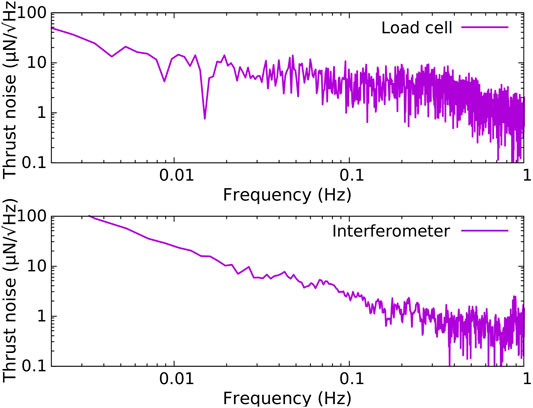
FIGURE 5. Comparison between the noise spectrum of the load cell (top plot) and that of the laser interferometer (bottom plot). It can be seen that the thrust noise of the load cell is generally higher than that of the interferometer, except for frequencies below
A
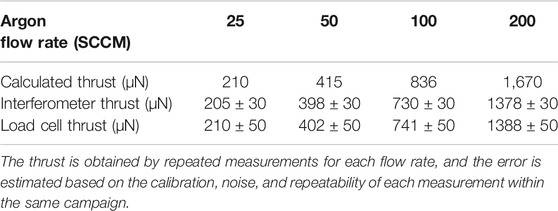
TABLE 1. Resulting thrust from argon flow rates used in this experiment.
The 30 s step duration was selected to allow the pendulum to settle for an accurate measurement of the thrust. This sequence was repeated for approximately 30 h, and the resulting data are shown in Figure 6. In this figure, the interferometer data (top green trace) appear to be drifting slowly during the measurement. This effect, known as zero drift, is likely caused by temperature changes throughout the measurement. The load cell data (bottom purple trace) exhibit limited zero drift, despite not being temperature compensated. This behavior is typical of the observations derived from using both systems for an extended period of time in the laboratory.
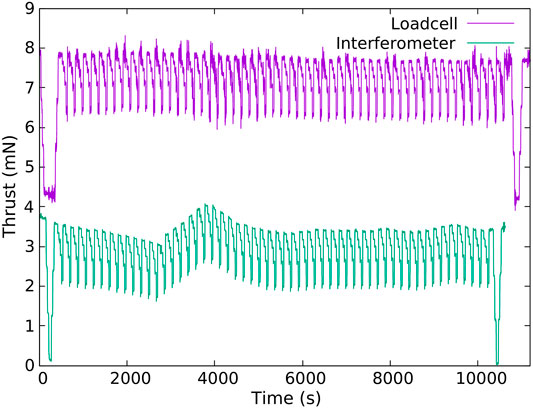
FIGURE 6. Zero drift comparison between the load cell and laser interferometer thrust measurements. In this figure a
Figure 7 focuses on a few periods of the repeated measurement cycle. As expected, the laser interferometer (top green trace) exhibits less noise compared to the load cell (bottom purple trace) by roughly a factor of two. The noise behavior is consistent in the laser interferometer and in part can be reliably traced to changes in the vicinity of the chamber, such as people walking around the laboratory (floor deformation) or the laboratory door being opened. These actions also have a measurable effect on the load cell measurement; however, there are additional noise events which cannot be linked to known external factors and appear at seemingly random points throughout the recording. Such an event can be seen in Figure 7, around
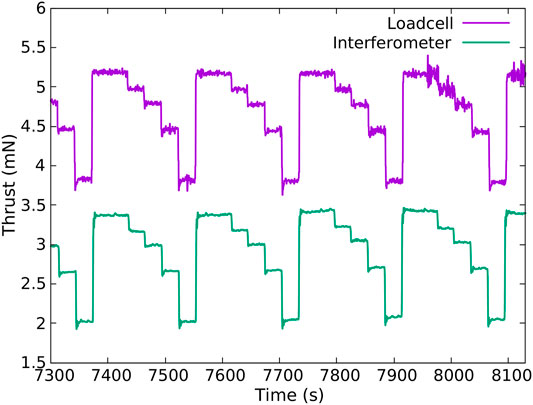
FIGURE 7. Comparison between the load cell and laser interferometer thrust measurements. This figure focuses on the data shown in Figure 6, showing four cycles of the 0-25-50-100-200-0 SCCM cold gas argon thruster sequence. It can be seen that the noise in the load cell measurement (top trace, purple) is higher roughly by a factor of two than that in the laser system (bottom trace, green). It can also be seen that the load cell can suddenly suffer increased noise (as seen in the plot around 8,000 s); however, this has little effect in a repeated measurement.
Figure 8 shows a single episode of this sudden noise. This example is typical of this type of noise and happens at a time when there is no change in the applied force on the balance. The working hypothesis on the origin of this noise is that it is the result of a ‘micro-slip’ at the contact boundary between the load cell adjustment screw and the pendulum scale (Figures 1, 4). This process resembles that of an earthquake produced when the two sides of a geological fault suddenly slip laterally, commonly called a ‘strike-slip’.
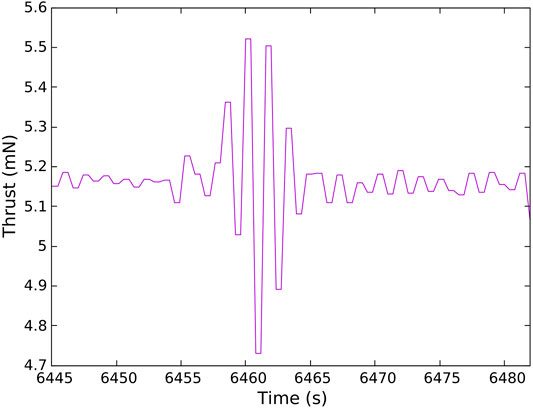
FIGURE 8. Focus on a ‘microslip.’ This figure shows a typical sudden noise observation which happens at a time when there is no change in the forces applied to the load cell from the thruster. It is believed to be a ‘microslip,’ occurring when the forces at the load cell–pendulum contact boundary are unbalanced and the net force suddenly overcomes the friction at the contact point between the load cell and the pendulum. This is a process that resembles an earthquake induced along a fault line.
The experiment presented in this paper involves a cold gas thruster. In order to use this technique with other types of thrusters, the thrust balance designer needs to consider the thermal and electromagnetic compatibility of the thruster and the load cell. In particular, thrusters such as plasma thrusters may produce excessive heat during operation, which will affect the measurements of a non–temperature-compensated load cell. Any RF plasma thruster or other pulsed thrusters can cause electromagnetic interference (EMI) which, if picked up by the load cell amplifier, can result in increased measurement noise. Plasma thrusters tested in a vacuum chamber can create a low-density plasma which may result in corrosion of the load cell and associated electronics. In all these cases, the thrust balance designer will have to supply appropriate shielding to minimize the heat and electrical noise pickup and the plasma-induced damage. In part, better load cell protection can be achieved by the installation of the load cell and associated electronics as far away as practical from the thruster being tested.
This paper has presented an alternative thrust measurement system for a hanging pendulum thrust stand based on a low-cost load cell. Its performance is directly compared to the more typical system of measuring the induced displacement of the pendulum by the thruster using a laser interferometer. While the laser system still has the advantage of lower noise by roughly a factor of two, the load cell was found to exhibit less zero drift despite not having temperature compensation. It also has a considerably lower cost than the interferometer, making it a viable alternative, especially for thrust measurements in the range of hundreds of micronewtons. Another advantage is that the load cell–based stand sensitivity is not as dependent on the suspended mass (weight), unlike the displacement measuring system. Alternative load cells can be utilized to modify the measurement range, if that is required. The load cell system was found to suffer from seemingly random breakouts of noise; however, this does not affect the result of a repeated measurement.
The original contributions presented in the study are included in the article/Supplementary Material; further inquiries can be directed to the corresponding author.
The work presented in this paper is DT’s student work and has been supervised by CC and RB. All authors contributed to the article and approved the submitted version.
The authors declare that the research was conducted in the absence of any commercial or financial relationships that could be construed as a potential conflict of interest.
Asakawa, J., Nishii, K., Nakagawa, Y., Koizumi, H., and Komurasaki, K. (2020). Direct Measurement of 1-mN-Class Thrust and 100-S-Class Specific Impulse for a CubeSat Propulsion System. Rev. Sci. Instr. 91, 035116. doi:10.1063/1.5121411
Bonin, B., Roth, N., Armitagee, S., Newman, J., Zee, B. R,, Robert, E., et al. (2015). “CanX-4 and CanX-5 Precision Formation Flight: Mission Accomplished!,” in Proceedings of the 29th Annual AIAA/USU Conference on Small Satellites, Logan, Utah, July 31 2015. doi:10.1039/c3tc30232f
California Polytechnic State University (2014). Cubesat Design Specification Rev. 13. Available at: http://www.cubesat.org/s/cds{\_}rev13{\_}final2.pdf.
Charles, C., Boswell, R. W., and Bish, A. (2013). Variable Frequency Matching to a Radiofrequency Source Immersed in Vacuum. J. Phys. D: Appl. Phys. 46, 365203. doi:10.1088/0022-3727/46/36/365203
Charles, C., Boswell, R. W., Bish, A., Khayms, V., and Scholz, E. F. (2016). Direct Measurement of Axial Momentum Imparted by an Electrothermal Radiofrequency Plasma Micro-Thruster. Front. Phys. 4, 19. doi:10.3389/fphy.2016.00019
Chavers, D. G., and Chang-Díaz, F. R. (2002). Momentum Flux Measuring Instrument for Neutral and Charged Particle Flows. Rev. Sci. Instr. 73, 3500–3507. doi:10.1063/1.1505107
Conde, L., Lahoz, M. D., Grabulosa, J., Hernández, R., González, J., Delgado, M., et al. (2020). Thrust Stand Based on a Single Point Load Cell for Impulse Measurements from Plasma Thrusters. Rev. Sci. Instr. 91, 023308. doi:10.1063/1.5127189
Frieler, T., and Groll, R. (2018). A Torsional Sub-milli-Newton Thrust Balance Based on a Spring Leaf Strain Gauge Sensor. Rev. Scientific Instr., 89, 075101. doi:10.1063/1.4996419
Haag, T. W. (1991). Thrust Stand for High‐power Electric Propulsion Devices. Rev. Sci. Instr. 62, 1186–1191. doi:10.1063/1.1141998
Ho, T. S., Charles, C., Teck, S. H., Roderick, W., and Boswell, (2017). A Comprehensive Cold Gas Performance Study of the Pocket Rocket Radiofrequency Electrothermal Microthruster. Front. Phys. doi:10.3389/fphy.2016.00055
Karadag, B., Cho, S., and Funaki, I. (2018). Note: Precision Balance for Sub-miliNewton Resolution Direct Thrust Measurement. Rev. Sci. Instr. 89, 086108. doi:10.1063/1.5045855
Kokal, U., and Celik, M. (2017). “Development of a Mili-Newton Level Thrust Stand for Thrust Measurements of Electric Propulsion Systems,” in Proceedings of 8th International Conference on Recent Advances in Space Technologies, Istanbul, Turkey, June 2017. doi:10.1109/RAST.2017.8002970
Kramer, A., Bangert, P., and Schilling, K. (2020). UWE-4: First Electric Propulsion on a 1U CubeSat-In-Orbit Experiments and Characterization. Aerospace 7, 98. doi:10.3390/aerospace7070098
Kulu, E. (2019). Nanosat Database. Available at: https://www.nanosats.eu.(Accessed April 4, 2021).
Little, B., and Jugroot, M. (2019). Development of a Microthrust Balance and Ion Beam Measurement System: Characterizing a Dual-Mode Thruster for Spacecraft. Vacuum 164, 367–380. doi:10.1016/j.vacuum.2019.01.031
Moeller, T., and Polzin, K. A. (2010). Thrust Stand for Vertically Oriented Electric Propulsion Performance Evaluation. Rev. Sci. Instr. 81, 115108. doi:10.1063/1.3502463
Polk, J. E., Pancotti, A., Haag, T., King, S., Walker, M., Blakely, J., et al. (2017). Recommended Practice for Thrust Measurement in Electric Propulsion Testing. J. Propuls. Pow. 33, 539–555. doi:10.2514/1.B35564
Pottinger, S., Lappas, V., Charles, C., and Boswell, R. (2011). Performance Characterization of a Helicon Double Layer Thruster Using Direct Thrust Measurements. J. Phys. D: Appl. Phys. 44, 235201. doi:10.1088/0022-3727/44/23/235201
Soni, J., and Roy, S. (2013). Design and Characterization of a Nano-Newton Resolution Thrust Stand. Rev. Sci. Instr. 84, 095103. doi:10.1063/1.4819252
Stephen, R. J., Rajanna, K., Dhar, V., Kumar, K. G. K., and Nagabushanam, S. (2001). Strain Gauge Based Thrust Measurement System for a Stationary Plasma Thruster. Meas. Sci. Technol. 12, 1568–1575. doi:10.1088/0957-0233/12/9/324
Takahashi, K., Lafleur, T., Charles, C., Alexander, P., Boswell, R. W., Perren, M., et al. (2011). Direct Thrust Measurement of a Permanent Magnet Helicon Double Layer Thruster. Appl. Phys. Lett. 98, 141503. doi:10.1063/1.3577608
Takahashi, K., Komuro, A., and Ando, A. (2015). Measurement of Plasma Momentum Exerted on Target by a Small Helicon Plasma Thruster and Comparison with Direct Thrust Measurement. Rev. Sci. Instr. 86, 023505. doi:10.1063/1.4907797
Tang, H., Shi, C., Zhang, X. a., Zhang, Z., and Cheng, J., (2011). Pulsed Thrust Measurements Using Electromagnetic Calibration Techniques. Rev. Sci. Instr. 82 (3), 035118. doi:10.1063/1.3567803
Tsifakis, D., Charles, C., and Boswell, R. (2020). An Inductively-Coupled Plasma Electrothermal Radiofrequency Thruster. Front. Phys. 8, 34. doi:10.3389/fphy.2020.00034
West, M. D., Charles, C., and Boswell, R. W. (2009). A High Sensitivity Momentum Flux Measuring Instrument for Plasma Thruster Exhausts and Diffusive Plasmas. Rev. Sci. Instr. 80, 053509. doi:10.1063/1.3142477
Wong, A. R., Toftul, A., Polzin, K. A., and Pearson, J. B. (2012). Non-contact Thrust Stand Calibration Method for Repetitively Pulsed Electric Thrusters. Rev. Sci. Instr. 83, 025103. doi:10.1063/1.3680557
Zhang, Z., Ren, J., Tang, H., Ling, W. Y. L., York, T. M., and York, (2017). An Ablative Pulsed Plasma Thruster with a Segmented Anode. Plasma Sourc. Sci. Technol. 27 (1), 015004. doi:10.1088/1361-6595/aa9e6b
Zhou, W.-J., Hong, Y.-J., and Chang, H. (2013). A microNewton Thrust Stand for Average Thrust Measurement of Pulsed Microthruster. Rev. Sci. Instr. 84, 125115. doi:10.1063/1.4850637
Keywords: thrust measurement, propulsion, cubesat, load cell, thruster
Citation: Tsifakis D, Charles C and Boswell R (2021) Comparison of Submillinewton Thrust Measurements Between a Laser Interferometer and a Load Cell on a Pendulum Balance. Front. Space Technol. 2:632358. doi: 10.3389/frspt.2021.632358
Received: 23 November 2020; Accepted: 29 March 2021;
Published: 27 April 2021.
Edited by:
Robert LeMoyne, Northern Arizona University, United StatesReviewed by:
Haibin Tang, Beihang University, ChinaCopyright © 2021 Tsifakis, Charles and Boswell. This is an open-access article distributed under the terms of the Creative Commons Attribution License (CC BY). The use, distribution or reproduction in other forums is permitted, provided the original author(s) and the copyright owner(s) are credited and that the original publication in this journal is cited, in accordance with accepted academic practice. No use, distribution or reproduction is permitted which does not comply with these terms.
*Correspondence: Dimitrios Tsifakis, RGltaXRyaW9zLlRzaWZha2lzQGFudS5lZHUuYXU=
Disclaimer: All claims expressed in this article are solely those of the authors and do not necessarily represent those of their affiliated organizations, or those of the publisher, the editors and the reviewers. Any product that may be evaluated in this article or claim that may be made by its manufacturer is not guaranteed or endorsed by the publisher.
Research integrity at Frontiers
Learn more about the work of our research integrity team to safeguard the quality of each article we publish.