 Jiří Balík
 Pavel Suran
 Jindřich Černý
 Ondřej Sedlář
 Martin Kulhánek
94% of researchers rate our articles as excellent or good
Learn more about the work of our research integrity team to safeguard the quality of each article we publish.
Find out more
ORIGINAL RESEARCH article
Front. Soil Sci., 27 March 2025
Sec. Soil Organic Matter Dynamics and Carbon Sequestration
Volume 5 - 2025 | https://doi.org/10.3389/fsoil.2025.1540137
The soil organic matter (SOM) content and quality are the fundamentals of soil fertility and contribute significantly to soil carbon sequestration. The soil glomalin content is increasingly recognized as an indicator of SOM quality. The objective of this study was to evaluate the capability and contribution of the easily extractable glomalin (EEG), total glomalin (TG) content, potential wettability index (PWI) of soil aggregates, and water stability of soil aggregates (WSA) as instrumental indicators of long-term SOM quality changes. The obtained results on EEG, TG, PWI, and WSA were compared to the results of humic substances fractionation, specifically their relationship to carbon in humic substances, humic acids, and fulvic acids (CHS, CHA, and CFA, respectively). We used long-term field experiments (27 years) with a simple crop rotation starting with potatoes (site A) or maize (site B), followed by winter wheat and spring barley (on both sites) on the luvisol soil type. Fertiliser treatments were based on the application of uniform 330 kg N ha-1 per three years. Treatments were as follows: unfertilised control (Cont), sewage sludge in normal and triple dose (SS1 and SS3, respectively), farmyard manure in the conventional dose and half dose with mineral nitrogen (F1 and F1/2+N1/2, respectively), straw and mineral N fertiliser (N+St), and mineral N only (N). For the evaluation of the fertiliser effect, data from both sites were pooled together. The farmyard manure application in the F1 treatment showed the best potential for improving the SOM quality (the highest CHA, humification rate, humification index, TG content, and WSA). The results of Cont treatment show degradation of SOM content and quality. No significant effect of fertiliser treatment on the EEG was observed. The TG content was significantly influenced by fertiliser in the F1, F1/2+N1/2, and SS3 treatments (1965, 1958, and 1989 mg kg-1, respectively) in comparison with the Cont (1443 mg kg-1). The TG content was in a tight relationship with the CHA content (R2 = 0.298; p<0.001). The PWI was also influenced by the treatment. There was a significant positive relationship between PWI and CHS (R2 = 0.550), CHA (R2 = 0.249), and CFA (R2 = 0.492), p<0.001. No significant relationship was established between the WSA and SOM quality indicators. Both TG content and PWI can be used as indicators of SOM quality in long-term experiments. On the other hand, the EEG content and WSA are not capable of determining the changes in the SOM quality.
The prevailing demands for food production has drawn greater attention to the sustainability of farming systems, concerning climate change in particular (1). Over the past several decades, Europe traditional agricultural practices have undergone significant changes. Crop production and animal husbandry have largely been separated. Crop rotations have shifted (with notable reductions in alfalfa and clover proportions) and considerably intensified. The use of organic fertilisers has declined. Farmyard manure is increasingly being replaced by digestate from biogas plants, with greater incorporation of cereal straw into the soil or alternative sources of organic matter, such as sewage sludge. Crop rotations on arable land now predominantly consist of winter wheat, spring barley, winter canola, and maize (2). One of the keystones of sustainable farming is appropriate care for the soil organic matter. Soil organic matter (SOM) content and quality influence a wide range of physical, chemical and biological attributes, and processes, including the formation and stabilisation of soil aggregates, nutrient cycling, water retention, disease suppression, pH buffering and cation exchange capacity (3, 4). Additionally, soil carbon sequestration can be part of the solution in tempering the adverse impact of climate change. Changes in the content and quality of organic matter are a long-term process (5) and long-term field experiments can provide useful insight.
In recent decades, considerable attention has been devoted to research on different methods to be used for determining SOM content and quality. The SOM quality indicators have evolved over time due to the complexity of organic matter and advancements in analytical techniques. Most recent studies assess organic matter quality by fractionating it into humic and fulvic acids, as described in previous research (6, 7). Humic substances are now more accurately characterized as supermolecular associations rather than macromolecular polymers (8). Nevertheless, studies that use or further develop the fractionation of organic matter into humic and fulvic acids continue to be published (9).
Recent research has elevated glomalin to a prominent status as a key indicator of SOM quality, underscoring its importance in soil science (10, 11). Glomalin production and its accumulation in soil vary depending on plant species, associated arbuscular mycorrhizal fungi (AMF), and soil properties (12–14). In their pioneering work, Wright and Upadhyaya (15) identified two glomalin fractions: easily extractable glomalin (EEG) and total glomalin (TG) (16, 17). More recent literature also refers to a fraction known as difficultly extractable glomalin (18). A high temperature extraction with sodium citrate is used to extract the glomalin fractions. This method is non-specific to glomalin (the product of AMF) as it extracts additional stable proteins (products of plants, bacteria, and other autotrophs) as well as organic compounds like lipids, humic acids, and fatty acids (15, 19, 20). In our previous study, we explored the relationships between glomalin and other soil properties like the content of humic substances, humic acids, fulvic acids as well as bulk density, porosity, and clay content (14). A significant correlation between TG, carbon in soil organic matter (CSOM), and the degree of polymerisation (HA) was determined. A significant correlation was observed between TG and clay content (size<0.002 mm particles), as well as particles smaller than 0.01 mm. Significantly increased content of TG was observed on chernozem soil types in comparison to others (luvisols, cambisols, fluvisols) (21). No relationship was determined between glomalin content and soil exchangeable pH determined in the CaCl2 solution (pHCaCl2) in periodically monitored arable soil of the Czech Republic in different soil-climate conditions (21). Similarly, Nichols and Wright (22) determined significant relationship between clay content and glomalin content in the soils of the USA.
Glomalin is a glycoprotein with naturally adhesive and sticky properties that binds soil particles and organic matter, promoting the aggregation of soil particles. This, in turn, improves soil physical properties, such as bulk density, porosity (23), and water retention capacity, ultimately reducing erosion (24). Soils treated with mineral and organic fertilisers generally contain higher glomalin content compared to unfertilised soils (25–27). The long-term application of manure (25, 26, 28), compost (26, 28, 29), and straw (30, 31) also increases glomalin content. Additionally, the combined application of mineral fertiliser and straw positively influences glomalin content (31). In our previous long-term field experiments with maize monoculture on chernozem, a significant increase in total glomalin (TG) content was observed following the application of sewage sludge, compared to both unfertilised controls and mineral nitrogen fertiliser treatments (32). Generally, TG content is positively correlated with carbon in soil organic matter (CSOM) content (33). However, in the study previously conducted monitoring glomalin levels across the Czech Republic, we found no correlation between the amount of applied organic matter (carbon inputs) and soil glomalin content (in both EEG and TG fractions). Furthermore, the type of organic fertiliser applied (straw, manure, or compost) did not have a significant effect on glomalin content (21).
The advantage of infrared spectroscopy lies in its rapid analysis and the generation of spectra, which allow for the simultaneous determination of multiple soil parameters. For SOM analysis, the near-infrared region is typically used to calculate SOM content, while the mid-infrared region is used to assess SOM quality (34). Mid-infrared spectra can reveal the presence of various organic components in soil (such as aromatic and aliphatic compounds, polysaccharides, and lignin) and provide insights into their proportions in organic matter and their impact on SOM’s affinity to water. The potential wettability index (PWI) characterizes SOM by evaluating the ratio of aliphatic (C-H) to carboxylic (C-O) bonds. A significant correlation between PWI and CSOM content has been previously reported (35). Additionally, a strong correlation was found between PWI and TG content in luvisol soil (36), though this relationship was not confirmed in chernozem (37). In long-term field experiments on cambisol, a strong correlation was observed between PWI and CSOM, carbon in humic acids (CHA), and carbon in fulvic acids (CFA) (38).
The main factors influencing soil aggregate stability include SOM, clay content, and the presence of iron, manganese, aluminium, and other oxides (39–42). It is a generally accepted fact that adding organic matter, like manure, increases the stability of soil aggregates. The effectiveness of the addition of organic matter depends on its degree of decomposition and its capacity to integrate with SOM. Hydrophobic components are known to stabilize soil structure (43), protecting soil aggregates by making them water-repellent (44). The surface water repellency slows down water penetration into the aggregates, which in turn protects them. Plant roots, soil fungi, and soil bacteria reinforce the aggregates or produce certain substances, that promote aggregation (45).
Mineral fertilisers can negatively impact soil aggregates (46), likely due to a decrease in pH and the accumulation of higher levels of NH₄⁺ ions in the soil. Another contributing factor could be the increased mineralisation of stable SOM (the priming effect) induced by mineral nitrogen application.
A positive impact on soil aggregate stability has been observed with manure application, or when manure is combined with mineral fertiliser (47–49). On the other hand, Stehlíková et al. (50) did not establish any effect of manure application on the stability of soil aggregates. High intensity of sewage sludge application increased the water-stability of aggregates (WSA) compared to mineral N treatment, but the values of WSA were significantly lower, than those in unfertilised control treatment (36).
The present study is aimed to: i) determine the influence of mineral fertiliser, sewage sludge, farmyard manure, and straw incorporation on the content and quality of soil organic matter (SOM); ii) evaluate the information on glomalin content as an indicator of SOM quality; iii) evaluate the ability of potential wettability index (PWI) method on SOM quality determination; iv) determine the influence of fertiliser on the stability of soil aggregates. The content of glomalin in the soil is becoming an indicator for the evaluation of the SOM quality during the monitoring of the Czech Republic soils. It is a pioneering activity, as there are no set criteria for the evaluation of the glomalin content levels at this point. We used 27-year-old stationary long-term field experiments with a three-crop rotation on luvisol. This soil type is fertile and suitable for a wide range of agricultural uses, covering 500 to 600 million hectares globally (51).
The effect of fertilisation on the content of glomalin in soil was observed in long-term field trials established in 1996 at the experimental base at Hněvčeves and Červený Újezd sites (sites A and B, respectively henceforth). Soil type on both sites is haplic luvisol (Table 1). The available phosphorus (P) and potassium (K) content in soil (estimated by the Mehlich 3 method) was sufficient for crops. Within these trials, three crops were rotated in the following order: potatoes at site A and maize at site B, followed by winter wheat and spring barley at both sites. Selected crop rotation represented 50.2% of arable soil in the Czech Republic in 2024 (52). Each year, all crops were grown. The size of the experimental plot was 20 m2, and each treatment is replicated in 4 plots. The total area of treatment was 80 m2. The plots were assembled in a randomised complete block design. The trial included seven treatments (1): no fertilisation (Cont); (2) sewage sludge (SS1); (3) high dose of sewage sludge (SS3); (4) farmyard manure (F1); (5) half dose of farmyard manure + mineral nitrogen fertiliser (F1/2+N1/2); (6) mineral nitrogen fertiliser (N); (7) spring barley straw + mineral nitrogen fertiliser (N+St) (Table 2). With the exception of SS3 treatment, the experiments are representative of agricultural practices in the Czech Republic. Organic fertilisers (farmyard manure, sewage sludge, and straw) were always applied in autumn (October) to potatoes or maize and were immediately incorporated in the soil to approximately 25 cm depth with ploughing. Table 3 displays the organic fertiliser dose. The remaining treatments were ploughed to the same depth at the same time. Mineral nitrogen fertilisers in the form of calcium ammonium nitrate were applied to maize and spring barley in spring, before the crop establishment. In the case of winter wheat, the dose of nitrogen was divided in half, with the first half applied at BBCH 21 and the second at BBCH 31–32. The nitrogen content was 140 kg N ha-1 for wheat and 70 kg N ha-1 for spring barley; F1/2+N1/2 was applied at the rate of 115 kg N ha-1 for wheat and 50 kg N ha-1 for spring barley.
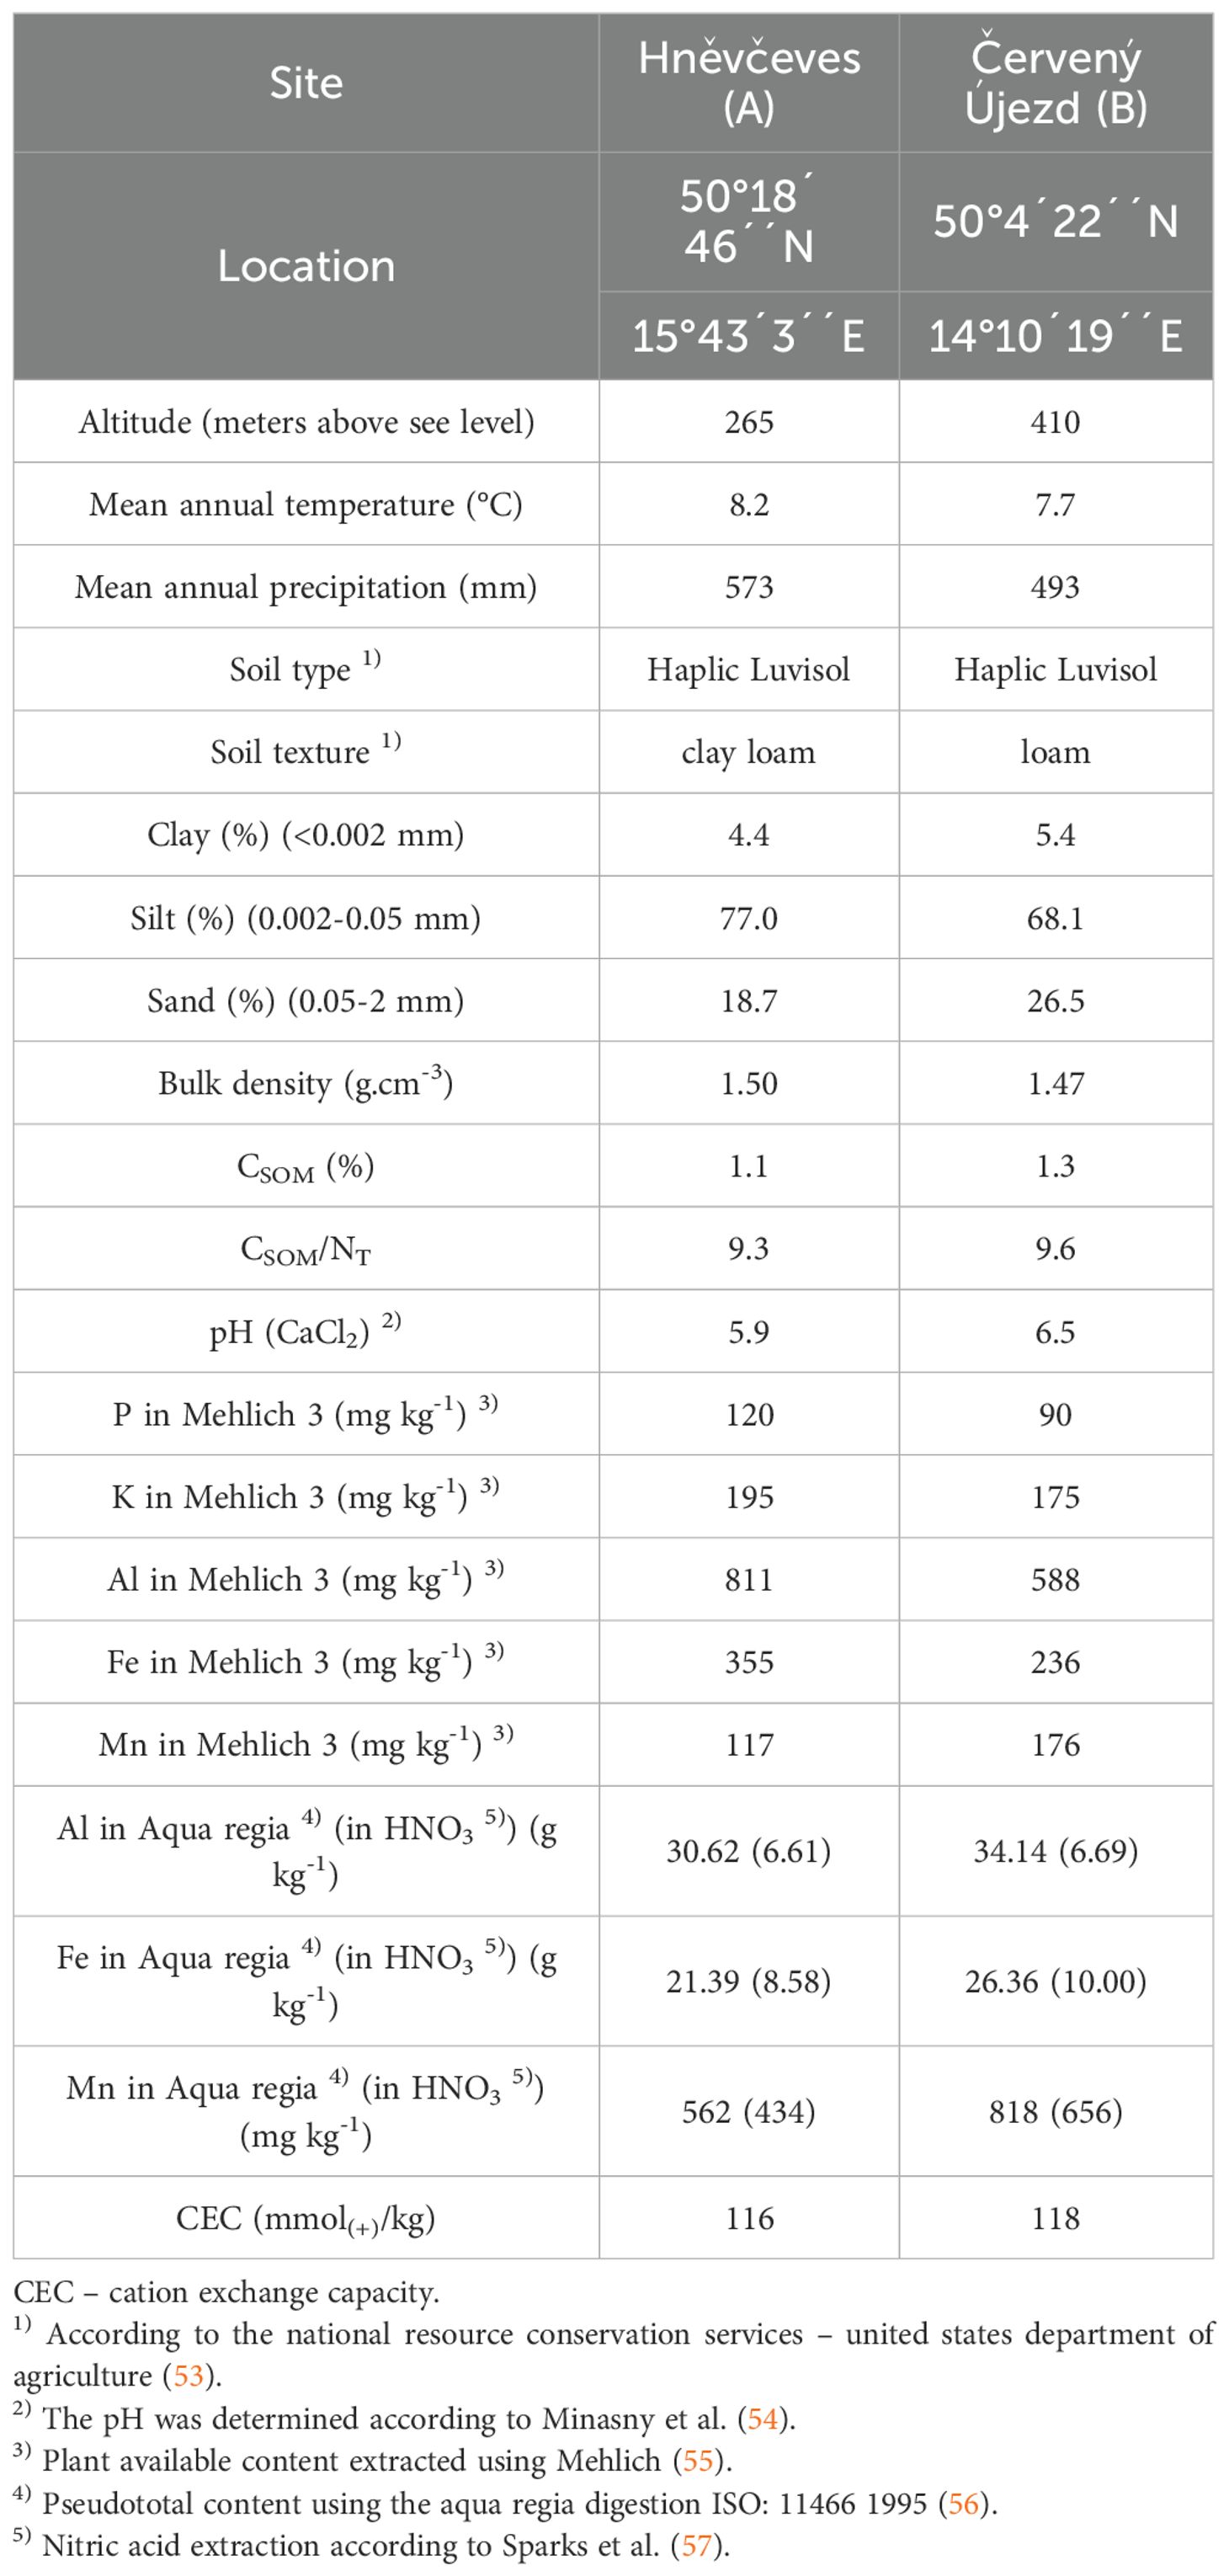
Table 1. Characteristics of experimental fields.
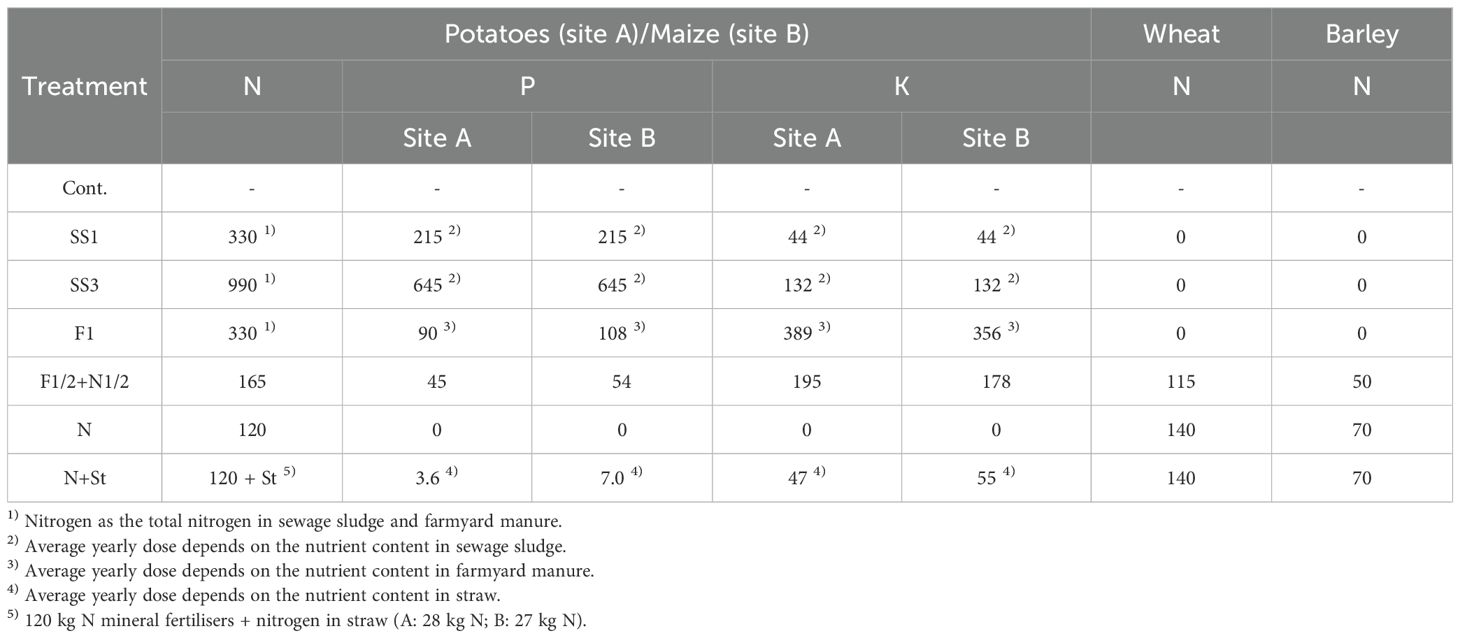
Table 2. Application rates of nutrients (kg ha-1 per 3 years).
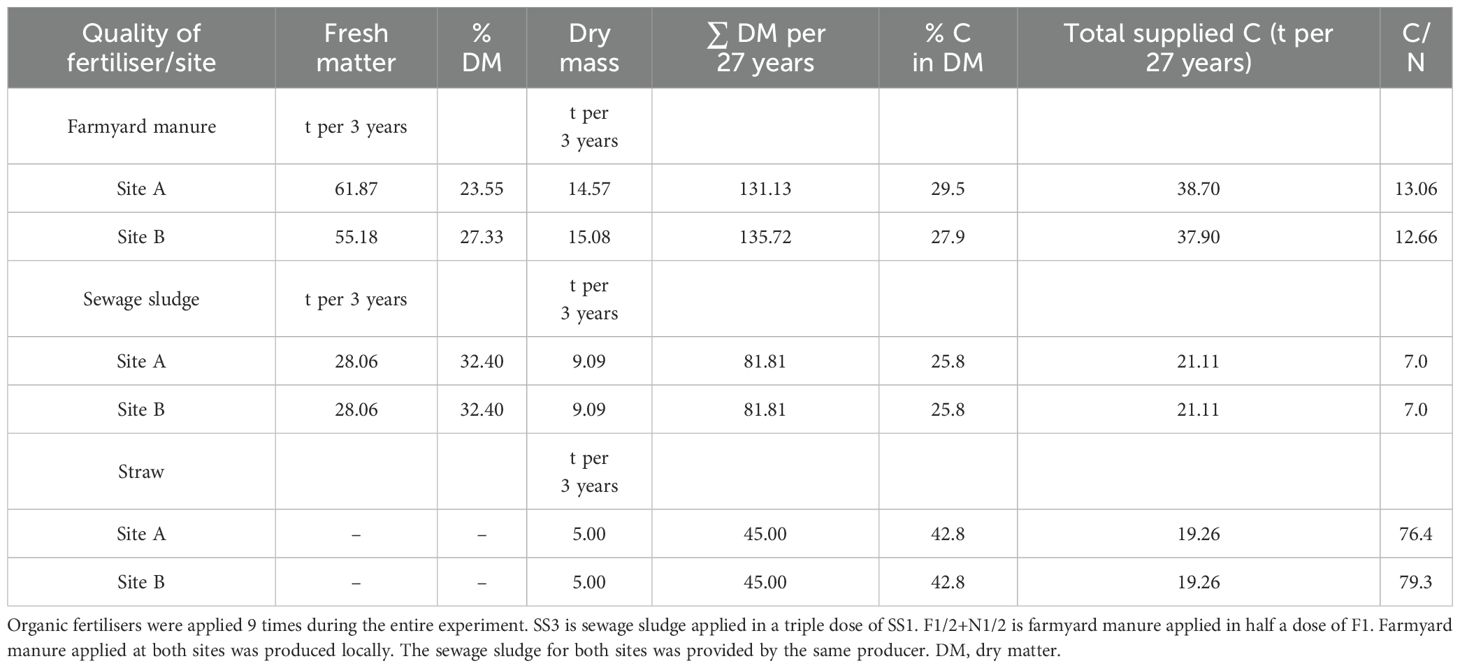
Table 3. The organic fertilisers dose and quality.
The top 30 cm layer of the soil was sampled right after the spring barley harvest. Each plot was sampled seven times. The samples were pooled to produce a representative sample from the plot. This way, four representative samples from each treatment were produced. The soil samples were later dried in a force-air drier at 40°C until the constant weight. Once dry, samples were sieved for <2 mm particles for all analyses. A portion of the sample was also sieved for <0.4 mm particles for the CNS elemental analyser.
The Soil organic carbon (CSOM) content was assessed through oxidation using the CNS Analyzer Elementar Vario Macro (Elementar Analysensysteme, Hanau near—Frankfurt am Main, Germany).
The fractionation of carbon in humic substances (CHS) was carried out following the method described by Kononova (58) to obtain the pyrophosphate-extractable fraction, which represents the sum of carbon in humic acids (CHA) and fulvic acids (CFA). Below is a summary of the procedure: A 5 g soil sample was extracted using a mixed solution of 0.10 mol L−1 NaOH and 0.10 mol L−1 Na4P2O7 (1:20 w/v). This extraction process isolated the CHA and CFA fractions. The CFA was obtained by acidifying the solution with dilute H2SO4 to a pH of 1.0–1.5, and the solution was left undisturbed for 24 hours. CHA was recovered by dissolving the precipitate formed during acidification in hot 0.05 mol L−1 NaOH. Before iodometric titration, the dry matter from each sample, obtained through vaporisation, was dissolved in a mixture of 0.067 mol L−1 K2Cr2O7 and concentrated H2SO4 under elevated temperature conditions. Humification indices were calculated according to Raiesi (59) and Iqbal et al. (60):
where CFA is the fulvic acid carbon, CHA is the humic acid carbon, and CSOM is the total organic carbon in soil.
The easily extractable glomalin (EEG) and total glomalin (TG) were analysed according to the method of Wright and Upadhyaya (10). In summary, 1.00 g of air-dried soil (<2 mm) was mixed with 8 mL of sodium citrate (20 mmol L−1 at pH 7.0 for EEG and 50 mmol L−1 at pH 8.0 for TG). The mixture was autoclaved at 121°C for 30 minutes for EEG and 60 minutes for TG, then cooled and centrifuged at 5000 rpm for 10 minutes for EEG and 15 minutes for TG. For TG, the supernatant was centrifuged five times until the characteristic red-brown colour, typical of glomalin, was no longer observed. Both forms of glomalin were quantified colourimetrically using bovine serum albumin (BSA) as a standard and the Bradford protein assay (both from Bio-Rad, CA, Hercules, USA) to detect the colour change. The glomalin content in the extracts was determined using the Tecan Infinite M Plex multimode microplate reader (Männedorf, Switzerland) at 595 nm.
The potential wettability index (PWI) and index of aromaticity (iAR) were determined using DRIFT (diffuse reflectance infrared Fourier transform spectroscopy) spectra. The DRIFT spectra were captured with an infrared spectrometer (Nicolet IS10, Waltham, MA, USA), covering a range from 2.50 to 25.0 μm (4000 to 400 cm−1). Alkyl C–H group bands (2948–2920 cm−1 and 2864–2849 cm−1) were considered indicative of hydrophobicity, while C=O group bands (1710 cm−1 and 1640–1600 cm−1) indicated hydrophilicity. The ratio of hydrophobicity to hydrophilicity determined the potential wettability index (61).
The aromaticity index was calculated based on the reflectance values of aliphatic bands ranging from 3000 to 2800 cm−1 (AL) and the aromatic band at 1520 cm−1 (AR) (61).
Water aggregate stability (WSA) was evaluated using the WSA index, following the procedure described by Nimmo and Perkins (62). Four grams of air-dried soil aggregates (with a diameter of 2–5 mm) were sieved for 3 minutes in distilled water (using a 0.25-mm sieve) with a frequency of 35 cycles per minute and a vertical amplitude of 1.3 cm. The aggregates that remained on the sieve were then sieved (using the same frequency and amplitude) in a sodium hexametaphosphate solution (2 g L−1) until only sand particles remained on the sieve. The aggregates that dissolved during wetting in water or hexametaphosphate solution were subsequently dried at 105°C and weighed. The WSA index was calculated as follows:
where Wds is the weight of aggregates dispersed in a sodium hexametaphosphate solution, and Wdw is the weight of aggregates dispersed in distilled water. An increase in the WSA value indicates an increase in soil aggregate stability
The carbon sequestration efficiency (CSE) was calculated as follows:
CSOMtreatment represents the quantity of carbon present in the soil under the fertilised treatment. CSOMunfert signifies the amount of C in the soil under the unfertilised Con treatment. TCI denotes the total carbon input (t ha−1) applied through organic fertilisers throughout the course of individual experiments Wang et al. (63).
First, the principal components analysis (PCA) was performed in order to identify the most important variables. The results were also assessed using a one-way ANOVA to determine the influence of treatments and site on the SOM content and quality indicators. Tukey’s test (p<0.05) was used for post hoc comparisons. Linear regression was used to outline the relationship among selected variables (p<0.05). All statistical evaluations were performed using Statistica software, version 12.3 (TIBCO, Palo Alto, CA, USA).
Principal component analysis (PCA) was performed to evaluate the most important indicators of SOM content and quality (Table 4). Several criteria were used to select the appropriate number of PCs. First, the Kaiser criterion (eigenvalue > 0.1) and cumulative variance exceeding 70% were applied. This resulted in three principal components (PCs). We will focus only on PC1 and PC2 as no indicator is correlated with PC3 by a coefficient higher than 0.7 or lower than -0.7. PC1 is correlated with the carbon in soil organic matter (CSOM), carbon in fulvic acids (CFA), easily extractable glomalin/CSOM ratio (EEG/CSOM), total glomalin/CSOM ratio (TG/CSOM), potential wettability index (PWI), and index of aromaticity (iAR). PC2 is correlated with the carbon in humic acids (CHA), humification index (HI), and TG. These principal components are responsible for 65.81% of the total variance within our data.
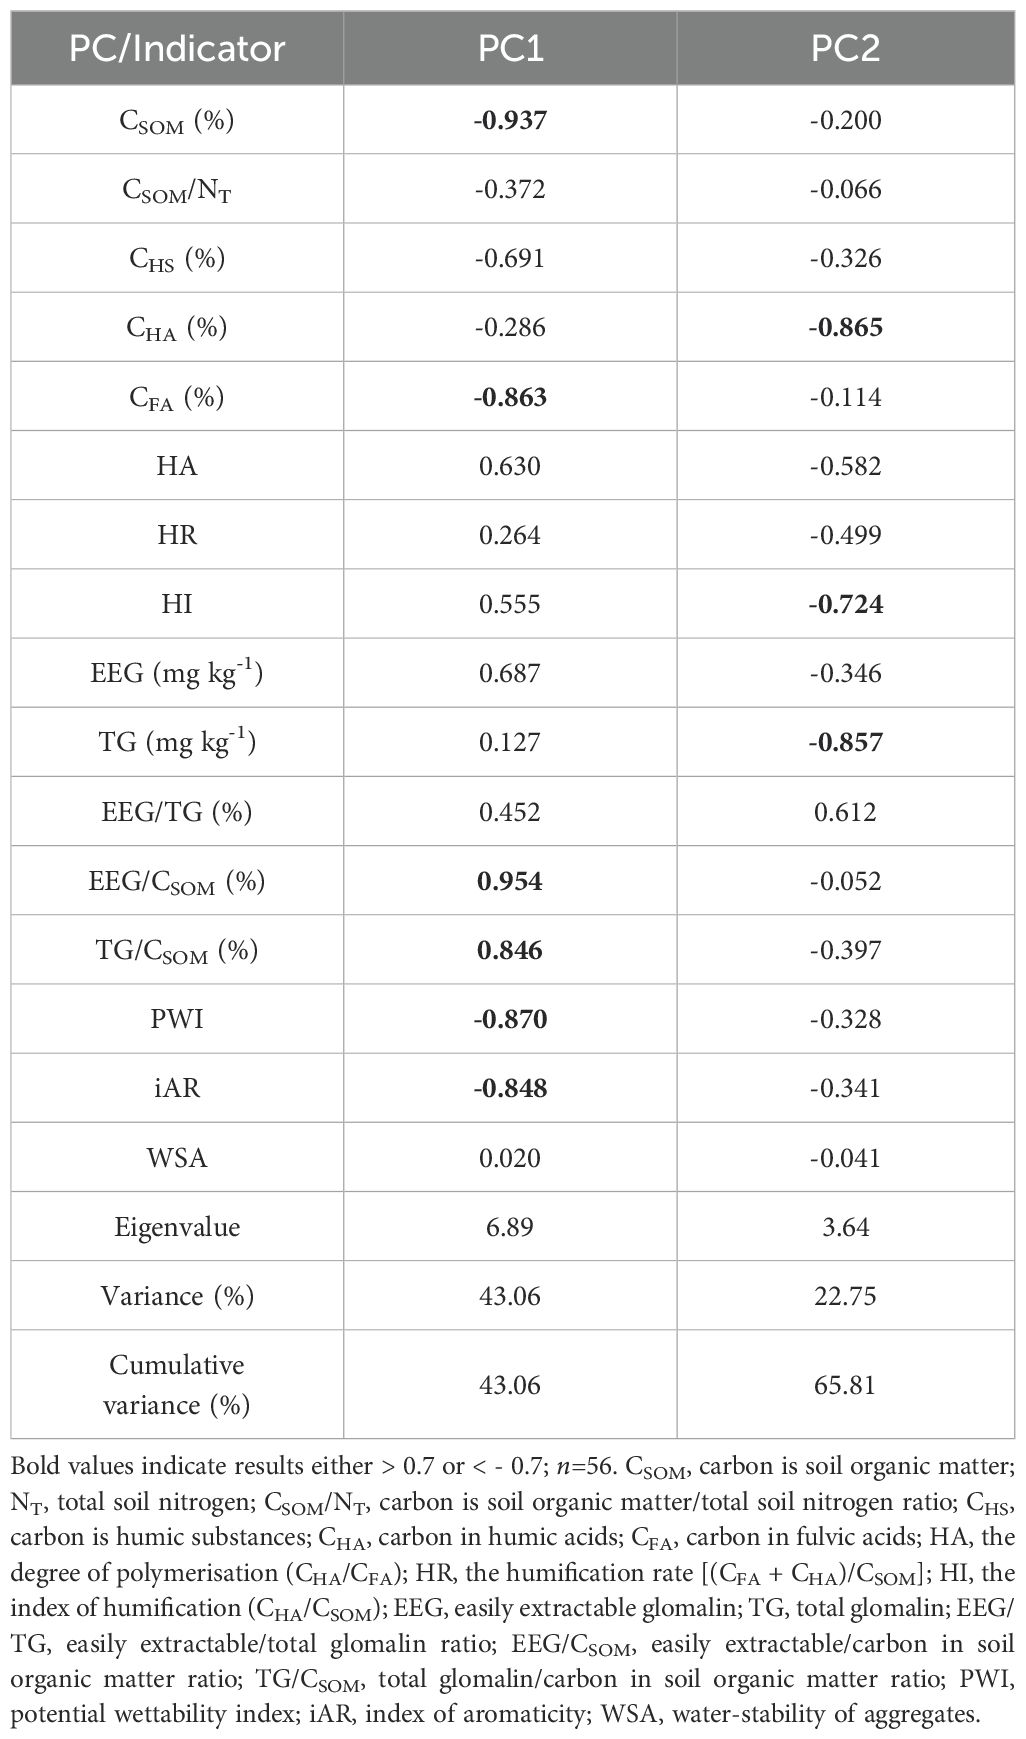
Table 4. Correlation of principal components and individual SOM content and quality indicators.
The aim of this work was not to monitor yields in individual treatments. The focus was on changes in the content and quality of soil organic matter (SOM). The included yields of winter wheat grain are provided only to illustrate the situation in our experiments. These yields roughly represent the influence of treatments on the yields (Figure 1). The average yield of wheat grain (site A) in the control treatment was 4.82 t DM ha-1. In comparison, site B produced 3.35 t DM ha-1 in the control treatment. The experiment is based on the application of 330 kg N ha-1 every three years to all treatments, except the unfertilised control, SS3 (990 kg N ha-1), and mineral nitrogen + straw (N+St) treatment. The N+St treatment received a higher dose of nitrogen due to the straw incorporation into potatoes (site A) or maize (site B) (Table 2). The Figure 1 shows that the differences among the fertilised treatments were non-significant.
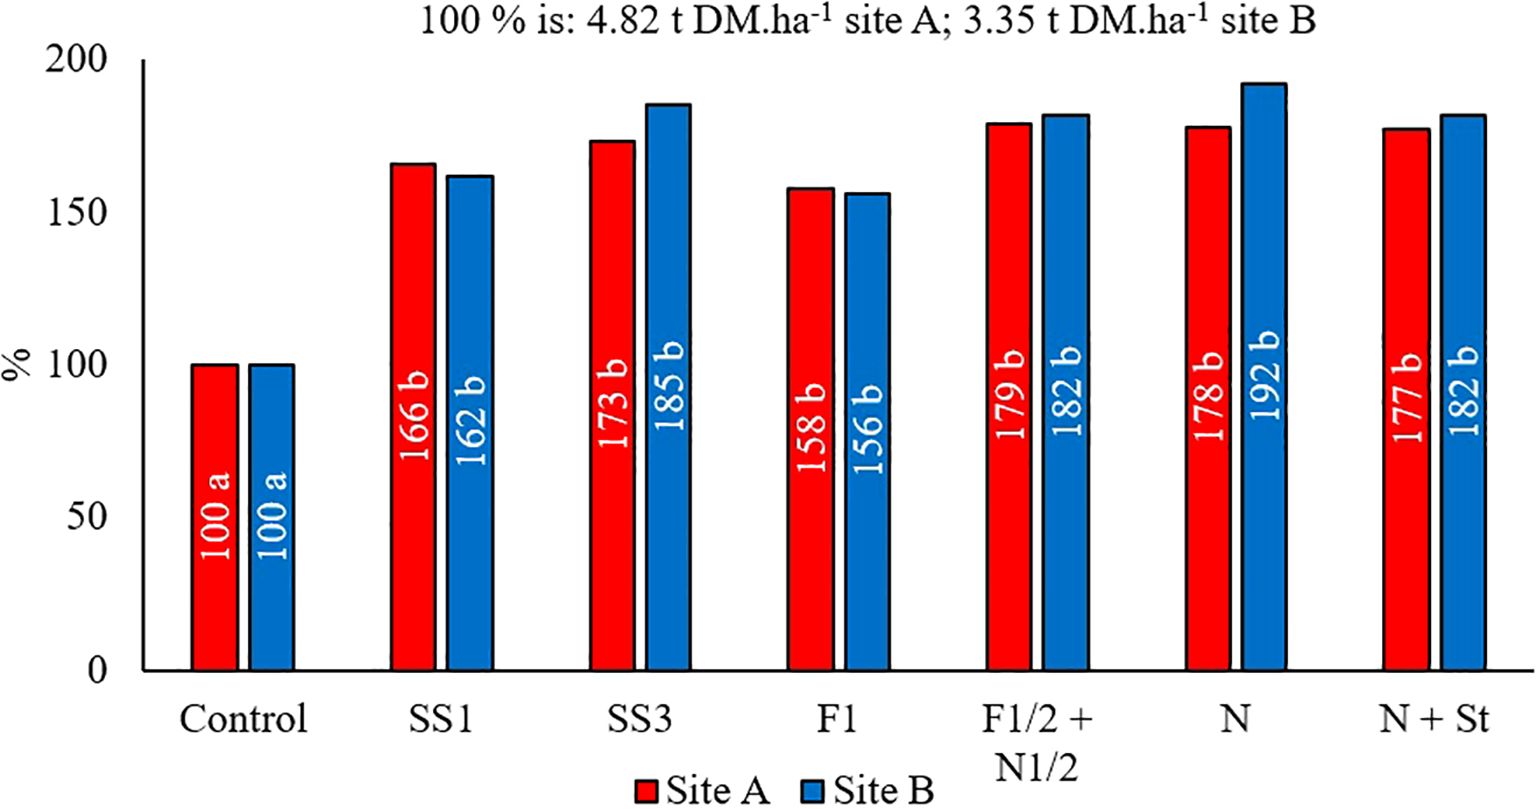
Figure 1. Relative yields of winter wheat at Site A and B from years 1997–2022. Different letters describe statistically significant differences among treatments for each site individually. Turkey HSD test p<0.05; n=24.
The dynamics of yields throughout the experiment are shown in Figures 2 and 3. For simplicity, the yields were calculated as three-year averages per treatment. The control treatment consistently provided the lowest yields. There was an increasing trend in differences between the control and fertilised treatments over the course of the experiment (Figures 2, 3). The control treatment yields stayed roughly the same throughout the experiment on both sites. The yields of fertiliser treatments had an increasing trend (y=0.3463x+5.7098) from the initial values between 5-7 t ha-1 year-1 on site A (Figure 2). The yields of fertiliser treatments on site B also had an increasing trend (y=0.1209x+4.7936) from 5-6 t ha-1 (Figure 3). The influence of periods was also notable. Both sites indicated increasing yields (linear average). The increasing yield over the course of the experiment is likely due to the change in wheat variety. The new varieties provide a higher yield potential.
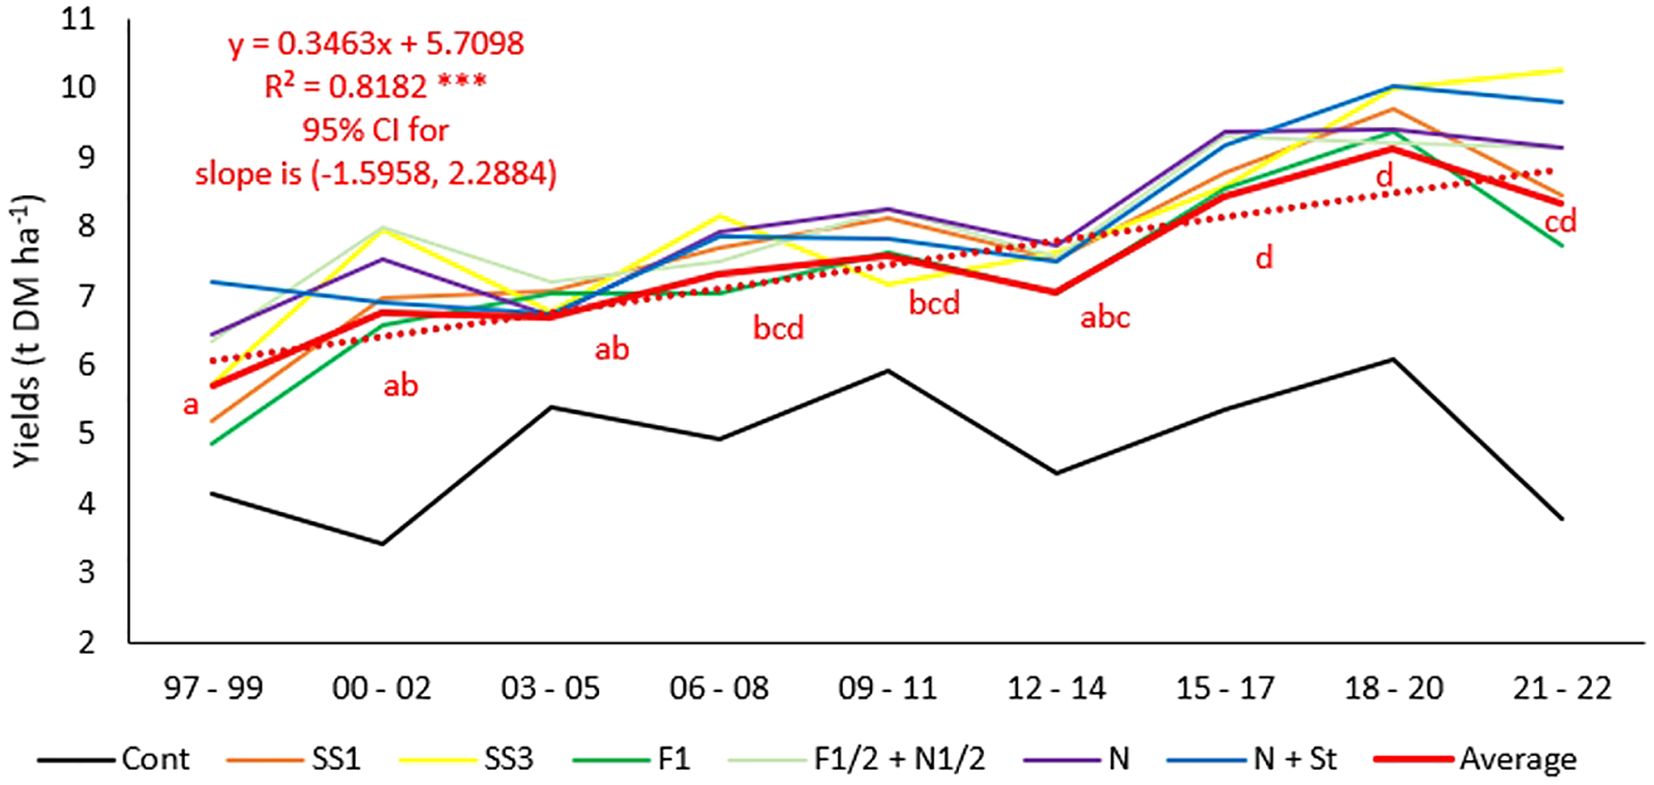
Figure 2. Trend in average winter wheat yields at site A. *** significant trend at p<0.001. Yields for a period were calculated as an average of the values for the individual treatment. The "Average" line was calculated as an average of all treatments in the selected period (control included). Different letters describe significant differences among periods for trend values of all treatments (n=24). The red dotted line is the linear trend for the average. Year 97 corresponds to the first year of the experiment. CI, confidence interval. Cont, control; SS1, sewage sludge; SS3, extreme dose of sewage sludge; F1, farmyard manure; F1/2 + N1/2, half a dose of farmyard manure and half a dose of mineral nitrogen fertiliser; N, mineral nitrogen fertiliser; N + St, N and straw application.
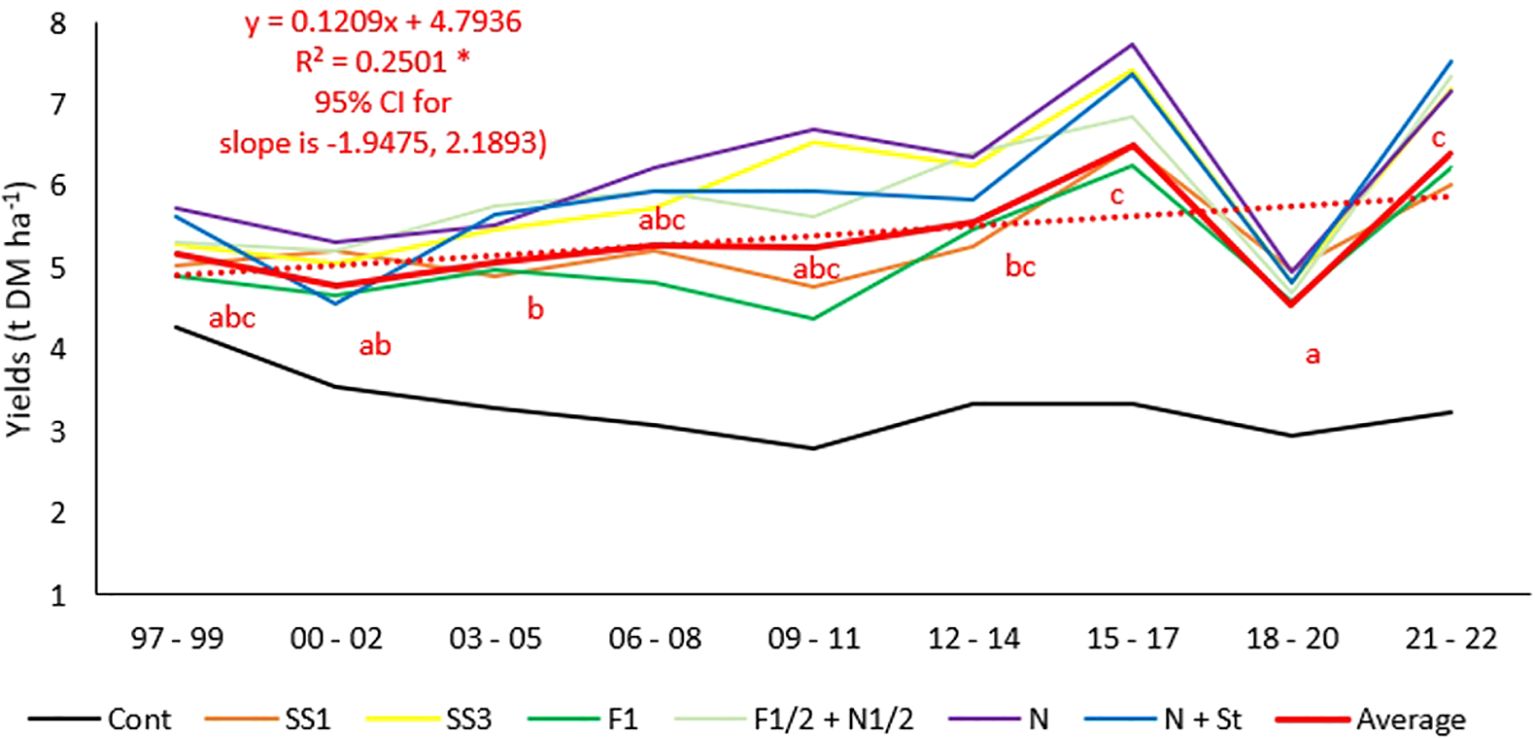
Figure 3. Trend in average winter wheat yields at site B. * significant trend at p<0.05. Yields for a period a were calculated as an average of the values for the individual treatment. The "Average" line was calculated as an average of all treatments in the selected period (control included). Different letters describe significant differences among periods for trend values of all treatments (n=24). The red dotted line is the linear trend for the average. Year 97 corresponds to the first year of the experiment. CI, confidence interval. Cont, control; SS1, sewage sludge; SS3, extreme dose of sewage sludge; F1, farmyard manure; F1/2 + N1/2-half a dose of farmyard manure and half a dose of mineral nitrogen fertiliser; N, mineral nitrogen fertiliser; N+ St, N and straw application.
The carbon sequestration efficiency (CSE) was based on the average bulk density of both sites (the difference among sites is minimal) and the average amount of supplied carbon by farmyard manure (the difference among sites is minimal also). The CSE values are presented in Table 5. The values of CSE decrease with the increase in the amount of carbon (C) supplied. The high dose of sewage sludge (SS3) treatment resulted in a lower CSE value (38.6%) than the normal dose of sewage sludge (SS1) treatment (45.6%). A similar trend was also observed among the farmyard manure (F1) (35.0%) and half a dose of farmyard manure and half a dose of mineral fertiliser (F1/2+N1/2) treatments (41.4%). The lowest value was determined for the N+St treatment (34.1%) although the amount of supplied carbon was lowest on this treatment (19.26 t C ha-1 over 27 years).
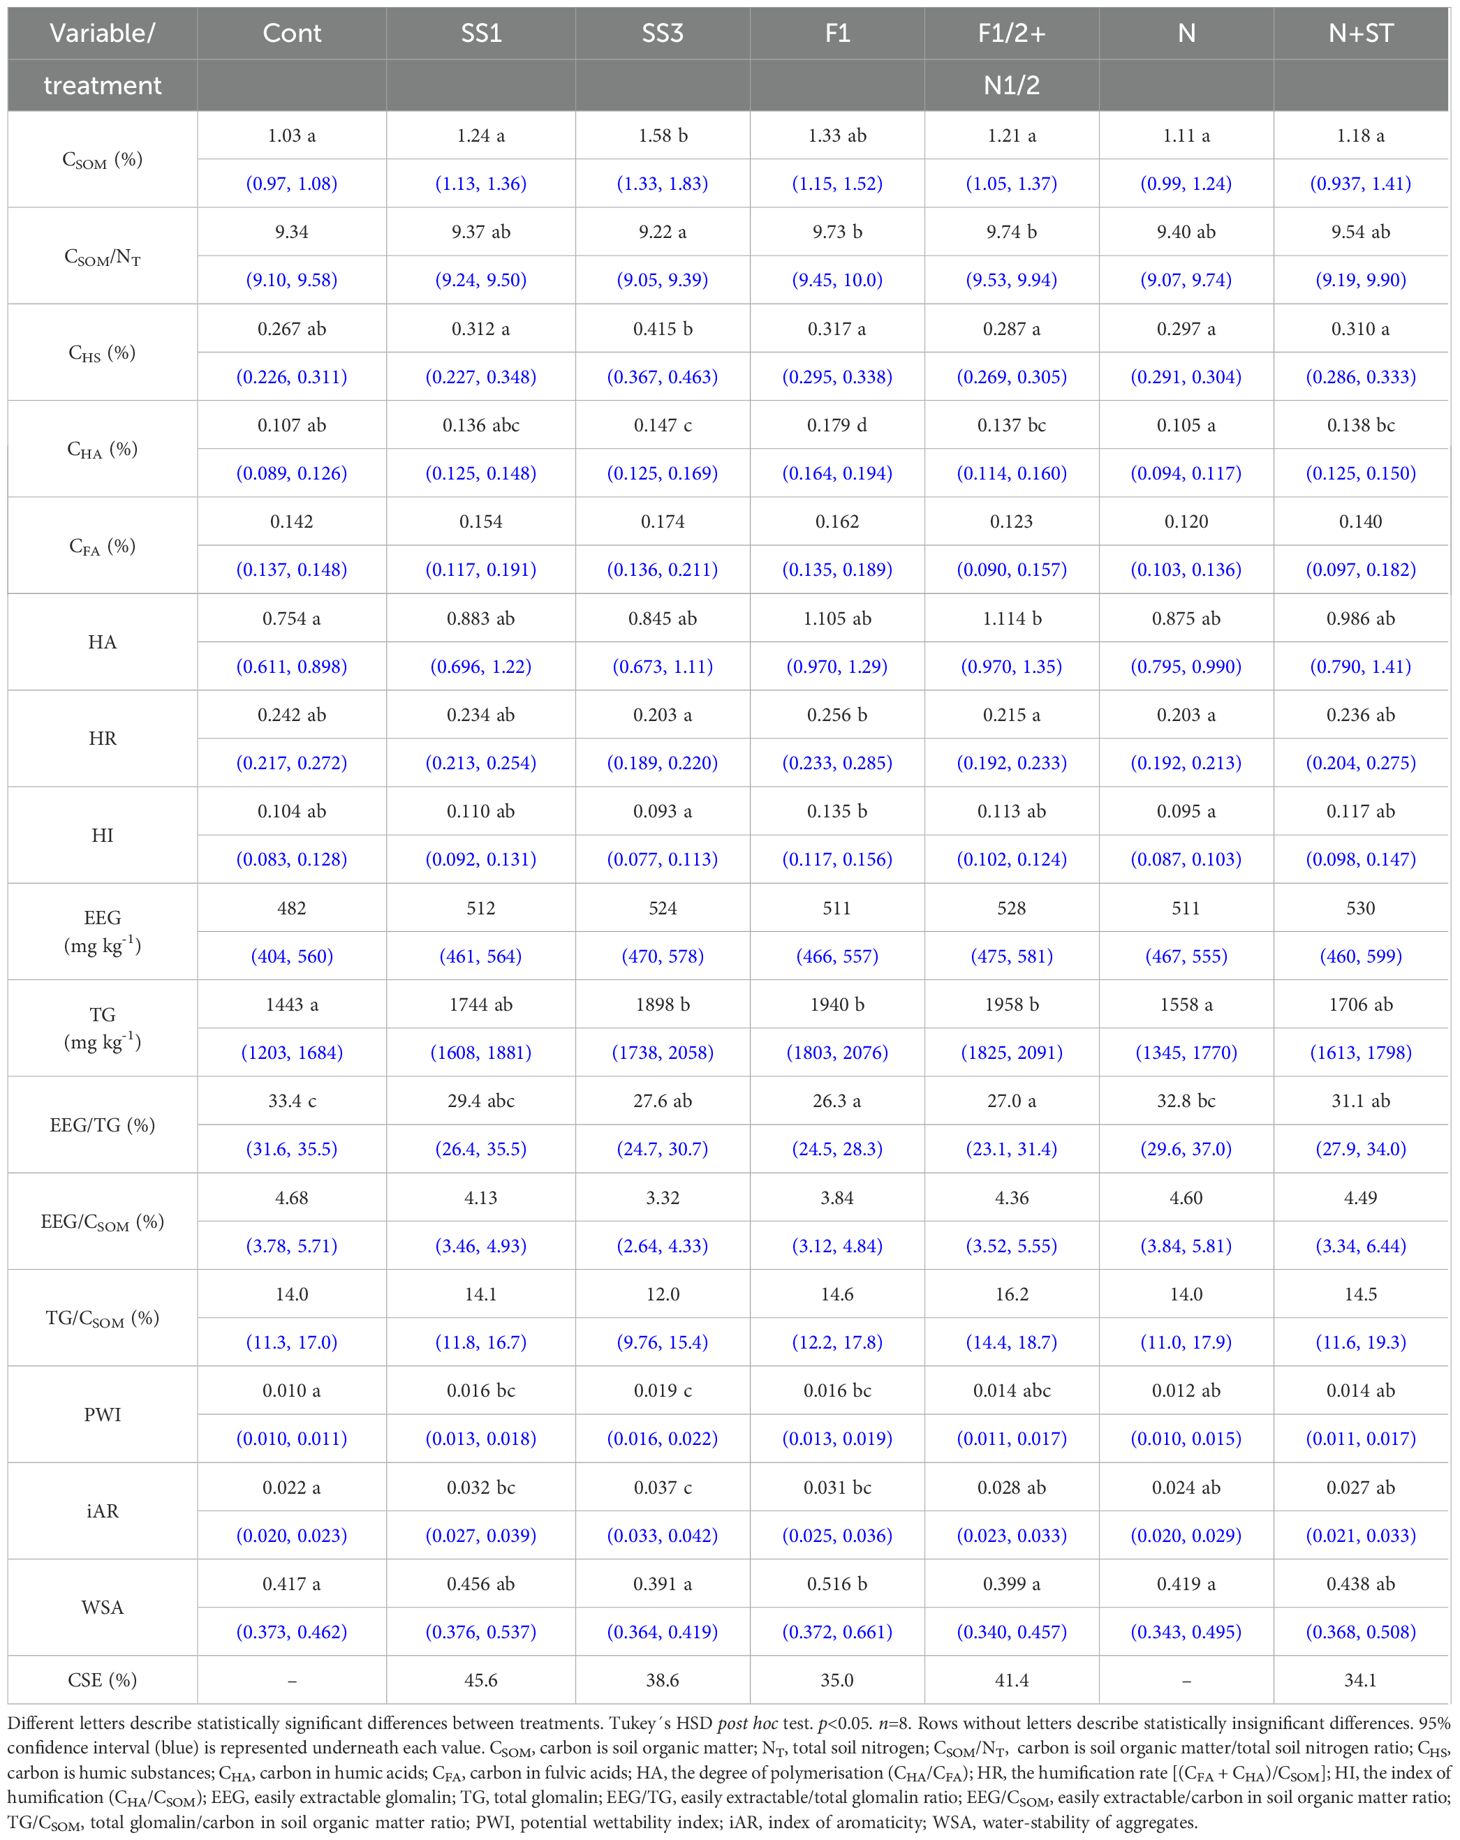
Table 5. The influence of treatment on the SOM content and quality indicators.
The indicators of SOM content and quality for individual sites represent the average of all the treatments (Table 6). The presented values represent the average of all treatments. The content of CSOM was lower on site A (1.07%) in comparison with site B (1.41%); however, the degree of polymerisation (HA) and glomalin content suggest better SOM quality on site A.
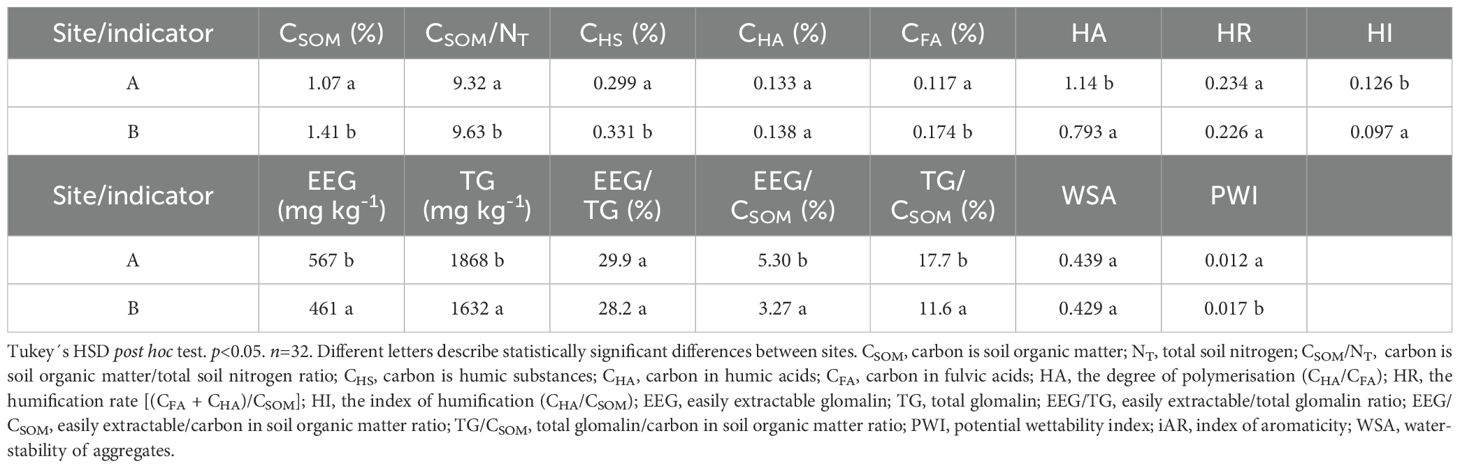
Table 6. The influence of site on the SOM content and quality indicators.
The influence of individual treatments over the SOM content and quality indicators is displayed in Table 5. The results of both sites were averaged. A statistically significant increase in the SOM content happened only in the SS3 treatment that received 63.33 t C ha-1 during the 27 years of the experiment. The CSOM content, especially on the SS1 and F1 treatments increased. The CSOM content on the SS1 and F1 treatments is 1.24 and 1.33%, respectively. This is in accord with the supplied amount of carbon (21.11 and 38.3 t C ha-1 during 27 years into the SS1 and F1 treatments, respectively).The unfertilised treatment was observed with the lowest CSOM content (1.03%) and quality (CHA, HA). The low CSOM content is related to the lowest aboveground biomass yields as well as small root biomass. The F1 treatment produced a lower long-term yield (Figures 1-3) in comparison to other fertiliser treatments (the difference is non-significant). However, it was one of the best treatments considering the content and quality of SOM. There was a clear trend in the increase in CSOM. Other than that, the CSOM/NT ratio was also increased, indicating an increased SOM quality. The CHA content and degree of polymerisation (HA) also increased significantly, further indicating an increase in the SOM quality. The fraction of stabilised and polymerized fraction of SOM becomes increased. This is expressed by an increase in: a) humification rate (HR); b) humification index (HI) (59, 60).
There was a gradual increase in CSOM content in the mineral nitrogen (N) treatment in comparison with the control (Table 5). The SOM quality of the N treatment was described by several negative results. Specifically, the CHA content and the TG content were comparable to the control. The mineral nitrogen-only fertilisation causes faster mineralisation of stable SOM due to the priming effect, which in turn, reduces the CHA content and leads to the lowest humification index value.
There was an increase in the CSOM content on the N+St (Table 5) treatment compared to the control and N treatments. Despite lower carbon inputs in the soil, the CSE value (34.1%) is relatively high in comparison with the F1 treatment. The carbon input in the N+St treatment was almost the same as in the F1/2+N1/2 treatment, yet the CSE value for N+St treatment was lower. This points out the smaller stability of organic matter in straw in comparison with manure. In comparison with the SS1 treatment, the N+St produced a lower CSE value, than SS1 (45.6%). This could be a result of higher CSOM content on the SS1 treatment. With regard to the SOM quality indicators (CHA, HA, PWI, iAR, and EEG/TG), the SS1 and N+St treatments are almost identical.
The SS3 treatment was originally designed as a potential treatment for achieving a significant change in SOM content and quality. High carbon inputs (63.33 t ha-1 over 27 years) resulted in an increased CSOM content. The substantially lower C/N ratio in sludge (7/1) and higher dose of N (990 kg N ha-1 every three years) caused significantly lower carbon in soil organic matter/total nitrogen (CSOM/NT) ratio in the soil (9.29/1). The higher dose of carbon in the sludge caused an increase in CHA content but with an overall lower quality of CSOM in comparison with the manure. The humification index on this treatment is significantly reduced.
No significant effect of fertiliser treatment on the EEG content was determined (p<0.05). The EEG content ranged between 482 and 530 mg (mg kg-1) based on the treatment (Table 5). A significant influence of treatment (p<0.05) was determined on the total glomalin (TG) content. The lowest TG content was on the Cont treatment (1443 mg kg-1). The EEG/carbon in soil organic matter (EEG/CSOM) ratio was between 3.32 and 4.68% (SS3 and Cont, respectively). The TG/CSOM ratio was between 12.0 and 16.2% (SS3 and F1/2+N1/2, respectively). This means, that there is more pronounced increase in the CSOM content on the SS3 treatment, that is not followed by appropriate increase in its quality (glomalin content).
The EEG/TG ratio was another selected SOM quality indicator. The highest value was monitored on the Cont treatment (33.4%), where the lowest degree of polymerisation (HA) was detected. The lowest value was present on the SS1 treatment (26.3%), where the HA value was the lowest. The EEG/TG value was mostly influenced by the changes in the TG content, as the EEG content was not significantly influenced by the fertiliser treatment.
Mutual connection among the SOM content and quality indicators and methods for their estimation are presented in Table 7. The EEG content is lightly, negatively related to the CSOM content (R2 = 0.207, p<0.001), CFA (R2 = 0.327, p<0.001) and CSOM/NT (R2 = 0.172; p<0.01) (n=56). The EEG content was positively related to the degree of polymerisation (R2 = 0.403, n=56, p<0.001). However, the TG content is positively related only to the content of CHA (R2 = 0.298), and degree of polymerisation (R2 = 0.327, n=56, p<0.001). The EEG/TG ratio was significantly negatively related to the CSOM content (R2 = 0.218), CHS (R2 = 0.263), and CSOM/NT (R2 = 0.187) (n=56, p<0.001). It is important to note, that some of these relationships have rather wide confidence intervals (marked in Table 7), which suggests, that at our number of observations (n=56), these trends might be real, but with lower certainty of the exact value of regression coefficient.
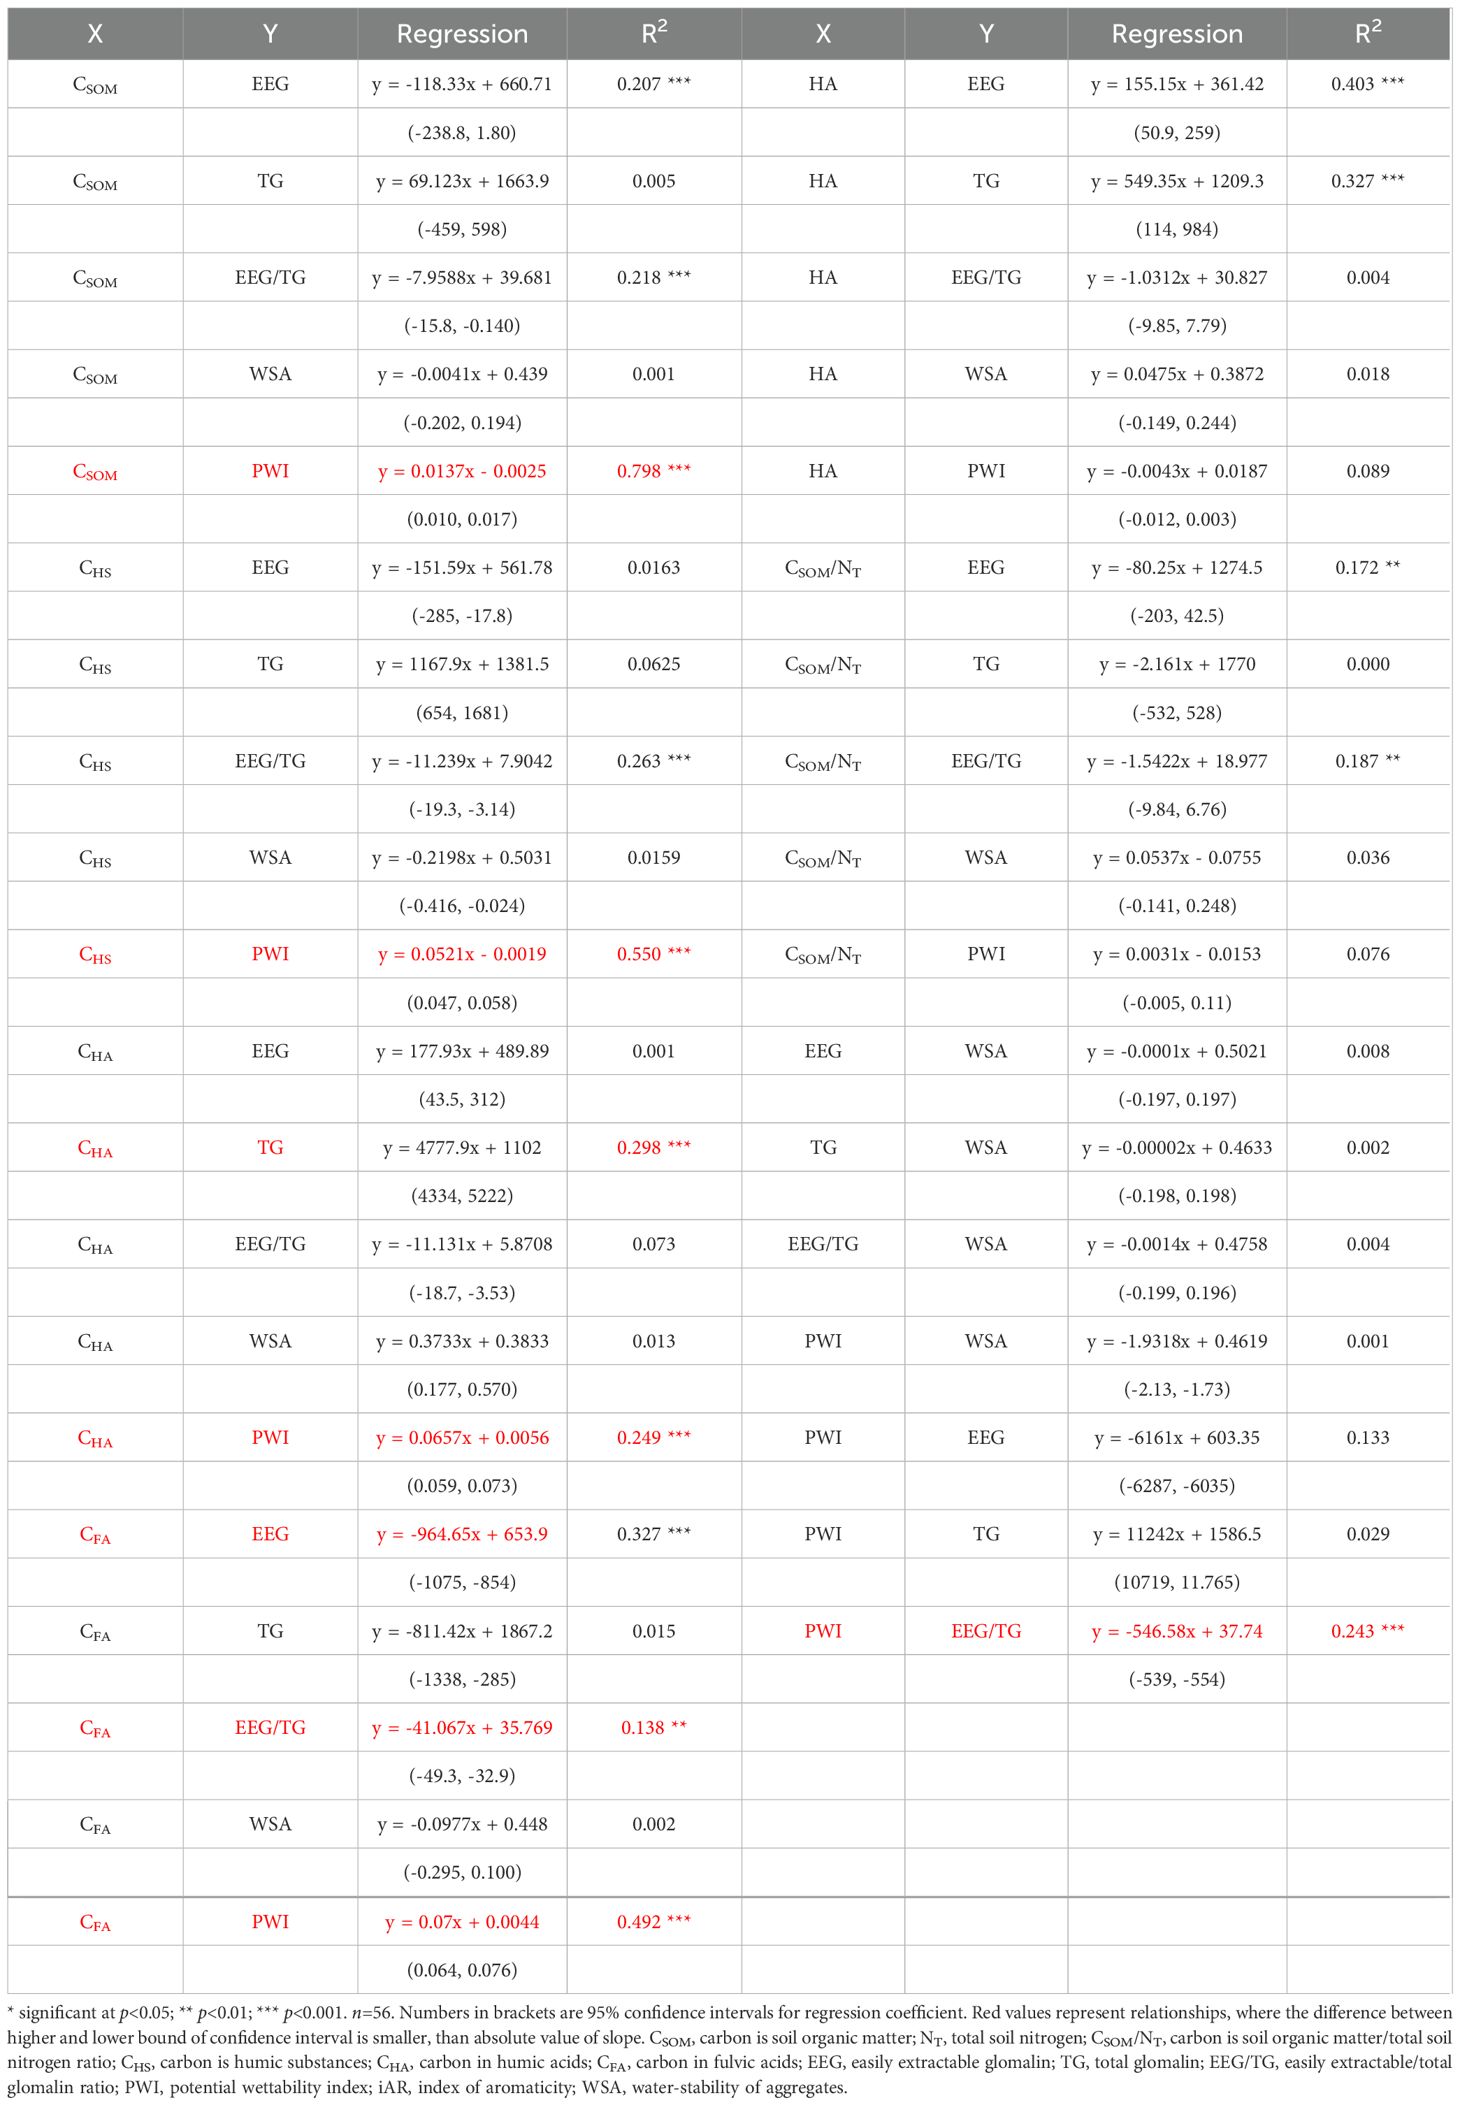
Table 7. Regression of selected SOM quality indicators with glomalin content, water-stability of aggregates and potential wettability index.
The effect of the fertiliser treatment on the potential wettability index (PWI) is displayed in Table 5. The unfertilised Cont treatment (0.010) is comparable with F1/2+N1/2, N, and N+St treatments (0.014, 0.012, and 0.014, respectively), although these treatments produced a slight increase in PWI values. A significant increase (p<0.05) in PWI values was determined for SS1, SS3, and F1 treatments in (0.016, 0.019, and 0.016, respectively) comparison with unfertilised Cont treatment. These treatments were also comparable to each other (p<0.05). Confidence intervals (95%) for individual treatments also suggest relatively small data variability.
The relation of PWI to other SOM content and quality indicators was further evaluated by regression analysis (Table 7). Significant relationships between PWI and CSOM (R2 = 0.798), CHS (R2 = 0.550), CHA (R2 = 0.249), CFA (R2 = 0.492), and EEG/TG (R2 = 0.243, negative relationship) were determined (p<0.001; n=56). The number of observations, tightness of confidence intervals (95%) and low significance level suggest, that the observed trends are significant and representative of reality.
The influence of fertiliser on the water-stability of aggregates (WSA) is documented in Table 5. The unfertilised Cont treatment (0.417) was statistically comparable to all treatments (between 0.391 and 0.456) except the F1 (0.516). The WSA value was not significantly related to any other SOM content and quality indicator (p<0.05, n=56). Suppose we add a relatively high scatter in the data (as documented by confidence intervals in Tables 5 and 7). In that case, it suggests that the water-stability of soil aggregates requires the investigation of more factors, than just the SOM content and quality. It might also be due to the fact, that data from two sites were pooled together.
The experiment was comprised of a simple crop rotation, potatoes or maize, followed by winter wheat and spring barley. The lower content of CSOM, and overall low quality of soil organic matter (SOM) was observed in the control treatment. This statement is based on the lowest degree of polymerisation (HA) value, very low glomalin content, water-stability of aggregates (WSA) value and significant decrease in potential wettability index (PWI), and index of aromaticity (iAR) values compared to fertiliser treatments.
After the farmyard manure application, an increase in carbon in soil organic matter (CSOM) content was observed along with an increase in SOM quality indicators, which underscores the importance of the manure application. A high carbon in humic acids (CHA) content, HA, PWI, iAR and significantly increased total glomalin (TG) content were observed. Additionally, the highest stability of soil aggregates was present here. This is following our previous study in the maize monoculture on luvisol, where we also observed a significant increase in the CSOM content and HA after farmyard manure application (36). Menšík et al. (64) and Liang et al. (65) also state a positive effect of farmyard manure application on the CSOM content and SOM quality (CHA content). The positive effect of farmyard manure application is also noted in Voltr et al. (66), Naikwade (67), and Macholdt et al. (68).
A build-up of SOM using the mineral-only N fertiliser can be achieved when applied at or below the level at which maximum yields are obtained, by promoting plant growth and increasing the amount of litter and root biomass added to the soil (23). On the other hand, such fertiliser can also cause a decrease in SOM. If applied in a dose greater than that needed for maximum crop yields, additional N inputs can increase the microbial biomass (69) and enzyme activity resulting in faster SOM mineralisation (23, 70). Mineral only nitrogen (N) fertiliser did not produce a significant change in CSOM content in our study, although an increasing trend is visible (Table 5) suggesting the optimum nitrogen dose was used. What is noticeable in our study is a destructive effect on the SOM quality in comparison with the organic fertiliser treatments. The CHA, HA as well as TG, PWI, and iAR content were decreased. The negative influence of mineral-only N fertilisation on the SOM quality was also observed in our previous works (32, 36, 37). There were almost no differences in the sewage sludge (SS1) and mineral nitrogen + straw (N+St) treatments on the SOM content and quality. The extreme dose of sewage sludge in the SS3 treatment had a significant effect on the CSOM, CHA, as well as carbon in fulvic acids (CFA) content. This resulted in a very small change in the HA. The high N dose in this treatment lowers the stability of soil aggregates. The positive effect of normal sewage sludge application dose (similar to the SS1 treatment currently presented) was also observed in our previous studies on luvisol and chernozem (36, 37).
We have not established a significant effect of different fertiliser treatments on the easily extractable glomalin (EEG) content in our long-term experiments. Nevertheless, a tight correlation with CSOM was established elsewhere (71). Our previous conclusions related to the tighter correlation of total glomalin (TG) and CSOM were not confirmed (72). A tight relationship of EEG and CFA content was established, yet no correlation with CHA was present. It is likely, that EEG and fulvic acids represent less stable fractions of SOM. The relationship between TG and CSOM was not significant, although a positive correlation between glomalin content and CSOM was reported by different authors (10, 73). This is likely due to the different quality of applied fertilisers. After the fertiliser application, the CSOM content is increased. However, due to the different quality of fertilisers, their influence on the SOM quality indicators also differs. The increased TG content is usually related to increased SOM quality (e.g. CHA). The highest TG content was measured on the farmyard manure (F1) treatment, which aligns with the findings of other studies (25, 26, 28, 74, 75). This supports the ability of manure to form stable organic matter, which is in line with recent findings of Yang et al. (76), that monitored a relative increase of C and N in the glomalin extract after organic fertiliser application. Furthermore, the CHA content was also highest in this treatment and, there was a significant relationship between TG content and CHA content (Table 7). On the other hand, there was no significant relationship between TG content and CFA content.
An increase in glomalin content following manure application was also observed in our previous studies on luvisol (72) and cambisol (38). Similarly, Bertagnoli et al. (31) and Zhang et al. (30) reported an increase in TG content after the application of farmyard manure. In line with the findings of Černý et al. (21) and Balík et al. (36), a strong correlation between TG content and the HA ratio was established in the present study. These results are in accord to those of Nichols and Wright (22), who determined a tight correlation between glomalin content and humic acids content.
Our initial hypothesis about the use of easily extractable/total glomalin content (EEG/TG) ratio as an indicator of SOM quality is based on our previous research focused on monitoring the soils across Czech Republic (21). A lower EEG/TG ratio was present on soils with higher SOM quality. In the current work, the EEG/TG ratio is significantly influenced by fertiliser treatments (Table 5). The lowest value (26.3%) was established for the F1 treatment, on the other hand, the highest ratio (33.4%) was established for the control treatment. We drew similar conclusions in our different study on five different luvisol sites (72). The highest significant value (32.6%) was, likewise, present in the unfertilised control treatment. Based on our previous work, it is clear, that the ratio is sharply determined by the soil type and soil texture (21). The lowest ratio was recorded in chernozems (14.7%), while the highest was found in luvisols (27.3%). The EEG/TG ratio is in a negative significant relationship with the CSOM content in the current study. Based on our current results, there was no influence of fertiliser treatment on the EEG content. The lowest EEG content was present in the control treatment. Therefore, the EEG/TG ratio was mostly determined by the TG content. It is possible to state, that along with the increasing quality of SOM (HA), a decreasing EEG/TG ratio was determined in the F1 treatment. Given the results, the use of the EEG/TG ratio is a fitting criterion while using the data about glomalin content (EEG and TG).
The quality of SOM is determined by the potential wettability index (PWI), which represents the ratio between aliphatic (C-H) and carboxylic (C=O) bonds. Higher PWI values indicate decreased aggregate wettability (77). The lowest PWI values were observed in the control treatment. Consistent with our previous results, we found a significant influence of fertiliser treatments on the PWI value (36). Demyan et al. (35) observed an increase in the PWI after farmyard manure application. Organic fertiliser application increased the hydrophobic particle content and contributed to the forming of larger soil aggregates under these treatments. Secondary metabolites created during the decomposition of organic matter can be hydrophobic in character (78). The negative influence of mineral N fertiliser on the PWI was observed. A decrease in the aromaticity of soil particles was observed by Liu et al. (79) and Hu et al. (80). An increase in aliphatic alkyl C content likely causes it. This would also explain a decrease in the PWI since aliphatic bands used for the calculation of PWI overlap. These results are in accord with our previous study on maize monoculture on chernozem (37). In the current study, we observed a strong relationship between PWI and CSOM, as well as other indicators of SOM quality like carbon in humic substances (CHS), CHA, and CFA in the current study. The strong correlation of PWI and CSOM is also mentioned elsewhere (36, 81). The aromaticity index (iAR) calculated based on the reflectance of aliphatic and aromatic bands (82) confirmed the same conclusions as the PWI, with the application of farmyard manure and sewage sludge also increasing the iAR.
A positive correlation between glomalin fractions (EEG and TG) and aromatic and hydrophobic components of SOM was established by Stehlíková et al. (50). On the other hand, the authors did not find an increase in the hydrophobicity index after an increase in the glycoprotein content, which resembles the relation to the potential wettability index (PWI), as mentioned in Balík et al. (36, 37). In the work of Stehlíková et al. (50), a negative correlation of the hydrophobicity index with EEG and TG was established.
There was no relationship between the water stability of soil aggregates (WSA) and SOM content and quality. This is likely due to the different quality and content of applied organic fertilisers (manure, sewage sludge, straw). While a general increase in CSOM content was observed, changes in its quality were inconsistent. We established the highest stability of soil aggregates in the farmyard manure (F1) treatment, which aligns with the findings of other studies (47, 48, 69, 83, 84). The F1 treatment also had the highest TG content. Long-term fertiliser applications influence, directly or indirectly, the accumulation of glomalin through the regulation of arbuscular mycorrhizal fungi (AMF) diversity, or increased production of their biomass (85). The farmyard manure application increases the glomalin content through the following pathways: 1) improvement in soil pH (86) and available nutrient content (87) thereby reducing the competition between the AMF and plant (88). 2) decrease in bulk density and increase in porosity of soil (89), which provides AMF a sufficient supply of oxygen and water (90). An increase in porosity also makes it easier for AMF hyphae to spread (91) and support the overall development of AMF (92). 3) The AMF biomass content correlates with glomalin content in the entire soil volume as well as in macroaggregates (93). Soil aggregates (> 250 μm) provide appropriate sites for microorganisms and therefore the farmyard manure can support the growth and metabolism of multiple AMF species, which is stated in recent studies (94, 95). In accord with this, the highest TG content as well as the highest aggregate stability (WSA) was determined in the F1 treatment. Similarly, Nthebere et al. (17) determined positive correlation between stability of aggregates (1-2 mm) and TG content.
In contrast, Stehlíková et al. (50) found no effect of manure application on the stability of soil aggregates when compared to the unfertilised treatment on phaeozem and even observed a negative effect on chernozem. However, they did report a positive effect of manure application on the stability of soil aggregates on cambisol.
Although CSOM content was increased in the SS3 treatment due to the extremely high dose of the applied sludge, the SOM quality (HA, EEG/CSOM, and TG/CSOM) did not increase proportionally. The extremely high inputs of N (including NH4+) negatively impacted the stability of soil aggregates (48). Our previous conclusion regarding the application of sewage sludge in a long-term maize monoculture experiment on chernozem could not be confirmed, as the sewage sludge application in that study increased the stability of soil aggregates (38).
We did not establish any relationship between the water stability of aggregates (WSA) with glomalin content (EEG and TG) and PWI. The conclusion of Zhang et al. (96) and Nthebere et al. (17) could not be confirmed, as they mentioned that glomalin is an important factor in soil stability of soil aggregates. The effect of glomalin on stability of soil aggregates was also mentioned by Gispert et al. (24). High water stability of soil aggregates (WSA) is most likely caused by the application of SOM hydrophobic components. This is connected to the lower wettability of aggregates (higher hydrophobicity index values). In turn, this means greater protection for the soil aggregates (34). According to Thai et al. (43), the soil aggregates contain more hydrophobic groups, that stabilize the soil structure.
Similarly to our current study, Stehlíková et al. (50) did not find a correlation between the stability of soil aggregates and EEG or TG, as previously noted by Řezáčová et al. (71) and Wright and Anderson (97). The lack of relationship between glomalin content and WSA in this study can be summarized as: a) Applied organic fertilisers and mineral N fertilisers had varying effects on the SOM content and quality including the glomalin content. b) The effects of treatments were in many cases opposed regarding individual indicators (namely, the SS3 treatment). c) Glomalin content is only one of many factors influencing the soil aggregate stability. d) Two sites are evaluated, which increases the variability in the data. Moreover, further studies should be carried out to verify the use of glomalin as an indicator of aggregate stability in soils. Our achieved results further enhance the conclusions that mention the stability of soil aggregates is not only connected to the SOM content but also its quality and other factors, such as pH, clay particle content and quality, or the presence of Fe, Mn, Al (39, 40, 42).
In the Czech Republic, luvisols belong to some of the most fertile soils. The problem is their relative susceptibility to a decrease in the SOM content and quality (98). The selected sites represent a considerable area of the Czech Republic in relation to their average temperature and precipitation. The selected crops (potatoes/maize, winter wheat, and spring barley) represent 50.2% of arable soil of the Czech Republic. Therefore, the achieved results regarding the changes in the SOM content and quality can be applied to the entire area of the Czech Republic luvisols. A positive effect of fertiliser on the SOM content and quality was visible in long-term field experiments with short crop rotation. The highest SOM quality was recorded after the farmyard manure application (highest HA, PWI, TG content, and WSA). The barley straw incorporation (once per three years) contributed to the stabilisation of SOM. This technology must be maximally used especially in crop rotations without perennial, forage crops (alfalfa, clover) and farms without animal husbandry. The application of sewage sludge can also be used. This, however, introduces the risk of dangerous risk element contamination. Mineral nitrogen fertiliser increased the CSOM content in comparison with the unfertilised control. On the other hand, some SOM quality indicators were affected negatively, especially the HA value.
The raw data supporting the conclusions of this article will be made available by the authors, without undue reservation.
JB: Conceptualization, Funding acquisition, Project administration, Writing – original draft. PS: Data curation, Visualization, Writing – review & editing. JČ: Methodology, Supervision, Writing – review & editing. OS: Investigation, Methodology, Writing – original draft. MK: Writing – review & editing. SP: Data curation, Methodology, Writing – review & editing.
The author(s) declare that financial support was received for the research and/or publication of this article. Research in this manuscript was funded by the Ministry of Agriculture of the Czech Republic grant numbers QK21010124 and QK23020056.
The authors declare that the research was conducted in the absence of any commercial or financial relationships that could be construed as a potential conflict of interest.
The author(s) declare that no Generative AI was used in the creation of this manuscript.
All claims expressed in this article are solely those of the authors and do not necessarily represent those of their affiliated organizations, or those of the publisher, the editors and the reviewers. Any product that may be evaluated in this article, or claim that may be made by its manufacturer, is not guaranteed or endorsed by the publisher.
1. Food Agriculture Organization of United Nations. FAO’S Work on Climate Change (2018). Available online at: https://openknowledge.fao.org/server/api/core/bitstreams/7b68d197-abcf-49a2-ad5a-48e7b9141d86/content (Accessed May 31, 2024).
2. Capriel P. Trends in organic carbon and nitrogen contents in agricultural soils in Bavaria (south Germany) between 1986 and 2007. Eur J Soil Sci. (2013) 64:445–54. doi: 10.1111/ejss.12054
3. Loveland P, Webb J. Is there a critical level of organic matter in the agricultural soils of temperate regions: a review. Soi. Till Res. (2003) 70:1–18. doi: 10.1016/s0167-1987(02)00139-3
4. Murphy BW. Impact of soil organic matter on soil properties-a review with emphasis on Australian soils. Soil Res. (2015) 53:257–67. doi: 10.1071/sr14246
5. Harms TK, Groffman PM, Aluwihare L, Craft C, Wieder WR, Hobbie SE, et al. Patters and trends of organic matter processing and transport: insights from the US long-term ecological research network. Clim Change Ecol. (2021) 2:100025. doi: 10.1016/j.ecoch.2021.100025
6. Stevenson FJ. Humus Chemistry, Genesis, Composition, Reactions. New York: John Wiley and Sons (1994). p. 512.
7. Piccolo A. The supramolecular structure of humic substances: A novel understanding of humus chemistry and implications in soil science. Adv Agron. (2002) 75:57–134. doi: 10.1016/j.aca.2012.01.027
8. Nebbioso A, Piccolo A. Advances in humeomics: Enhanced structural identification of humic molecules after size fractionation of a soil humic acid. Anal Chim Acta. (2012) 720:77–90. doi: 10.1016/j.aca.2012.01.027
9. Wang R, Li D, Zheng G, Gao Z, Deng F. Co-production of water-soluble humic acid fertilizer and crude cellulose from rice straw via urea assisted artificial humification under room temperature. Chem Eng J. (2023) 455:140916. doi: 10.1016/j.cej.2022.140916
10. Wright SF, Upadhyaya A. A survey of soils for aggregate stability and glomalin, a glycoprotein produced by hyphae of arbuscular mycorrhizal fungi. Plant Soil. (1998) 198:97–107. doi: 10.1023/A:1004347701584
11. Bedini S, Avio L, Sbrana C, Turrini A, Migliorini P, Vazzana C, et al. Mycorrhizal activity and diversity in a long-term organic Mediterranean agroecosystem. Biol Fertil Soils. (2013) 49:781–90. doi: 10.1007/s00374-012-0770-6
12. Wu QS, Cao MQ, Zou YN, He XH. Direct and indirect effects of glomalin, mycorrhizal hyphae, and roots on aggregate stability in rhizosphere of trifoliate orange. Sci Rep. (2014) 4:5823. doi: 10.1038/srep05823
13. Singh AK, Rai A, Singh N. Effect of long-term land use systems on fractions of glomalin and soil organic carbon in the Indo-Gangetic plain. Geoderma. (2016) 277:41–50. doi: 10.1016/j.geoderma.2016.05.004
14. Staunton S, Saby NPA, Arrouays D, Quiqampoix H. Can soil properties and land use explain glomalin-related soil protein (GRSP) accumulation? A nationwide survey in France. Catena. (2020) 193:104620. doi: 10.1016/j.catena.2020.104620
15. Wright SF, Upadhyaya A. Extraction of an abundant and unusual protein from soil and comparison with hyphal protein of arbuscular mycorrhizal fungi. Soil Sci. (1996) 161:575–86. doi: 10.1097/00010694-199609000-00003
16. Luna L, Miralles I, Andrenelli MC, Gispert M, Pellergini S, Vignozzi N, et al. Restoration techniques affect soil organic carbon, glomalin and aggregate stability in degraded soils of a semiarid Mediterranean region. Catena. (2016) 143:256–64. doi: 10.1016/j.catena.2016.04.013
17. Nthebere K, Prakash TR, Bhimireddy P, Chandran LP, Gudapati J, Admala M, et al. Conservation agricultural practices promoted arbuscular mycorrhizal fungal colonization and glomalin content on sandy clay loam of southern India. Heliyon. (2025) Volume II:e41196. doi: 10.1016/j.heliyon.2024.e41196
18. Liu T, Guo L, Cau C, Tan W, Li C. Long-term rice-oilseed rape rotation increases soil organic carbon by improving functional groups of soil organic matter. Agric Ecosyst Environ. (2021) 319:107548. doi: 10.1016/j.agee.2021.107548
19. Bolliger A, Nalla A, Magid J, de Neergaard A, Nalla DA, Bøghasen TC. Reexamining the glomalin-purity of glomalin-related soil protein fractions through immunochemical, lectin-affinity and soil labelling experiments. Soil Biol Biochem. (2008) 40:887–93. doi: 10.1016/j.soilbio.2007.10.019
20. Gillespie AW, Farrell RE, Walley FL, Ross ARS, Leinweber P, Eckhardt KU, et al. Glomalin-related soil protein contains non-mycorrhizal-related heat-stable proteins, lipids and humic materials. Soil Biol Biochem. (2011) 43:766–77. doi: 10.1016/j.soilbio.2010.12.010
21. Černý J, Balík J, Suran P, Sedlář O, Procházková S, Kulhánek M. The content of soil glomalin concerning selected indicators of soil fertility. Agronomy. (2024) 14:1731. doi: 10.3390/agronomy14081731
22. Nichols KA, Wright SF. Comparison of glomalin and humic acid in eight native U. S. soils. Soil Sci. (2005) 140:985–97. doi: 10.1097/01.ss.0000198618.06975.3c
23. Singh G, Bhattacharyya R, Das TK, Sharma AR, Ghosh A, Das S, et al. Crop rotation and residue management effects on soil enzyme activities, glomalin and aggregate stability under zero tillage in the Indo-Gangetic Plains. Soil Till Res. (2018) 184:291–300. doi: 10.1016/j.still.2018.08.006
24. Gispert M, Emran M, Pardini G, Doni S, Ceccanti B. The impact of land management and abandonment on soil enzymatic activity, glomalin content and aggregate stability. Geoderma. (2013) 202–203:51–61. doi: 10.1016/j.geoderma.2013.03.012
25. Wang Q, Wu Y, Wang WJ, Zhong ZL, Pei ZX, Ren J, et al. Spatial variations in concentration, compositions of glomalin related soil protein in poplar plantations in northeastern China, and possible relations with soil physicochemical properties. Sci World J. (2014) 13:160403. doi: 10.1155/2014/160403
26. Dai J, Hu J, Zhu A, Lin X. No-tillage with half-amount residue retention enhances microbial functional diversity, enzyme activity and glomalin-related soil protein content within soil aggregates. Soil Use Manag. (2017) 33:153–62. doi: 10.1111/sum.12329
27. Saikia R, Sharma S, Thind HS, Sidhu HS, Yadvinder S. Temporal changes in biochemical indicators of soil quality in response to tillage, crop residue and green manure management in a rice-wheat system. Ecol Indic. (2019) 103:383–94. doi: 10.1016/j.ecolind.2019.04.035
28. Turgay OC, Buchan D, Moeskops B, De Gusseme B, Ortas I, De Neve S. Changes in soil ergosterol content, glomalin related soil protein, and phospholipid fatty acid profile as affected by long-term organic and chemical fertilization practices in Mediterranean Turkey. Arid Land Res Manag. (2015) 29:180–98. doi: 10.1080/15324982.2014.944246
29. Sandeep S, Manjaiah KM, Pal S, Singh AK. Soil carbon fractions under maize-wheat system: Effect of tillage and nutrient management. Environ Monit Assess. (2016) 188:14. doi: 10.1007/s10661-015-4995-3
30. Zhang X, Wu X, Zhang S, Xing Y, Wang R, Liang W. Organic amendment effects on aggregate-associated organic C, microbial biomass C and glomalin in agricultural soils. Catena. (2014) 123:188–94. doi: 10.1016/j.catena.2014.08.011
31. Bertagnoli BG, Oliveira JF, Barbosa GM, Colozzi Filho A. Poultry litter and liquid swine slurry applications stimulate glomalin, extraradicular mycelium production, and aggregation in soils. Soil Till Res. (2020) 202:104657. doi: 10.1016/j.still.2020.104657
32. Balík J, Kulhánek M, Černý J, Sedlář O, Suran P. Soil organic matter degradation in long-term maize cultivation and insufficient organic fertilization. Plants. (2020) 9:1217. doi: 10.3390/plants9091217
33. Li X, Han S, Luo XS, Chen WL, Huang QY. Arbuscular mycorrhizal-like fungi and glomalin-related soil protein drive the distributions of carbon and nitrogen in a large scale. J Soil Sediments. (2020) 20:963–72. doi: 10.1007/s11368-019-02421-4
34. Pavlů L, Balík J, Procházková S, Vokurková P, Falušková I, Sedlář O. Soil organic matter quality of variously managed agricultural soil in the Czech Republic evaluated using DRIFT spectroscopy. Soil Water Res. (2023) 18:281–91. doi: 10.17221/89/2023-SWR
35. Demyan MS, Rasche F, Schul E, Breulmann M, Muller T, Cadisch G. Use of specific peaks obtained by diffuse reflectance Fourier transform mid-infrared spectroscopy to study the composition of organic matter in a Haplic Chernozem. Eur J Soil Sci. (2012) 63:189–99. doi: 10.1111/j.1365-2389.2011.01420.x
36. Balík J, Kulhánek M, Černý J, Sedlář O, Suran P, Asrade DA. The Influence of organic and mineral fertilizers on the quality of soil organic matter and glomalin content. Agronomy. (2022) 12:1375. doi: 10.3390/agronomy12061375
37. Balík J, Kulhánek M, Černý J, Sedlář O, Suran P, Procházková S, et al. The impact of the long-term application of mineral nitrogen and sewage sludge fertilizers on the quality of soil organic matter. Chem Biol Technol Agric. (2022) 9:86. doi: 10.1186/s40538-022-00353-9
38. Balík J, Suran P, Sedlář O, Černý J, Kulhánek M, Procházková S, et al. The effect of long-term farmyard manure and mineral fertilizer application on the increase in soil organic matter quality of Cambisols. Agronomy. (2023) 13:2960. doi: 10.3390/agronomy13122960
39. Kodešová R, Rohošková M, Žigová A. Comparison of aggregate stability within six soil profiles under conventional tillage using various laboratory tests. Biologia. (2009) 64:550–4. doi: 10.2478/s11756-009-0095-6
40. Jakšík O, Kodešová R, Kubiš A, Stehlíková I, Drábek O, Kapička A. Soil aggregate stability within morphologically diverse areas. Catena. (2015) 127:287–99. doi: 10.1016/j.catena.2015.01.010
41. Pavlů L, Kodešová R, Fér M, Nikodem A, Němec F, Prokeš R. The impact of various mulch types on soil properties controlling water regime of the haplic Fluvisol. Soil Tillage Res. (2021) 205:104748. doi: 10.1016/j.still.2020.104748
42. Pavlů L, Kodešová R, Vašát R, Fér M, Klement A, Nikodem A, et al. Estimation of the stability of topsoil aggregates in areas affected by water erosion using selected soil and terrain properties. Soil Tillage Res. (2022) 219:105348. doi: 10.1016/j.still.2022.105348
43. Thai S, Davídek T, Pavlů L. Causes clarification of the soil aggregates stability on mulched soil. Soil Water Res. (2022) 17:91–9. doi: 10.17221/151/2021-SWR
44. Fér M, Leue M, Kodešová R, Gerke HH, Ellerbrock RH. Droplet infiltration dynamics and soil wettability related to soil organic matter of soil aggregate coatings and interiors. J Hydrol Hydromechan. (2016) 64:111–20. doi: 10.1515/johh-2016-0021
45. Bronick CJ, Lal R. Soil structure and management: a review. Geoderma. (2005) 124:3–22. doi: 10.1016/j.geoderma.2004.03.005
46. Guo Z, Zhang J, Fan J, Yang X, Han X, Wang D, et al. Does animal manure application improve soil aggregation? Insights from nine long-term fertilization experiments. Sci Total Environ. (2019) 600:1029–37. doi: 10.1016/j.scitotenv.2019.01.051
47. Zhang YES, Wang Y, Su S, Bai L, Wu C, Zeng X. Long-term manure application enhances the stability of aggregates and aggregate-associated carbon by regulating soil physicochemical characteristics. Catena. (2021) 203:105342. doi: 10.1016/j.catena.2021.105342
48. Gautam A, Guzman J, Kovacs P, Kumar S. Manure and inorganic fertilization impacts on soil nutrients, aggregate stability, and organic carbon and nitrogen in different aggregate fractions. Arch Agron Soil Sci. (2022) 68:1261–73. doi: 10.1080/03650340.2021.1887480
49. Abdalla K, Gaiser T, Seidel SJ, Pausch J. Soil organic carbon and nitrogen in aggregates in response to over seven decades of farmyard manure application. J Plant Nutr Soil Sci. (2023) 86:253–8. doi: 10.1002/jpln.202300062
50. Stehlíková I, Kodešová R, Kunzová E, Czakó A, Mayerová M, Madaras M. Sixty-year impact of manure and NPK on soil aggregate stability. Geoderma Regional. (2024) 39:e00858. doi: 10.1016/j.geodrs.2024.e00858
51. Food and Agriculture Organization of the United Nations. World Reference Base for Soil Resources (2015). International Soil Classification System for Naming and Creating Legends for Soil Maps, Food and Agriculture Organization of the United Nations. Available online at: http://www.fao.org/3/i3794en/I3794en.pdf (Accessed September 1, 2020).
52. Czech Statistical Office. Sown areas of crops as at 31 May (2025). Available online at: https://vdb.czso.cz/vdbvo2/faces/en/index.jsf?page=vystup-objekt&pvo=ZEM02A&z=T&f=TABULKA&skupId=346&katalog=30840&pvo=ZEM02A&evo=v2369_!_ZEM02A-2024T_1 (Accessed February 20, 2025).
53. United States Department of Agriculture–Natural Resources Conservation Service. Soil Taxonomy (1999). Available online at: https://www.nrcs.usda.gov/Internet/FSE_DOCUMENTS/nrcs142p2_051232.pdf (Accessed May 2, 2022).
54. Minasny B, Mcbratney AB, Brough DM, Jacquier D. Models relating soil pH measurements in water and calcium chloride that incorporate electrolyte concentration. Eur J Soil Sci. (2011) 62:728–32. doi: 10.1111/j.1365-2389.2011.01386.x
55. Mehlich A. Mehlich 3 soil test extractant: A modification of Mehlich 2 extractant. Commun Soil Sci Plant Anal. (1984) 15:1409–16. doi: 10.1080/00103628409367568
56. International Organization for Standardization. Soil Quality—Extraction of Trace Elements Soluble in Aqua Regia (ISO Standard No. 11466:1995) (1995). Available online at: https://www.iso.org/standard/19418.html (Accessed December 20, 2022).
57. Sparks DL, Page AL, Helmke PA, Loeppert RH. Methods of Soil Analysis Part 3. Chemical Methods. Madison: ACSESS (2020). p. 1424.
58. Kononova MM. Soil Organic Matter: Nature, Properties and Methods of Study. Oxford, United Kingdom: Pergamon Press Ltd (1996).
59. Raiesi F. The quantity and quality of soil organic matter and humic substances following dry-farming and subsequent restoration in an upland pasture. Catena. (2021) 202:105249. doi: 10.1016/j.catena.2021.105249
60. Iqbal MK, Shafiq T, Hussain A, Ahmed K. Effect of enrichment on chemical properties of MSW compost. Bioresour Technol. (2010) 101:5969–77. doi: 10.1016/j.biortech.2010.02.105
61. Ellerbrock RH, Gerke H, Bachman J, Goebel M. Composition of organic matter fractions for explaining Wettability of three forest soils. Soil Sci Soc Am J. (2005) 69:57–66.
62. Nimmo JR, Perkins KS. Aggregate stability and size distribution. In: Dane JH, Topp GC, editors. Methods of soil analysis: Part 4 Physical methods, 5.4. Soil Science Society of America, Madison (2002). p. 317–27. doi: 10.2136/sssabookser5.4.c14
63. Wang SC, Zhao YW, Wang JZ, Zhu P, Cui X, Han XZ, et al. The efficiency of long-term straw return to sequester organic carbon in Northeast China’s cropland. J Integr Agric. (2018) 17:436–48. doi: 10.1016/S2095-3119(17)61739-8
64. Menšík L, Hlisnikovský L, Pospíšilová L, Kunzová E. The effect of application of organic manures and mineral fertilizers on the state of soil organic matter and nutrients in the long-term field experiment. J Soils Sediments. (2018) 18:2813–22. doi: 10.1007/s11368-018-1933-3
65. Liang Y, Han X, Ding X, Chen X. Distribution of soil organic carbon and nitrogen in density fractions on black soil as affected by different amounts of organic manure application. J Soil Water Conserv. (2012) 26:174–8. doi: 10.10002/jpln.202100062
66. Voltr V, Menšík L, Hlisnikovský L, Hruška M, Pokorný E, Pospíšilová L. The soil organic matter in connection with soil properties and soil inputs. Agronomy. (2021) 11:779. doi: 10.3390/agronomy11040779
67. Naikwade PV. Soil organic carbon sequestration by long-term application of manures prepared from trianthema portulacastrurm linn. Comm Soil Sci Plant Anal. (2019) 50:2579–92. doi: 10.1080/00103624.2019.1671442
68. Macholdt J, Piepho HP, Honermeier B. Mineral NPK and manure fertilisation affecting the yield stability of winter wheat: Results from a long-term field experiment. Eur J Agron. (2019) 102:14–22. doi: 10.1016/j.eja.2018.10.007
69. Lan X, Shan J, Huang Y, Liu X, Lv Z, Ji J, et al. Effects of long-term manure substitution regimes on soil organic carbon composition in a red paddy soil of southern China. Soil Till Res. (2022) 221:105395. doi: 10.1016/j.still.2022.105395
70. Mahal NK, Osterholz WR, Miguez FE, Poffenbarger HJ, Sawyer JE, Olk DC, et al. Nitrogen fertilizer suppresses mineralization of soil organic matter in maize agroecosystems. Front Ecol Evol. (2019) 7:59. doi: 10.3389/fevo.2019.00059
71. Řezáčová V, Czakó A, Stehlík M, Mayerová M, Šimon T, Smatanová M, et al. Organic fertilization improves soil aggregation through increases in abundance of eubacteria and products of arbuscular mycorrhizal fungi. Sci Rep. (2021) 11:12548. doi: 10.1038/s41598-021-91653-x
72. Balík J, Suran P, Sedlář O, Černý J, Kulhánek M, Procházková S, et al. Long-term application of manure and different mineral fertilization in relation to the soil organic matter quality of luvisols. Agronomy. (2023) 13:2678. doi: 10.3390/agronomy13112678
73. Xie HT, Li JW, Zhang B, Wang LF, He HB, Yang XD. Long-term manure amendments reduced soil aggregate stability via redistribution of the glomalin-related soil protein in macroaggregates. Sci Rep. (2015) 5:14687. doi: 10.1038/srep14687
74. Curaqueo G, Barea JM, Acevedo E, Rubio R, Cornejo P, Borie F. Effects of different tillage system on arbuscular mycorrhizal fungal propagules and physical properties in a Mediterranean agroecosystem in Central Chile. Soil Till Res. (2011) 113:11–8. doi: 10.1016/j.still.2011.02.004
75. Dai J, Hu JL, Lin XG, Yang A, Wang R, Zhang JB, et al. Arbuscular mycorrhizal fungal diversity, external mycelium length, and glomalin-related soil protein content in response to long-term fertilizer management. J Soils Sediments. (2013) 13:1–11. doi: 10.1007/s11368-012-0576-z
76. Yang H, Xiao Q, Huang Y, Cai Z, Li D, Wu L, et al. Long-term manuring facilitates glomalin-related soil proteins accumulation by chemical composition shifts and macro-aggregation formation. Soil Till Res. (2024) 235:105904. doi: 10.1016/j.still.2023.105904
77. Haas C, Gerker HH, Ellerbrock RH, Hallet PD, Horn R. Relating soil organic matter composition to soil water repellency for soil biopore surfaces different in history from two Bt horizons of a Haplic Luvisol. Ecohydrology. (2018) 11:e1949. doi: 10.1002/eco.1949
78. Oktaba L, Odrobinska D, Uzarowicz L. The impact of different land uses in urban area on humus quality. J Soils Sediments. (2018) 18:2823–32. doi: 10.1007/s11368-018-1982-7
79. Liu RC, Gao WQ, Srivastava AK, Zou YN, Kuča K, Hashem A, et al. Differential effects of exogenous glomalin-related soil proteins on plant growth of trifoliate orange through regulating auxin changes. Front Plant Sci. (2021) 12:745402. doi: 10.3389/fpls.2021.745402
80. Hu Q, Liu T, Ding H, Guo L, Li C, Jiang Y, et al. Application rates of nitrogen fertilizers change the pattern of soil organic carbon fractions in a rice-wheat rotation system in China. Agric Ecosyst Environ. (2022) 338:108081. doi: 10.1016/j.agee.2022.108081
81. Leue M, Hoffman C, Hierold W, Sommer M. In-situ multi-sensor characterization of soil cores along an erosion-deposition gradient. Catena. (2019) 182:104140. doi: 10.1016/j.catena.2019.104140
82. Cunha TJF, Novotny EH, Madari BE, Martin-Neto L, Rezende MO, Canelas LP, et al. Spectroscopy characterization of humic acids isolated from amazonian dark earth soils (Terra preta de índio). In: Woods WI, Teixeira WG, Lehmann J, Steiner C, editors. Amazonian Dark Earths: Wim Sombroek’s Vision. Springer, Dordrecht (2009). p. 363–72.
83. Anthonio CK, Huang J, Han T, Qaswar M, Liu K, Du J, et al. Fertilizer combination effects on aggregate stability and distribution of aluminum and iron oxides. J Plant Nutr Soil Sci. (2022) 185:251–63. doi: 10.1002/jpln.202000290
84. Abrar MM, Xu M, Shah SAA, Aslam MW, Aziz T, Mustafa A, et al. Variations in the profile distribution and protection mechanisms of organic carbon under long-term fertilization in a Chinese Mollisol. Sci Tot Environ. (2020) 723:138181. doi: 10.1016/j.scitotenv.2020.138181
85. Agnihotri R, Sharma MP, Prakash A, Ramesh A, Bhattacharjya S, Patra AK, et al. Glycoproteins of arbuscular mycorrhiza for soil carbon sequestration: Review of mechanisms and controls. Sci Total Environ. (2022) 806:150571. doi: 10.1016/j.scitotenv.2021.150571
86. Balík J, Kulhánek M, Černý J, Sedlář O, Suran P. Impact of organic and mineral fertilising on aluminium mobility and extractability in two temperate Cambisols. Plant Soil Environ. (2019) 65:581–7. doi: 10.17221/587/2019-PSE
87. Asrade DA, Kulhánek M, Balík J, Černý J, Sedlář O. Side effect of organic fertilizing on the phosphorus transformation and balance over 27 years of maize monoculture. Field Crops Res. (2023) 291:108902. doi: 10.1016/j.fcr.2023.108902
88. Johnson NC. Resource stoichiometry elucidates the structure and function of arbuscular mycorrhizas across scales. New Phytol. (2010) 185:631–47. doi: 10.1111/j.1469-8137.2009.03110.x
89. Ozlu E, Sandhu SS, Kumar S, Arriaga FJ. Soil health indicators impacted by long-term cattle manure and inorganic fertilizer application in a corn-soybean rotation of South Dakota. Sci Rep. (2019) 9:11776. doi: 10.1038/s41598-019-48207-z
90. Wang H, Parent S, Gosselin A, Desjardins Y. Vesicular-arbuscular mycorrhizal peat-based substrates enhance symbiosis establishment and growth of three micropropagated species. J Am Soc Hortic Sci. (1993) 118:896–901. doi: 10.21273/JASHS.118.6.896
91. Ma N, Yokoyama K, Marumoto T. Promotion of host plant growth and infection of roots with arbuscular mycorrhizal fungus Gigaspora margarita by the application of peat. Soil Sci Plant Nutr. (2006) 52:162–7. doi: 10.1111/j.1747-0765.2006.00019.x
92. Delavaux CS, Smith-Ramesh LM, Kuebbing SE. Beyond nutrients: a meta-analysis of the diverse effects of arbuscular mycorrhizal fungi on plants and soils. Ecology. (2017) 98:2111–9. doi: 10.1002/ecy.1892
93. Yang H, Cai Z, De Clerk C, Meersmans J, Colinet G, Zhang W. Long-term manuring enhanced compositional stability of glomalin-related soil proteins through arbuscular mycorrhizal fungi regulation. Agriculture. (2024) 14:1510. doi: 10.3390/agriculture14091510
94. Huo W, Chai X, Wang X, Batchelor WD, Kafle A, Gu F. Indigenous arbuscular mycorrhizal fungi play a role in phosphorus depletion in organic manure amended high fertility soil. J Integr Agric. (2022) 21:3051–66. doi: 10.1016/j.jia.2022.07.045
95. Liu W, Ma K, Wang X, Wang Z, Negrete-Yankelevich S. Effects of no-tillage and biologically-based organic fertilizer on soil arbuscular mycorrhizal fungal communities in winter wheat field. Appl Soil Ecol. (2022) 178:104564. doi: 10.1016/j.scitotenv.2021.146104
96. Zhang J, Tang X, He X, Liu J. Glomalin-related soil protein responses to elevated CO2 and nitrogen addition in a subtropical forest: potential consequences for soil carbon accumulation. Soil Biol Biochem. (2015) 83:142–9. doi: 10.1016/j.soilbio.2015.01.023
97. Wright SF, Anderson RL. Aggregate stability and glomalin in alternative crop rotations for the central Great Plains. Biol Fertil Soils. (2000) 31:249–53. doi: 10.1007/s003740050653
Keywords: GRSP, glomalin-related soil protein, potential wettability index, soil aggregate stability, soil organic carbon, organic fertilizers
Citation: Balík J, Suran P, Černý J, Sedlář O, Kulhánek M and Procházková S (2025) Changes in soil organic matter content and quality after application of different organic and mineral fertilisers in 27 years long-term field experiments on luvisol. Front. Soil Sci. 5:1540137. doi: 10.3389/fsoil.2025.1540137
Received: 05 December 2024; Accepted: 12 March 2025;
Published: 27 March 2025.
Edited by:
Giovanni Mastrolonardo, University of Florence, ItalyReviewed by:
Muhammad Mohsin Abrar, Zhongkai University of Agriculture and Engineering, ChinaCopyright © 2025 Balík, Suran, Černý, Sedlář, Kulhánek and Procházková. This is an open-access article distributed under the terms of the Creative Commons Attribution License (CC BY). The use, distribution or reproduction in other forums is permitted, provided the original author(s) and the copyright owner(s) are credited and that the original publication in this journal is cited, in accordance with accepted academic practice. No use, distribution or reproduction is permitted which does not comply with these terms.
*Correspondence: Jiří Balík, YmFsaWtAYWYuY3p1LmN6
Disclaimer: All claims expressed in this article are solely those of the authors and do not necessarily represent those of their affiliated organizations, or those of the publisher, the editors and the reviewers. Any product that may be evaluated in this article or claim that may be made by its manufacturer is not guaranteed or endorsed by the publisher.
Research integrity at Frontiers
Learn more about the work of our research integrity team to safeguard the quality of each article we publish.