 Saibal Ghosh†
 Gourav Mondal†
 Shreya Chakraborty
 Sonali Banerjee
 Sumit KumarRiddhi Basu
 Pradip Bhattacharyya*
- Agricultural and Ecological Research Unit, Indian Statistical Institute, Giridih, Jharkhand, India
Four different soil types including red, alluvial, calcareous, and black soils along with rice cultivated on them were collected from various parts of India and analyzed for potassium dynamics in the soil plant continuum. Soil potassium (K) dynamics were studied under submerged and non-submerged conditions, and potassium content was analyzed in rice roots, shoots, and grains, along with other soil properties. Red (S1: 5.9) and alluvial (S5: 5.16) soils were moderately acidic, while black (S8: 8.01) and calcareous (S7: 8.1) soils were alkaline. Black soil (S8) had the highest cation exchange capacity (CEC: 31.25 cmol (p+)/kg) and clay content (41.2%), while alluvial soil had the most organic carbon (S5: 1.74%). Submerged conditions enhanced potassium availability, with red soil showing the highest levels of water-soluble K (WsK), exchangeable K (ExK), and non-exchangeable K (NEK), particularly Step-K and constant rate K (CR-K) forms. Rice potassium content was highest in grains, followed by shoots and roots, with red soil containing the most available potassium. A strong correlation was found between soil potassium forms and rice plant potassium uptake. Sensitivity analysis indicated that WsK and ExK from non-submerged soil to be the most favorable forms for potassium uptake, especially in the rice roots and grains. Machine learning models, particularly Random Forest, accurately predicted potassium availability and uptake, highlighting their potential in optimizing soil fertility and advancing precision agriculture for better crop yields and soil health.
1 Introduction
Potassium (K), one of the most crucial macronutrients for plant growth and metabolism, often varies in terms of its availability in soil based on the texture, pH, mineral composition, and cation exchange capacity (1). In soils, four different forms of K prevail namely, water-soluble (Ws-K), exchangeable (Ex-K), non-exchangeable (NEK), and lattice K (LK) (2, 3). Ws-K is the primary form of K available to plants and is directly absorbed by roots. On the contrary, Ex-K serves as a crucial buffer in soil systems maintaining a dynamic equilibrium by replenishing the Ws-K when depleted (3, 4). Even though being less accessible, non-exchangeable K acts as a reserve pool supplementing the two previous forms on depletion while playing a crucial role in long term fertility of soils and overall buffering (5, 6). Lattice or mineral K is the least accessible form which may convert to other accessible forms when subjected to long term weathering (7–10). The two most significant management factors that affect K equilibrium in soils, aside from these soil characteristics, are fertilization and cropping (11).
Seven distinct types of soil are found in India due to its varied landscapes with unique chemical characteristics and formation history, shaped by the forces of nature (12). Of these type four major soil types were chosen for this study. Among them, alluvial soils, which cover over 75 million hectares in the Brahmaputra Valley and Indo-Gangetic Plains, are generally deficient in organic matter, phosphate, and nitrogen (13). They support a variety of crops and are neutral to slightly alkaline in nature. The parent rock’s potassium-rich minerals, such as mica and feldspar, release K upon weathering, which accounts for their high potash concentration. Calcareous soils, which cover roughly 229 Mha in arid and semi-arid regions, contain a lot of K as they originate from of K-containing minerals and moreover leach less as compared to other soil types. But the available K in these soils is now low due to intensive cultivation and sparse usage of K fertilizer (14). Calcium carbonate (CaCO3) affects the physical and chemical characteristics of calcareous soils, including nutrient availability, water retention and crusting, which in turn affects plant growth (15). Research shows that increasing fixed potassium levels in soils through calcium carbonate removal improves plant availability of K (16). The third type considered in this study, red soil, makes up around 10.6% of the area, and is mostly found in Jharkhand (17). These soils are generally rich in minerals like aluminum, iron and especially in K. However red soils are often reported to have low in nitrogen, phosphorus, and overall organic matter (18). The largest and most important soil group in India for agriculture is alluvial soils, which are created by river silt deposits. These soils are generally fertile and contain a good balance of essential nutrients such as potassium, nitrogen, phosphorus, thereby supporting crop growth. Lastly, black soils of India, are composed of weathered Deccan basalt alluvium, and are abundant in exchangeable K and smectite clay minerals such as calcium, magnesium and iron (19).
Among others, one of the crucial parameters on which soil K availability varies is water activity of soil (20). Given that rice (one of the most economically important crop in India) is mostly grown in submerged environments, changes to the soil’s electrochemical and chemical characteristics brought about by submergence may be linked to changes in the dynamics of K availability. This in turn may have an impact on the availability of K to rice (21). The effect of submersion and non-submersion on soil’s various K pools and its bioavailability remains insufficiently explored. Developing effective fertilizer recommendations, particularly for lowland rice farming, requires an understanding of the forms and transformations of potassium in soils under submerged settings. Therefore, it is essential to develop a model for predicting the uptake of various K pools into different parts of the rice plant (root, shoot, and grain) under both submerged and non-submerged conditions, as both are crucial for plant growth, development and yield. In order to identify important input parameters and assess their impact on exposure outcome variability, Sobol sensitivity analysis (SSA) was used (22). The relative contributions of each variable to the total variance in model outcomes are measured by Sobol sensitivity indices (SSIs). This approach makes it easier to identify the input variables that have a significant, noteworthy, or insignificant impact on the study. Machine learning approaches such as random forest and Taylor plot also serve as a great tool for such assessment, and thus a broad range of investigations have been carried out using such mathematical models. Thus the four different soil types and rice grown on them in submerged and non-submerged conditions were compared in this study and the basic aim was (a) to measure how different potassium pools change under submerged and non-submerged conditions, considering soil properties and their availability for rice plant uptake., (b) to predict the contribution of different soil potassium pools in various rice plant parts (root, shoot, and grain) using Sobol, Taylor, and Random Forest methods.
2 Materials and methods
2.1 Collection and preparation of soil and plant samples
Surface soils (0–15 cm depth) were sampled from eight major rice-growing regions in India, representing red, calcareous, alluvial, and black soils. Sites included West Bengal (alluvial), Bihar (calcareous), Jharkhand (red), and Maharashtra (black), labelled as red: S1, S2, S4, S6; alluvial: S3, S5; calcareous: S7; and black: S8 (Supplementary Figure 1). Three replicate samples per site were collected in November 2023 using a W-pattern method, combined into composite samples, and transported to the lab in sterile bags. After removing visible residues and roots, samples were dried, sieved (2 mm), and stored for chemical analyses (13). These dried and powdered composite samples of soil underwent comprehensive chemical analyses for their characterization. In addition, a quarter part of each soil sample was processed for submergence studies. For this purpose, 25 g of sieved soil was taken from each of the composite samples and prepared for experimentation. At the same time, the plant samples of rice crop were collected from the same geographical sites to assess their potassium contents.
2.2 Estimation of different K forms and submergence study
To examine the effect of submergence on different soil types and potassium forms, a 20 g sample of each soil type was carefully weighed from 25g sieved soil samples and placed into separate incubation tubes to investigate the dynamics of soil K (23). After that, deionized water was poured into these tubes, making sure the water level remained constant at 5.0 ± 0.5 cm above the soil’s surface. In order to reduce evaporation or external contamination, the tubes were tightly sealed with caps. For 30 days, the incubation was conducted in a laboratory setting at 31 ± 2°C ambient temperature. The appropriate water level was maintained by periodically adding deionized water to compensate for evaporation-related water loss. Three replications of each of the two different experimental sets were created. The analysis of the Ws-K, Ex-K, and NEK forms was the main goal of the first set. Step potassium (Step-K) and constant rate potassium (CR-K) were to be assessed using the second set. Using accepted techniques, both the initial and incubated soil samples were thoroughly examined. The methods presented by Page et al. (1982) (24) were used to determine Ws-K, Ex-K, and NEK, whereas Haylock’s (1956) (25) technique was used to evaluate Step-K and CR-K. For natural (non-submerged) soil, the concentrations of all K forms were estimated using the standard protocol described earlier in the submergence study.
This method involves using a sequential extraction procedure to remove exchangeable K from the soil (25). To get out exchangeable K, the soil is first immersed in a 0.1M nitric acid (HNO3) solution for the entire night. In order to more efficiently release K, the soil is first extracted using boiling 1.0M HNO3 after this pre-treatment. The soil is then repeatedly extracted using the same 1.0M HNO3 solution until the rate of K release from the soil reaches equilibrium and stabilizes. Haylock coined the term CR-K in 1956 to describe this steady release rate (25). The amount of CR-K is deducted from the total K released at each stage of the subsequent extractions in order to further investigate K availability. Step-K, the more easily extractable form of NEK, is represented by the resultant value. This calculation aids in differentiating between potassium fractions that are more easily accessible and those that need more time to remove.
2.3 Estimation of the physicochemical properties of soil
The soil’s pH, electrical conductivity (EC) and cation exchange capacity (CEC) were measured at room temperature in accordance with Page et al. (24). The Walkley and Black (26) method was used to assess the organic carbon (OC) in the soil. The hydrometer method, as outlined by Page et al. (1982), was used to determine the particle-size distribution (24). A triangle textural diagram was used to classify the soil’s textural class according to the amounts of sand, silt, and clay Brady (27).
2.4 Estimation of K in different rice plant parts
In order to determine the K content in the various parts of the rice plant, viz. dried roots, shoots, and raw rice grains, the samples (1g) were digested with a di-acid mixture [4:1 HNO3:HClO4 (v/v)] in a conical flask maintained at 190°C on an electric mantle until a color change was observed. The K content in the digested solution was measured using a flame photometer, whereby the method described by Li et al. (2018) was followed (28).
2.5 Statistical analysis
The correlation was calculated using the Pearson product-moment correlation coefficient, which was carried out by the Python (Google Colab). Sobol sensitivity analysis (Python-Google Colab) and machine learning algorithms including Taylor plots, and Random Forest model were carried out in R-Studio (version 4.33).
3 Results
3.1 Physiochemical characteristics of the experimental soil
The physical and chemical properties of the various soil types are summarized in Table 1. The soils were classified into the major groups of red, alluvial, calcareous, and black soils. The pH levels varied across the soil samples, with red and alluvial soils exhibiting moderately acidic characteristics, while calcareous and black soils showing an alkaline pH. The lowest pH were recorded in samples S5 (alluvial soil: 5.16) and S1 (red soil: 5.9). Among the collected soil samples, the highest EC value was observed in S8 (black soil: 0.73 dS/m), while the lowest was found in S5 (alluvial soil: 0.13 dS/m). Black soil (S8) exhibited the highest CEC (31.25 cmol (p+)/kg) and soil clay (41.2%) content values. The alluvial soil (S5) and black soil (S8) samples exhibited relatively higher organic carbon (OC) content, with values of 1.74% and 1.12%, respectively, compared to the other soil types.
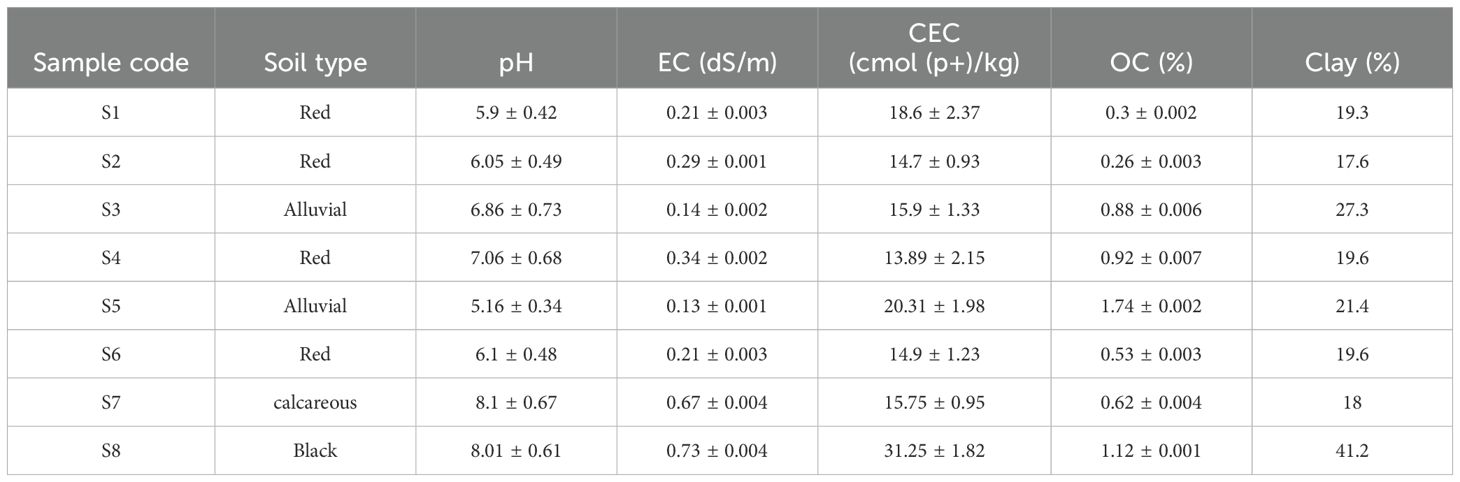
Table 1. Physicochemical attributes different soil samples collected from eight different places from India (mean ± SD) (EC, electrical conductivity; CEC, cation exchange capacity; OC: organic carbon).
3.2 Different K forms in soils
The various forms of soil potassium, including Ws-K, Ex-K, NEK, and TK, were higher in S1 (red soil) under both submerged and non-submerged conditions compared to other soils (Figures 1A–D). The observed trend was: S1 > S2 > S3 > S4 > S5 > S6 > S7 > S8.In contrast, lattice potassium (LK) content was higher in the S2 soil sample compared to the others (Figure 1E). Under submerged conditions, all soil samples showed improved results for various potassium forms compared to natural conditions. A strong negative correlation was identified between different potassium forms and soil physicochemical properties in both extraction methods (natural and submerged) Supplementary Table 1.
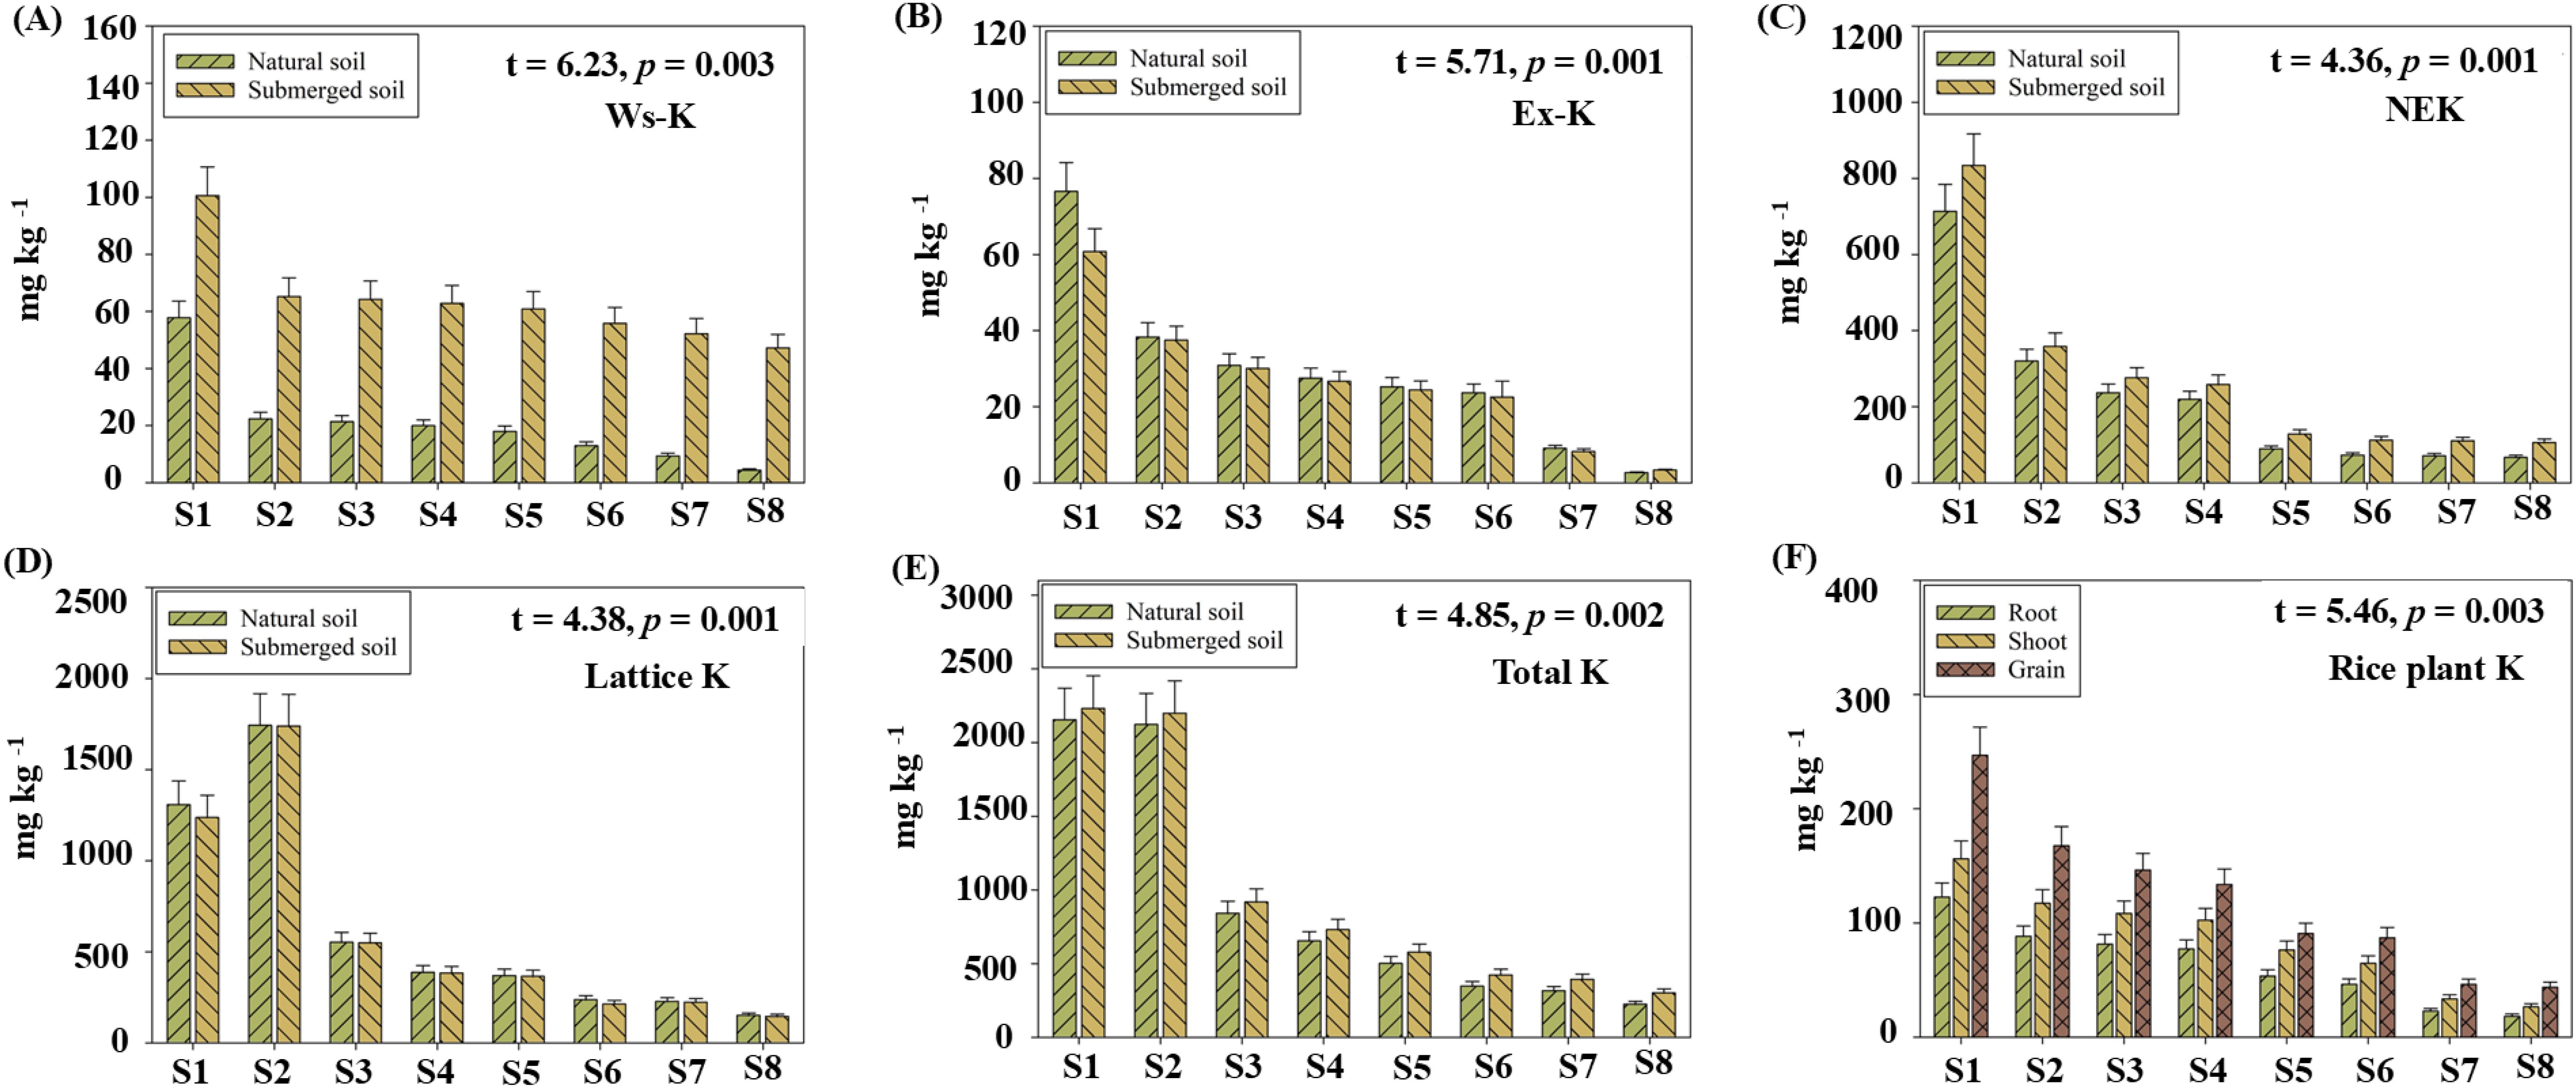
Figure 1. Box plots represent the comparison among the four soil types (red, alluvial, calcareous, and black) across eight soil samples under different conditions (natural and submerged) in terms of various potassium forms and potassium content in rice plant parts (root, shoot, and grain). Each sample code represents the following soil types: S1: red, S2: red, S3: alluvial, S4: red, S5: alluvial, S6: red, S7: calcareous, and S8: black soil. (A) Ws-K, (B) Ex-K, (C) NEK, (D) Lattic K, (E) Total K, (F) Rice plant K.
3.3 Sequential extraction (Step-K) of soil K and constant rate K
Soluble K was extracted using 0.1 M HNO3, followed by 1 M HNO3, revealing two NEK forms: Step-K, which depleted after six extractions, and CR-K, released at a constant rate in both natural and submerged soil samples (Figures 2A–H, 3A–H). Among all soil samples under natural conditions, S1, S2, and S3 exhibited the highest Step-K and CR-K values, while S8 recorded the lowest. Under submerged conditions, S1 outperformed all other samples. When comparing the two methods, natural soil exhibited a more sequential release of potassium than submerged soil.
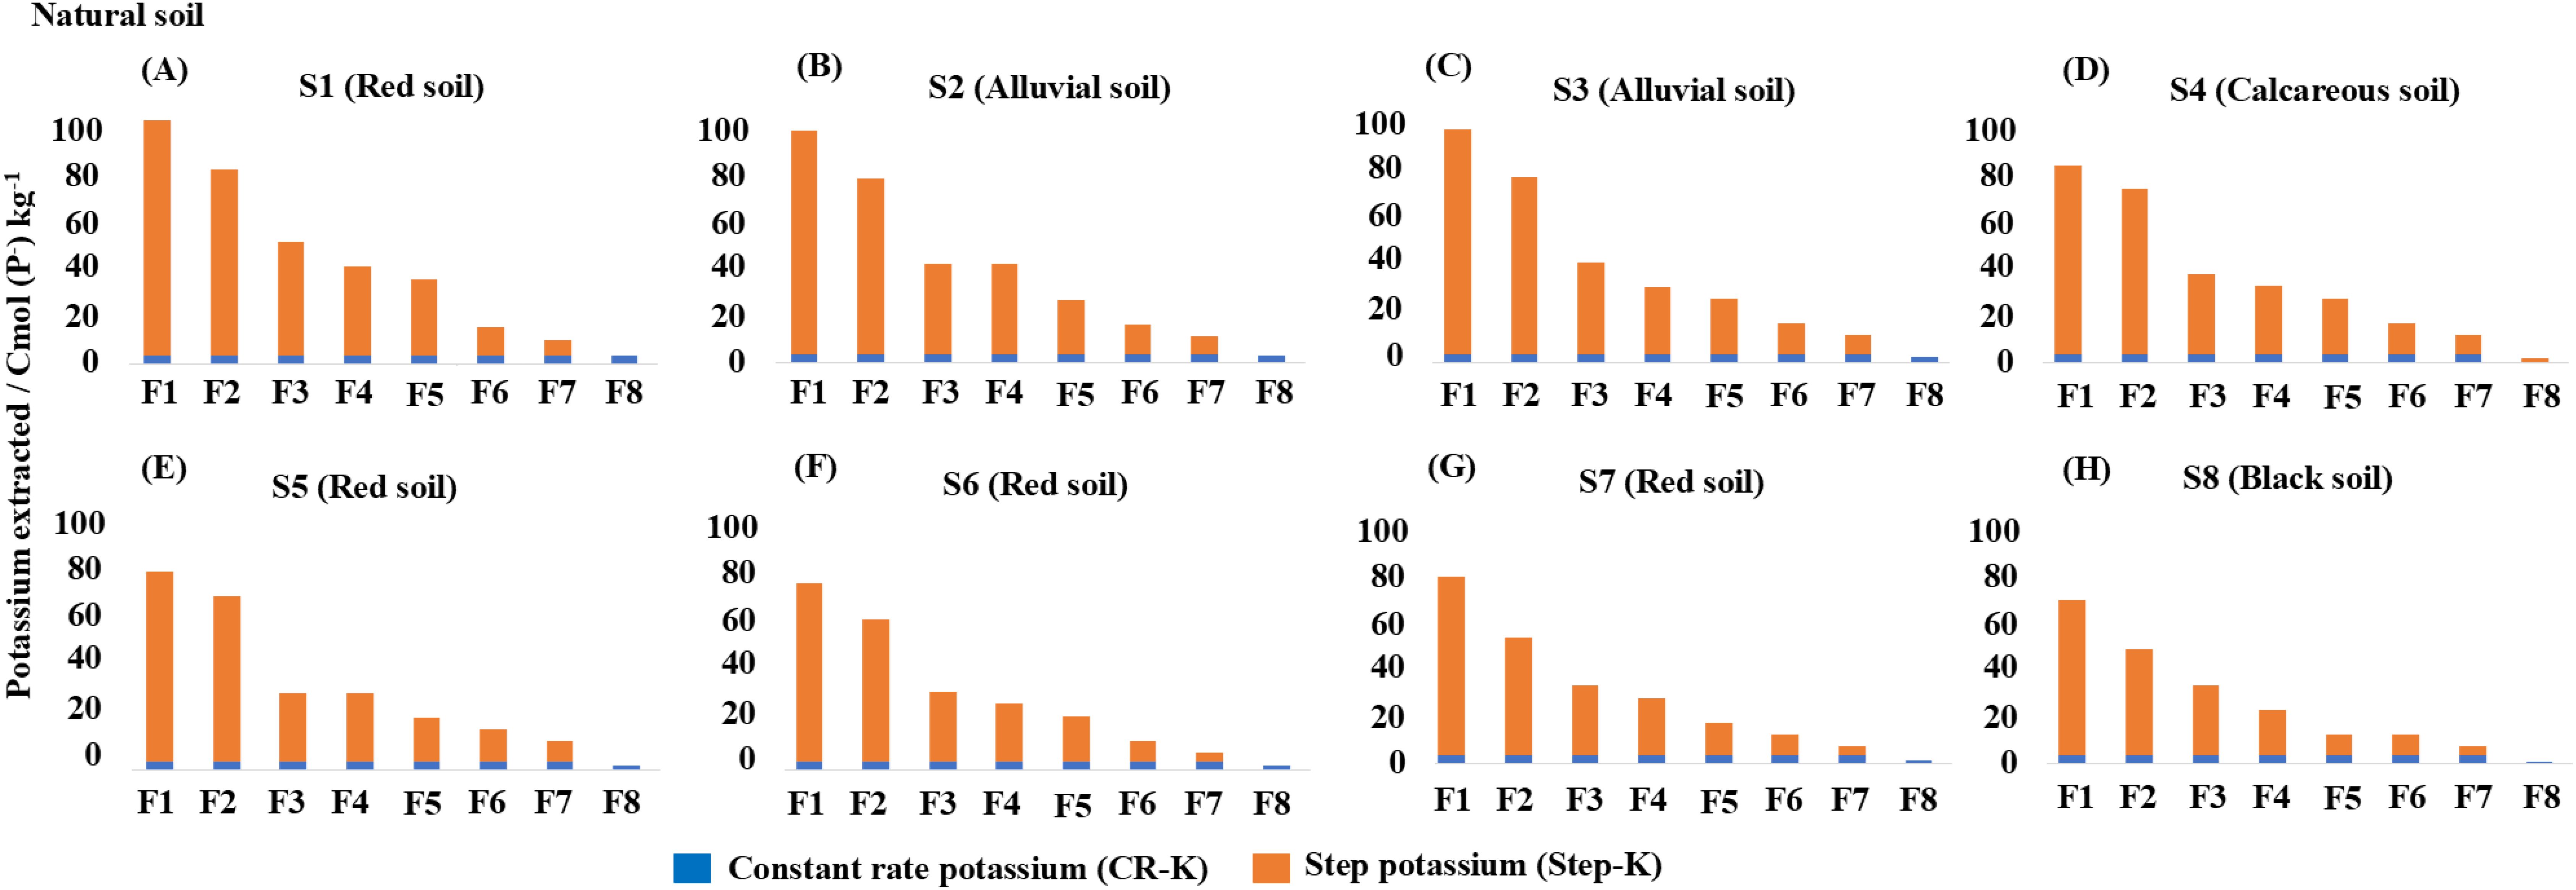
Figure 2. Stag bar graphs of submerged soil represent the continuous extraction (F1, F2, F3, F4, F5, F6, F7, and F8 at 10-minute intervals) of potassium from the four soil types (red, alluvial, calcareous, and black) across eight soil samples using boiling 1 M HNO3, following the removal of exchangeable potassium. (A) S1 (Red soil), (B) S2 (Alluvial soil), (C) S3 (Alluvial soil), (D) S4 (Calcareous soil), (E) S5 (Red soil), (F) S6 (Red soil), (G) S7 (Red soil), (H) S8 (Black soil).
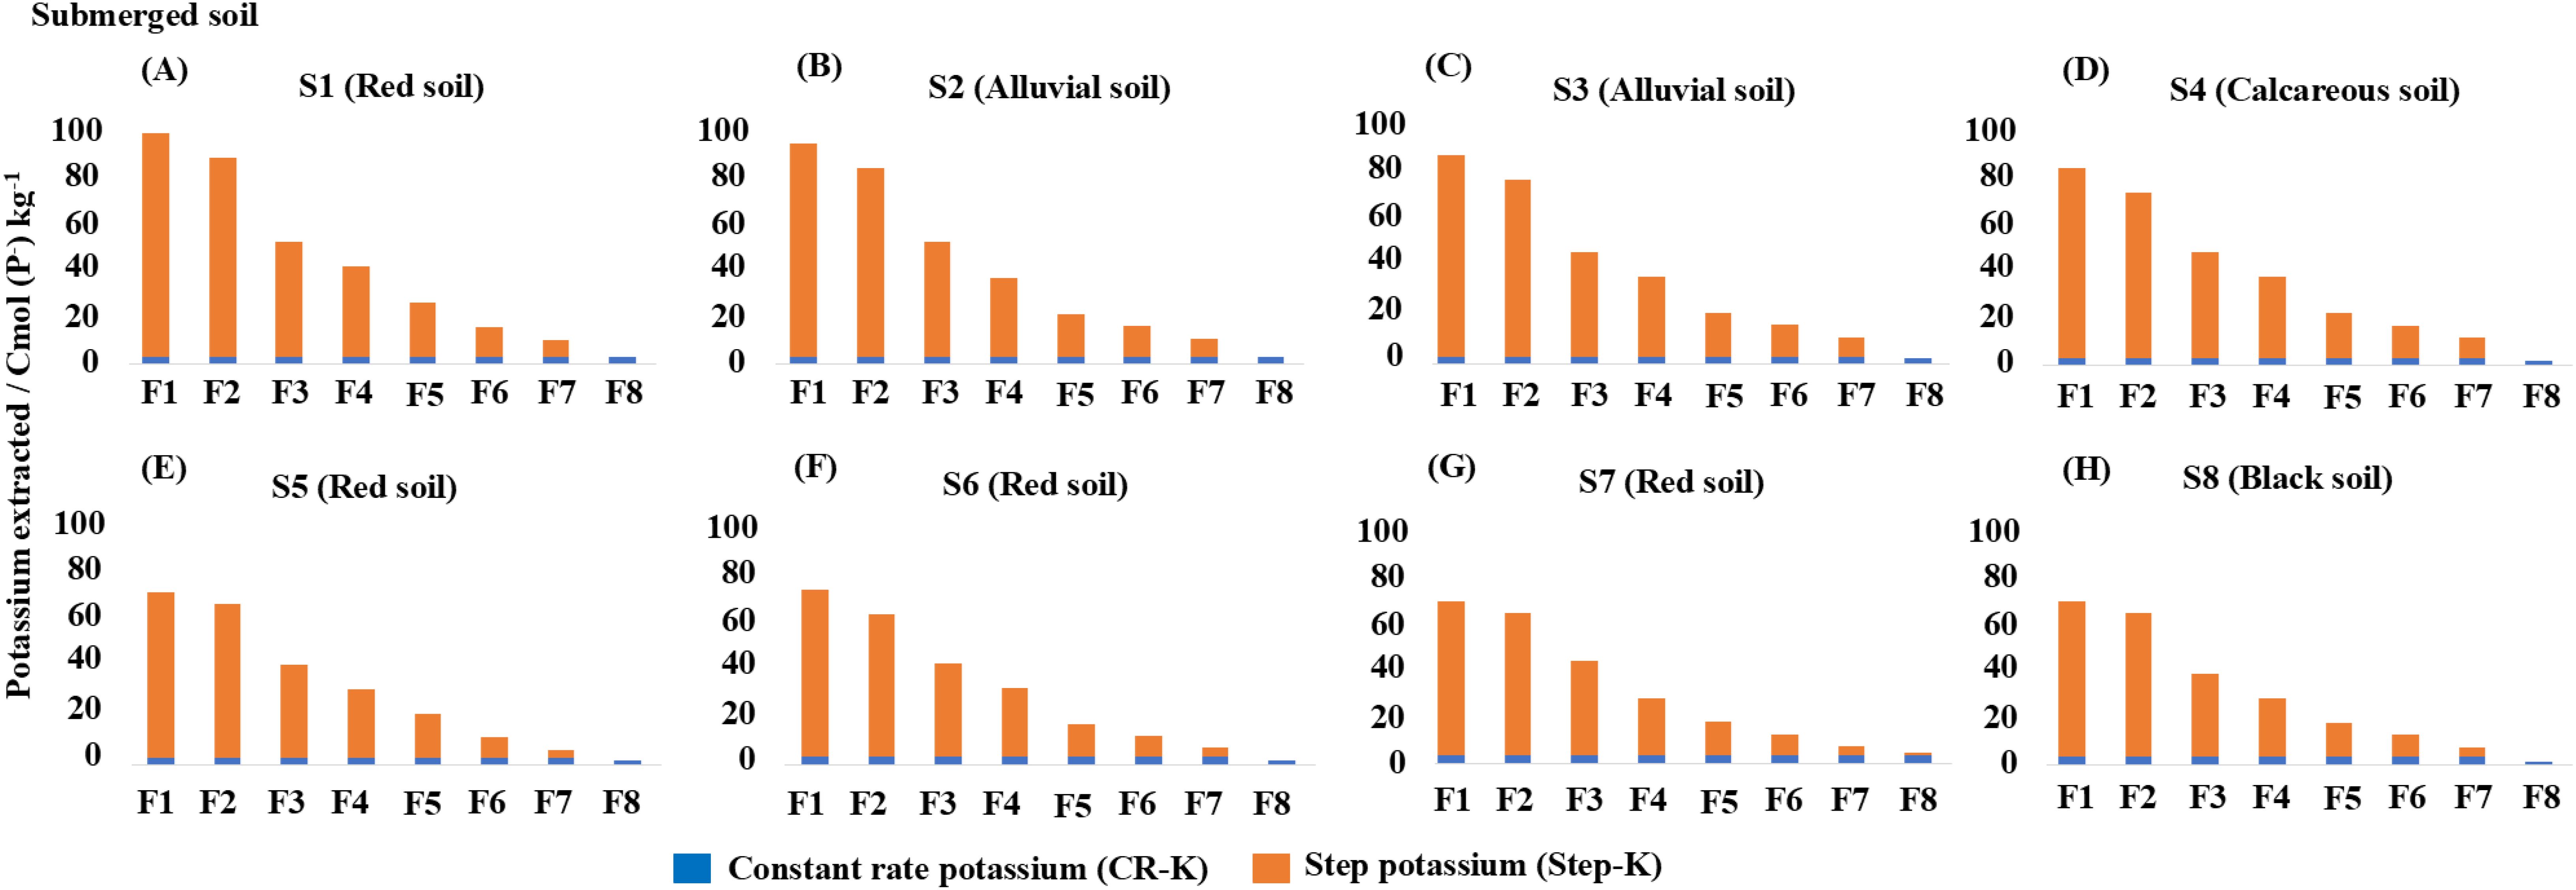
Figure 3. Stag bar graphs of submerged soil represent the continuous extraction (F1, F2, F3, F4, F5, F6, F7, and F8 at 10-minute intervals) of potassium from the four soil types (red, alluvial, calcareous, and black) across eight soil samples using boiling 1 M HNO3, following the removal of exchangeable potassium. (A) S1 (Red soil), (B) S2 (Alluvial soil), (C) S3 (Alluvial soil), (D) S4 (Calcareous soil), (E) S5 (Red soil), (F) S6 (Red soil), (G) S7 (Red soil), (H) S8 (Black soil).
3.4 K content in rice plant pars
Potassium (K) content in various rice plant parts, including roots, shoots, and grains, was analyzed across different soil types such as red, alluvial, calcareous, and black soils. Among these, S1 (red soil) showed the highest K content in all rice plant parts compared to plants grown in other soil samples (Figure 1F). The K content was highest in rice grain followed by rice shoot and root across plants collected from all soil type regions. A strong positive correlation was observed between the different forms of soil K extracted under natural and submerged conditions and the K content in rice roots, shoots, and grains grown in all soil types (Supplementary Figures 2A, B).
3.5 Sensitivity analysis (Sobol)
Sobol sensitivity analysis was performed to identify key input factors, including K forms (WK and EK), under different extraction methods (natural and submerged), and their availability for uptake by various rice plant parts (root, shoot, and grain) (29, 30). According to the results from the Sobol prediction model (Figures 4A–C), the plant-available K forms (Ws-K and Ex-K) under both natural and submerged soil conditions influenced K uptake in different rice plant parts (root, shoot, and grain). Among these, Ws-K and Ex-K from natural soil conditions were the most favorable for K uptake by rice plants compared to the submerged condition plant available K forms. In terms of K uptake by plant root, the Ws-K form from natural soil conditions was the most significant contributor compared to other available forms. The order of significance was as follows: Ws-K (natural) > Ws-K (submerged) > Ex-K (natural) > Ex-K (submerged) (Figure 4A). For K content in the rice shoot, Ws-K and Ex-K from natural soil conditions were better contributors compared to submerged soil. Similarly, for K content in rice grain, Ex-K from natural soil conditions yielded the best results compared to other available forms, including Ws-K (natural), Ws-K (submerged), and Ex-K (submerged) soils.
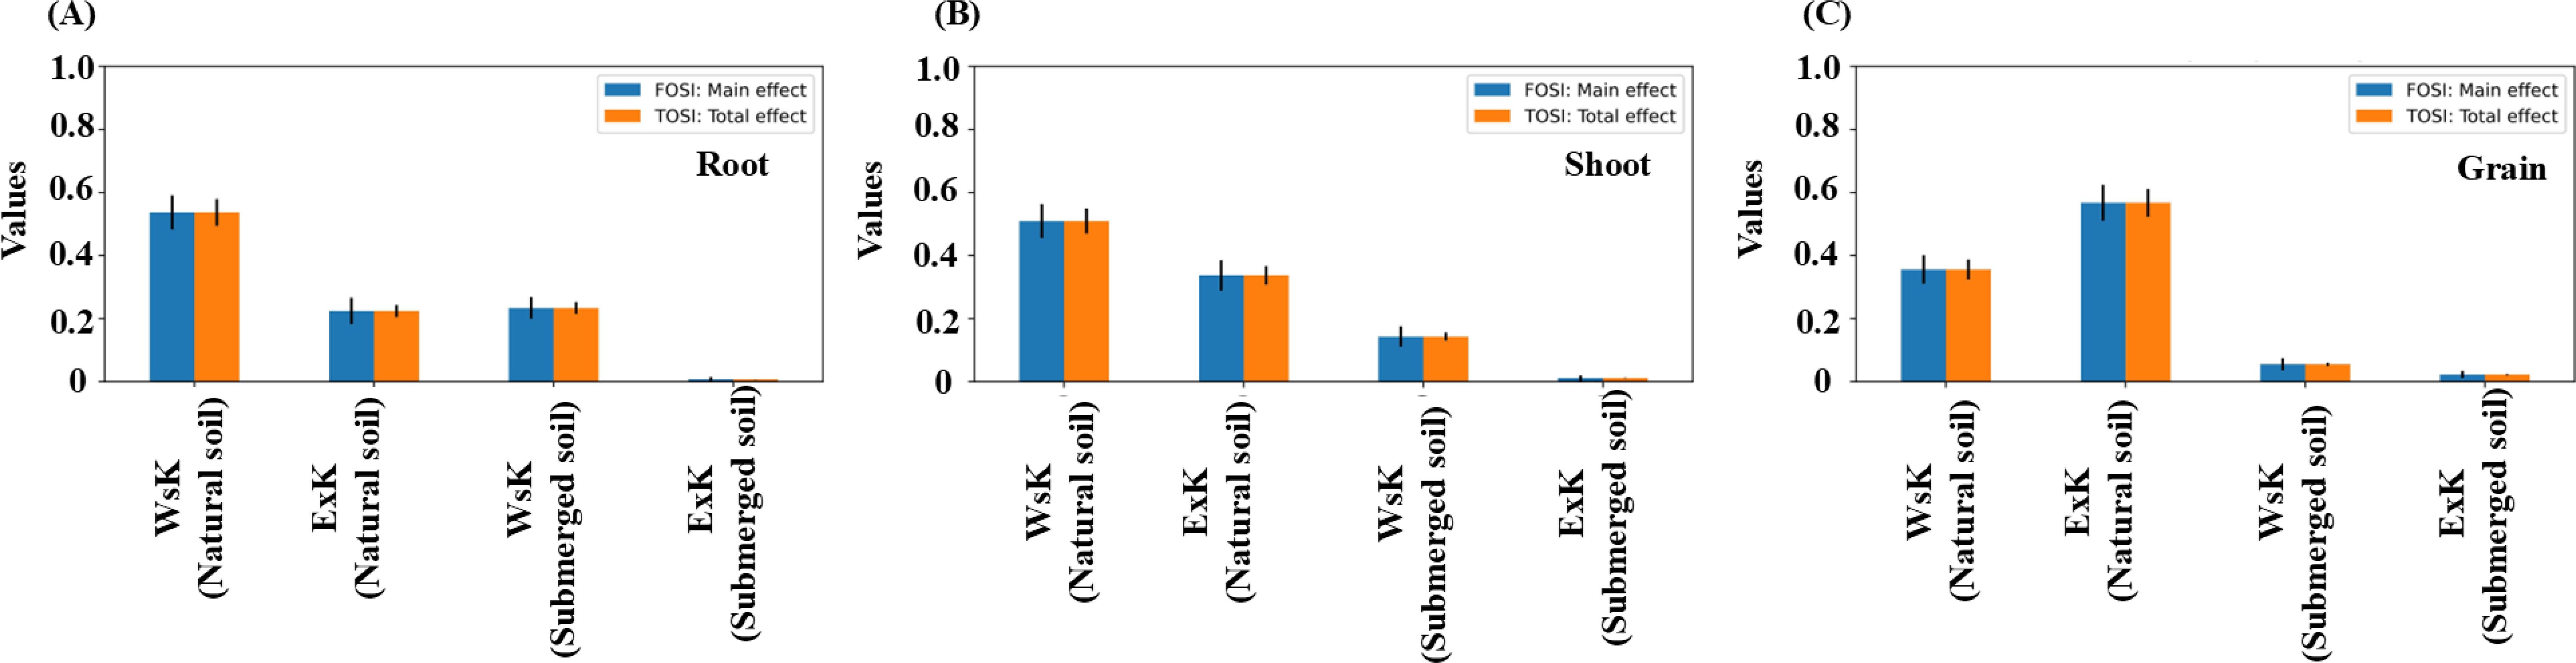
Figure 4. Sensitivity analysis using SOBOL based on the available potassium (Ws-K and Ex-K) influencing the uptake of potassium in rice plant parts (root, shoot, and grain). All the parameters have the unit of mg kg-1. (A) Root, (B) Shoot, (C) Grain.
3.6 Model-based prediction for effective K forms for plant uptake
Machine learning (ML) techniques are used to predict effective plant-available K forms in natural and submerged soils for enhancing plant growth and yield (31). This study employed seven ML models—RF, RTree, LR, XGBoost, MARS, SVM, and KNN—to forecast potassium availability for rice plants and its accumulation within the soil-rice root, shoot, and grain. The most suitable models were identified through solubility tests and evaluated using Taylor diagrams (Figure 5) and Supplementary Table 2. The results demonstrated precise predictions that aligned well with the training and testing data. Multiple regression models effectively predicted K availability and uptake, assessed using the correlation coefficient (r) and root mean square error (RMSE), with lower RMSE values indicating higher accuracy. The Taylor diagram confirmed Random Forest (RF) model to be the most reliable predictor (based on RMSE values). The RF model provided the best predictions for K availability and accumulation in both natural and submerged soils for rice plant K uptake.
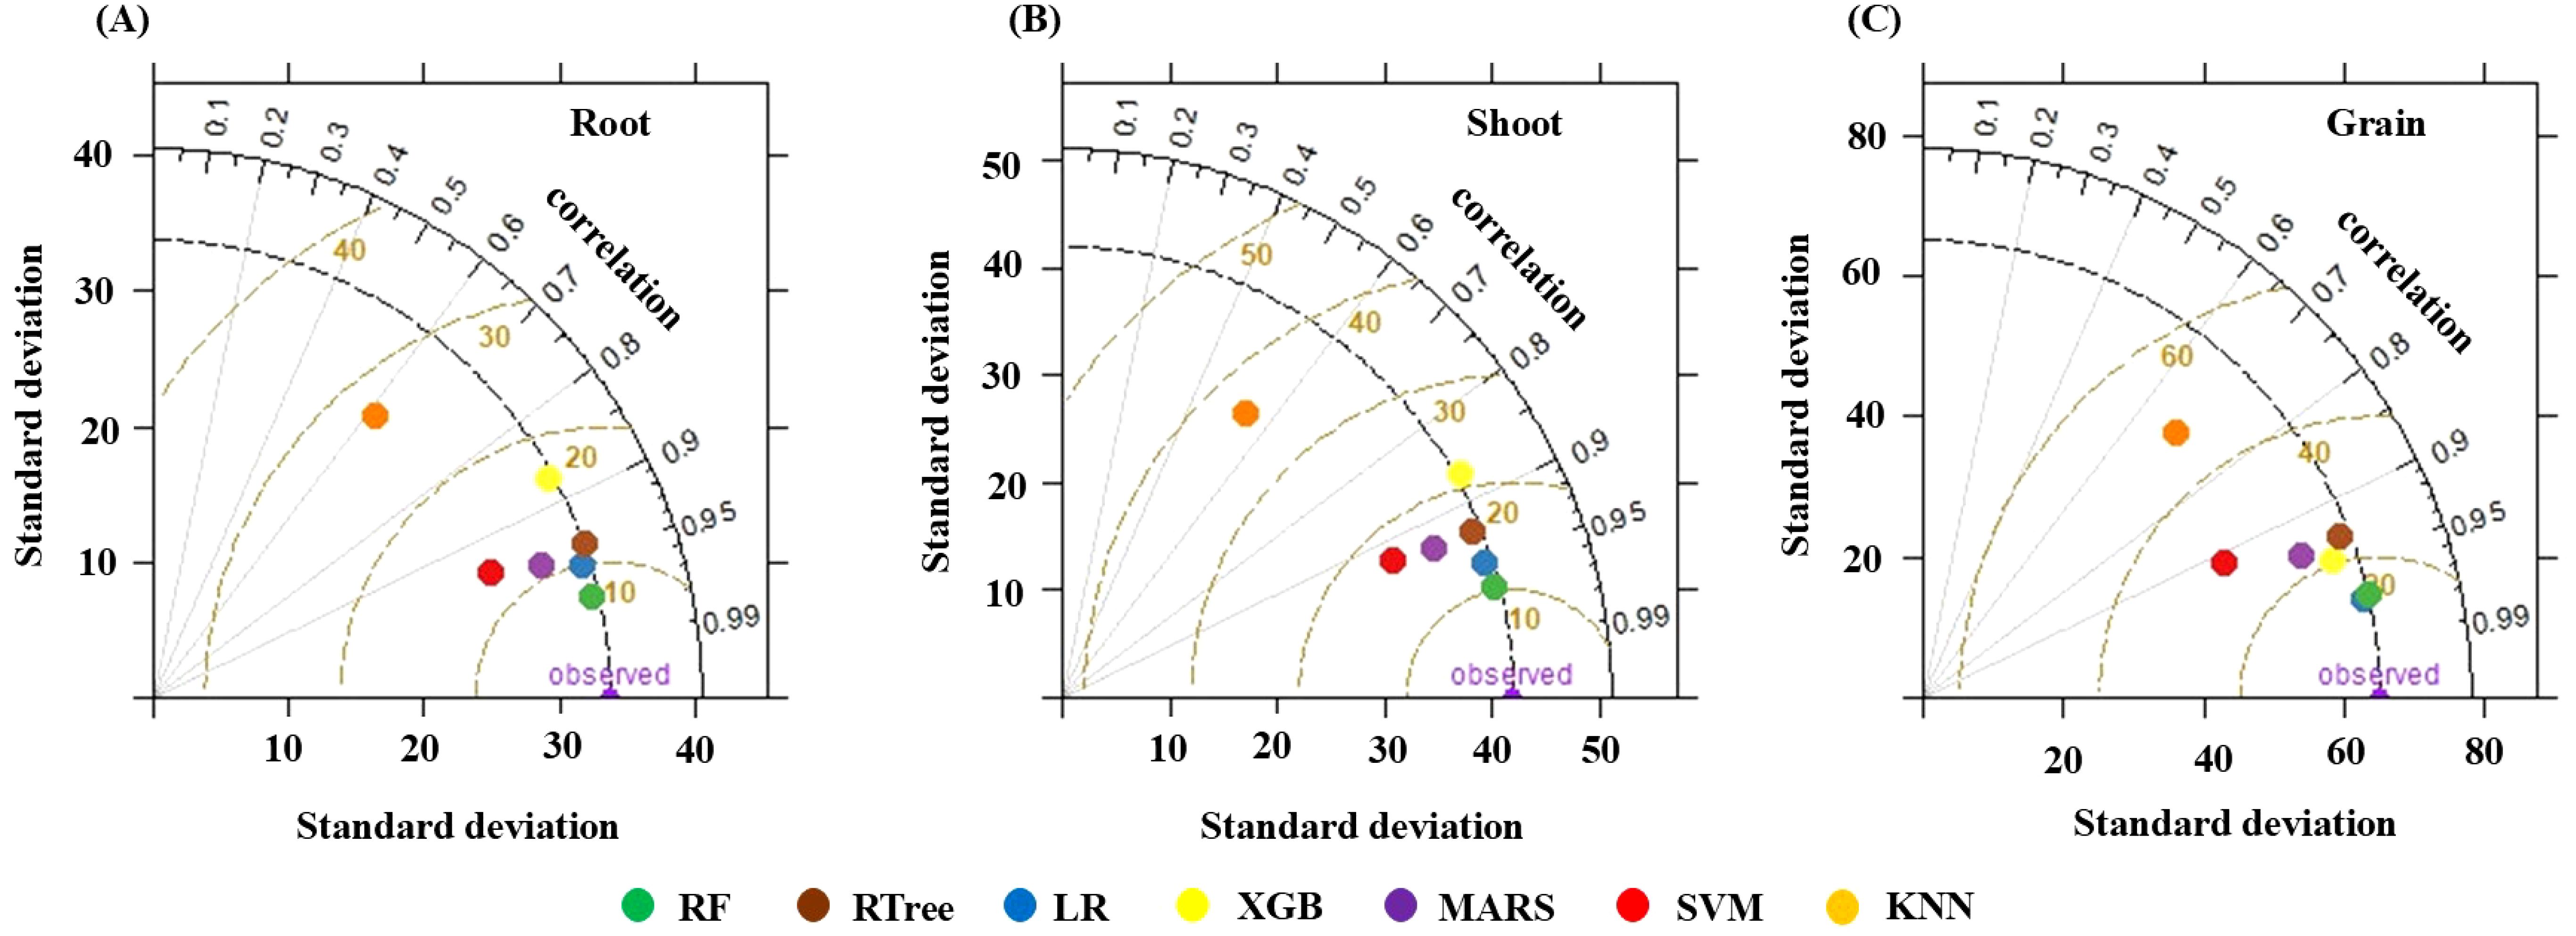
Figure 5. Taylor diagram showing the accuracy of the different models based on RMSE, r, and SD. (A) Root, (B) Shoot, (C) Grain.
3.7 Importance of the fractions of Ws and Ex potassium forms
The variable importance plot from the Random Forest models illustrates the influence of each plant-available form of K in both submerged and natural soils on K uptake in rice grain, as shown in Figure 6. %IncMSE indicates the reduction in model accuracy when a specific variable is excluded. IncNode purity measures the purity of the nodes at the end of the decision tree without including that variable. Variables that are more significant results in an increase in terms of node purity, as they enable splits with higher inter-node variance and lower intra-node variance. For rice plant roots, shoots, and grains, Ws-K and Ex-K from natural soil were identified as the most significant variables for plant uptake compared to submerged soil conditions. The Variable Importance plot highlights the decline in model performance when each variable is excluded.
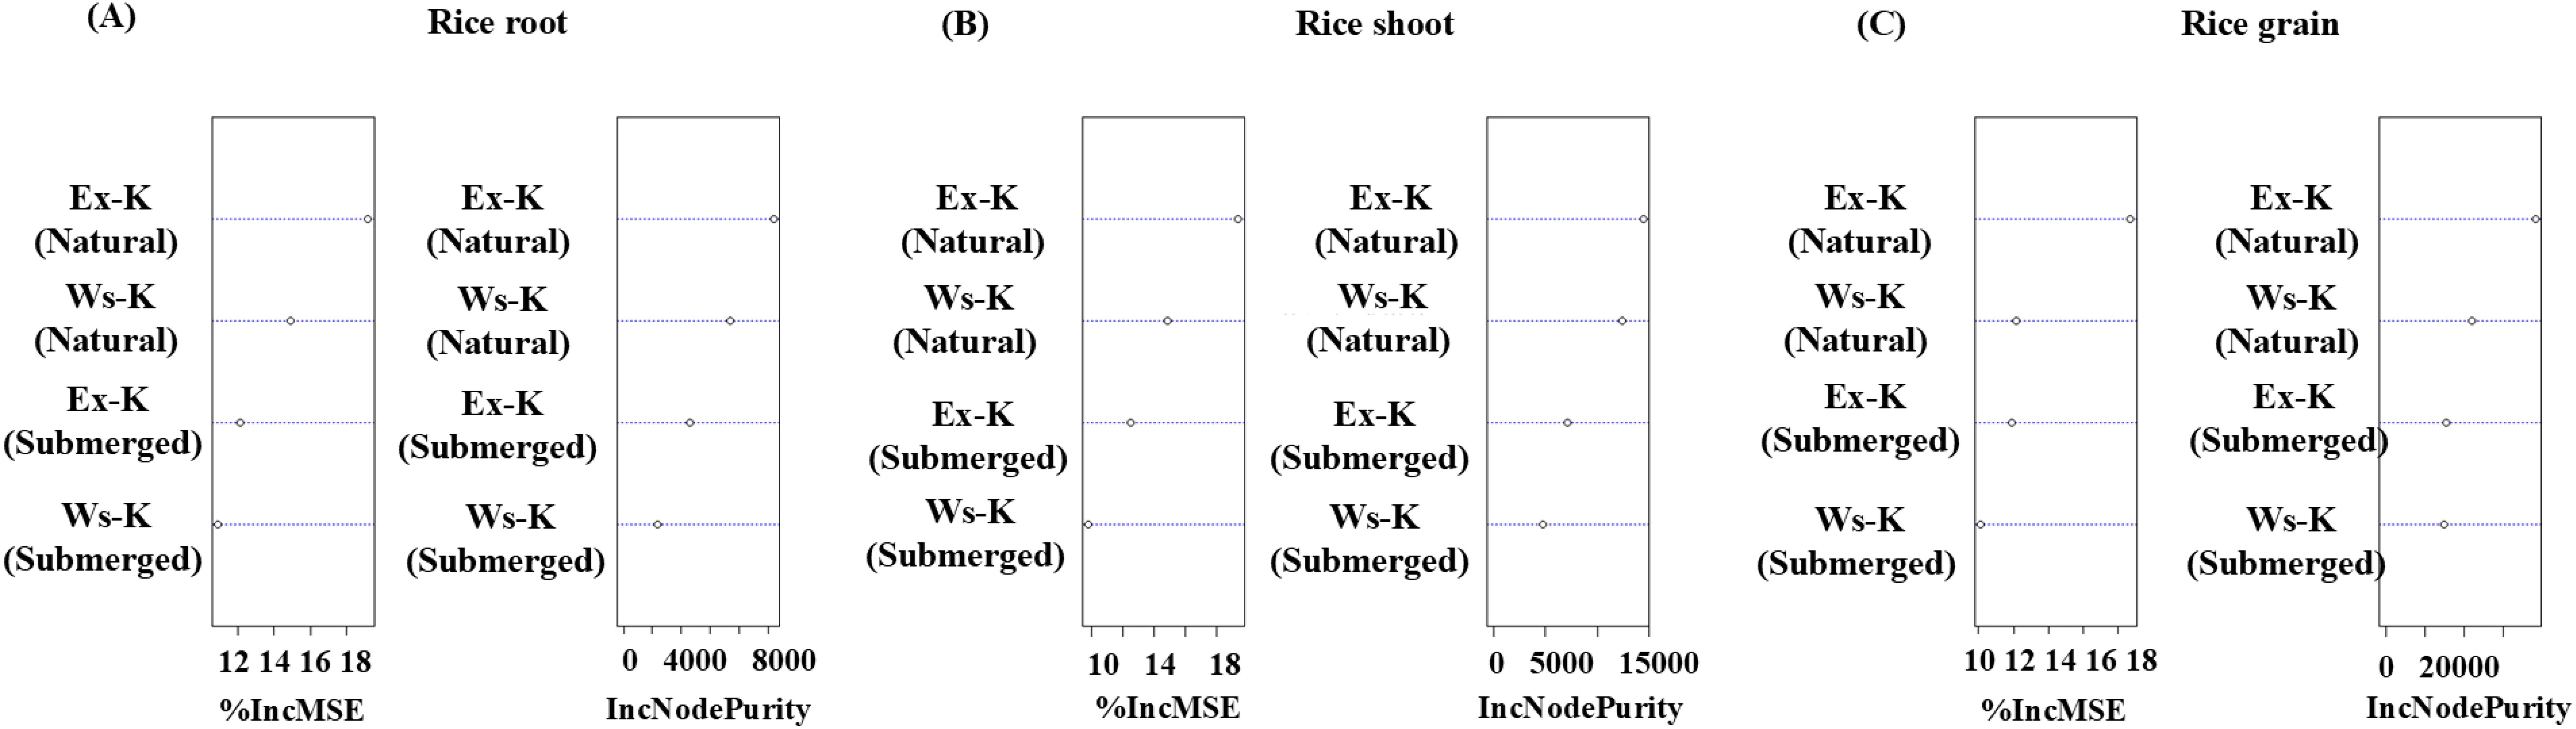
Figure 6. Variable Importance plot from Random Forest representing the importance of water-soluble (Ws-K) and exchangeable potassium (Ex-K) fractions of submerged and natural soil influencing the uptake of potassium in rice plant parts such as root, shoot, and grain (%IncMSE: Mean Decrease Accuracy, IncNodePurity: Mean Decrease Gini). All the parameters have the unit of mg kg-1. (A) Rice root, (B) Rice shoot, (C) Rice grain.
Figure 7 presents a three-dimensional (3D) partial dependence plot illustrating the variation in K content of rice plant roots, shoots, and grains for each plant-available K form (Ws-K and Ex-K). The plot incorporates the two most influential variables identified from the variable importance plots of Random Forest models. It is evident that Ex-K and Ws-K from natural soil significantly contribute to K content in plant roots, shoots, and grains. Conversely, Ex-K and Ws-K from submerged soil conditions show a relatively lower contribution to K uptake by these plant parts. A partial dependence plot (PDP) illustrates the marginal effect of one or two features on the predicted outcome of a machine-learning model (18). It helps determine if the relationship between a feature and the target is linear, monotonic, or complex. PDPs show the connection between a subset of variables (typically 1-3) and the response while averaging the effects of other predictors, revealing how specific variables influence the expected outcome.
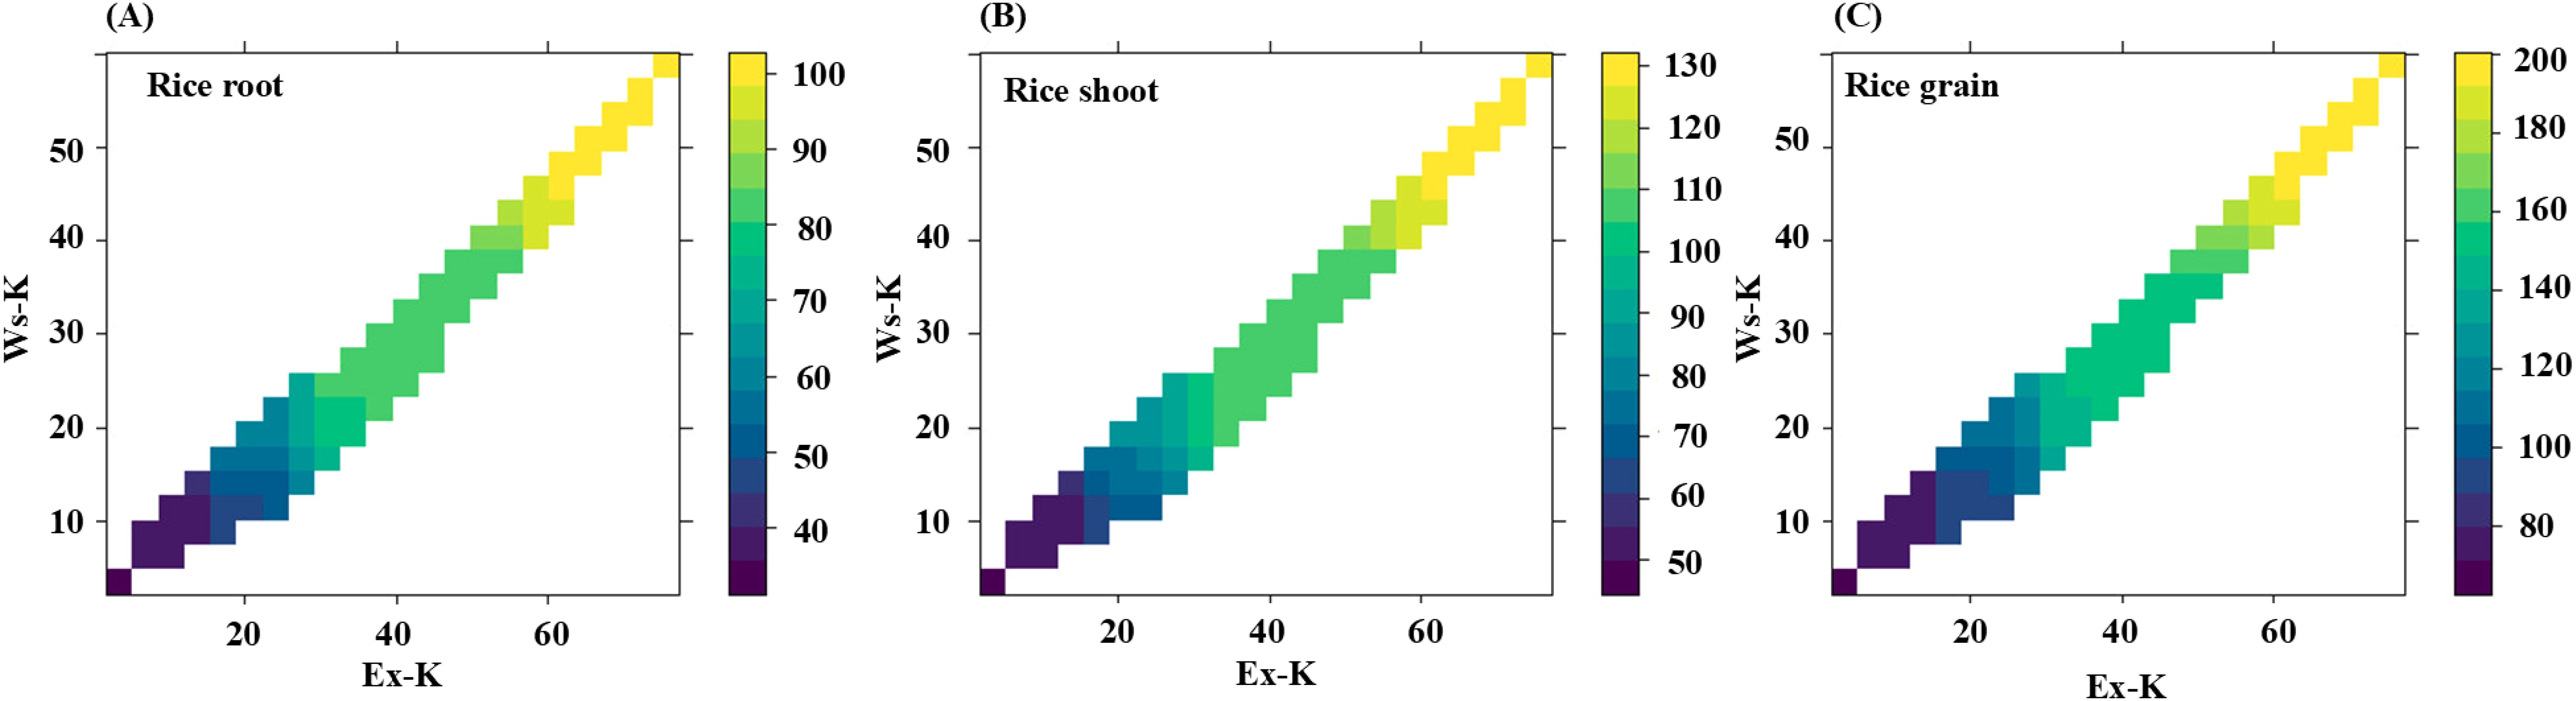
Figure 7. Partial dependence plot from random forest model showing the marginal effect of two most important fractions of soil water-soluble (Ws-K) and exchangeable potassium (Ex-K) affecting the content of the potassium in rice plant parts such as root, shoot, and grain (represented by values and color intensity at the right side of each plot). All the parameters have the unit of mg kg-1. (A) Rice root, (B)Rice shoot, (C) Rice grain.
4 Discussions
The study highlights the diverse physical and chemical properties of the analyzed soils, categorized into red, alluvial, calcareous, and black soil groups. The lowest pH values were recorded in S1 (red soil) and S5 (alluvial soil), collected from Giridih, Jharkhand, and Darjeeling, West Bengal, India, respectively. The acidic nature of Giridih soil is attributed to the presence of mineral-rich mica mines (17), while Darjeeling soil acidity is primarily due to high rainfall in the Eastern Himalayan region, which leaches basic cations like calcium, magnesium, potassium, and sodium, leading to an increase in hydrogen (H+) and aluminum (Al³+) ion concentrations (32). Electrical conductivity (EC), indicative of soil salinity, ranged from 0.13 dS/m in S5 (alluvial) to 0.73 dS/m in S8 (black soil). While these values suggest generally non-saline conditions, the relatively higher EC in black soil points to a greater concentration of soluble salts, which could influence water uptake and nutrient mobility (33). CEC and clay content were highest in S8 (black soil), with CEC reflecting the soil’s capacity to retain essential cations like potassium. This high CEC, combined with the significant clay content (41.2%), suggests a strong capacity for nutrient retention and water holding, enhancing fertility (17). In contrast, sandy soils or those with lower clay content typically show reduced nutrient retention, necessitating more frequent nutrient supplementation (34). Organic carbon (OC) content, a vital indicator of soil organic matter and microbial activity, was comparatively higher in alluvial (S5, 1.74%) and black (S8, 1.12%) soils. Higher OC content promotes soil structural stability, water retention, and nutrient cycling, which are essential for sustainable agricultural productivity (35).
Analyzing soil K forms revealed notable variations across soil samples under natural (non-submerged) and submerged conditions. Among all the collected soil samples, S1, representing red soil, exhibited the highest potassium content across all forms of soil potassium under both submerged and natural conditions. This outcome can be attributed to the proximity of S1’s collection site to agricultural soils near mica mines. Mica is a significant source of various K forms, and Giridih, where this soil was sourced, is recognized as one of the largest mica producers globally (17). The submerged condition consistently enhanced the availability of all K forms across the soil samples compared to the natural condition. This improvement under submerged conditions may be attributed to changes in redox potential and soil microbial activity, which facilitate the release of potassium from less available pools (36). It was previously reported by Ghosh et al. (2023b) that rhizospheric microorganisms have the potential to convert non-exchangeable K into available forms by producing organic acids which could also be a potent role player (37). A strong negative correlation was observed between K forms and soil physicochemical properties (e.g., pH, EC, and clay content) under both natural and submerged conditions. This suggests that soil properties significantly influence K dynamics, potentially affecting its bioavailability for plant uptake. These findings emphasize the importance of soil type and management practices in optimizing potassium availability, especially in agricultural contexts involving submerged cultivation systems like rice.
S1 (red soil) outperformed all other samples in submerged conditions, suggesting that this soil is more favorable for potassium availability under submerged cultivation. A comparable trend was reported by Ghosh et al. (2023a) in their studies (17). Interestingly, when comparing the two methods, natural soil demonstrated a more sequential release of potassium than submerged soil, which could be attributed to differences in soil redox conditions and microbial properties and activities between the two environments (38). This sequential release pattern in natural soils may be linked to the slower mobilization of K from less available pools, whereas submerged conditions likely facilitate a more rapid release due to changes in soil chemistry and microbial processes. The CR-K, indicative of interlayer K with limited solubility, serves as a practical measure of the soil’s long-term K supply potential (23). This parameter showed minimal variation across the studied soils (17). When compared to the critical threshold of 0.2 cmol(p+)/kg proposed by (39), the experimental soils demonstrate an ample capacity to supply K for plant growth. These findings highlight the importance of both soil type and environmental conditions in determining the bioavailability of potassium, which is crucial for efficient nutrient management in agricultural practices (40).
Potassium (K) concentration in rice roots, shoots, and grains was highest in S1 (red soil) among all soil types, highlighting its superior bioavailable K levels and suitability for rice cultivation. In terms of K distribution within the rice plant, the grain had the highest K concentration, followed by the shoot, and then the root. The ranking of K content across the rice plant parts was consistent: rice grain > rice shoot > rice root, irrespective of the soil type. This pattern is in line with the plant’s physiological needs, as K plays a key role in grain formation and overall plant health (41). A strong positive correlation was observed between the different forms of soil K (natural and submerged conditions soil) and the K concentration in rice roots, shoots, and grains. This correlation suggests that the availability of soil K directly influences its uptake by rice plants, with higher potassium concentrations in the soil leading to higher potassium concentration in the plant tissues. These findings underscore the importance of understanding soil K dynamics and their impact on rice plant growth, which is essential for optimizing fertilization strategies and improving crop yield (42).
Sobol sensitivity analysis was conducted to identify the key input factors influencing K uptake by various rice plant parts (root, shoot, and grain) under different extraction methods (natural and submerged). Among these, Ws-K and Ex-K from natural soil conditions were found to be the most favorable forms for K uptake, as compared to the submerged condition. This indicates that natural soil conditions provide more readily available K for plant absorption, which is crucial for optimal growth. Potassium uptake by rice roots was highest from Ws-K in natural soil. Similarly, Ws-K and Ex-K from natural soil were superior for shoot K, while Ex-K from natural soil contributed most to grain potassium. These findings emphasize the critical role of soil K forms in rice nutrition and optimizing fertilization for better yield and quality (43).
Machine learning (ML) techniques, including seven models like Random Forest (RF), XGBoost, SVM, RTree, LR, and KNN were used to predict soil K availability and its accumulation in the soil-rice system. Evaluated via solubility tests and Taylor diagrams, RF emerged as the most accurate model, with strong correlation coefficients and low RMSE values, demonstrating its reliability for forecasting K dynamics and optimizing crop yields. The RF model accurately predicted K availability and accumulation in both natural and submerged soils, proving valuable for soil fertility management and crop nutrition. Its effectiveness in different soil conditions highlights the potential of machine learning in optimizing K uptake and advancing precision agriculture (44).
The Variable Importance plot from the Random Forest (RF) models highlights the critical role of Ws-K and Ex-K from natural soils in potassium uptake by rice plants, particularly in grains, roots, and shoots. Metrics such as %IncMSE and IncNode purity confirm that these K forms significantly enhance model accuracy and decision tree purity, emphasizing their importance over submerged soil conditions. The three-dimensional partial dependence plot further illustrates how Ws-K and Ex-K from natural soils significantly influence K content across rice plant parts, outperforming submerged soil conditions. PDPs offer valuable insights into the relationships between K forms and plant uptake, demonstrating the superiority of natural soils for optimizing potassium availability and rice yield.
5 Conclusion
The study provides valuable insights into the influence of different soil types and conditions (natural and submerged) on K availability and its uptake by rice plants. The soil samples, classified as red, alluvial, calcareous, and black soils, displayed varying physical and chemical properties, which significantly impacted potassium dynamics. Red soil (S1) demonstrated the highest potassium content, particularly under submerged conditions, highlighting its suitability for rice cultivation. The study also revealed that water-soluble potassium (WsK) and exchangeable potassium (ExK) from natural soils were the most favorable for potassium uptake by rice plants, with the grain containing the highest K concentration. The sequential extraction methods used in this study, along with machine learning models, provided a comprehensive understanding of K availability and its mobilization under different soil conditions. The Random Forest model proved to be most reliable for predicting K dynamics, offering a promising tool for precision agriculture and nutrient management. Sobol sensitivity analysis further reinforced the critical role of WsK and ExK in enhancing K uptake, emphasizing their importance in improving rice growth and yield. Overall, the findings underline the significance of soil management practices, including optimizing K availability through appropriate fertilization strategies and understanding the underlying soil properties, to enhance rice productivity. The use of advanced techniques such as machine learning and sensitivity analysis presents an innovative approach to soil fertility management, paving the way for more efficient and sustainable agricultural practices.
Data availability statement
The original contributions presented in the study are included in the article/Supplementary Material. Further inquiries can be directed to the corresponding author.
Author contributions
SG: Investigation, Software, Writing – original draft. GM: Methodology, Software, Writing – original draft. SC: Validation, Writing – review & editing. SB: Software, Validation, Writing – review & editing. SK: Methodology, Writing – review & editing. RB: Methodology, Writing – review & editing. PB: Conceptualization, Supervision, Writing – review & editing.
Funding
The author(s) declare that no financial support was received for the research, authorship, and/or publication of this article.
Conflict of interest
The authors declare that the research was conducted in the absence of any commercial or financial relationships that could be construed as a potential conflict of interest.
Generative AI statement
The author(s) declare that no Generative AI was used in the creation of this manuscript.
Publisher’s note
All claims expressed in this article are solely those of the authors and do not necessarily represent those of their affiliated organizations, or those of the publisher, the editors and the reviewers. Any product that may be evaluated in this article, or claim that may be made by its manufacturer, is not guaranteed or endorsed by the publisher.
Supplementary material
The Supplementary Material for this article can be found online at: https://www.frontiersin.org/articles/10.3389/fsoil.2025.1539477/full#supplementary-material
References
1. Rawat J, Sanwal P, Saxena J. Potassium and its role in sustainable agriculture. In: Potassium solubilizing microorganisms for sustainable agriculture. Springer India, New Delhi (2016). p. 235–53. doi: 10.1007/978-81-322-2776-2_17
2. Basak BB, Maity A, Ray P, Biswas DR, Roy S. Potassium supply in agriculture through biological potassium fertilizer: a promising and sustainable option for developing countries. Arch Agron Soil Sci. (2022) 68:101–14. doi: 10.1080/03650340.2020.1821191
3. Panda R, Patra SK. Soil potassium release as indices of potassium supplying power of coastal soils of West Bengal. J Hill Agricult. (2017) 8:319–24. doi: 10.5958/2230-7338.2017.00063.5
4. Bell MJ, Ransom MD, Thompson ML, Hinsinger P, Florence AM, Moody PW, et al. Considering soil potassium pools with dissimilar plant availability. Improving potassium recommendations Agric Crops. (2021) 15:163–90. doi: 10.1007/978-3-030-59197-7_7
5. Goulding KWT. Potassium retention and release in Rothamsted and Saxmundham soils. J Sci Food Agric. (1981) 32:667–70. doi: 10.1002/jsfa.2740320706
6. Sparks DL, Huang PM, et al. Physical Chemistry of Soil Potassium. In: Munson RD, editor. Potassium in Agriculture. Agronomy Society of America, Soil Science Society of America, Madison, Wisconsin, USA (1985). p. 201–76.
7. Sarkar GK, Chattopadhyay AP, Sanyal SK. Release pattern of nonexchangeable potassium reserves in Alfisols, Inceptisols and Entisols of West Bengal, India. Geoderma. (2013) 207:8–14. doi: 10.1016/j.geoderma.2013.04.029
8. Singh NK, Banik GC, Mukhopadhyay D, Patra A. Release of non-exchangeable potassium in some acidic Terai soils of himalayan floodplain. J Ind Soc Soil Sci. (2020) 68:307–14. doi: 10.5958/0974-0228.2021.00007.4
9. Chen XY, Zheng XY, Beard BL, Urrutia M, Johnson CM, Barak P. Natural potassium (K) isotope fractionation during corn growth and quantification of K fertilizer recovery efficiency using stable K isotope labeling. ACS Earth Space Chem. (2022) 6:1876–89. doi: 10.1021/acsearthspacechem.2c00105
10. Goulding KWT, Talibudeen O. Potassium reserve in a sandy clay soil from the Saxmundham experiments: kinetic and equilibrium thermodynamics. J Soil Sci. (1979) 30:291–302. doi: 10.1111/j.1365-2389.1979.tb00986.x
11. Singh M, Tripathi AK, Reddy DD. Potassium balance and release kinetics of non-exchangeable K in a Typic Haplustert as influenced by cattle manure application under a soybean-wheat system. Soil Res. (2002) 40:533–41. doi: 10.1071/SR00064
13. Mondal G, Ghosh S, Banerjee S, Bhattacharyya P. Appraisal of potential metal risk in calcareous agricultural soils: an insight into human and environmental health employing multimodal tactics. Water Air Soil Pol. (2024) 235:1–17. doi: 10.1007/s11270-024-07196-0
14. Jan R. Fate of Potassium in Crop Production. India: Society For Community Mobilization For Sustainable Development (2022).
15. Taalab AS, Ageeb GW, Siam HS, Mahmoud SA. Some Characteristics of Calcareous soils. A review. Middle East J. (2019) 8:96–105.
16. Portela E, Monteiro F, Fonseca M, Abreu MM. Effect of soil mineralogy on potassium fixation in soils developed on different parent material. Geoderma. (2019) 343:226–34. doi: 10.1016/j.geoderma.2019.02.040
17. Ghosh S, Banerjee S, Prajapati J, Mandal J, Mukherjee A, Bhattacharyya P. Pollution and health risk assessment of mine tailings contaminated soils in India from toxic elements with statistical approaches. Chemosphere. (2023) 324:138267. doi: 10.1016/j.chemosphere.2023.138267
18. Ghosh S, Mondal S, Mandal J, Mukherjee A, Bhattacharyya P. Effect of metal fractions on rice grain metal uptake and biological parameters in mica mines waste contaminated soils. J Envi Sci. (2022) 136:313–24. doi: 10.1016/j.jes.2022.10.038
19. Suhr N, Widdowson M, Kamber BS. The role of pedogenesis and natural fertiliser as vectors for essential metal content in agricultural topsoils, Central India. SN App Sci. (2021) 3:40. doi: 10.1007/s42452-020-03982-7
20. Xu X, Du X, Wang F, Sha J, Chen Q, Tian G, et al. Effects of potassium levels on plant growth, accumulation and distribution of carbon, and nitrate metabolism in apple dwarf rootstock seedlings. Front Plant Sci. (2020) 11:904. doi: 10.3389/fpls.2020.00904
21. Han GZ, Cao XM, Han BS, Yang F, Huang LM, Wu YJ. Potassium supply and adsorption capacity changes in a Chinese subtropical paddy soil chronosequence. Arch Agro Soil Sci. (2023) 69:290–303. doi: 10.1080/03650340.2021.1985109
22. Sobol IM. Global sensitivity indices for nonlinear mathematical models and their Monte Carlo estimates. Math Comp sim. (2001) 55:271–80. doi: 10.1016/S0378-4754(00)00270-6
23. Mani PK, Mitran T, Mandal B. Redistribution of forms of potassium in soils upon submergence in Alfisols, Inceptisols and Entisols. J Ind Soc Soil Sci. (2016) 64:240–5. doi: 10.5958/0974-0228.2016.00033.5
24. Page AL, Miller RH, Keeney DR. Methods of soil analysis. Am Soc Agro. (1982) 363–364. doi: 10.1002/jpln.19851480319
25. Haylock OF. A method for estimating the availability of non-exchangeable potassium. In: Transactions of the 6th International Congress of Soil Science. Parisl: International Society of Soil Science Paris (1956). p. 403–8.
26. Walkley A, Black IA. An examination of the Degtjareff method for determining soil organic matter, and a proposed modification of the chromic acid titration method. Soil Sci. (1934) 37:29–38. doi: 10.1097/00010694-193401000-00003
27. Brady NC. The Nature and Properties of Soils. Tenth edition. New York: Macmillan Publishing Co. (1990).
28. Li T, Song Y, Yuan X, Li J, Ji J, Fu X, et al. Incorporating bioaccessibility into humanhealth risk assessment of heavy metals in rice (Oryzasativa L.): A probabilistic-based analysis. J Agri Food Chem. (2018) 66:5683–90. doi: 10.1021/acs.jafc.8b01525
29. Nossent J, Elsen P, Bauwens W. Sobol’s sensitivity analysis of a complex environmental model. Env Modell Soft. (2011) 26:1515–25. doi: 10.1016/j.envsoft.2011.08.010
30. Chakraborty S, Ghosh S, Banerjee S, Kumar S, Bhattacharyya P. Elucidating the synergistic effect of acidity and metalloid poisoning on the microbiome through metagenomics and machine learning approaches. Env Res. (2024) 243:117885. doi: 10.1016/j.envres.2023.117885
31. Salehnia N, Hosseini F, Farid A, Kolsoumi S, Zarrin A, Hasheminia M. Comparing the performance of dynamical and statistical downscaling on historical run precipitation data over a semi-arid region. Asia-Pacific J Atm Sci. (2019) 55:737–49. doi: 10.1007/s13143-019-00112-1
32. Kijowska-Strugała M, Baran A, Szara-Bąk M, Wiejaczka Ł, Prokop P. Soil quality under different agricultural land uses as evaluated by chemical, geochemical and ecological indicators in mountains with high rainfall (Darjeeling Himalayas, India). J Soils Sedi. (2022) 22:3041–58. doi: 10.1007/s11368-022-03274-0
33. Rhoades JD. Determining soil salinity from measurements of electrical conductivity. Commun Soil Sci Plant Anal. (1990) 21:1887–926. doi: 10.1080/00103629009368347
34. Räty M, Keskinen R, Yli-Halla M, Hyvönen J, Soinne H. Estimating cation exchange capacity and clay content from agricultural soil testing data. Agri Food Sci. (2021) 30:131–45. doi: 10.23986/afsci.111107
35. Bagwan WA, Gavali RS, Maity A. Quantifying soil organic carbon (SOC) density and stock in the Urmodi River watershed of Maharashtra, India: implications for sustainable land management. J Umm Al-Qura Uni App Sci. (2023) 9:548–64. doi: 10.1007/s43994-023-00064-3
36. Mazahar S, Umar S. Soil potassium availability and role of microorganisms in influencing potassium availability to plants. Role potassium abiotic Stress. (2022) 4:77–87. doi: 10.1007/978-981-16-4461-0_4
37. Ghosh S, Mondal S, Banerjee S, Mukherjee A, Bhattacharyya P. Temporal dynamics of potassium release from waste mica as influenced by potassium mobilizing bacteria. J Pure Appl Microbiol. (2023) 17:273–288. doi: 10.22207/JPAM.17.1.17
38. Paul S, Das D, Barman M, Verma BC, Sinha AK, Datta A. Selection of a suitable extractant for sequential leaching of soil to evaluate medium-term potassium availability to plants. J Soil Sci Plant Nutri. (2024) 24:1489–506. doi: 10.1007/s42729-024-01654-8
39. Nayak R, Rout K, Mandal M, Dash A. Different soil potassium fractions and their contribution towards its uptake under long-term rice-rice cropping system in an inceptisol of subtropical eastern India. Oryza (2021) 58:262–71. doi: 10.35709/ory.2021.58.2.2
40. Marschner P. Processes in submerged soils–linking redox potential, soil organic matter turnover and plants to nutrient cycling. Plant Soil. (2021) 464:1–12. doi: 10.1007/s11104-021-05040-6
41. Hasanuzzaman M, Bhuyan MB, Nahar K, Hossain MS, Mahmud JA, Hossen MS, et al. Potassium: a vital regulator of plant responses and tolerance to abiotic stresses. Agronomy. (2018) 8:31. doi: 10.3390/agronomy8030031
42. Chen G, Duan Q, Wu C, He X, Hu M, Li C, et al. Optimizing rice yield, quality and nutrient use efficiency through combined application of nitrogen and potassium. Front Plant Sci. (2024) 15:1335744. doi: 10.3389/fpls.2024.1335744
43. Colombi A, Bancheri M, Acutis M, Basile A, Botta M, Perego A. A sound understanding of a cropping system model with the global sensitivity analysis. Environ Model Soft. (2024) 173:105932. doi: 10.1016/j.envsoft.2023.105932
Keywords: potassium dynamics, potassium uptake, rice cultivation, submerged conditions, machine learning predictions
Citation: Ghosh S, Mondal G, Chakraborty S, Banerjee S, Kumar S, Basu R and Bhattacharyya P (2025) Geogenic perspectives on potassium dynamics and plant uptake: insights from natural and submerged conditions across different soil types with machine learning predictions. Front. Soil Sci. 5:1539477. doi: 10.3389/fsoil.2025.1539477
Received: 04 December 2024; Accepted: 02 January 2025;
Published: 24 January 2025.
Edited by:
Prafulla Kumar Sahoo, Central University of Punjab, IndiaReviewed by:
Budiastuti Kurniasih, Gadjah Mada University, IndonesiaSudipta Tripathi, Ramakrishna Mission Vivekananda Educational and Research Institute, India
Raktim Pal, Tea Research Association, India
Copyright © 2025 Ghosh, Mondal, Chakraborty, Banerjee, Kumar, Basu and Bhattacharyya. This is an open-access article distributed under the terms of the Creative Commons Attribution License (CC BY). The use, distribution or reproduction in other forums is permitted, provided the original author(s) and the copyright owner(s) are credited and that the original publication in this journal is cited, in accordance with accepted academic practice. No use, distribution or reproduction is permitted which does not comply with these terms.
*Correspondence: Pradip Bhattacharyya, cHJhZGlwLmJoYXR0YWNoYXJ5eWFAZ21haWwuY29t
†These authors have contributed equally to this work