
94% of researchers rate our articles as excellent or good
Learn more about the work of our research integrity team to safeguard the quality of each article we publish.
Find out more
ORIGINAL RESEARCH article
Front. Soil Sci., 19 March 2025
Sec. Soil Management
Volume 5 - 2025 | https://doi.org/10.3389/fsoil.2025.1530962
 Peter N. Eze1,2*
 Ferdinand J. Dina Ebouel1
 Itumeleng Nkonga1Antje Musiol3
 Anja M. Schleicher4Christina Günter3
 Stefan Norra2
Chemical weathering, a major geomorphic process, controls soil formation and evolution at the Earth’s surface and is strongly influenced by prevailing environmental conditions. In this study, three weathering soil profiles on a prominent agricultural landscape in a semiarid environment, central Botswana, were investigated to ascertain how parent material and pedogenic processes influence soil geochemistry, especially trace element accumulation. The soils were characterized on the basis of their macromorphological, physicochemical, mineralogical, and geochemical properties via routine laboratory procedures. A suite of 11 weathering indices was used to quantify chemical weathering, whereas multivariate analysis was used to interpret the geochemical dataset and detect affinity groups of samples and pedogenic properties. The soils are generally deep (>100 cm) and predominantly fine-grained, given that 78% of the samples had sandy clay loam to clay textures. The soils are alkaline, with pH values ranging from 7.4-8.4. Silicon, Al, Fe, and Ca are the four most abundant elements in the soils, and their variation within and between the pedons reflects their mineralogical compositions: quartz, montmorillonite, quartz, calcite, and palygorskite. The applied weathering indices (CIA, CIW, PWI, PIA, ICV, RR, VR, and Rb/Sr ratios) indicate the soils are moderate to highly weathered. Most of the indices had strong correlations and should not be applied synchronously in soils developed from basaltic parent materials. Particle size distribution significantly affected the weathering indices. The average αAlMg, αAlCa, αAlNa, αAlSr, αAlK, αAlBa, and αAlRb values in the three pedons are 0.52, 0.66, 2.77, 1.91, 3.72, 1.21, and 3.80, respectively. Factor analysis of the geochemical affinity confirmed that clays and Fe–Mn oxide illuviation coupled with calcite nodule formation were the dominant pedogenic processes. Overall, the applied indices affirm that the soils developed on a uniform parent material, with low-K basalt and high concentrations of chromium. The distinct soil properties of Vertisols from Serowe confirm that the soils are polygenetic given the increasing dryness of the area.
The semiarid environments are home to an estimated 855 million people and cover approximately 22.6 million km2 of the world’s land surface (1), but most of their soils have inherently low fertility. Given that soils consist of horizons of mineral and organic materials that differ in their morphological, physical, chemical, and mineralogical signatures from the parent materials, their biogeochemical behaviour has long been linked to the nature and degree of weathering (2–4), especially in soil profiles. At local and regional scales, chemical weathering results in the release of trace elements and dissolved base cations for plant nutrition and the neutralization of acid rain in catchments. Also, environmental pollution by potentially toxic elements can be remediated through preferential adsorption or fixation by certain clay minerals or Fe oxide minerals, which are themselves products of chemical weathering.
The quantification of chemical weathering and pedogenic processes is important in dryland ecosystems because it provides the basis for the sustainable use and management of soil resources. The trace elements released into the soil environment during chemical weathering serve as plant micronutrients, and they function extensively for the physiological growth and development of plants. Owing to limited precipitation, chemical weathering in semiarid environments is generally not as intense as that in other climatic zones, but it still controls the distribution and mobility of elements on Earth’s surface (5). Soils are often associated with variations in parent material and particle size distribution (6), and this poses remarkable constraints in assessing the intensity of chemical weathering.
Direct measurement of chemical weathering is difficult; as a result, numerous indirect methods based on geochemical indices have been proposed in the last thirty years. These indices are generally based on mobile/immobile element ratios, e.g., the Ruxton ratio (RR; SiO2/Al2O3); immobile/mobile element ratios, e.g., the plagioclase index of alteration (PIA), chemical index of alteration (CIA), and chemical index of weathering (CIW); and mobile/mobile ratios, e.g., alkaline ratios. The Weathering Index of Parker (WIP), on the other hand, is obtained from the atomic proportions of mobile elements (7). Additionally, the alpha index (αAlE) of Garzanti et al. (8) (αAlE = (Al/E)sample/(Al/E)UCC, where E is a mobile element (Na, Ca, Sr, Mg, K, Ba or Rb) and the UCC (upper continental crust) has also been used and even adjudged to be better than the classical CIA and WIP (6). Since weathering intensity varies across parent materials and grain sizes (attributes typical of dryland soils), weathering indices may not always be accurate (5, 9). Thus, location-specific testing of the applicability of different geochemical indices and the governing factors behind chemical weathering is critical for robust and accurate assessment of chemical weathering. The loss of fertilizers, pesticides, and other toxic organic and inorganic compounds through overland conveyance and/or transmission along cracks and other macropores in shrink-swell soils provides an opportunity for unique insights into chemical weathering, trace element distributions, and mineral assemblages in these soils under a semiarid climate.
So far, only a few studies have focused on the chemical weathering of Vertisols and vertic intergrades) developed in dryland agro-ecosystems (6) and the depth distribution of trace elements in these soils with unique morphologies. Vertisols constitute the most intensively reference soil group used for dryland farming in Botswana (10, 11) and often present severe soil water management challenges due to their low saturated hydraulic conductivities. It is common to find Vertisols in close association with Calcisols, Vertisols, Gleysols and Cambisols. Geopedological investigations report that the eastern Hardveld, in relation to other parts of Botswana, has the most pedodiversity in the country, but these soils are grossly under-studied (12). Like other dryland ecosystems, Vertisols in central Botswana are highly vulnerable to anthropogenic and environmental pressures (13), which trigger changes in soil properties and processes. It is estimated that 80% of Botswana’s human population lives in the eastern Hardveld, which happens to be the hub of economic activities, including agriculture and mining. However, no study has assessed the chemical weathering intensity and depth distribution of trace elements in the most abundant soils in the Botswana. Previous studies on the soils have focused on land use surveys (14), available soil moisture (15), and soil-vegetation interactions (16). Thus, this study has three objectives: (i) to characterize the soils on the basis of their physical, chemical and mineralogical signatures; (ii) to quantify chemical weathering intensity in the soils via different geochemical weathering indices; and (iii) to inventory the native contents of trace elements (micronutrients) in the soils and explore the elemental relationships. The outcome of this study will pave the way for an improved understanding of pedogenesis (soil formation), landscape evolution, and trace element behaviour for sustainable management of soil resources and elsewhere in the world where similar soils exist.
This study was carried out in Serowe, central Botswana, approximately 300 km northeast of the capital city, Gaborone. Geographically, Serowe is located within 26°07´37´´ and 26°54´10´´E and 22°14´10´´ and 22°30´33´´S (Figure 1). The geomorphology of the study area is prominently characterized by NNE-SSW sloping escarpment, which is divided into two parts: an eastern Hardveld without sand cover and the Kalahari Sandveld. The escarpment stands 90 to 150 m above the surrounding areas, has a maximum elevation of 1260 m above sea level (17), and it marks the eastern boundary of the Kalahari Basin.
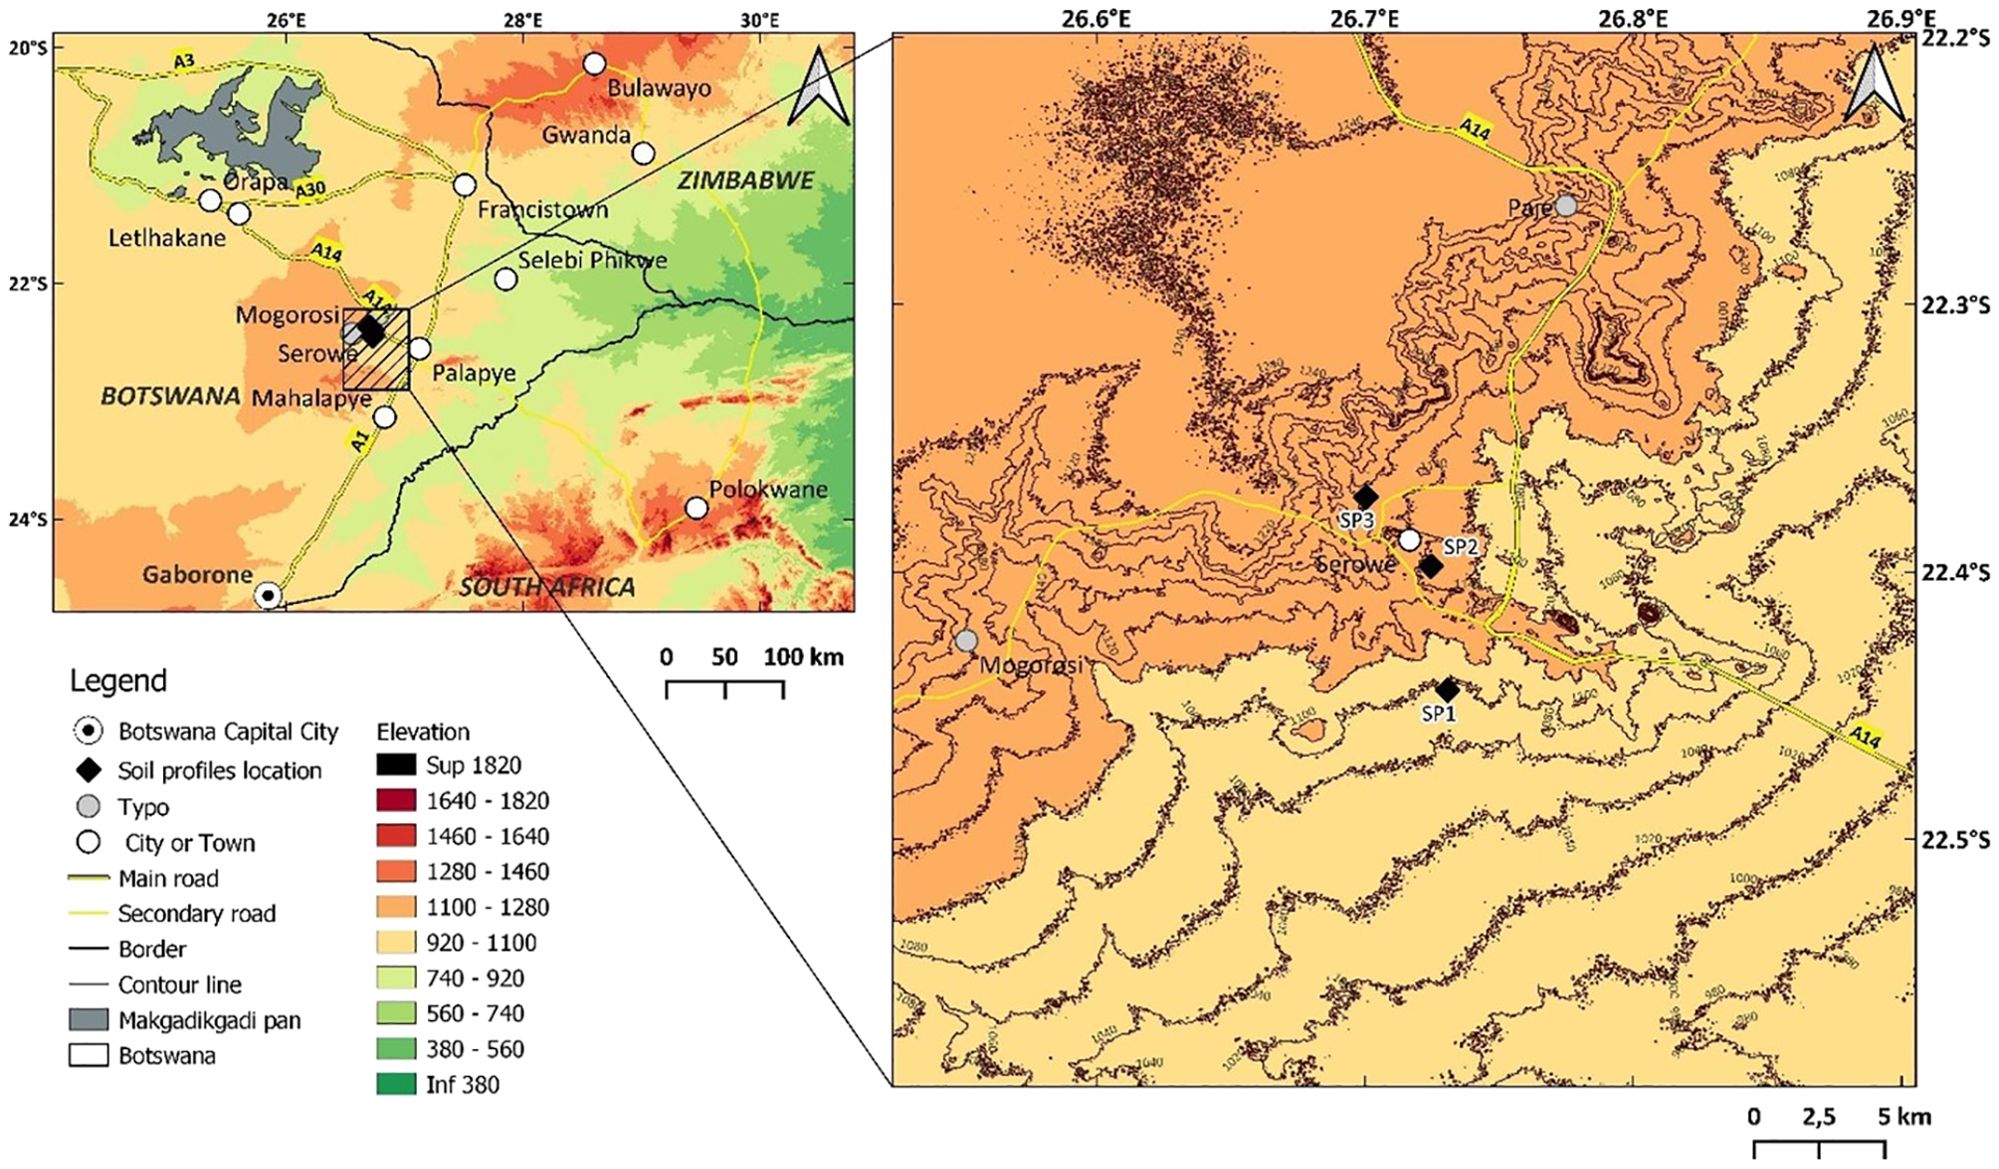
Figure 1. The map of the study area showing the locations of the three soil profiles.
The geology of the study area is composed of basalts of the Stormberg series (to the south) and post-Karoo dolerites (to the north), and Karoo sandstones and basalt are also found in the west of the study area (18).
The climate of Serowe is characterized as semiarid (cold dry winters with moist warm summers), with a mean annual rainfall of 477 mm. The summer season runs from October to April, whereas the winter season stretches from May to August. In general, the mean maximum temperature ranges between 22°C and 31°C, whereas the mean minimum temperature lies between 5°C and 19°C (14). The months of November, December, and January experience relatively high temperatures, and the lowest temperatures are observed in June, July, and August. This series is characterized by a gentle slope ranging from 1000 to 1250 m above sea level (15) with lower elevations in the east and southeast, whereas the highest elevation is found in the vicinity of the escarpment edge (with an average slope of 5%, which gradually decreases to 1% in the east and southeast) (14). Some rock outcrops exist at the escarpment and along river valleys below the escarpment; otherwise, in other areas, the rocks are covered by Kalahari sands and superficial deposits.
Three main physiographic units have been distinguished in the study area: Sandveld, escarpment and Hardveld. The Sandveld is composed of dense trees, shrubs and grasses. Denser and taller vegetation generally occurs along strips of escarpment, contrary to the shallowness of the soils in the study area (15). There is an occurrence of a dense stand of Cenchrus ciliaris (Buffalo grass), surrounded by denser woodland dominated by Colophospermum mophane and Terminalia sericea on Sandveld and Zizipus mucronata and Acacia spp. on the Hardveld (15, 18). The land use in the study area is predominantly farmland (sorghum and maize), livestock grazing, and human settlement. Compared with other soils in the region, the studied soils are more commonly used for farming because of their higher clay content, which enables them to retain more moisture.
Three representative soil profile pits (SP1, SP2, and SP3) were selected along a prominent slope in Serowe after a reconnaissance survey. These profile pits stand at different elevations along the gently rolling slope east of the escarpment. Overall, the field and soil profiles were described according to the Guidelines for Soil Profile Description (19). Fresh rock samples at the bottom of the pits were analyzed as the parent material. Soil samples were collected from each genetic horizon of the pedons, bagged, and shipped to the laboratory for further analysis.
Before analysis, the soil samples were air dried, gently crushed, and passed through a 2 mm sieve to remove gravel and large roots. Routine laboratory procedures were used to analyse the physicochemical properties of the soils. Particle size distributions were determined (after the removal of carbonates with dilute HCl) following the Bouyoucos hydrometer method as described by Gavlak et al. (20). Bulk density was measured via the core sampler method (21). The dry weight of the soil is then divided by the cylinder volume, providing an estimate of the bulk density. The soil pH in water and electrical conductivity (EC) were measured at a 1:2 (w/v) soil-to-solution ratio, and the values were read via a pH meter and EC glass electrodes, respectively. The carbonate content was determined gasometrically by measuring the carbon dioxide volume evolved during the hydrochloric acid reaction via an Eijkelkamp calcimeter.
The full characterization of the clay fraction minerals was carried out at the Mineralogy Laboratory of the Institute of Geosciences, University of Potsdam. The samples were dried at 40°C and crushed to a grain size of less than 63 µm. The clay fractions (<2 μm) were separated via ultrasonic centrifugation. To prevent clumping, 0.2 g of each sample was mixed with ammonia water (0.003% NH3) and added to centrifuge tubes. After 2 min at 2000 rpm, the supernatants were transferred to Petri dishes and dried on air. All the clay separates were processed and analysed following the principles of Moore and Reynolds (22). For XRD analysis of oriented clays, four different diffractograms were recorded for each sample via powdered clay separates that were mounted on glass slides: (i) air-dried, (ii) ethylene glycol-treated, (iii) heat-treated samples at 400°C for 30 minutes, and (iv) heat-treated samples at 550°C for 30 minutes. X-ray powder diffraction data were collected on a PANalytical Empyrean powder X-ray diffractometer with Bragg–Brentano geometry. The instrument was equipped with a PIXcel1D detector using Cu Kα radiation (λ= 1.5419 Å) operating at 40 kV and 40 mA. θ/θ scans were run in a 2θ range of 3–50° with a step size of 0.0131° and a sample rotation time of 1 s. It was equipped with a programmable divergence and anti-scatter slit and a large Ni-beta filter. The detector was set to continuous mode with an active length of 1.116°. HighScore Plus version 4.0 (including the PDF reference database) was used as the analytical reference software for phase identification following the principles of Moore and Reynolds (22).
The bulk major and minor element compositions were determined with a ZETIUM X-ray fluorescence spectrometer (XRF) from Malvern Panalytical, UK, housed in the ElMiE-Labs at the German Research Centre for Geosciences (GFZ) Potsdam. Powdered rock samples (grain size < 62 μm) were dried at approximately 105°C, and 0.7 g of powder was weighed and mixed with LiBO2. Glass disks were prepared on different heaters at temperatures between 400 and 1150°C. The loss on ignition (LOI) was determined separately by gravimetry. The quantification level was 0.02 wt% for major elements and 10 ppm for minor elements. The minor and trace element contents were determined via the sodium peroxide fusion method. The sample (0.2–2.0 g) was weighed into a crucible containing Na2O and NaOH. The mixture was then fused. The sample was leached, acidified, and brought to volume. The sample was then analysed via inductive coupled plasma optical emission spectroscopy.
A suite of 11 geochemical weathering indices (Table 1) was used to evaluate the weathering stages of the shrink-swell soils. The percentage weight of an individual element’s oxide was divided by its molecular weight to obtain the molar weight and facilitate subsequent weathering index calculations. *CaO represents the amount of CaO incorporated into the silicate fraction of the samples and was calculated as CaO* = 0.35 × 2 (Na2O in weight %)/62 (34). For a more detailed exposition of the rationale behind the weathering indices, refer to the brilliant reviews of Price and Velbel (35) Sheldon and Tabor (36), and Guo et al. (9). In addition to the indices in Table 2, the intensity of chemical weathering was further estimated for each mobile element (Na, Ca, K, Rb, Mg and Sr) by comparing its concentration to that of immobile Al in the studied samples and in the upper continental crust (UCC), defined as the alpha index, αAlE = (Al/E)Sed/(Al/E)UCC. Typically, αAlE > 1 indicates a depletion of element E in the soils with respect to the UCC; αAlE < 1 indicates enrichment, and αAlE = 1 indicates no net depletion (8).
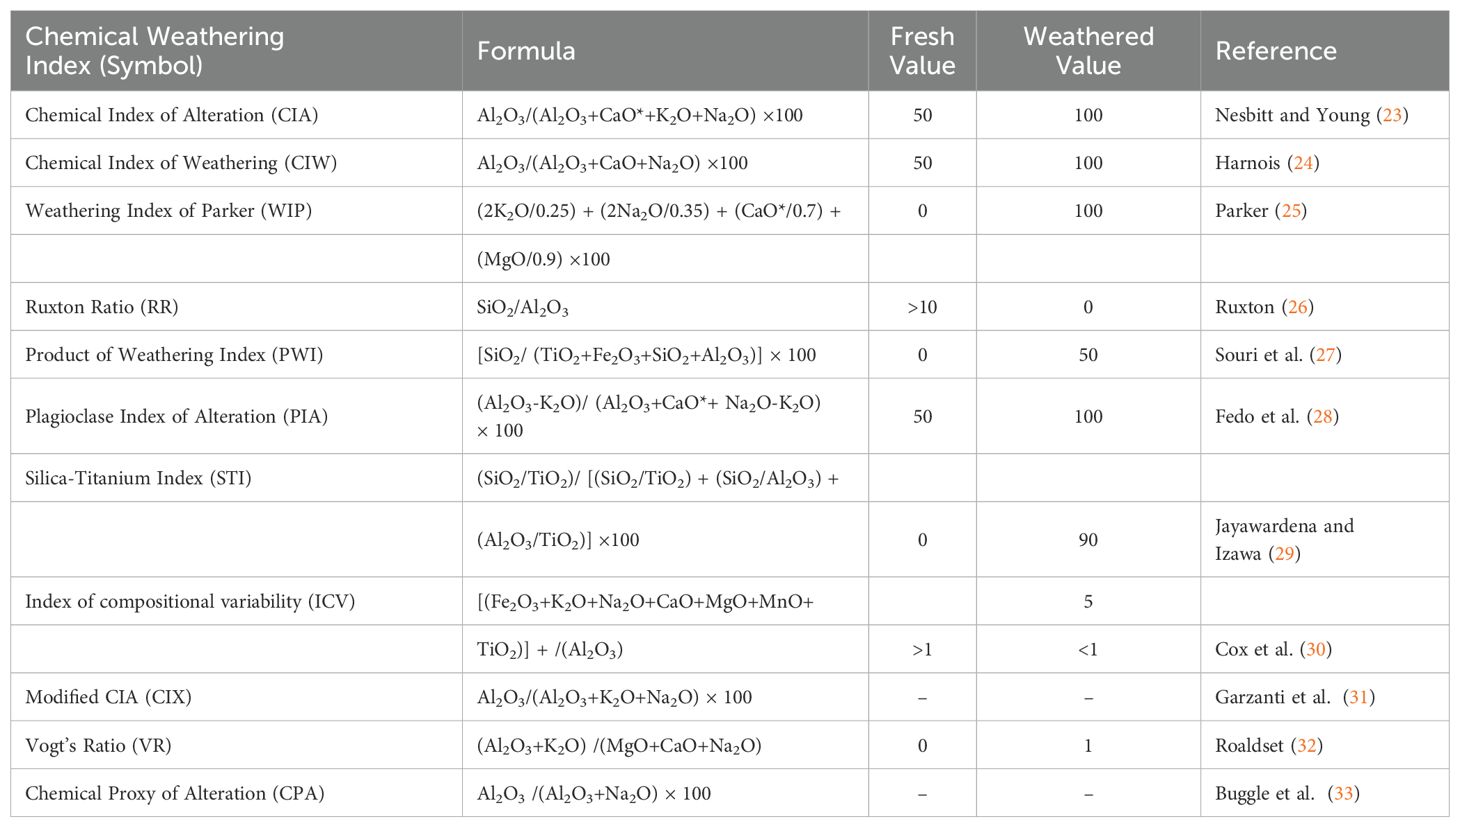
Table 1. Geochemical indices used to evaluate the weathering intensity of the soils.
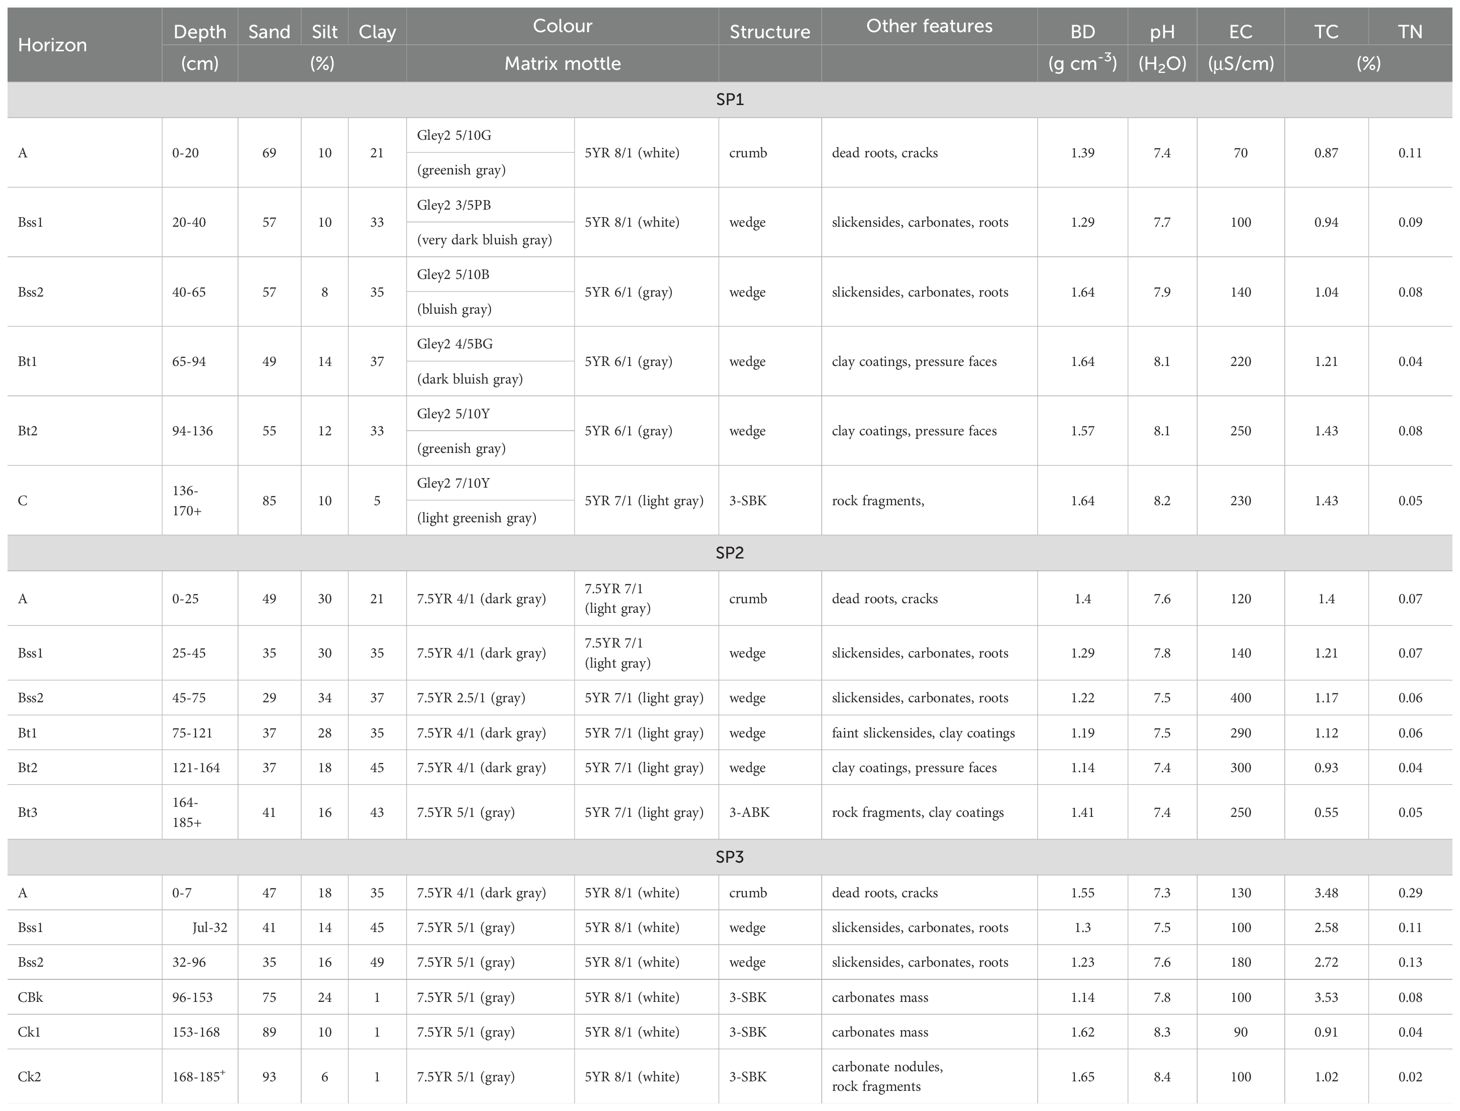
Table 2. Morphological and physicochemical description of the shrink-swell soils.
All the graphs and statistical analyses were performed with OriginPro (version 2024b; Origin Lab, Northampton, MA, USA) (37). First, the concentrations of trace elements and soil physicochemical properties were standardized to eliminate possible unwanted scale effects that can arise from variations in magnitude and measurement units. Given that the whole geochemical dataset cannot be properly understood and interpreted by analysing the within- and between-profile trends on an element-by-element basis, multivariate statistical techniques have become a veritable tool for the interpretation of geochemical data. Factor, cluster, and principal component analyses were used to identify elements of similar geochemical behaviour and to group soils on the basis of their geochemical affinity.
All three pedons are deep (> 100 cm) and have A-Bss-Bt-C profile development (Figure 2). Although the soils are generally grayish (dry color), SP1 is slightly different from SP2 and SP3 (Table 2); SP1 is very dark bluish gray to light greenish gray (Gley2 3/5PB – Gley2 7/10Y), whereas SP2 and SP3 are dark gray (7.5YR 4/1) on the surface (A horizon) and gray (7.5YR 5/1) subsurface (B and C horizons) (38). White to light gray nodules, which formed from the precipitation of carbonate, are present in some horizons.
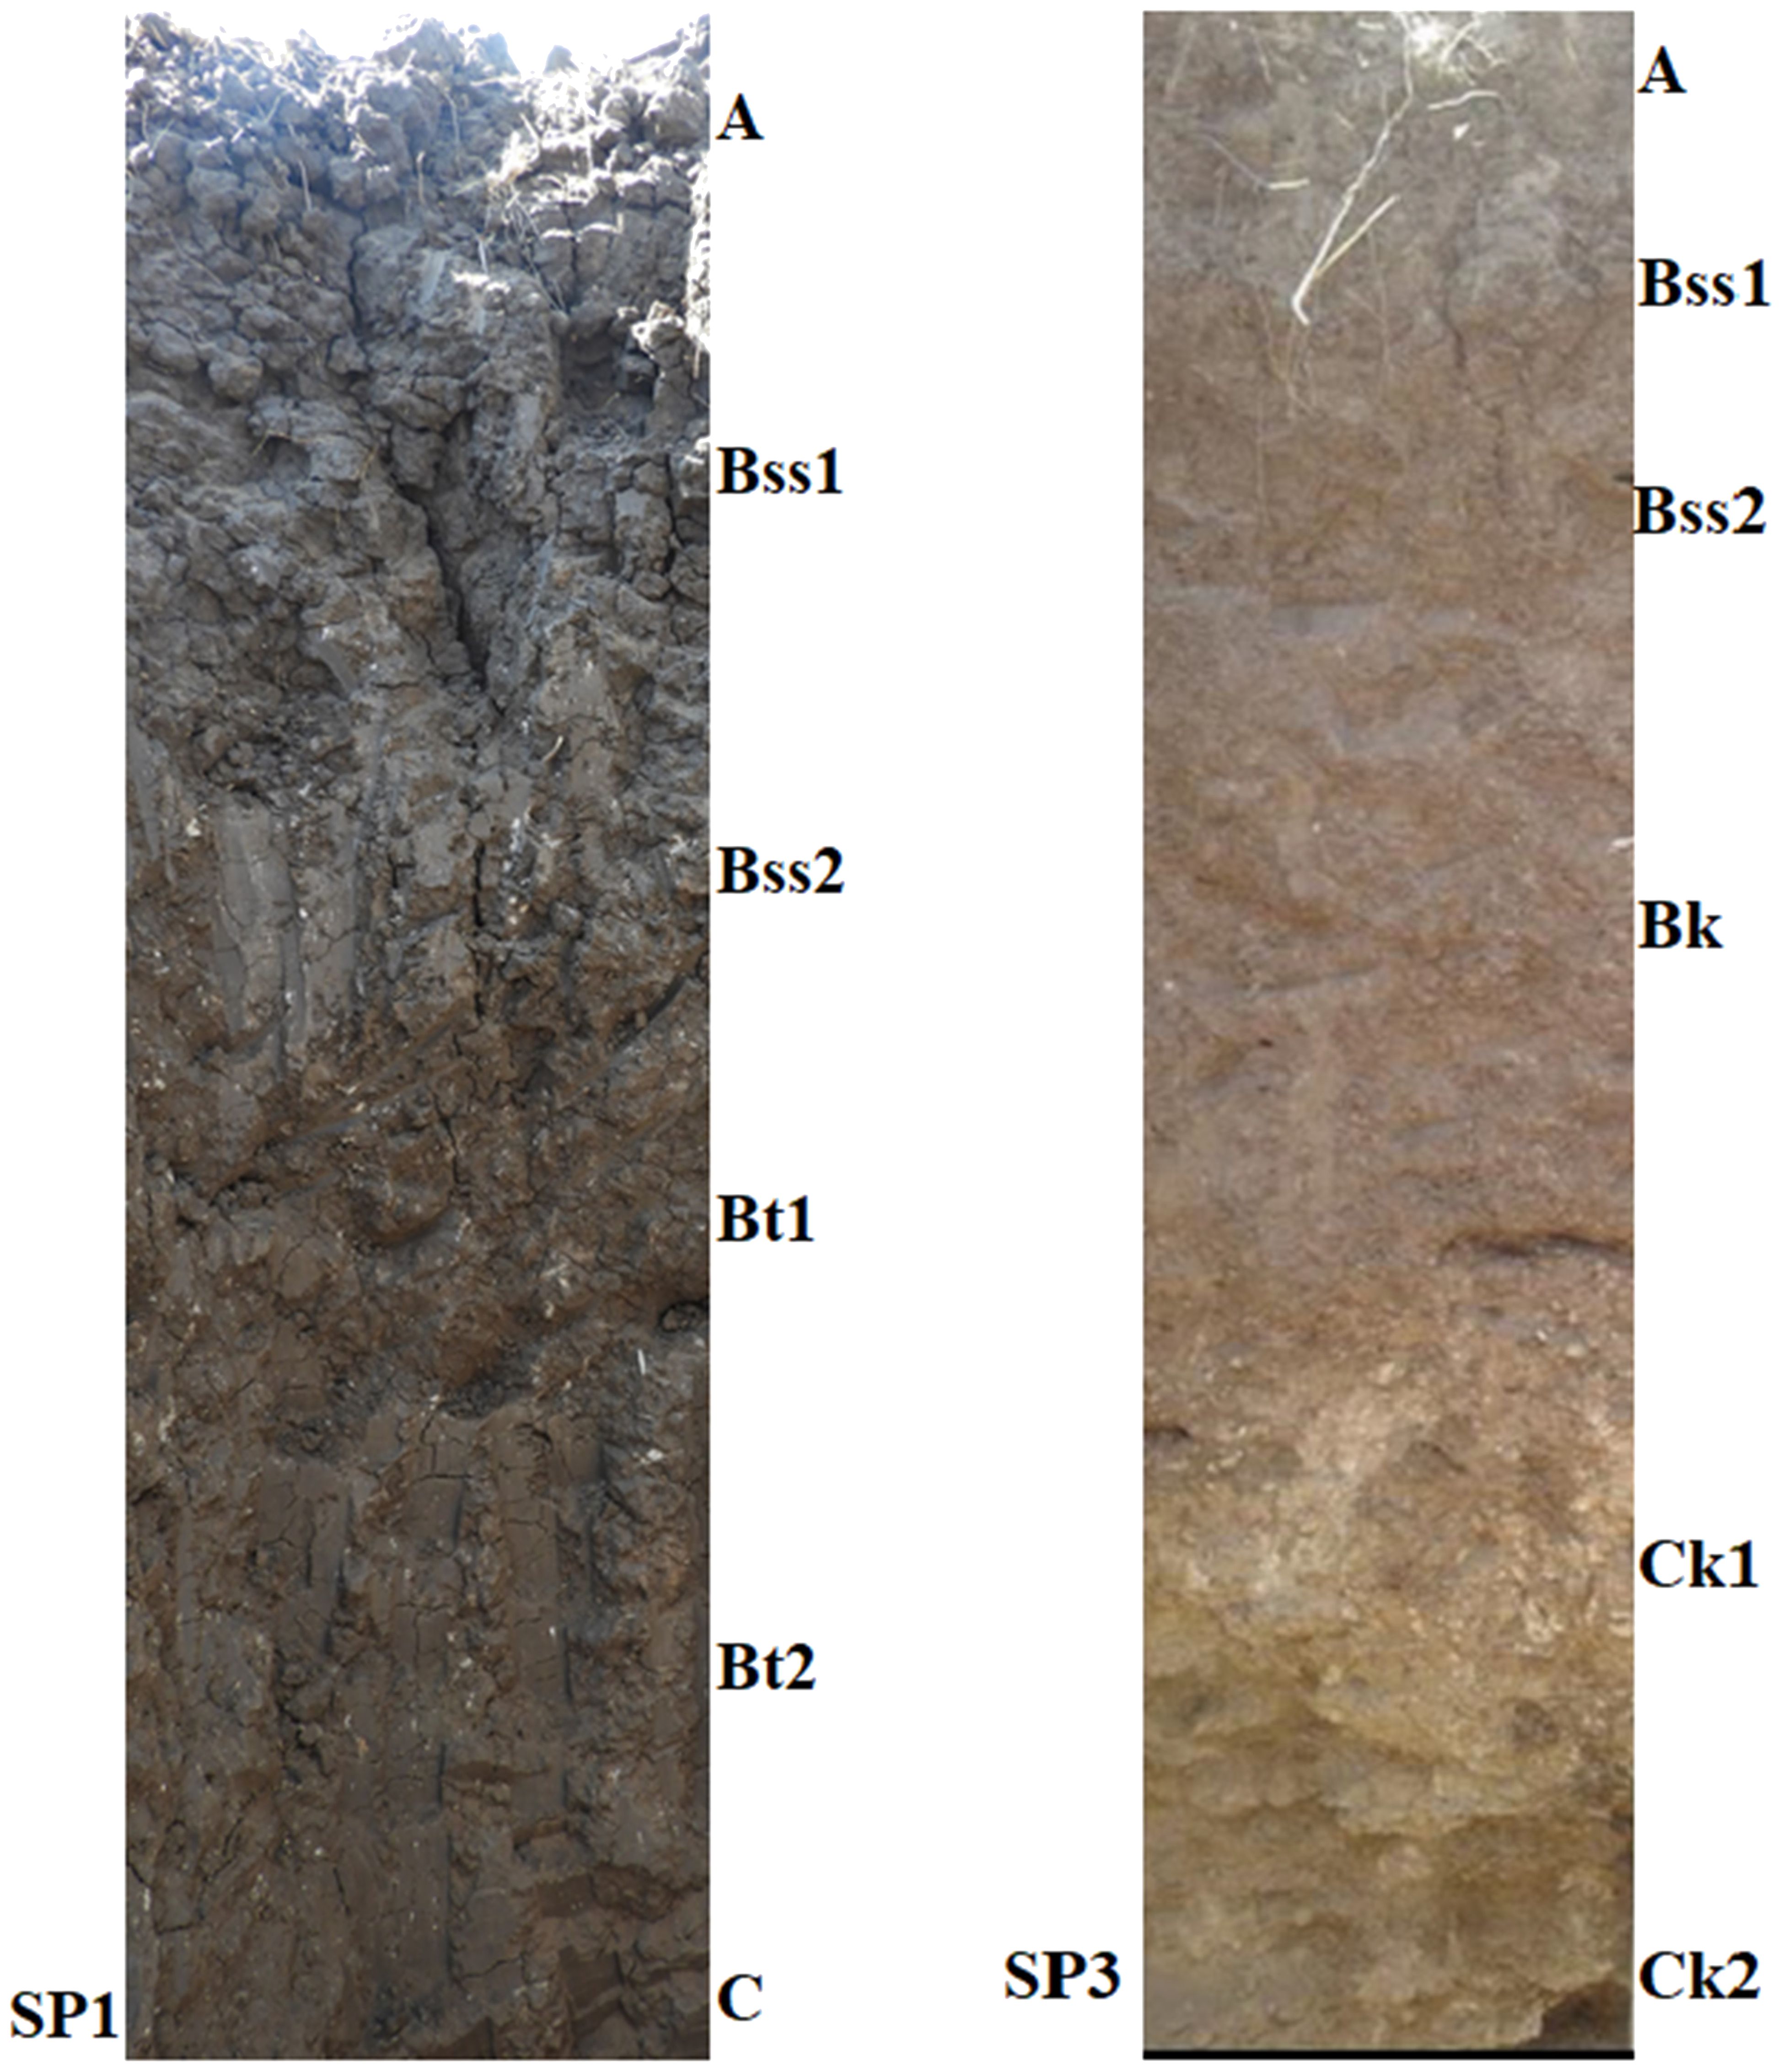
Figure 2. Two (SP1 and SP3) of the pedons at the foot- and toeslope respectively.
The soils are largely fine-grained with textures ranging from sandy clay loam to clay loam (Table 2). SP1 and SP2 have greater clay contents than SP does. Sand is predominant in the deep horizons of SP1 and SP3. All the A horizons have crumb structures, whereas the subsurface (B and C) horizons have wedge and strong subangular structures respectively.
Both fine and coarse fresh and dead roots are abundant in the surface horizons. The subsurface horizons (Bss and Bt), on the other hand, have abundant slickensides, pressure faces and clay coatings in B horizons and rock fragments, and soft carbonate nodules (Bk) features in the deepest (C) horizons (Table 2).
The results of other physicochemical properties, including bulk density, pH, electrical conductivity, total carbon and total nitrogen, are presented in Table 2. Among the three representative pedons, the bulk density ranged from 1.04 to 1.64 g cm-1. Deeper horizons have relatively higher bulk densities than surface horizons do. The soils are alkaline, with pH values ranging from 7.4–8.4. SP1 and SP3 have higher pH values in the two deepest horizons and have stronger reactions to dilute acid, whereas SP2 has a fairly uniform pH across depth. The electrical conductivity is markedly greater in the last horizons of SP1 and SP2, with values ranging from 70–300 μS/cm. SP3 has no clear pattern for electrical conductivity. When the EC is generally less than 2000 μS/cm, the soils are classified as non-saline. The total carbon (TC) content, consisting of both organic and inorganic carbon, ranged from 0.5 to 3.5% in the soils (Table 2). The C-horizon of SP1 has more TC than the surface horizons do, whereas the reverse is the case for SP2 and SP3, where the topsoil has more TC content than the deep-lying horizons do. The total nitrogen (TN) content of the soils ranged from 0.02 to 0.29%, with the highest values occurring in the surface horizons.
Quartz, calcite, feldspar, montmorillonite and palygorskite are the minerals identified in the clay-sized fraction of the soils (Table 3). Montmorillonite is the dominant clay in all the soil profiles. X-ray diffractograms show prominent reflections at 4.26 Å (100) and 3.35 Å (101) for quartz, at 14.58 Å (001) and 4.46 Å for montmorillonite, at 3.03 Å (104) and 1.87 Å (116) for calcite and at 10.43 Å and 3.19 Å for palygorskite. After glycolization, the montmorillonite peak moved to 17 Å and collapsed to 10 Å after heat treatment. The peak at 10.5 Å shows no change after glycolization and disappears after heat treatment. Palygorskite only occurs in the lowest horizon (SP3), and the proportion of quartz in the clay fraction is also lowest there.

Table 3. Semi-quantitative minerology of the clay sized fraction of the soils.
The X-ray fluorescence and ICP-MS results of the major and trace element compositions of the soils are reported in Table 4. The most abundant element in the soils was Si, with a range of 49.1-83.5 g.kg-1, followed by Al and Fe in SP1 and SP2. However, in SP3, the average composition of Ca was second after that of Si and then followed by that of Al and Fe. Therefore, Si, Al, Fe, and Ca are the four most abundant elemental oxides in soils. The fifth element in order of abundance is Mg, which ranges from 0.71–6.85 and increases with depth in SP1 and SP3, whereas there is no definite pattern in SP2. SP2 and SP3 had Na concentrations ranging from approximately 1–2 g.kg-1, but the Na concentration was very low in SP1. Other major elements, including Mn, K, P and Ti, are present in the soils at concentrations below 1 g.kg-1 (Table 4). The Zn, Ni and Sr contents in the pedons ranged from 10.4–79.0, 10.8–69.3, and 93.1–350 mg kg-1, respectively. SP1 and SP3 showed an increase in Zn, Ni and Sr in the deeper horizons, whereas SP2 showed no clear trend in the depth distribution of these trace elements. The rubidium content in the soils ranged from 9.9–109.0 mg.kg-1. SP1 and SP3 have relatively high concentrations of Rb in the surface horizons, whereas SP2 has a fairly uniform concentration across depth.
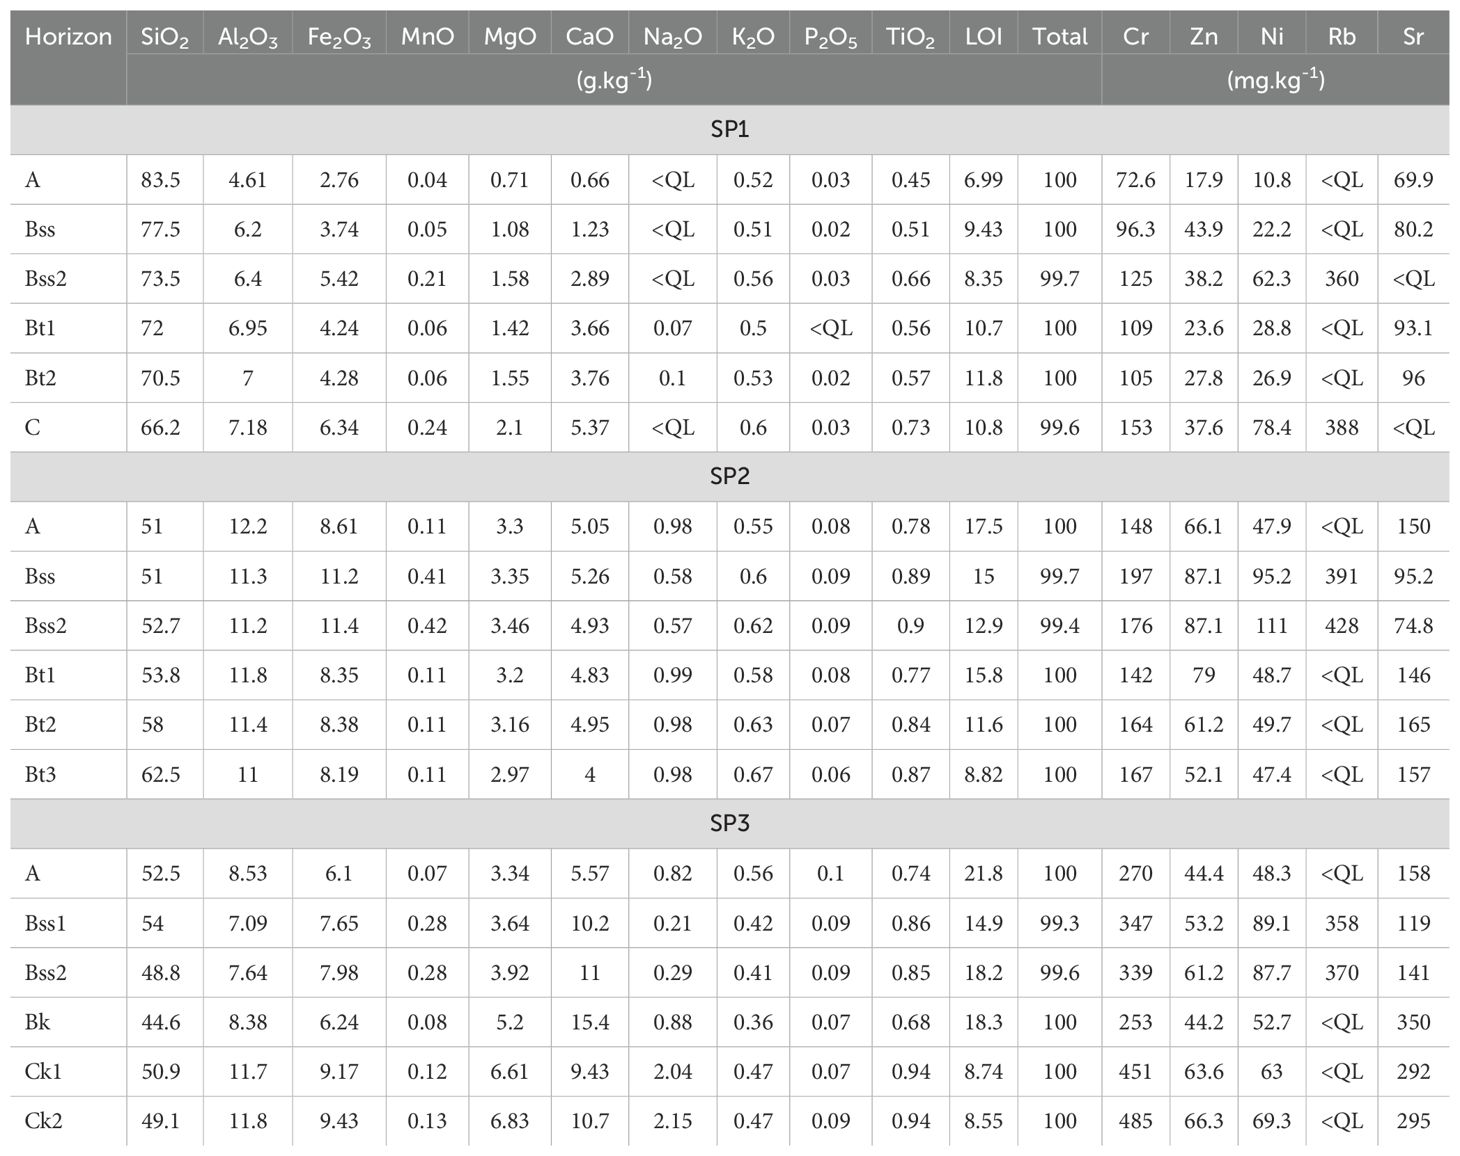
Table 4. Major and trace elements composition of the soils.
A Kaiser–Meyer–Olkin (KMO) test to measure sampling adequacy is used to assess the relationship between the input variables, as recommended by Durana et al. (39). By convention, KMO values range between 0 and 1, where values of ≥ 0.8 represent adequate sampling, 0.7–0.79 represent middling, 0.6–0.69 represent mediocre sampling, and < 0.6 indicates insufficient sampling, with values < 0.5 having the potential to be inadequate to examine a dataset.
However, Shrestha (40) reported that for a sample size of less than 100, a KMO of 0.6 is acceptable for factor analysis. The KMO of this study is 0.74 for elemental compositions, which is acceptable for factor analysis, as shown in Figure 2. To determine the strength of correlation among the elements, Bartlett’s sphericity test is applied to determine the suitability of dimension-reduction techniques. A significant value of < 0.05 for Bartlett’s sphericity test means that factor analysis and principal component analysis may be worthwhile for a dataset (39). In this study, the value of Bartlett’s sphericity test is less than 0.05. Factor analysis of standardized raw data for element concentrations and other important soil properties (TC, TN, EC, pH (H2O), and sand, silt, and clay contents) was used to identify affinity groups. The first two factors explained only 59% of the variation in the data (Figures 3a, b). The grouping of properties into affinity groups is mostly weak, with properties showing a diffuse distribution with no very distinct affinity groups. Factor 1 describes 42.5% of the variation and positively covaries with Fe, Ca, Mg and heavy metals and negatively covaries with K. These associations are reflections of the distinct pedogenic processes of the formation of Fe–Mn oxides and calcite nodules, respectively. Factor 2 only describes an additional 16.3% of the variation.
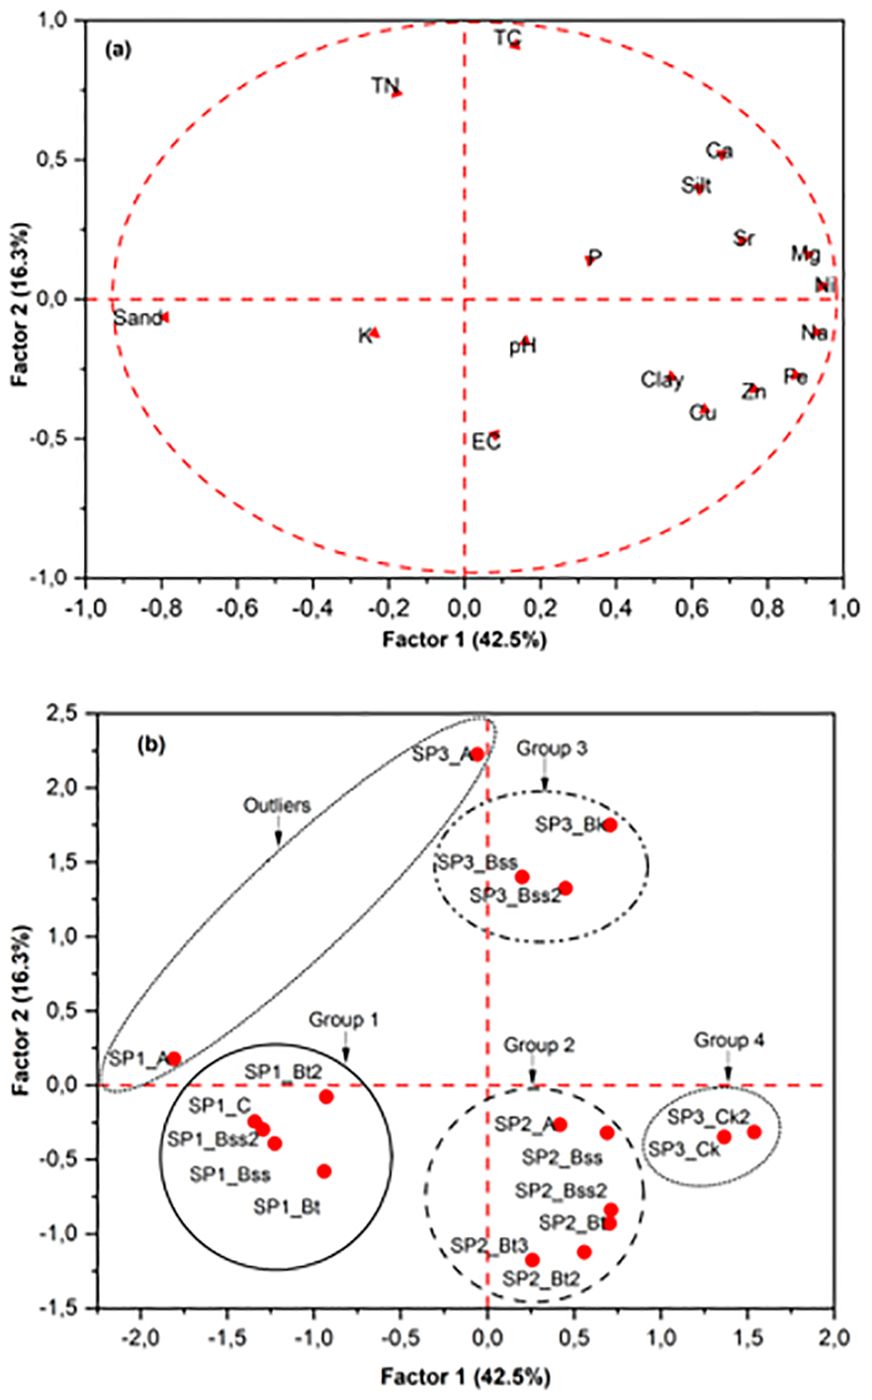
Figure 3. Factor analysis based on the chemical and textural properties of the bulk soil samples: (a) distributions of chemical and textural properties (variables) and (b) distributions of the soil samples (cases).
The plot of the soil samples in a factor diagram (Figure 3b) based on the entire dataset shows that the soils may be allocated into four distinct groups with some outliers. The first and second groups show clusters of SP1 and SP2 profiles, respectively, which contain high Fe contents, especially the Bt and Bss horizons, as they contain Fe–Mn nodules and sometimes small rock fragments. In SP3, the C horizons are more distinct from the A and B horizons than the Group 3 and 4 horizons are (Figure 3b). Group 3 of SP3 has an illuvial clay content (especially the Bt horizons). The fourth group includes soil samples that have high contents of calcium carbonate nodules: these are the Ck and Ck2 horizons of the SP3 pedon. A small outlier group is connected with the surface soils (A horizons) of SP1 and SP3, which have very high accumulations of quartz.
The results (Table 5) of the 11 geochemical weathering indices show how the indices were measured in the soils. To facilitate interpretation, the values of the fresh and highly weathered samples are presented in Table 1. Most of the soil samples in SP2 and SP3 have CIA values varying from 70–80, which likely points to a large loss of Na, K, and Ca, in contrast to the stable phases of Al and Ti. In the soils, the CIW and PIA values are slightly higher than the CIA values. There is a strong positive correlation between the CIA, CIX, CPA, CIW, and PIA (Figure 4). The calculated WIP values ranged from 2.02 to 19.33 in the pedons and were negatively correlated with the values of the CIA, CIW, and PIA. The average CIA, CIX, CPA, CIW, and PIA suggest intense weathering in SP1 and moderate weathering in SP2 and SP3.
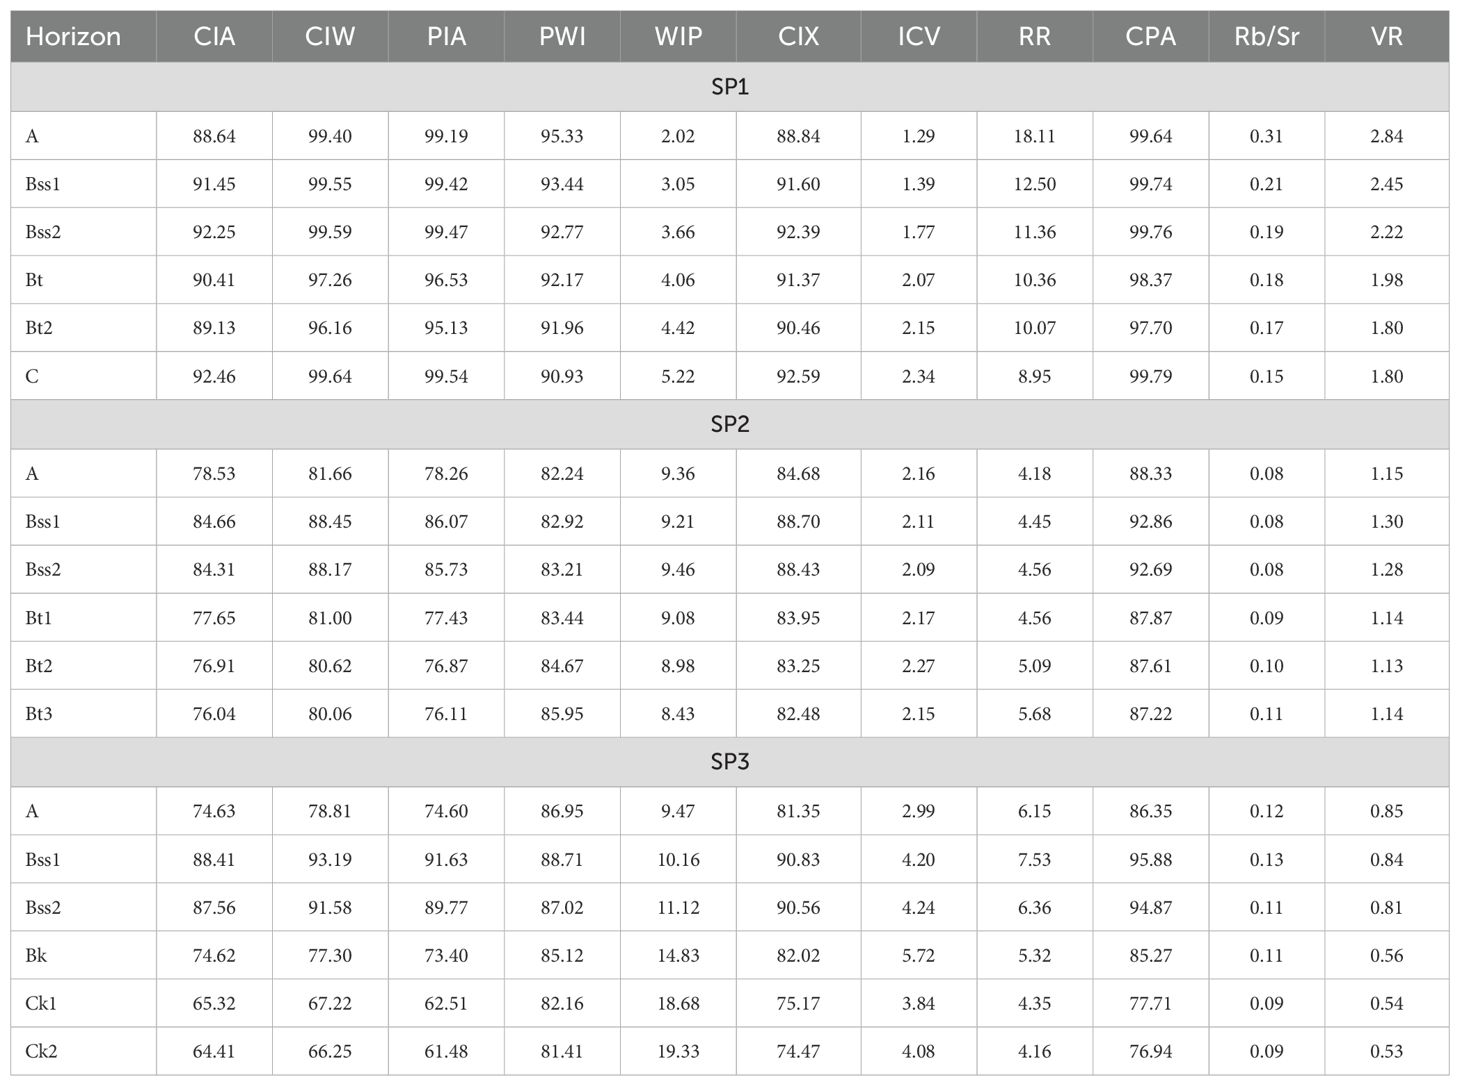
Table 5. Applied geochemical weathering indices.

Figure 4. Principal component analysis (PCA) of the weathering indices.
The average αAlMg, αAlCa, αAlNa, αAlSr, αAlK, αAlBa, and αAlRb values in the three pedons are 0.52, 0.66, 2.77, 1.91, 3.72, 1.21, and 3.80, respectively. Therefore, the trend of element mobility in soils can be expressed as follows:
αAlRb ≈ αAlK > αAlNa > αAlSr > αAlBa > αAlCa ≈ αAlMg
Variations in αAlE were observed within and across the three pedons (Figure 5). Notably, αAlE > 1 indicates a depletion of element E in the soils with respect to the UCC; αAlE < 1 indicates enrichment, and αAlE = 1 indicates no net depletion.
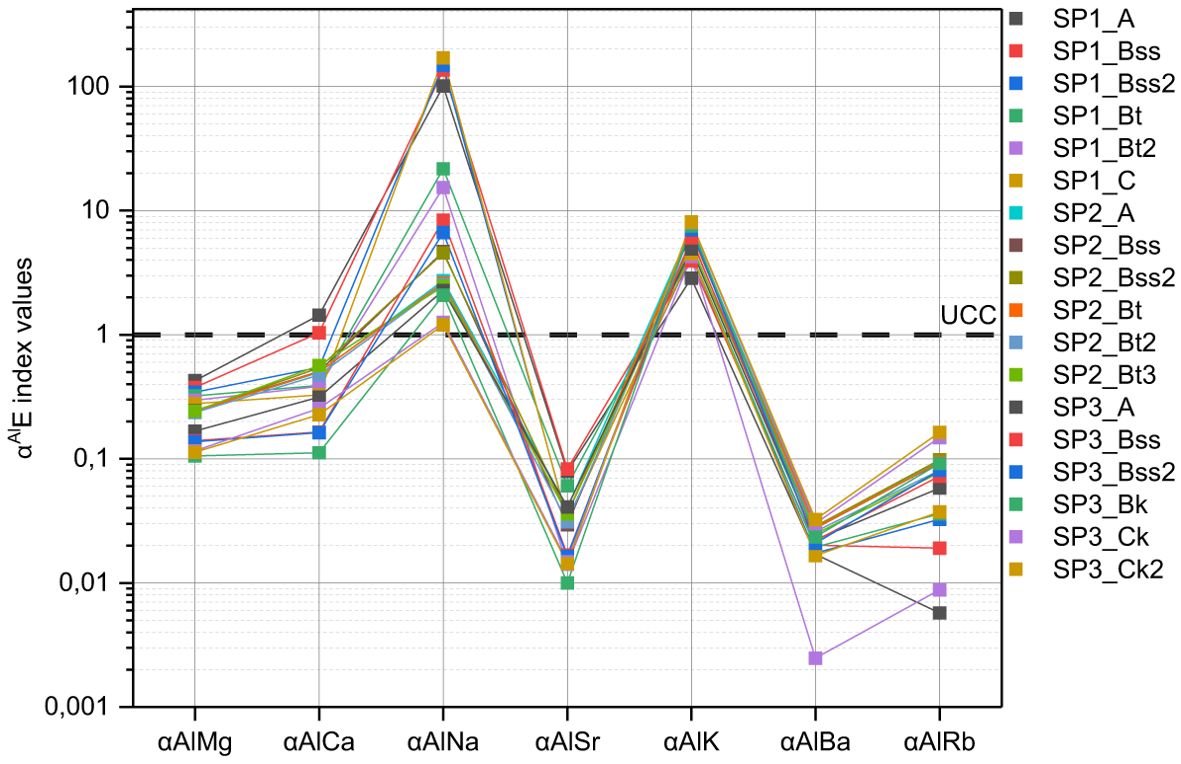
Figure 5. A plot of the αAlE indices in the soils.
The PCA results of the alpha index (αAlE) revealed that two principal components accounted for 93.26% of the total variance, with eigenvalues greater than 1. Factor 1 (variance proportion: 75.72%) was positively correlated with αAlNa and αAlMg (Table 6). Factor 2 (17.54%) had high positive loadings of αAlCa, αAlSr, and αAlBa (Table 6).

Table 6. Factor score coefficients of the rotated component matrix in shrink-swell soils.
A pedological investigation into the shrink-swell soils on a prominent foot and toeslope of Serowe was conducted with the objective of characterizing soils on the basis of their physical, chemical and geo(chemical) properties; quantifying chemical weathering; exploring the depth distribution of trace elements; and exploring the relationships between various elements. On the basis of their properties, these soils qualify as Vertisols as previously reported (e.g., 16, 41). According to WRB-FAO (19), Vertisols have vertic horizons (clayey subsurface horizon with polished and grooved ped surfaces (“slickensides”) or wedge-shaped or parallelepiped structural aggregates) within 100 cm from the soil surface. They have 30 percent or more clay in all horizons to a depth of 100 cm or more, or to a contrasting layer (lithic or paralithic contact, petrocalcic, petroduric or petrogypsic horizons, sedimentary discontinuity, etc.) between 50 and 100 cm, after the upper 20 cm have been mixed.
With a semiarid climate, the study area receives little annual precipitation and has a thermic soil temperature and udic soil moisture regimes. These prevailing climate conditions affect soil formation by limiting the intensity of weathering and, by extension, the soil depth. In contrast, the Vertisols are generally deep, exceeding 100 cm. On the basis of their physiographic positions, the soil depth could be attributed to their position on the landscape, foot to toeslope. Topography, as a passive factor of soil formation, has been widely reported to affect soil production (42, 43). Aside from soil depth, topography affects drainage, which in turn influences soil color. In soils, the dominant soil color is a reflection of the drainage and nature of the source rock lithology, which can be classified as mainly basaltic with possible surface deposition of Kalahari sands. The fine texture of the soils may also be attributed to the nature of the source rock lithology. The influence of parent materials on the colour and particle size distribution of soils is well documented (e.g., 44–46). Clay minerology (Table 3) plays a critical role in the morphology of the soils. The medium shrink-swell features observed in the B horizons of these pedons are due to the clay mineralogy, montmorillonite, a 2:1 phyllosilicate mineral known for its ability to swell and shrink under wet and dry conditions because of the presence of interlayer spaces in their lattice structures. Additionally, the slickensides and pressure faces observed on the peds are also associated with clay mineralology.
The presence of carbonate nodules in the pedons points to a middle stage of carbonate pedogenesis. The greater carbonate accumulation recorded in the deep horizons than in the surface horizons can be attributed to carbonation processes and insufficient leaching. High accumulation of carbonates in the soils and sediments of Botswana is has been reported in earlier studies (e.g., 4, 47–49). Organic matter and clays play crucial roles in the structural integrity of soils, whereas organic matter contents are responsible for the crumb structure at the surface, the clay content of illuvial horizons helps in the formation of wedge structures typical of Vertisols (Table 2). Clays and organic matter are well known to be involved in soil structure (aggregate) formation (50–52). All the soils have alkaline pH values, which could be attributed to the presence of basic cations (Ca2+, Mg2+, Na+ and K+) released from the initial chemical weathering of basaltic parent material. Montmorillonite, the dominant clay mineral in these soils, is enriched with basic cations in their interlayer spaces, which can be taken up by plants upon weathering. Furthermore, these cations, in turn, bestow a strong buffering capacity to soils against acidification (53). With an electrical conductivity of less than 2000 μS/cm, the soils were considered nonsaline according to the Natural Resources Conservation Services (NRCS) Soil Survey Handbook (54). Sodium, the element that is mainly responsible for soil salinity, is easily lost through soil profiles, which could be responsible for the higher values recorded in the lower horizons of the pedons.
The very low (<0.1%) to low (0.1-0.2%) total nitrogen and carbon contents of the soils (Table 2), as classified by Landon (55), occur where organic matter is low and where the high temperature in the study area also triggers accelerated mineralization and volatilization of total nitrogen. Most soils in sub-Saharan Africa have low total nitrogen, which often results in net negative nutrient balances (56).
Given that these soils developed at the boundary between the eastern Hardveld and Kalahari sands, sandy material deposition on the surface is possible. Therefore, to ascertain the uniformity of the pedons, depth functions of factor scores (Factors 1 and 2) of soil properties were plotted (Figure 6), as this procedure has proven to be highly diagnostic of sedimentary layers in soils (57, 58). The values of Factors 1 and 2 for the SP2 soils are quite uniform with depth, but for the SP1 and SP3 soils, Factors 1 and 2 vary substantially with depth. Additionally, the factor 2 values for SP3 show abrupt changes at deeper horizons. These changes reflect the elevated abundance of pedogenic calcium carbonate nodules and their associated elements in these horizons. The nearly uniform values of Factor 1 and Factor 2 in SP2 indicate that the composition of the pedon is quite uniform within the profile and that pedo-accumulation of oxides or carbonates has not occurred in most horizons compared with those in SP1 and SP3.

Figure 6. Depth functions for Factors 1 and 2 from the factor analysis of the soil properties.
By separately considering the affinity groups of elements (not including other soil properties) for the Vertisols (Figure 7a), the first two factors explained 90.0% of the variation. This study, therefore, has demonstrated that pedological processes play a more important role in determining the chemical composition of these soils than does colluvial depositional layering.
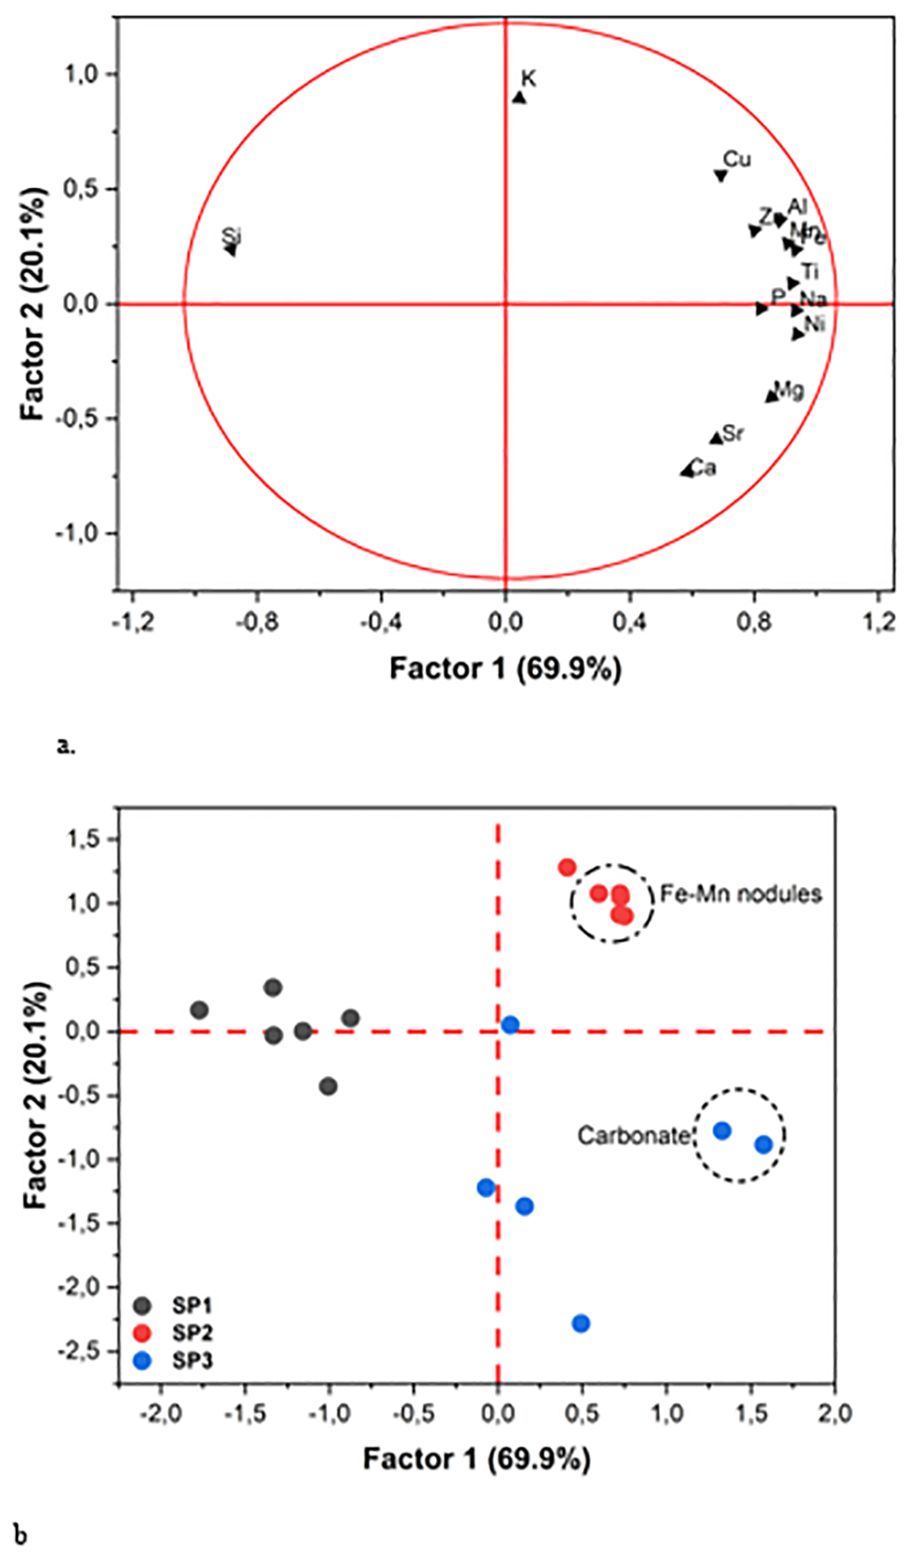
Figure 7. Factor plots showing: (a) the element, (b) sample affinity groups for the soils.
The reduction and oxidation of Fe and Mn due to variations in redox potential under periodic swelling and shrinking are important mechanisms for pedogenesis in vertic soils. Redox-sensitive elements, particularly Fe and Mn, are dissolved and subsequently precipitate in the form of Fe–Mn nodules (Figure 7b). Redox-sensitive trace metals and some other trace metals become entrapped in nodules, resulting in statistical associations (59, 60). The periodic wetting conditions associated with vertic property may trigger the dissolution, diffusion and precipitation of metals in soil environments.
The variations in the suite of geochemical weathering indices applied in this study reflect the complex interactions among the factors of soil formation in the area. The CIA, CIW and PIA results (Table 6) confirmed that SP1 has undergone high weathering, whereas SP2 and SP3 have experienced low to moderate weathering. The relatively low values of the CIA recorded in the two deepest horizons of SP3 are due to the high carbonate content. According to Price and Velbel (35), different CIA values may simply reflect variations in the chemistry of the unweathered parent rock rather than the degree of weathering. High CIW values indicate increased weathering, and high CIW values are due to the elimination of K2O in the calculation. In almost all the pedons, the CIW values are greater than the CIA values are, indicating a nearly analogous weathering pattern. The distribution pattern of PIA is similar to that of CIA and CIW in the studied pedons. SP1 has higher values of these indices than SP2 and SP3 do, with PIA values being higher than the CIA values. In cases where the PIW and CIA have similar values, a minor contribution of K during burial and pedogenesis is suggested (61).
For SiO2/Al2O3, also known as the Ruxton ratio (RR), the unexpectedly high SiO2 depletion in SP2 and SP3 suggests advanced weathering and contradicts the CIA, CIW, PWI, and PIA, which could be related to the presence of more soluble amorphous silica in the basalts of the arid region. With respect to weathering profiles developed on basalts in semiarid northern Iran, Heidari and Raheb (6) reported a similar trend. Strontium has a relatively smaller ionic size (1.32 A°) than does Rb (1.66 A°), which helps displacement clay minerals from soil exchange sites (62). Consequently, the low Rb/Sr ratios (0.09-0.32) confirm the prevalence of moderate levels of chemical weathering processes in the study area (Table 5).
The PCA results of the alpha index (αAlE) show that PC1 has moderate positive factor loadings of αAlMg and αAlNa and negative loadings of αAlK and αAlRb (Table 6). By convention, with increasing chemical weathering, small cations (Na+) are more easily removed than Mg2+. In this study, Na+ and Mg2+ were less abundant. This finding indicates that variations in αAlMg, αAlK and αAlRb may not be solely controlled by chemical weathering. Similar to the findings of Zhao et al. (63), the relatively high values of αAlK and αAlRb in this study roughly align with the low K-feldspar contents in semiarid soils. Factor 2 (17.54%) had positive loadings of αAlCa, αAlSr, and αAlBa (Table 6). The accumulation of carbonates (Table 2) in the soils may have contributed to the values of αAlCa, αAlSr and αAlBa. In addition to chemical weathering, the enrichment of carbonates in soils has been reported to result in lower values of αAlMg and αAlCa (64). Thus, chemical weathering and heterogeneous source lithology significantly affected the alpha indices, especially αAlNa, αAlMg, αAlK, αAlRb, αAlCa, αAlSr and αAlBa of the soils.
Grain size distribution is one of the factors that affects chemical weathering (5, 9, 65). In this study, the geochemical compositions of the soils strongly correlated with the grain size distribution (Figure 8). Typically, coarse-grained soils are rich in SiO2 due to the abundance of quartz. In contrast, fine-grained soils have higher Al2O3 contents because of the enrichment of clay minerals; thus, the SiO2/Al2O3 ratio is a good proxy for grain size parameters (5, 65).
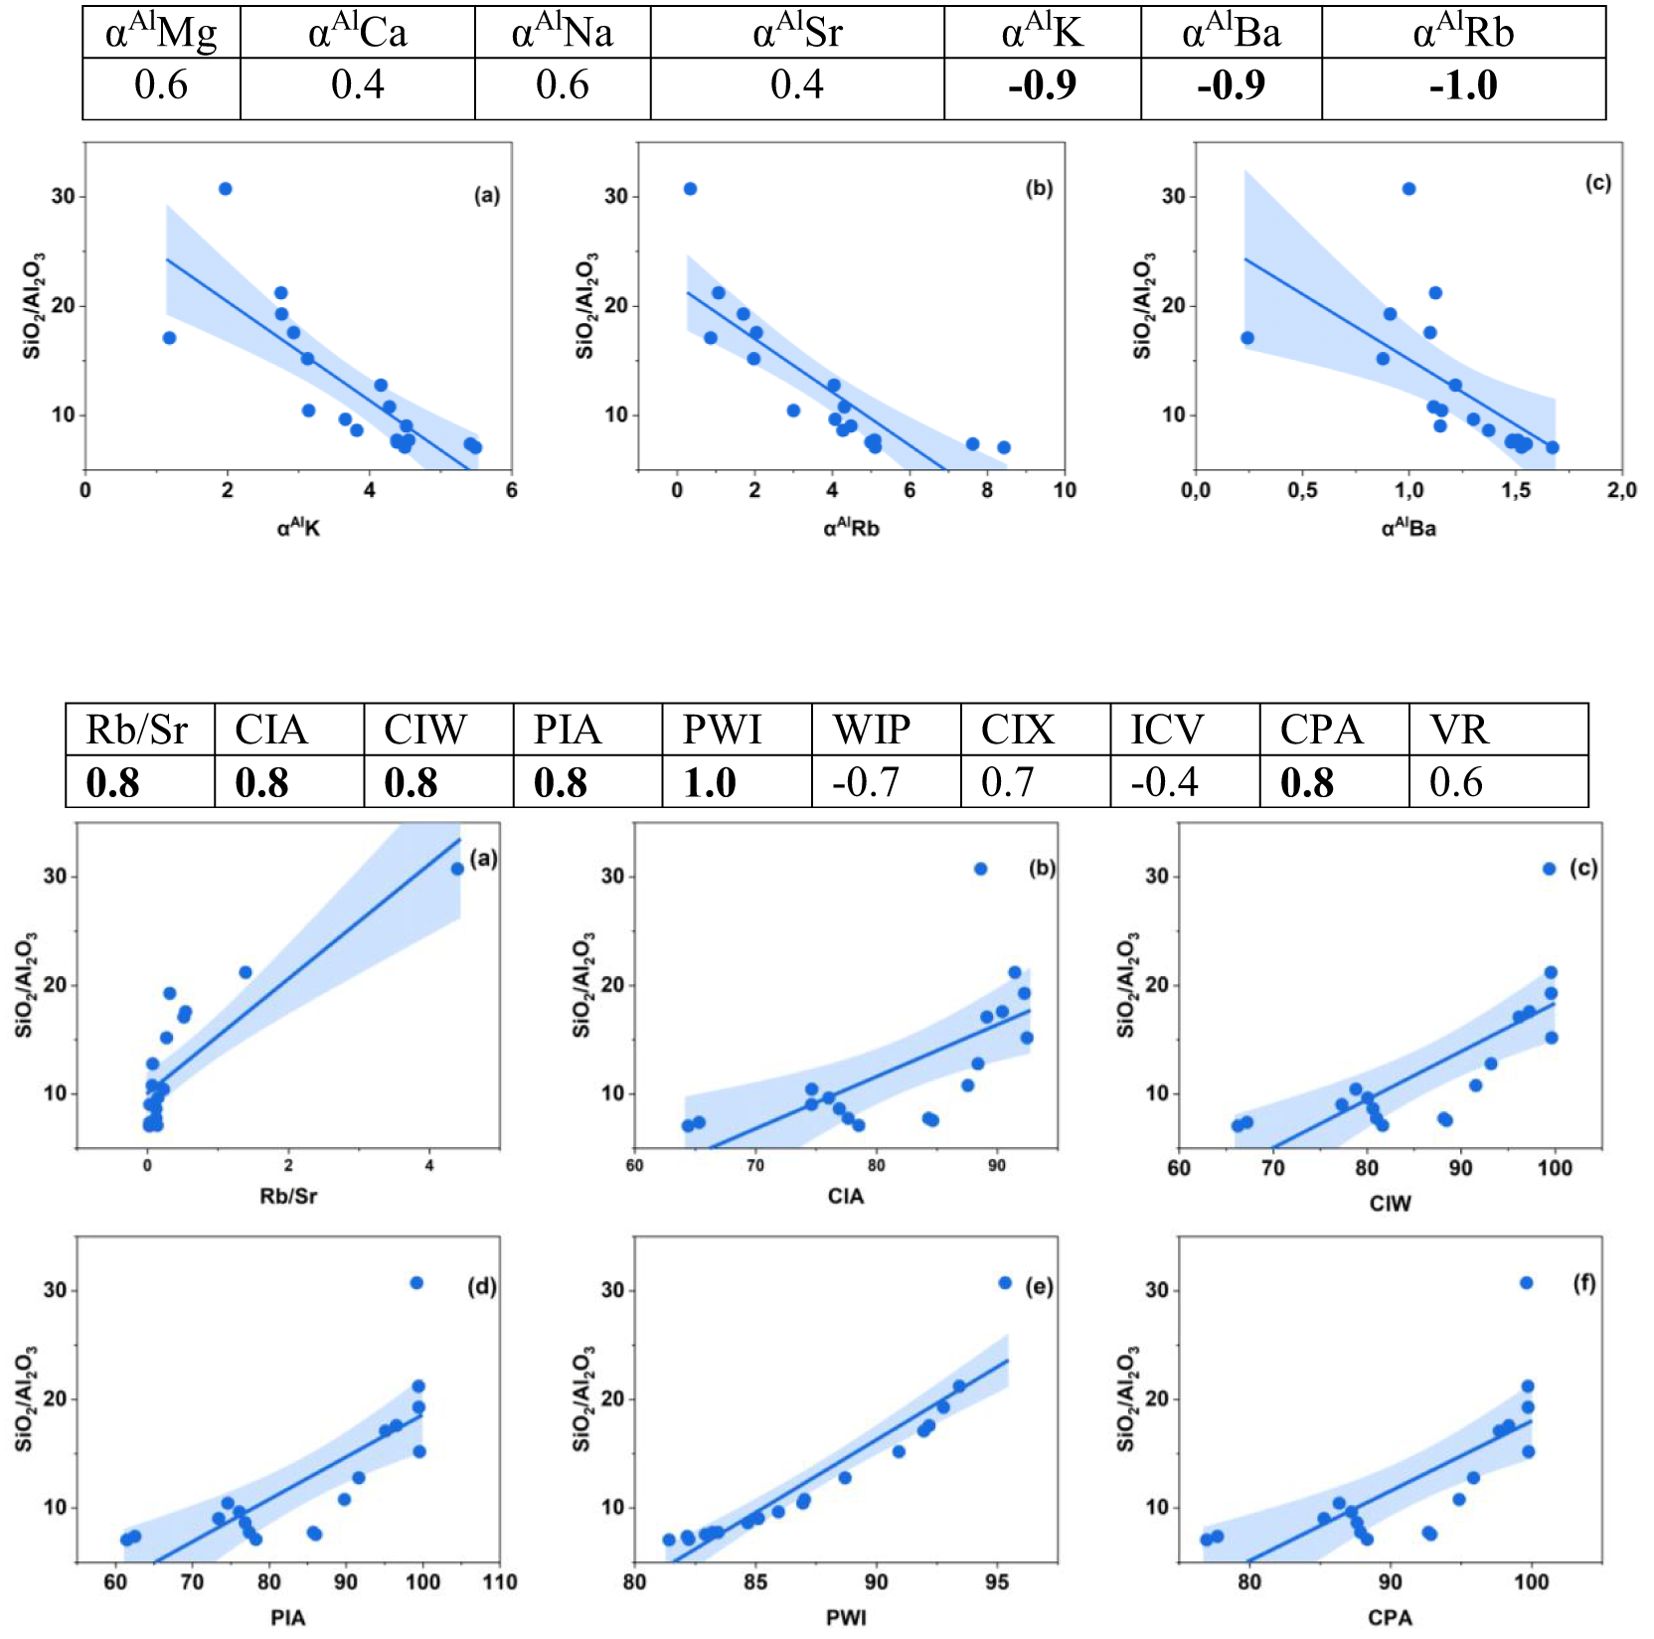
Figure 8. Correlation coefficients of chemical weathering indices and SiO2/Al2O3 ratios. Plots for the strongest (0.8-1.0) correlations are shown.
With the exception of αAlCa, αAlSr, ICV and VR, all the indices are strongly correlated with SiO2/Al2O3 (Figure 6), suggesting that they are highly influenced by grain size. Similarly, αAlK, αAlBa and αAlRb have very strong correlations with grain size (Figure 8). Therefore, significant differences in grain size properties may result in spatial variations in the chemical weathering indices of the soils. Therefore, grain size impacts chemical weathering indices, which suggests that chemical weathering indices of Vertisols cannot accurately reveal the intensity of chemical weathering in semiarid Botswana.
Nickel is of great interest in environmental science and geoecology because of its dual effects (toxicity and essentiality) on terrestrial biota. Typically, the safer limit of Ni is 1.5 μg g−1 in plants and 75–150 μg g−1 in soil (66), but in the studied area, Ni ranges from 11 to 69 mg kg-1, with an average of 40 mg kg-1 (Table 4). Therefore, Ni does not constitute any potential source of concern in the environment. The low level of Ni in the soils could be related to the absence of anthropogenic activities such as metal manufacturing waste, commercial waste, fallout, and sludge, coal fly ash, coal bottom ash, mining, and smelting in Serowe. Nickel functions in hydrogenase and the translocation of nitrogen during plant growth. In addition to safer limits, Ni toxicity may occur, leading to interveinal chlorosis in new leaves and brown and stunted roots (67).
There is a large disparity in the strontium (Sr) concentration in the soils. SP1 has a fairly tolerable concentration (70–174 mg kg-1) with a profile average of 103 mg kg-1, whereas SP2 and SP3 have considerable amounts of Sr (146–350) with a mean value of 209 mg kg-1, which is higher than the world’s average abundance (120 mg kg-1) in the soil (68). High Sr in soil environments can replace Ca2+ due to their chemical similarity (both Ca2+ and Sr2+ belong to the second group of the periodic table), leading to calcium deficiency in plants (69). The USEPA set the Regional Screening Levels (RSLs) for Sr in soil to 47,000 mg kg-1 and 420 mg L-1 for residential soil and groundwater protection, respectively (70). The Sr content of the studied soils did not exceed the screening levels and therefore may not constitute any toxicity issues in the soils. Beyond the stipulated limits, Sr toxicity is associated with a decrease in chlorophyll production (71).
In humans, high levels of Sr are linked to liver, brain, bone tissue, and tooth disorders, especially in children at the skeleton development stage (72).
With a range of 10–79 mg kg-1 and an average of 44 mg kg-1, the concentration of zinc in soils is below the world average of 64 mg kg-1 (73). A concentration of Zn above 300 mg kg-1 in the soil may pose a contamination problem (74). Like nickel and strontium, the Zn content in soils is within a permissible range and may not pose toxicity problems to terrestrial biota (75). However, Zn deficiency is the most widespread micronutrient deficiency in the world, with calcareous soils with high pH being more prone to Zn deficiency (76). Kabata-Pendias and Pendias (77), however, noted that the total Zn content is not a reliable index to show the capacity of soil to supply Zn for plant uptake, as a very small part of the total soil Zn (< 1 mg kg-1) is present in the soil solution that can be taken up by plants.
Chromium is abundant in ultramafic rocks and can be transported by surface runoff in soluble or precipitated forms (78). The Cr content in the soils we studied ranged from 70–485 mg kg-1, with an average of 192 mg kg-1, which is much higher than the world average of 54 mg kg-1 (79). The source of Cr in soils can be either natural or anthropogenic. In the case of this study, the high Cr concentration is most likely from the ultrabasic parent material, basalt, which is known to have high Cr. Therefore, further studies should be carried out to assess the possibility of Cr contamination in the soils given the relatively high values reported in this study. Some studies have reported that Cr at low concentrations may enhance plant development and constrain plant growth at relatively high concentrations; however, there is no confirmed evidence to corroborate its positive participation in plant metabolism (80). Chromium toxicity, however, can result in shunted plant growth, chlorosis in leaves, altered enzymatic activities, and decreased yields, especially in grains and cereals (81, 82).
Shrink-swell soils on a prominent landscape in central Botswana were characterized to quantify the chemical weathering stage, pedogenic process and depth distribution of the trace elements. The moderate to high degree of weathering of the soils containing montmorillonite implies that these soils still have good reserves of weatherable minerals, which are potential nutrient reserves for crop production in the area. The grain size distribution influenced the geochemical indices applied in this study, and some of the geochemical indices were highly correlated with each other, implying that all indices should be individually evaluated for their suitability rather than using all the indices at all times. The moderate geochemical affinity (two factors describe 60% variation) for the soil samples established via factor analysis of their geochemical and textural properties shows that these soils developed on uniform parent material. Clay and iron oxide illuviation and carbonate nodule formation are important pedogenic processes that influence the depth distribution and association of elements in the soils. The high concentration of chromium above permissible limits implies that intense weathering of basalt may result in enrichment and calls for bioavailability investigations to avert toxicity in plants, animals, and humans. The distinct properties including pedogenic carbonates and deep cracks of slickensides confirm that the Vertisols are polygenetic.
The original contributions presented in the study are included in the article/supplementary material. Further inquiries can be directed to the corresponding author.
PE: Conceptualization, Formal Analysis, Investigation, Resources, Software, Supervision, Validation, Visualization, Writing – original draft, Writing – review & editing. FE: Data curation, Writing – review & editing. IN: Conceptualization, Data curation, Investigation, Methodology, Writing – review & editing. AM: Methodology, Writing – review & editing. AS: Methodology, Validation, Writing – review & editing. CG: Data curation, Methodology, Software, Validation, Writing – review & editing. SN: Supervision, Validation, Writing – review & editing.
The author(s) declare that no financial support was received for the research and/or publication of this article.
The authors declare that the research was conducted in the absence of any commercial or financial relationships that could be construed as a potential conflict of interest.
The author(s) declare that no Generative AI was used in the creation of this manuscript.
All claims expressed in this article are solely those of the authors and do not necessarily represent those of their affiliated organizations, or those of the publisher, the editors and the reviewers. Any product that may be evaluated in this article, or claim that may be made by its manufacturer, is not guaranteed or endorsed by the publisher.
1. Gaur MK, Squires VR. Geographic extent and characteristics of the world’s arid zones and their peoples. In: Gaur M, Squires V, editors. Climate variability impacts on land use and livelihoods in drylands. Springer, Cham (2018). p. 3–20.
2. Bland WJ, Rolls D. Weathering: an introduction to the scientific principles. Routledge, London (2016).
3. Lopez BR, Bacilio M. Weathering and soil formation in hot, dry environments mediated by plant–microbe interactions. Biol Fertility Soils. (2020) 56:447–59. doi: 10.1007/s00374-020-01456-x
4. Matshameko Y, Okolo CC, Eze PN. Near-surface pedosediments of Takatokwane saline pan, southern Botswana: Properties, pedogenic processes, and inferences of environmental change. Geoderma Regional. (2023) 34:e00696. doi: 10.1016/j.geodrs.2023.e00696
5. Chen Q, Li Z, Dong S, Yu Q, Zhang C, Yu X. Applicability of chemical weathering indices of eolian sands from the deserts in northern China. Catena. (2021) 198:105032. doi: 10.1016/j.catena.2020.105032
6. Heidari A, Raheb A. Geochemical indices of soil development on basalt rocks in arid to subhumid climosequence of Central Iran. J Mountain Sci. (2020) 17:1652–69. doi: 10.1007/s11629-019-5862-4
7. Duzgoren-Aydin NS, Aydin A, Malpas J. Reassessment of chemical weathering indices: case study on pyroclastic rocks of Hong Kong. Eng geology. (2002) 63:99–119. doi: 10.1016/S0013-7952(01)00073-4
8. Garzanti E, Padoan M, Peruta L, Setti M, Najman Y, Villa IM. Weathering geochemistry and Sr-Nd fingerprints of equatorial upper Nile and Congo muds. Geochem. Geophys Geosyst. (2013) 14:292–316. doi: 10.1002/ggge.20060
9. Guo Y, Yang S, Ni S, Chao L, Ping Y, Wang Z. Revisiting the effects of hydrodynamic sorting and sedimentary recycling on chemical weathering indices. Geochim. Cosmochim. Acta. (2018) 227:48–63. doi: 10.1016/j.gca.2018.02.015
10. Pardo MT, Ristori G, D’acqui LP, Almendros G. An assessment of soil fertility and agronomic constraints in southern african savannas: A case study of the panbamatenga area, Botswana. South Afr Geographical J. (2003) 85:35–41. doi: 10.1080/03736245.2003.9713782
11. Eze PN. Soil development in the eastern hardveld. In: Eckardt FD, editor. Landscapes and landforms of Botswana. World geomorphological landscapes. Springer, Cham. (2022). p. 327–44.
12. Romanens R, Pellacani F, Mainga A, Fynn R, Vittoz P, Verrecchia EP. Soil diversity and major soil processes in the Kalahari basin, Botswana. Geoderma Regional. (2019) 19:e00236. doi: 10.1016/j.geodrs.2019.e00236
13. Plaza C, Zaccone C, Sawicka K, Méndez AM, Tarquis A, Gascó G, et al. Soil resources and element stocks in drylands to face global issues. Sci Rep. (2018) 8(1):1–8.
14. Madana MH. Improving Land Use Survey Method using High Resolution Satellite Imagery Improving Land Use Survey Method using High Resolution Satellite Imagery. Netherlands: ITC (2002).
15. Mweso E. Evaluation of the importance of soil moisture availability (as land quality) on selected rainfed crops in Serowe area, Botswana. M. Sc Thesis Int Institute Geo-information Sci Earth Observation. (2003).
16. Aynekulu E. Analysis of soil-vegetation interaction in relation to soil carbon sequestration (a case study in Serowe, Botswana). MSc thesis. Enschede, Netherlands: ITC Netherlands (2003).
17. Swedish Geological Company. Serowe groundwater resources evaluation project, final report. Lobatse, Botswana: Ministry of Mineral Resources and Water Affairs, Department of Geological Survey (1988). p. 286.
18. Denbow JR. Cenchrus ciliaris: an ecological indicator of Iron Age middens using aerial photography in eastern Botswana. South Afr J Sci. (1979) 75:405–8. doi: 10.10520/AJA00382353_5040
19. FAO. Guideline for soil description. 4th edition. Rome, Italy: Food and Agricultural Organization of the United Nation (2006).
20. Gavlak R, Horneck D, Miller R. Plant, soil and water reference methods for the Western Region. Madison, Wisconsin, USA: Western Regional Extension Publication (WREP (2005). p. 125. Available at: http://www.naptprogram.org/files/napt/western-states-method-manual-2005.pdf. WERA-103 Technical Committee (Accessed November 06, 2024).
21. Blake GR, Hartge KH. Bulk density. In: Klute, editor. Methods of soilAnalysis, part I physical and mineralogical methods, 2nd Edition. ASA-SSSA, Madison (1986). p. 363–75.
22. Moore DM, Reynolds RC Jr. X-ray diffraction and the identification and analysis of clay minerals. 2nd ed. Oxford, New York: Oxford University Press (1997). 378 pp.
23. Nesbitt HW, Young GM. Prediction of some weathering trends of plutonic and volcanic rocks based on thermodynamic and kinetic considerations. Geochimica Cosmochimica Acta. (1984) 48(7):1523–34.
24. Harnois L. The CIW index: A new chemical index of weathering. Sedimentary Geology. (1988) 55:319–22. doi: 10.1016/0037-0738(88)90137-6
26. Ruxton BP. Measures of the degree of chemical weathering of rocks. J Geology. (1968) 76:518–27. doi: 10.1086/627357
27. Souri B, Watanabe M, Sakagami K. Contribution of Parker and Product indexes to evaluate weathering condition of Yellow Brown Forest soils in Japan. Geoderma. (2006) 130(3-4):346–55.
28. Fedo CM, Nesbitt HW, Young GM. Unravelling the effects of potassium metasomatism in sedimentary rocks and paleosols, with implications for paleoweathering conditions and provenance. Geology. (1995) 23(10):921–4.
29. Jayawardena UDS, Izawa E. A new chemical index of weathering for metamorphic silicate rocks in tropical regions: A study from Sri Lanka. Eng Geology. (1994) 36(3-4):303–10.
30. Cox R, Lowe DR, Cullers RL. The influence of sediment recycling and basement composition on evolution of mudrock chemistry in the southwestern United States. Geochimica Cosmochimica Acta. (1995) 59(14):2919–40.
31. Garzanti E, Padoan M, Setti M, López-Galindo A, Villa IM. Provenance versus weathering control on the composition of tropical river mud (southern Africa). Chem Geology. (2014) 366:61–74.
32. Roaldset E. Mineralogy and geochemistry of Quaternary clays in the Numedal area, southern Norway. Norsk Geologisk Tidsskrift. (1972) 52:335–69.
33. Buggle B, Glaser B, Hambach U, Gerasimenko N, Marković S. An evaluation of geochemical weathering indices in loess-paleosol studies. Quaternary Int. (2011) 240(1-2):12–21.
35. Price JR, Velbel MA. Chemical weathering indices applied to weathering profiles developed on heterogeneous felsic metamorphic parent rocks. Chem Geol. (2003) 202:397–416. doi: 10.1016/j.chemgeo.2002.11.001
36. Sheldon ND, Tabor NJ. Quantitative palaeoenvironmental and palaeoclimatic reconstruction using palaeosols. Earth-science Rev. (2009) 95:1–52. doi: 10.1016/j.earscirev.2009.03.004
38. Munsell Color. Munsell soil color charts 2000 Revised washable edition. Michigan: Munsell Color Company (2000).
39. Durana P, Kliestikova J, Kovacova M. The quality of brand products: expected attributes vs. perceived reality. Econo Cult. (2019) 16:98–107. doi: 10.2478/jec-2019-0011
40. Shrestha N. Factor analysis as a tool for survey analysis. Am J Appl Mathematics Stat. (2021) 9(1):4–11.
41. Nkonga I. Mineral weathering, pedogenesis and characterization of expansive soils from Serowe, Central Botswana. MSc thesis. Madison, Wisconsin, USA: Botswana International University of Science and Technology (2022). 70 pp.
42. Valtera M, Šamonil P, Svoboda M, Janda P. Effects of topography and forest stand dynamics on soil morphology in three natural Picea abies mountain forests. Plant Soil. (2015) 392:57–69. doi: 10.1007/s11104-015-2442-4
43. Conforti M, Longobucco T, Scarciglia F, Niceforo G, Matteucci G, Buttafuoco G. Interplay between soil formation and geomorphic processes along a soil catena in a Mediterranean mountain landscape: an integrated pedological and geophysical approach. Environ Earth Sci. (2020) 79:59. doi: 10.1007/s12665-019-8802-2
44. Eze PN, Meadows ME. Texture contrast profile with stonelayer in the Cape Peninsula, South Africa: Autochthony and polygenesis. Catena. (2014) 118:103–14. doi: 10.1016/j.catena.2014.01.014
45. Eze PN, Knight J, Evans M. Tracing recent environmental changes and pedogenesis using geochemistry and micromorphology of alluvial soils, Sabie-Sand River Basin, South Africa. Geomorphology. (2016) 268:312–21. doi: 10.1016/j.geomorph.2016.06.023
46. Bonfatti BR, Demattê JA, Marques KP, Poppiel RR, Rizzo R, Mendes WDS, et al. Digital mapping of soil parent material in a heterogeneous tropical area. Geomorphology. (2020) 367:107305. doi: 10.1016/j.geomorph.2020.107305
47. Eze PN, Meadows ME. Geochemistry and palaeoclimatic reconstruction of a palaeosol sequence at Langebaanweg, South Africa. Quaternary Int. (2015) 376:75–83. doi: 10.1016/j.quaint.2013.09.048
48. Matshameko Y, Kebonye NM, Eze PN. Ethnopedological knowledge and scientific assessment of earthenware pottery-making soils of southern Botswana for natural resource management. Geoderma Regional. (2022) 31:e00580. doi: 10.1016/j.geodrs.2022.e00580
49. Ebouel FJD, Betsi TB, Eze PN. Soil inorganic carbon: A review of global research trends, analytical techniques, ecosystem functions and critical knowledge gaps. Catena. (2024) 242:108112. doi: 10.1016/j.catena.2024.108112
50. Johannes A, Matter A, Schulin R, Weisskopf P, Baveye PC, Boivin P. Optimal organic carbon values for soil structure quality of arable soils. Does clay content matter? Geoderma. (2015) 302:14–21. doi: 10.1016/j.geoderma.2017.04.021
51. Okolo CC, Gebresamuel G, Zenebe A, Haile M, Eze PN. Accumulation of organic carbon in various soil aggregate sizes under different land use systems in a semiarid environment. Agriculture Ecosyst Environ. (2020) 297:106924. doi: 10.1016/j.agee.2020.106924
52. Okolo CC, Gebresamuel G, Zenebe A, Haile M, Orji JE, Okebalama CB, et al. Soil organic carbon, total nitrogen stocks and CO2 emissions in top-and subsoils with contrasting management regimes in semiarid environments. Sci Rep. (2023) 13:1117. doi: 10.1038/s41598-023-28276-x
53. Chorover J, Amistadi MK, Chadwick OA. Surface charge evolution of mineral-organic complexes during pedogenesis in Hawaiian basalt. Geochimica Cosmochimica Acta. (2004) 68:4859–76. doi: 10.1016/j.gca.2004.06.005
54. Smith JL, Doran JW. Measurement and use of pH and electrical conductivity for soil quality analysis. Methods Assessing Soil Qual. (1997) 49:169–85.
55. Landon JR. Booker Tropical Soil Manual: A handbook of soil survey and agricultural and evaluation in the tropics and subtropics. In: Booker tate essex. Longman Scientific and Technical Publishers Harlow, UK (1991).
56. Carbonell V, Merbold L, Díaz-Pinés E, Dowling TP, Butterbach-Bahl K. Nitrogen cycling in pastoral livestock systems in Sub-Saharan Africa: knowns and unknowns. Ecol Appl. (2021) 31:e02368. doi: 10.1002/eap.v31.6
57. Prakongkep N, Suddhiprakarn A, Kheoruenromne I, Smirk M, Gilkes RJ. The geochemistry of Thai paddy soils. Geoderma. (2008) 144:310–24. doi: 10.1016/j.geoderma.2007.11.025
58. Chittamart N, Suddhiprakarn A, Kheoruenromne I, Gilkes RJ. The pedo-geochemistry of Vertisols under tropical savanna climate. Geoderma. (2010) 159:304–16. doi: 10.1016/j.geoderma.2010.08.004
59. Palumbo B, Angelone M, Bellanca A, Dazzi C, Hauser S, Neri R, et al. Influence of inheritance and pedogenesis on heavy metal distribution in soils of Sicily, Italy. Geoderma. (2000) 95:247–66. doi: 10.1016/S0016-7061(99)00090-7
60. Gasparatos D, Tarenidis D, Haidouti C, Oikonomou G. Microscopic structure of soil Fe-Mn nodules: environmental implication. Environ Chem Lett. (2005) 2:175–8. doi: 10.1007/s10311-004-0092-5
61. Mangold N, Dehouck E, Fedo C, Forni O, Achilles C. Chemical alteration of fine-grained sedimentary rocks at Gale crater. Icarus. (2019) 321:619–31. doi: 10.1016/j.icarus.2018.11.004
62. Perri F. Chemical weathering of crystalline rocks in contrasting climatic conditions using geochemical proxies: an overview. Palaeogeog Palaeoclim Palaeoeco. (2020) 556:109873. doi: 10.1016/j.palaeo.2020.109873
63. Zhao W, Liu L, Chen J, Ji J. Geochemical characterization of major elements in desert sediments and implications for the Chinese loess source. Sci China-Earth Sci. (2019) 62:1428–40.
64. Dinis P, Garzanti E, Vermeesch P, Huvi J. Climatic zonation and weathering control on sediment composition (Angola). Chem Geology. (2017) 467:110–21.
65. Hatano N, Yoshida K, Adachi Y, Sasao E. Intense chemical weathering in southwest Japan during the Pliocene warm period. J Asian Earth Sci. (2019) 184:103971. doi: 10.1016/j.jseaes.2019.103971
66. Kumar A, Jigyasu DK, Subrahmanyam G, Mondal R, Shabnam AA, Cabral-Pinto MMS, et al. Nickel in terrestrial biota: Comprehensive review on contamination, toxicity, tolerance and its remediation approaches. Chemosphere. (2021) 275:129996. doi: 10.1016/j.chemosphere.2021.129996
67. Khan ZI, Ahmad K, Ahmad T, Zafar A, Alrefaei AF, Ashfaq A, et al. Evaluation of nickel toxicity and potential health implications of agriculturally diversely irrigated wheat crop varieties. Arab J Chem. (2023) 16:104934. doi: 10.1016/j.arabjc.2023.104934
69. Burger A, Lichtscheidl I. Strontium in the environment: Review about reactions of plants towards stable and radioactive strontium isotopes. Sci Total Environ. (2019) 653:1458–11512. doi: 10.1016/j.scitotenv.2018.10.312
70. USEPA. Metals Cooperative Research and Development Agreement (CRADA) phase I report: Development of an overarching bioavailability modelling approach to support US EPA’s Aquatic Life Water Quality Criteria for Metals (EPA-822-R-22-001). Washington D.C., USA: EPA Office of Water (2021).
71. Srikhumsuk P, Peshkur T, Renshaw JC, Knapp CW. Toxicological response and bioaccumulation of strontium in Festu-carubra L. (red fescue) and Trifoliumpratense L. (red clover) in contaminated soil microcosms. Environ Sys Res. (2023) 12:15. doi: 10.1186/s40068-023-00297-5
72. Ding D, Kong L, Jiang D, Wei J, Cao S, Li X, et al. Source apportionment and health risk assessment of chemicals of concern in soil, water and sediment at a large strontium slag pile area. J Environ Manage. (2022) 304:114228. doi: 10.1016/j.jenvman.2021.114228
73. Kabata-Pendias A, Pendias H. Trace elements in soils and plants. 3rd edn. Boca Raton Florida: CRC Press Inc (2001). p. 331.
74. Kiekens L. Zinc. In: Alloway BJ, editor. Heavy metals in soils, 2nd ed. Blackie Academic and Professional, London (1995). p. 284–305.
75. Udeigwe TK, Eichmann M, Eze PN, Teboh JM, Zolue GM, Umeugochukwu OP. Plant-available zinc fixation kinetics in semiarid alkaline soils of the Southern High Plains. Arch Agron Soil Sci. (2017) 63:553–64. doi: 10.1080/03650340.2016.1227068
76. Noulas C, Tziouvalekas M, Karyotis T. Zinc in soils, water and food crops. J Trace Elements Med Biol. (2018) 49:252–60. doi: 10.1016/j.jtemb.2018.02.009
77. Abata-Pendias A, Pendias H. Trace Elements in Soils and Plants. 2nd Edition. Boca Raton, Florida, United States: CRC Press (1992).
78. Havryliuk O, Hovorukha V, Bida I, Danko Y, Gladka G, Zakutevsky O, et al. Bioremediation of copper-and-chromium contaminated soils using Agrostiscapillaris L, Festucapratensis Huds, and Poapratensis L. Mixture Lawn Grasses Land. (2022) 11:623. doi: 10.3390/land11050623
79. Alloway BJ. Bioavailability of elements in soil. In: Selinus O, editor. Essential of medical geology, impacts of the natural environment on public health. Amsterdam, Netherlands: Elsevier Academic Press Amsterdam (2005). p. 347–72.
80. Ao M, Chen X, Deng T, Sun S, Tang Y, Morel JL, et al. Chromium biogeochemical behavior in soil-plant systems and remediation strategies: a critical review. J Hazard Mat. (2022) 424:127233. doi: 10.1016/j.jhazmat.2021.127233
81. Zulfiqar U, Haider FU, Ahmad M, Hussain S, Maqsood MF, Ishfaq M, et al. Chromium toxicity, speciation, and remediation strategies in soil-plant interface: A critical review. Front Plant Sci. (2023) 13:1081624. doi: 10.3389/fpls.2022.1081624
Keywords: Botswana, pedogenesis, Vertisols, micronutrients, chromium
Citation: Eze PN, Ebouel FJD, Nkonga I, Musiol A, Schleicher AM, Günter C and Norra S (2025) Weathering intensity and trace elements (Ni, Sr, Zn, and Cr) distribution in Vertisols developed on basalt in a semiarid environment: agronomic implications. Front. Soil Sci. 5:1530962. doi: 10.3389/fsoil.2025.1530962
Received: 19 November 2024; Accepted: 27 February 2025;
Published: 19 March 2025.
Edited by:
Abhik Patra, Banaras Hindu University, IndiaReviewed by:
Fujun Sun, Shenyang Agricultural University, ChinaCopyright © 2025 Eze, Ebouel, Nkonga, Musiol, Schleicher, Günter and Norra. This is an open-access article distributed under the terms of the Creative Commons Attribution License (CC BY). The use, distribution or reproduction in other forums is permitted, provided the original author(s) and the copyright owner(s) are credited and that the original publication in this journal is cited, in accordance with accepted academic practice. No use, distribution or reproduction is permitted which does not comply with these terms.
*Correspondence: Peter N. Eze, cGV0ZXIuZXplQHVuaS1wb3RzZGFtLmRl; ZXplcEBiaXVzdC5hYy5idw==
Disclaimer: All claims expressed in this article are solely those of the authors and do not necessarily represent those of their affiliated organizations, or those of the publisher, the editors and the reviewers. Any product that may be evaluated in this article or claim that may be made by its manufacturer is not guaranteed or endorsed by the publisher.
Research integrity at Frontiers
Learn more about the work of our research integrity team to safeguard the quality of each article we publish.