
94% of researchers rate our articles as excellent or good
Learn more about the work of our research integrity team to safeguard the quality of each article we publish.
Find out more
ORIGINAL RESEARCH article
Front. Soil Sci., 01 April 2025
Sec. Plant-Soil Interactions
Volume 5 - 2025 | https://doi.org/10.3389/fsoil.2025.1499491
This article is part of the Research TopicMulti-Omics Approach To Studying The Impacts Of Cover Crops On Soil-Plant-Microbiome Interactions In Crop Production SystemsView all articles
 John P. Brooks1*
 Martin J. Wubben1
 Renotta K. Smith1
 Josh Waldbieser1
 Sathishkumar Samiappan2
 Purushothaman Ramamoorthy2
 Raju Bheemanahalli3
Introduction: Predicting, or correlating, soil microbiome metrics with above ground phenotypic plant measurements would enable rapid diagnosis of soil microbiome imbalances. Rapid plant measurements through remote sensing are a leading innovation in agriculture and have reduced the need for labor-intensive plant and soil measurements. In the current study we utilized cotton (Gossypium hirsutum) as a plant model whereby stress was induced by drought and root-knot nematode (RKN; Meloidogyne incognita) infection to induce a change in the soil microbiome which would be reflected as a plant phenotypic response.
Methods: The experiment was a randomized complete block design with two cotton genotypes (RKN-susceptible or RKN-resistant) and four stress combinations. Rootzone samples were collected upon plant termination and quantified for five soil health genes: 16S rRNA, 18S rRNA, ureC, phoA, and cbbLR. Plant physiology, biomass, and remote sensing hyperspectral readings were previously reported.
Results and discussion: Overall, RKN infection and plant genotype treatments had little effect on genes. Interestingly, drought stress increased most gene abundances, while plant physiological and biomass measurements decreased, indicating microbiome response to plant stress. Hyperspectral reflectance, through machine learning, accurately predicted the presence of drought stress with an area under the receiver operating characteristic curve value of 0.864. Furthermore, the readings were able to predict the abundance values for all genes except 18S rRNA within one standard deviation of ground truth levels. This study demonstrated that there are key plant characteristics that are registered via hyperspectral wavelengths which can be used to accurately predict soil health gene abundance. While the use of hyperspectral readings and soil microbiome status to inform plant health and vice versa are still in their infancy, the current study provides us with future directions towards this end.
Linking biological soil health to plant measurements to potentially diagnose or predict the effect of abiotic or biotic stresses is one goal associated with remote sensing and large-scale agriculture (1). Traditionally, identifying problems associated with the large-scale production of crops such as cotton, corn, or soybean can be conducted by a trained field technician/extension agent or grower, but this can be limited to hands-on contact with the plants or a more detailed sampling protocol to ascertain the problem. Typical problems, such as drought-stress, salt-stress, or nutrient deficiencies may be more readily identified; however, issues or deficiencies within the soil biology can be more difficult to determine.
Microorganisms and the broader soil microbiome comprise a minor component of overall soil volume (<1% v/v); however, all major soil activities are directly or indirectly a result of the soil microbiome. Furthermore, microorganisms comprise a major portion of the surface biomass and are responsible for biogeochemical processes, such as nutrient and carbon cycling, nitrogen fixation, denitrification, and metal detoxification (2). While these biochemical processes are widely recognized, measuring these microbial processes is wrought with caveats. For example, quantifying enzymes may represent idealized assay conditions (3); meanwhile the use of cultivation-dependent approaches only captures approximately <1% of the microbial population and are often focused on bacteria/fungi which are easily cultured but not necessarily key members of the soil microbiome (4). While the use of cultivation-independent (e.g., DNA-based) approaches are not without their drawbacks (5), the potential to target a multitude of genes and quantify the microbiome potential (e.g., DNA) can be useful. The use of key taxonomic ratios as a metric for soil biological quality has been reported in previous studies and reviews (6, 7), though the abundance of 16S and 18S rRNA has also been utilized (8). Meanwhile, the assay of specific genes such as phoA (phosphatase A), ureC (urease C), and cbbLR (red-like ribulose-1, 5-biphosphate carboxylase) represent genes key in biogeochemical macronutrient cycling such as P, N, and C processes, respectively (9–13). Additionally, these processes have a direct and/or indirect effect on the aboveground plant biomass by providing plant-available macro- and micro-nutrients liberated from organic matter or fixed through autotrophic processes. Soil fungi provide key genes as well, and generally represent the largest percentage of biomass. Key fungal members, such as arbuscular mycorrhizal fungi, provide glomalin proteins which protect plants from drought and nutrient stress by stabilizing soil aggregates, thus promoting water and nutrient infiltration and scavenging (14).
Fortunately, the soil microbiome is relatively stable, with changes that occur on temporal timespans (e.g., seasonal, climatic, or anthropogenic management). Often, the relative fluctuations expected throughout a growing season are plant-dependent or weather-related (15–17), but these can be considered temporary occupation of important ecological niches, as one microbial group or population makes way for the functions of another group or population. However, larger, or more permanent shifts may be expected given climatic change or large-scale agronomic management such as monocropping (18), cover cropping (19), or catastrophic events, such as strip-mining or fire (16, 20). Capturing these subtle shifts are key to understanding the influence of biotic and abiotic stresses on the soil microbiome, particularly as it affects plant physiology and ultimately yield.
Plant health status is often expressed phenotypically by leaf coloration, senescence, and spotting, or stunted growth and premature flowering (21). While these presentations are not necessarily tied to the soil microbiome, there is evidence to suggest that while these abiotic and biotic stresses are affecting the plant, there exists constant communication between the plant and the soil microbiome through phytohormones, root exudates, nutrients, and metabolites (17, 22, 23). This in turn may cause a subtle change in the soil microbiome. The use of hyperspectral imaging can help ameliorate these issues before they become a problem (24). Hyperspectral imaging encompasses approximately 250 – 2500 nm, thus identifying critical spectral bands has yet to be realized. Recently, Ramamoorthy et al. (24) sought to accomplish this with respect to plant physiological status. Leaf spectral properties comprise both visible and non-visible spectra, which lends itself to remote sensing and hyperspectral imaging (25). When combined with machine learning and deep learning techniques, hyperspectral data have been used to monitor several crop physiological effects, including nutrient quantities, disease and contaminant detection, and drought stress (26, 27). Using these bands to predict the changes in abundance of key soil microbial genetic elements is a logical next step as suggested by Hamada et al. (1).
Cotton (Gossypium hirsutum) infection with the southern root-knot nematode (RKN), Meloidogyne incognita, causes estimated losses in the United States of up to $168 million dollars based off 2022 losses of ~387,000 bales of cotton (28). The lifecycle of RKN has been covered extensively (29); however, its subsequent effect on the phenotypic presentation of cotton plants and its recognition via remote sensing is in its infancy (24). Furthermore, tying plant phenotypic presentation with effects on the soil microbiome remains an untapped area of research (1). Thus, this study aims to understand the effect of these plant stresses on the soil microbiome, while simultaneously using the plant as an indicator of the stress presentation via traditional plant physiological and remote sensing measurements. Therefore, to accomplish this, the objectives of the present study were to: 1) relate soil health genes to biological and drought stress; and 2) relate soil health genes to above ground plant measurements using leaf physiological and remote-sensing hyperspectral measurements.
The experimental design was thoroughly described in Ramamoorthy et al. (24). Briefly, the greenhouse experiment was conducted in 2021 utilizing a randomized complete block design, 10x2x4 (10 replications, 2 cotton genotypes, and 4 stress treatment combinations) pot (~8L vol) combinations. Two cotton genotypes, denoting cotton resistance to RKN, were used (RKN susceptible and RKN resistant). Stress variables included: Irrigation (Full water requirement (Full) and Drought (Half)); and Inoculation (RKN inoculation (Inoculated) and No RKN inoculation (Control)). Thus, the four stress treatment combinations comprised Irrigation and Inoculation stressors: 1) no stress (Full, Control); 2) drought stress (Half, Control); 3) RKN infection stress (Full, Inoculated); and 4) full stress (Half, Inoculated). Meloidogyne incognita race 3 was used for RKN infection. Approximately 100,000 RKN eggs were inoculated per inoculated pot. Greenhouse conditions were maintained as described in Ramamoorthy et al. (24). Successful RKN infection of susceptible plants was confirmed at the end of the experiment by the presence of large RKN-induced galls throughout the root system.
Physiological data collection and remote sensing leaf hyperspectral reflectance measurements were described in detail in Ramamoorthy et al. (24). Chlorophyll content and nitrogen balance index was measured with a handheld Dualex Force A DX16641 (Dualex, Paris, France). Stomatal conductance and transpiration were measured with a LI-600 porometer (Li-COR Biosciences, Lincoln, NE, USA). Root and shoot biomass was measured after drying at 75°C for three days and measuring dry weights. Leaf hyperspectral reflectance was measured with a PSR+ 3500 spectroradiometer (Spectral Evolution, Haverhill, MA, USA). Physiological data was collected at 92 days post planting, with measurements taken between 10:00 and 12:00. Harvested portions were collected on the final day of the experiment. Hyperspectral readings were made utilizing a PSR + 3500 spectroradiometer (Spectral Evolution, Haverhill, MA, USA) on the final day of the experiment. Briefly, a leaf probe was clipped onto the leaf and hyperspectral readings were measured 5 times (each measurement equals 10 readings) between 350-2500 nm with a resolution ranging from 2.8 to 6 nm.
Rhizosphere soil was collected on the final day of the experiment (92 d post seed). Briefly, roots were carefully removed from the pots and any bulk soil not immediately attached to the roots was removed by gently shaking the roots and discarded. Soil attached to the roots was gently removed by aseptically suspending the roots in a 1-liter plastic bag and shaken to remove any attached rhizosphere soil, equal to approximately 5-10 moist g (30). DNA was extracted from a 250 mg aliquot of soil using the MPBio Fastprep Soil DNA extraction kit (MP Biomedicals, CA, USA) following the manufacturer’s recommended protocol. An MPBio Fastprep-24 grinder and lysis system were used to carry out all bead-beating steps. Extracted DNA was quantified using a Qubit 4 Fluorometer (Thermo Fisher Scientific, CA, USA) using the recommended manufacturer’s protocol.
Following DNA extraction, quantitative polymerase chain reaction (qPCR) for five genes was conducted according to Brooks et al. (15) and Adeli et al. (31). Briefly, 10-fold dilution aliquots of extracted DNA were prepared prior to qPCR analysis to avoid inhibition due to DNA extraction impurities. The 16S rRNA (32), 18S rRNA (33), ureC (34), phoA (10), and cbbLR (35) genes were targeted. These genes were selected based on prior research indicating that these genes responded well to agronomic changes as indicators of soil health and the microbiome. The 16S and 18S rRNA genes each represent total bacterial and fungal populations, respectively, while ureC, phoA, and cbbLR genes represent key genes associated with the N, P, and C biogeochemical cycles. All qPCR assays were conducted on an Applied Biosystems StepOne Plus real-time PCR system utilizing SYBR green chemistry (Applied Biosystems, CA, USA). All reactions were conducted in technical duplication following the expected positive confirmation criteria: 1) both duplicate reactions cycle threshold (Ct) had to be within 1 standard deviation of each other; 2) Ct < 37; and 3) confirmed melt-curve analysis peak temperature. Qualitative assurance and control were conducted using positive and negative controls comprised of sequence confirmed G blocks (IDTDNA, IA, USA) or positive confirmed bacterial isolate DNA, and negative PCR quality water, respectively. Inhibition controls were included with all qPCR plates, whereby three randomly selected samples were spiked with known quantities of DNA and checked for recovery of +/-25% expected results. Efficiencies were expected >90% across the standard curve. Deviations from these QA/QC criteria resulted in repeat assays. All results were reported as genomic unit per g (GU g-1).
Prior to statistical analysis, all qPCR data was log10 transformed, and geometric means were calculated to achieve normality. R ver. 4.3.1 and R Studio (2023.06.1 build 524) were used for statistical analysis. R packages lme4, lmerTest, and ggplot2 were used for statistical analyses and figures. Differences in response variables, 16S rRNA, 18S rRNA, ureC, phoA, and cbbLR, were analyzed for influence of treatment (irrigation, inoculation, and cotton genotype) using the Linearized Mixed model (lmer) function with replication as a random block (response variable~irrigation+inoculation*genotype+(1|block)). Each model was checked for goodness of fit (AIC). The influence of stress treatments on hyperspectral and plant physiological and biomass data was analyzed and presented previously (24). Hyperspectral and plant physiological and biomass data was utilized here to correlate to gene abundance levels utilizing Pearson correlation via the (cor.test) function.
Hyperspectral readings from 250-2500 nm per treatment pot were previously reported in Ramamoorthy et al. (24). In the current study we attempted to correlate those findings with the rootzone biological abundance levels utilizing a simple Pearson correlation and reduced data. To do this, we parsed and averaged datapoints (n=5) to biologically meaningful wavelengths (i.e., 350-2500; 560, 668, 840, and 1450 nm) which covered the entire hyperspectral measurable range, as well as the center wavelength (λ) for the green, red, near infrared, and red edge λ, respectively.
Machine learning classification and regression models were developed within the Tidymodels framework in R to predict the presence of drought stress and log10 qPCR data using only the hyperspectral data. The dataset was split into a training set (80%) and testing set (20%), and the wavelength reflectance values were normalized with respect to that wavelength. Lasso, elastic net, and random forest models were built using 10-fold cross validation for hyperparameter tuning within the training set. Classification models predicted the drought stress treatment, and regression models predicted the transformed 16S rRNA, 18S rRNA, phoA, cbbLR, and ureC gene abundance levels. The area under the receiver operating characteristic curve (ROC AUC) and F1 scores were calculated for the classification models, and root mean square error (RMSE) was calculated for each regression model. The model specific hyperparameters were: the lasso models’ L1 regularization penalties, the elastic net models’ regularization amounts and L1/L2 mixtures, and the random forest models’ number of wavelengths sampled at each split, the number of trees in the ensemble, and the minimum number of data points in a node for it to be split. The possible values tested for each hyperparameter were automatically generated using Tidymodels’s dials package, and the number of possible values was set so 64 hyperparameter combinations for each model type could be trained. Additionally, two versions of each model were built: one using the entire set of wavelengths (350 – 2500 nm) and another using only wavelengths with an absolute Pearson correlation of less than 0.95. Since the reflectance values at each wavelength were very strongly correlated with one another, this correlation filter reduced the number of wavelengths considered from 2151 to 6. After each model’s locally optimal hyperparameter configuration was discovered, the model was finalized and evaluated on the testing set.
Overall, rootzone soil health genes (16S rRNA, 18S rRNA, phoA, cbbLR, and ureC) were similar across treatments, but there were obvious effects of treatment, particularly with drought conditions. Soil health genes ranged from: 8.71x10⁸ - 2.99x10¹⁰ (16S rRNA); 5.53x10⁵ – 1.71x10⁷ (18S rRNA); 9.65x10²–7.80x10⁴ (phoA); 9.87x10⁴-2.15x10⁶ (ureC); and 2.71x10⁷-1.91x10⁹ (cbbLR) (Table 1).
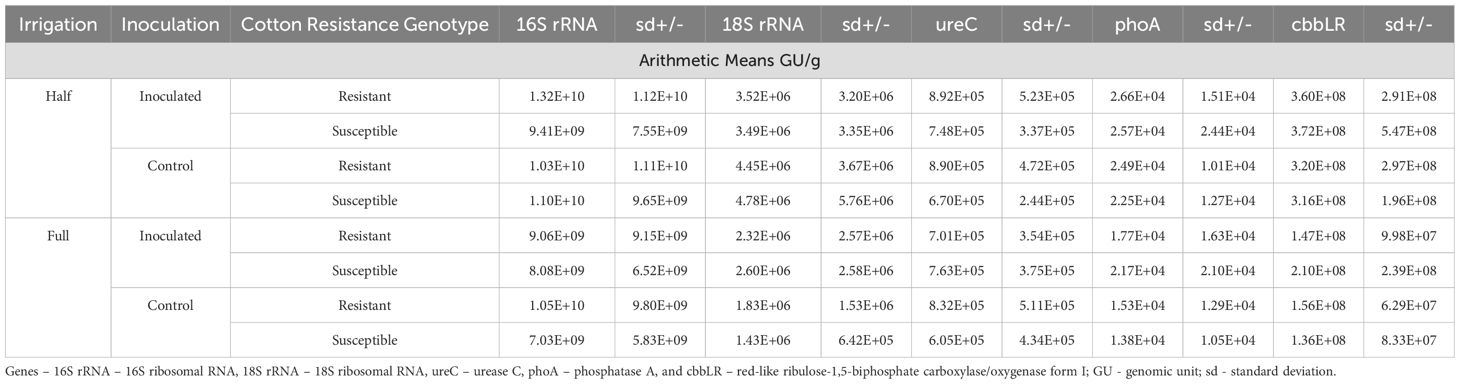
Table 1. Soil health gene abundance levels (GU/g) by stress treatment collected from rhizosphere soil.
A linear mixed model was chosen to determine the effects of stressors on the response variables (Table 2). The linear mixed model estimated that effects were mostly related to irrigation. For example, 16S rRNA was slightly affected by irrigation level (t(1,70)=1.722, p=0.08), whereby the drought irrigation predicted an increase in 16S rRNA values over the full irrigation scheme. Fungal gene abundance (18S rRNA) was significantly predicted to increase by the drought irrigation scheme (t(1,70)=3.888, p=0.0002) (Figure 1).
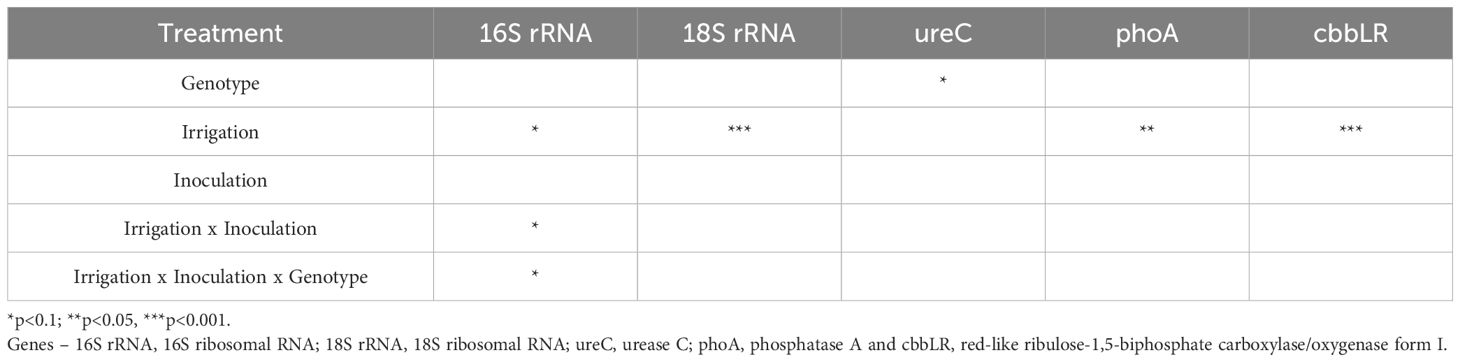
Table 2. Statistical analysis of linear mixed model (lmer Program R) by treatment.
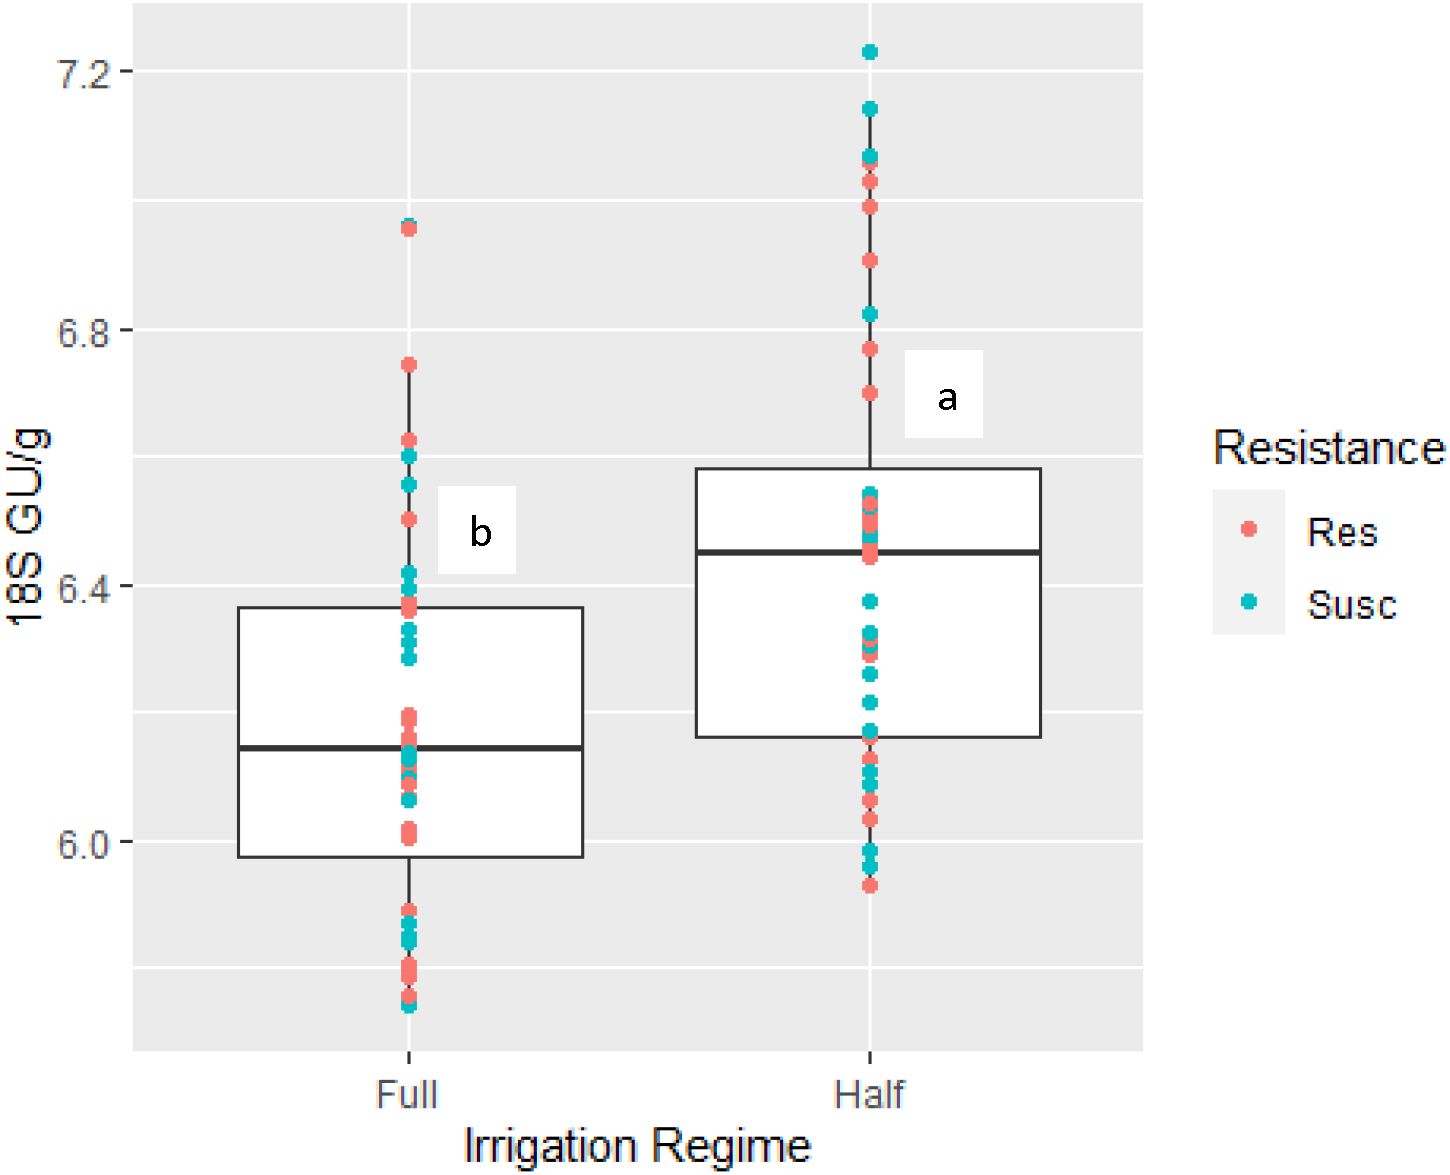
Figure 1. Fungal gene abundance levels (18S rRNA) measured in rootzone soil influence by irrigation regime (Full and half irrigation regimes). Color dots are associated with cotton resistance genotype (root-knot nematode resistant (Res) or susceptible (Susc)). Different letters above box plot indicates significant difference based on stress using linearized mixed model.
Genes associated with biogeochemical pathways were also predicted to increase in response to drought stress, cbbLR and phoA abundance values (t(1,70)=4.447,p<0.0001) and (t(1,70)=3.104, p =0.002), respectively (Figure 2). Additionally, ureC was found to be slightly influenced by plant genotype whereby ureC values were lower in RKN-susceptible plants (t(1,70)=-1.784, p=0.07). Minor interactive effects between irrigation*inoculation, and irrigation*inoculation*cotton genotype were noted for 16S rRNA abundance levels (t(1,70)=1.825, p=0.07) and (t(1,70)=-1.860, p=0.06), respectively. However, model selection criteria (AIC) values were larger for this model suggesting it was a weaker fit than models ignoring these interactive effects. Figure 3 demonstrates the relationship between irrigation and inoculation treatments and 16S and 18S rRNA via principal component analysis.
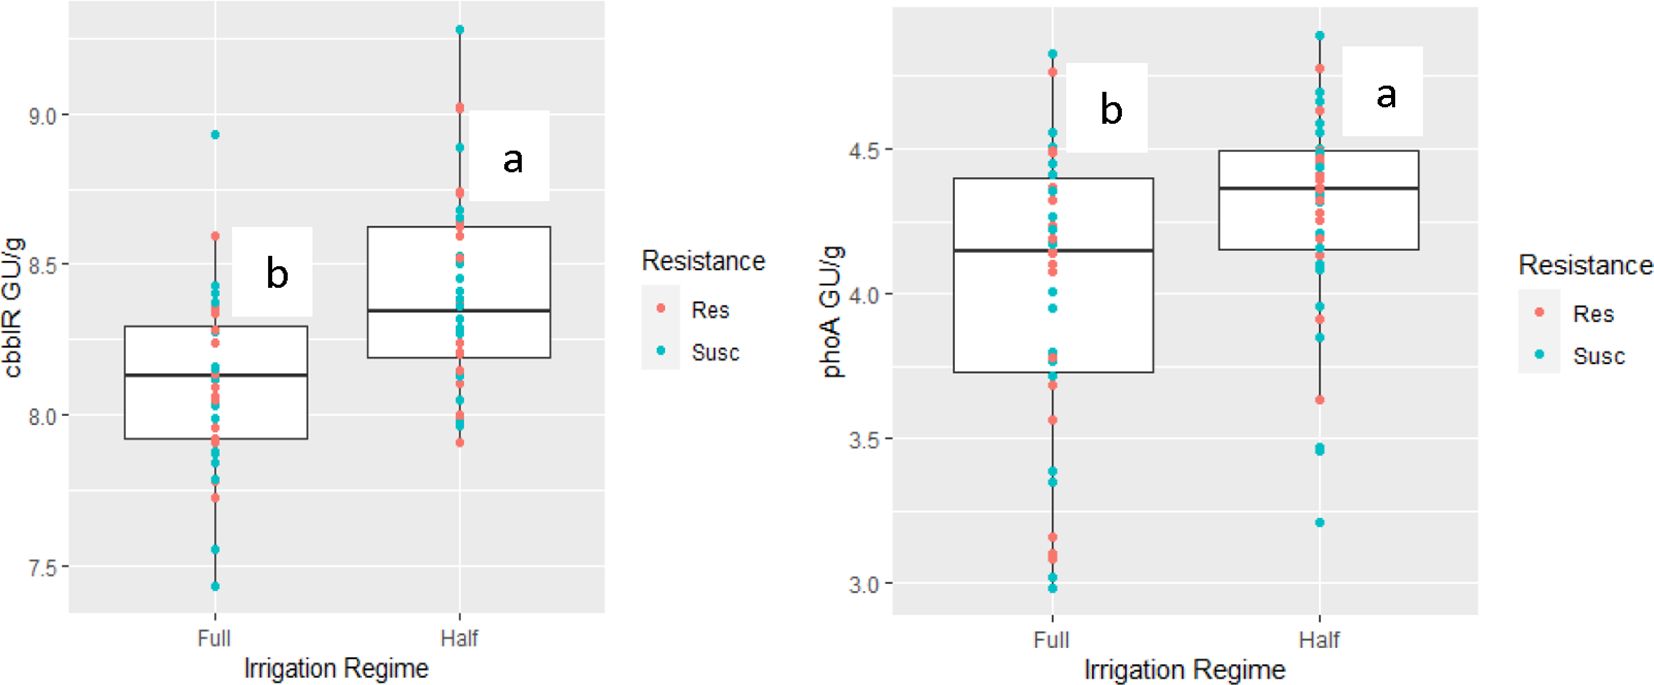
Figure 2. Biogeochemical gene abundance levels (cbbLR and phoA) measured in rootzone soil influence by irrigation regime (Full and half irrigation regimes). Color dots are associated with cotton resistance genotype (root-knot nematode resistant (Res) or susceptible (Susc)). Different letters above box plot indicates significant difference based on stress using linearized mixed model.

Figure 3. Principal component analysis demonstrating the effect of irrigation and inoculation regime for 16S and 18S rRNA parameters, respectively.
Pearson correlations between plant physiological and biomass and soil biological measurements suggested there were moderate significant correlations (Table 3). However, hyperspectral data was not correlated with any rootzone biological measurements, using these simple correlations. Abundance levels for 16S rRNA were moderately negatively correlated with plant height (r(78)=-0.25, p=0.02), leaf dry weight (r(78)=-0.33, p=0.003), stem dry weight (r(78)=-0.37, p=0.0005), and shoot dry weight (r(78)=-0.23, p=0.04). Fungal abundance (18S rRNA) was negatively correlated with soil moisture content (r(78)=-0.37, p<0.001)) (Figure 4), max fluorescence (r(78)=-0.27, p=0.02), quantum efficiency (r(78)=-0.22, p<0.05)), and positively correlated with leaf temperature (r(78)=0.23, p<0.05)). Additionally, fungal abundance levels demonstrated significant interactions with plant height (r(78)=-0.29, p=0.008), and shoot dry weight (r(78)=-0.25, p=0.02). Pearson correlation indicated significant interactions between cbbLR abundance and soil moisture content (r(78)=-0.36, p=0.0009) (Figure 4), stomatal conductance (r(78)=-0.28, p=0.01), max fluorescence (r(78)=-0.23, p=0.03), leaf temperature (r(78)=0.27, p=0.01), canopy temperature difference (r(78)=-0.25, p=0.02), plant height (r(78)=-0.35, p=0.001), and shoot dry weight (r(78)=-0.23, p=0.04). Phosphatase A (phoA) abundance was also negatively correlated with soil moisture content (r(78)=-0.27, p=0.02).
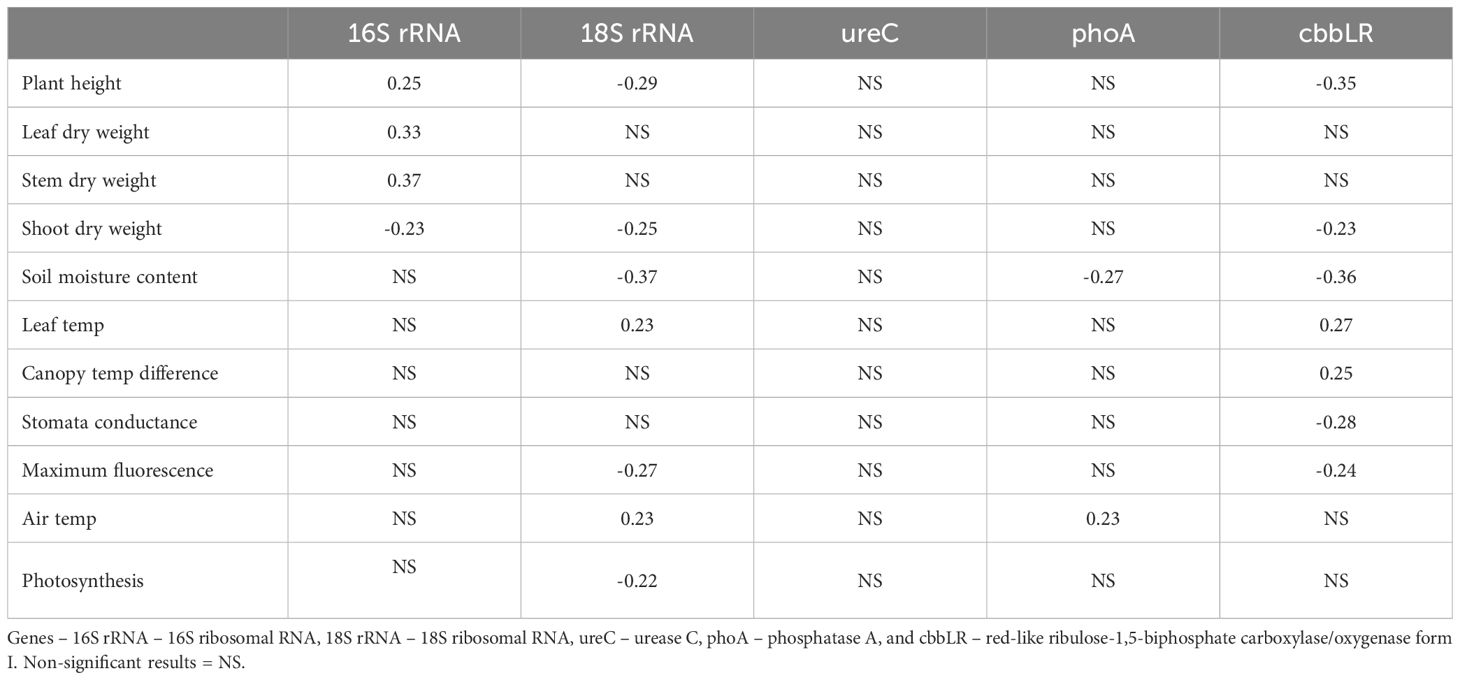
Table 3. Significant (p<0.05) Pearson correlations between soil health genes and select plant biomass, plant physiological, and environmental conditions.
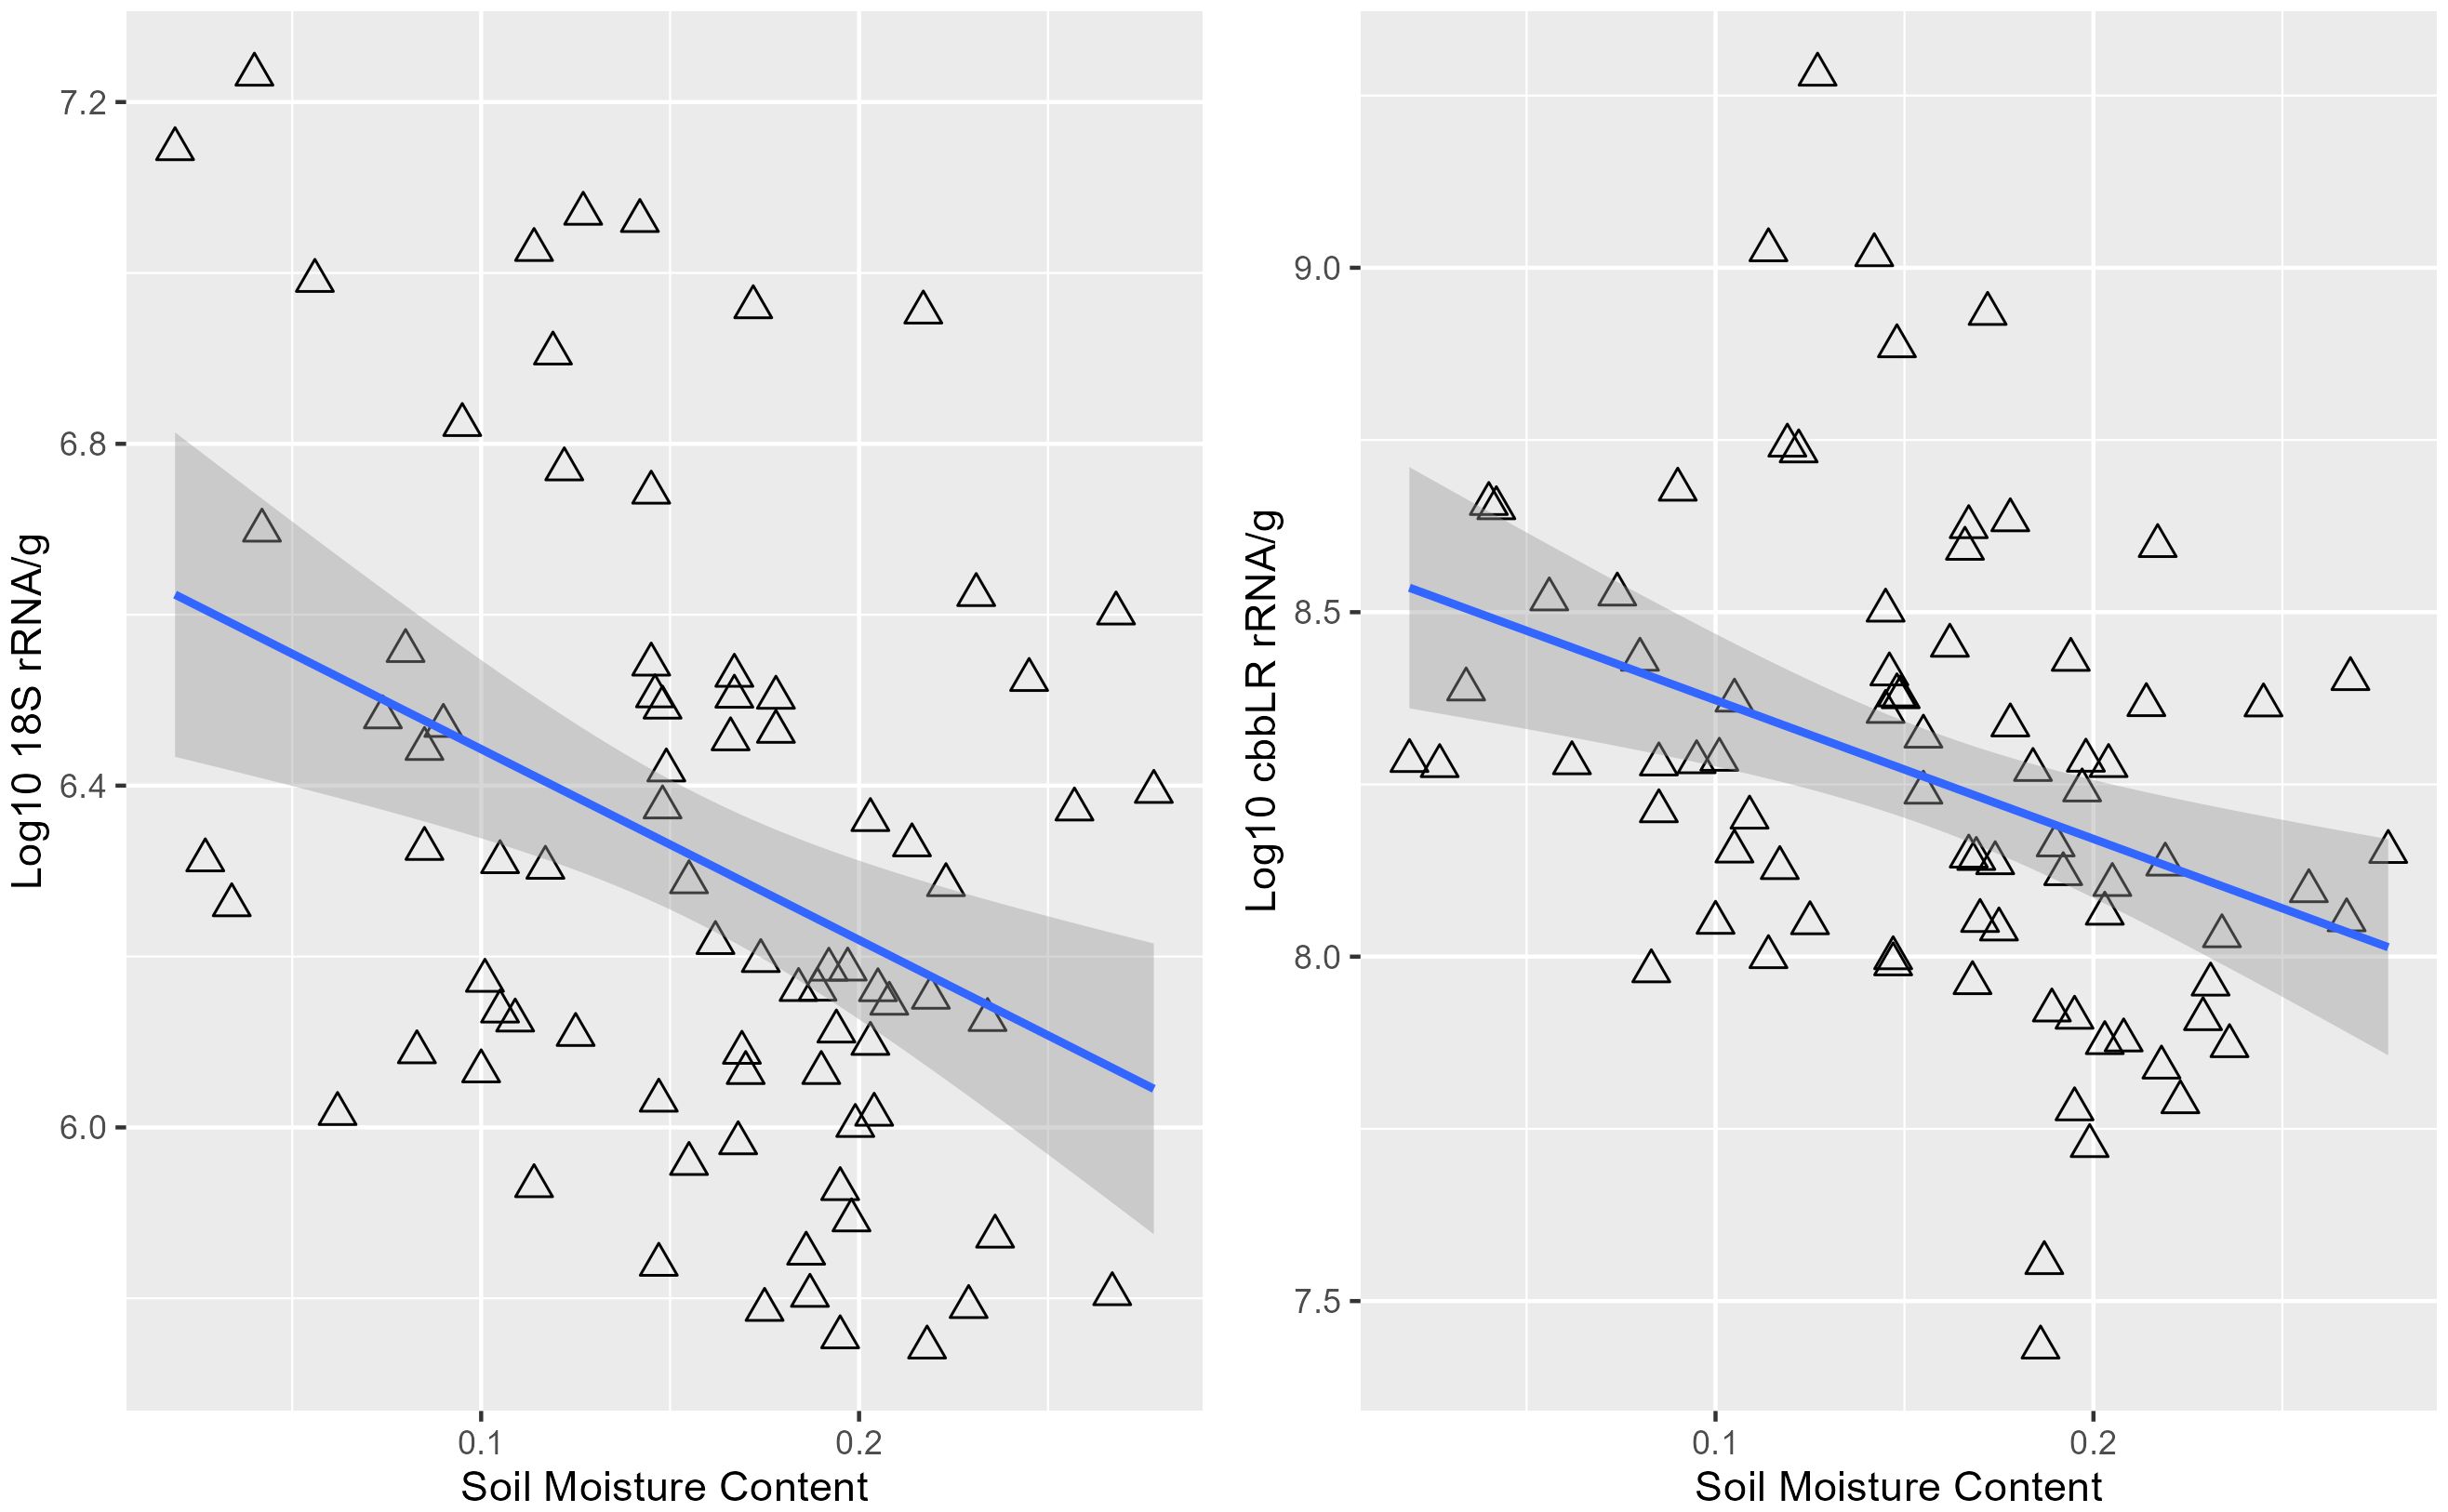
Figure 4. Pearson correlations between 18S rRNA, cbbLR gene abundance levels measured in rootzone soil and soil moisture content.
However, when machine learning was employed, the linear models (lasso and elastic net) were able to accurately predict the presence of drought stress given the hyperspectral data, with the best model (elastic net without a correlation filter) having ROC AUC = 0.864 and F1 = 0.795 (Figures 5, 6). The linear models were able to predict qPCR values with RMSE within approximately one standard deviation of the ground truth data for all five genes considered in this study (Figure 6). While the best models predicting 16S rRNA, cbbLR, phoA, and ureC gene abundance values all had RMSE under the gene level’s standard deviations, models evaluated for 18S rRNA did exceed this metric.
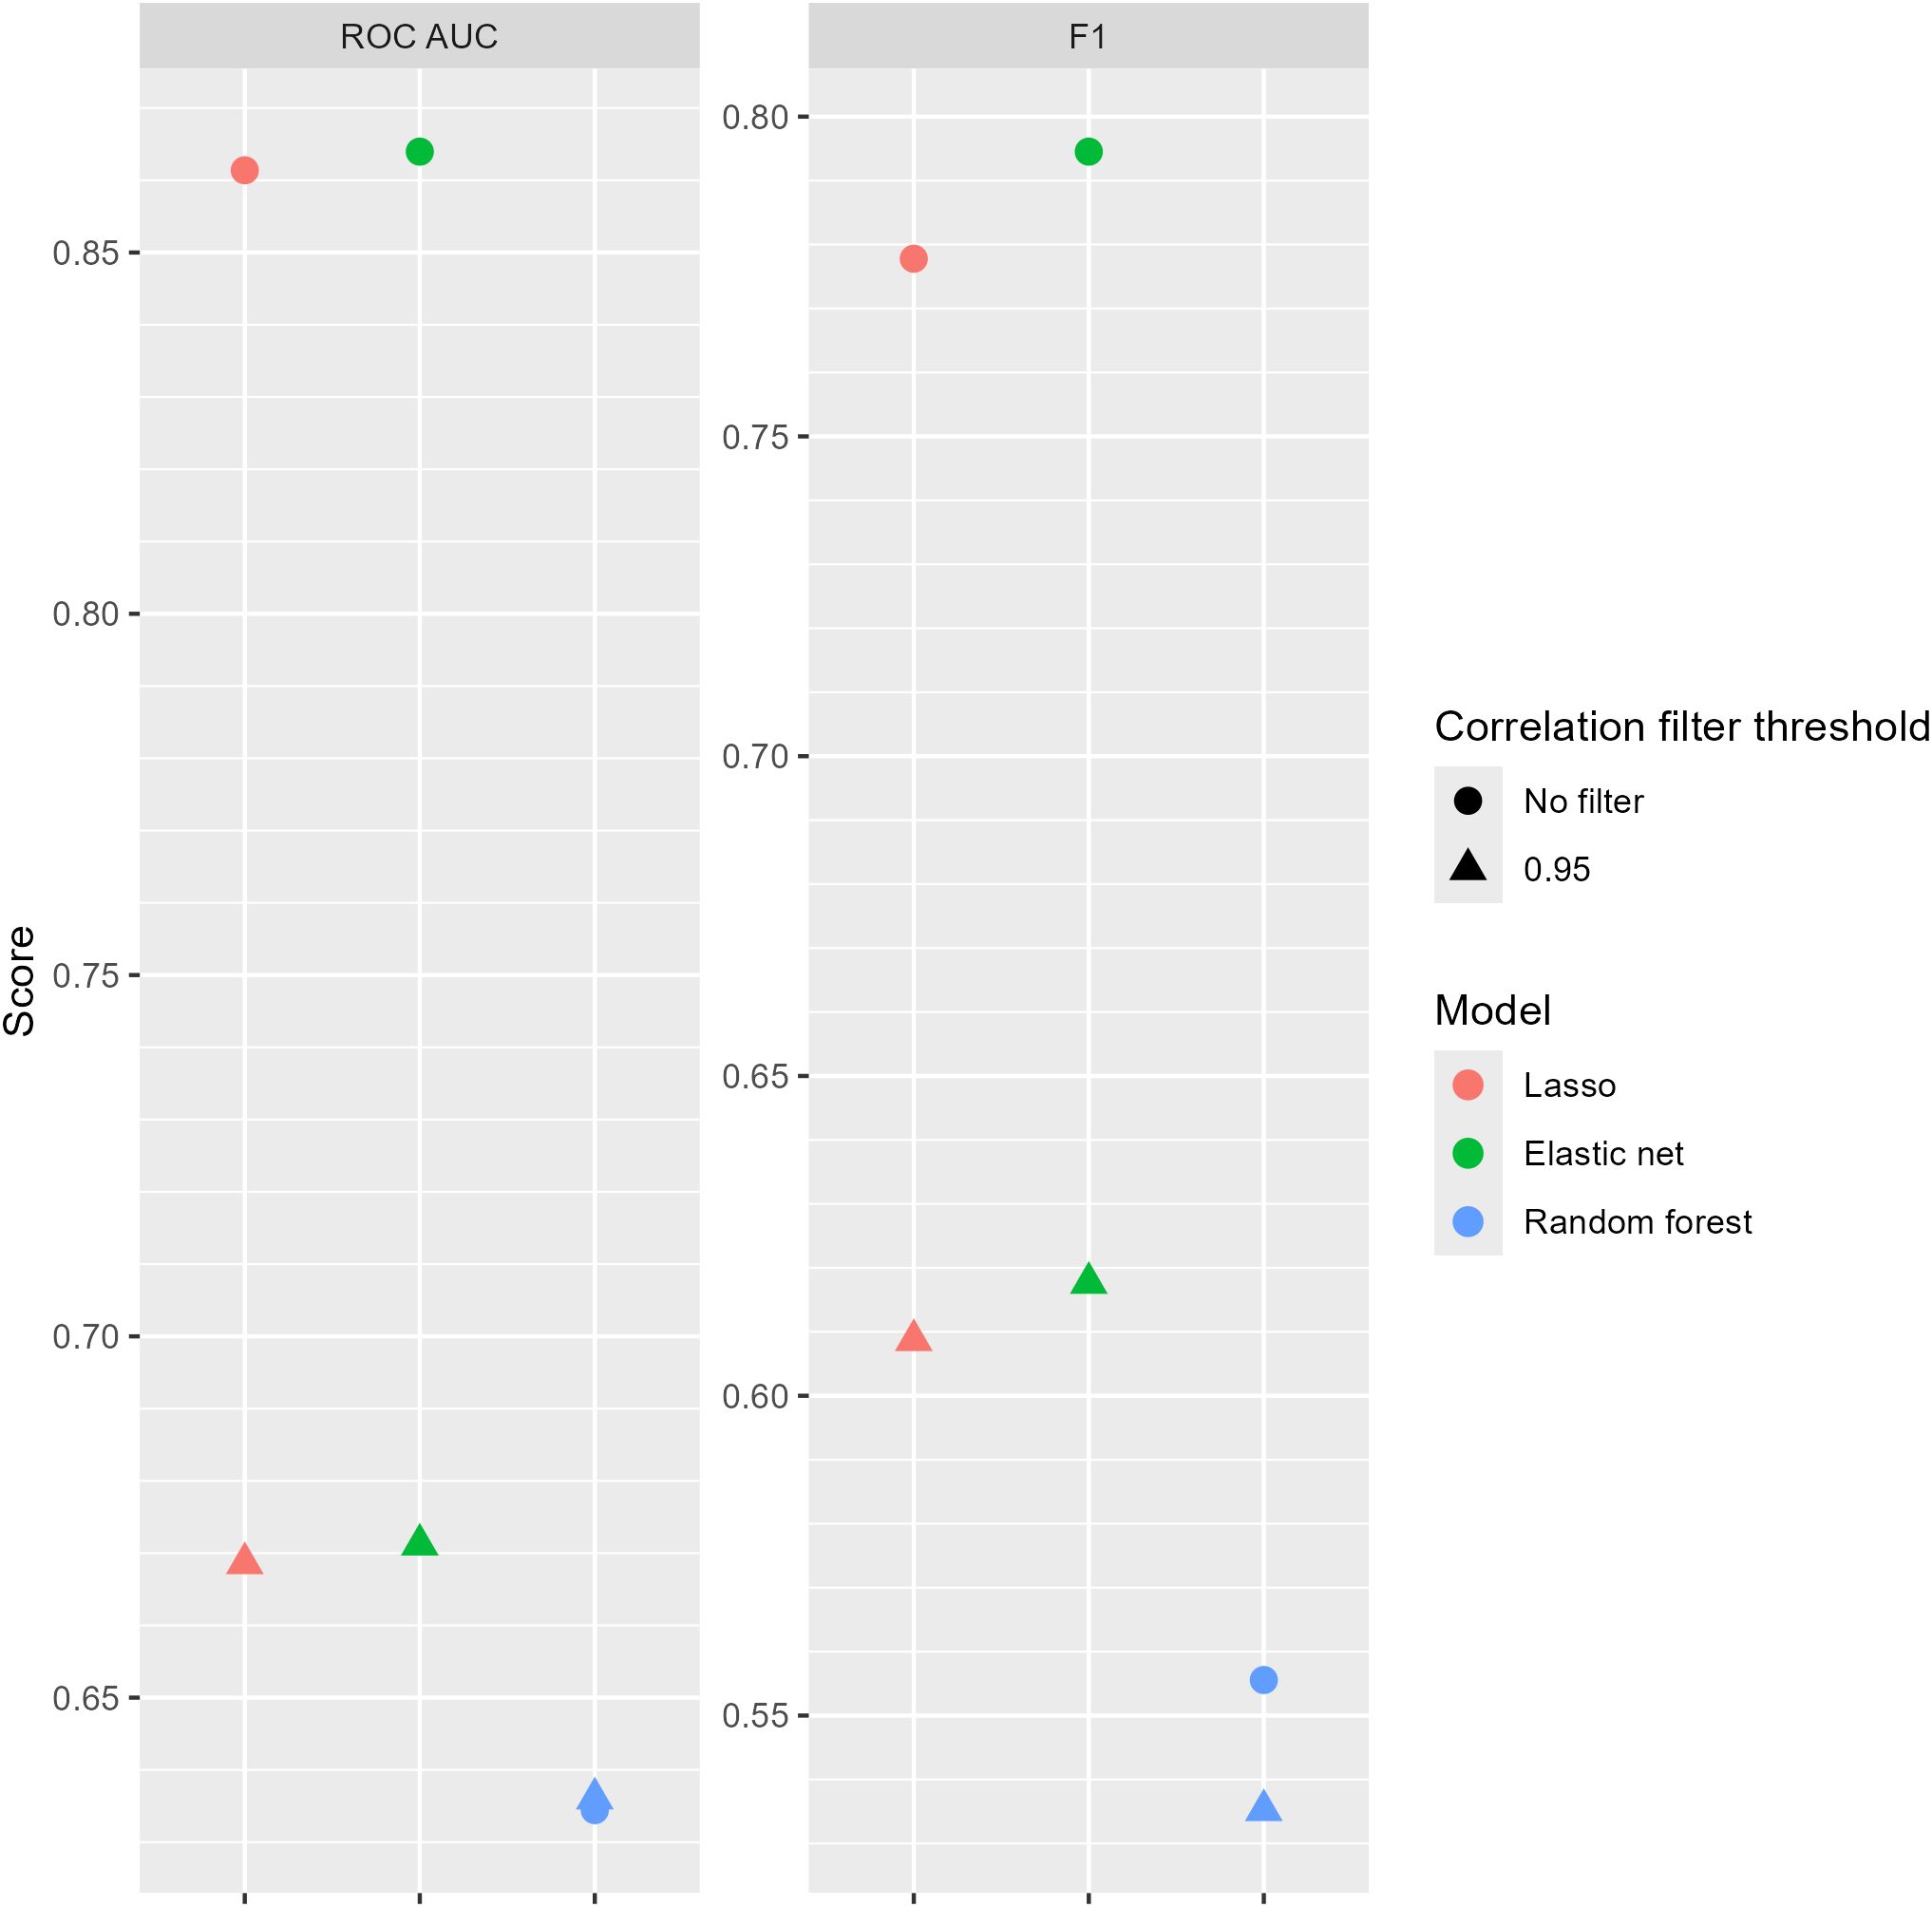
Figure 5. Area under the receiver operating characteristic curve (ROC AUC) and F1 scores for models predicting the presence of drought stress using hyperspectral data. The correlation filter threshold removed all features with an absolute Pearson correlation greater than or equal to that value.
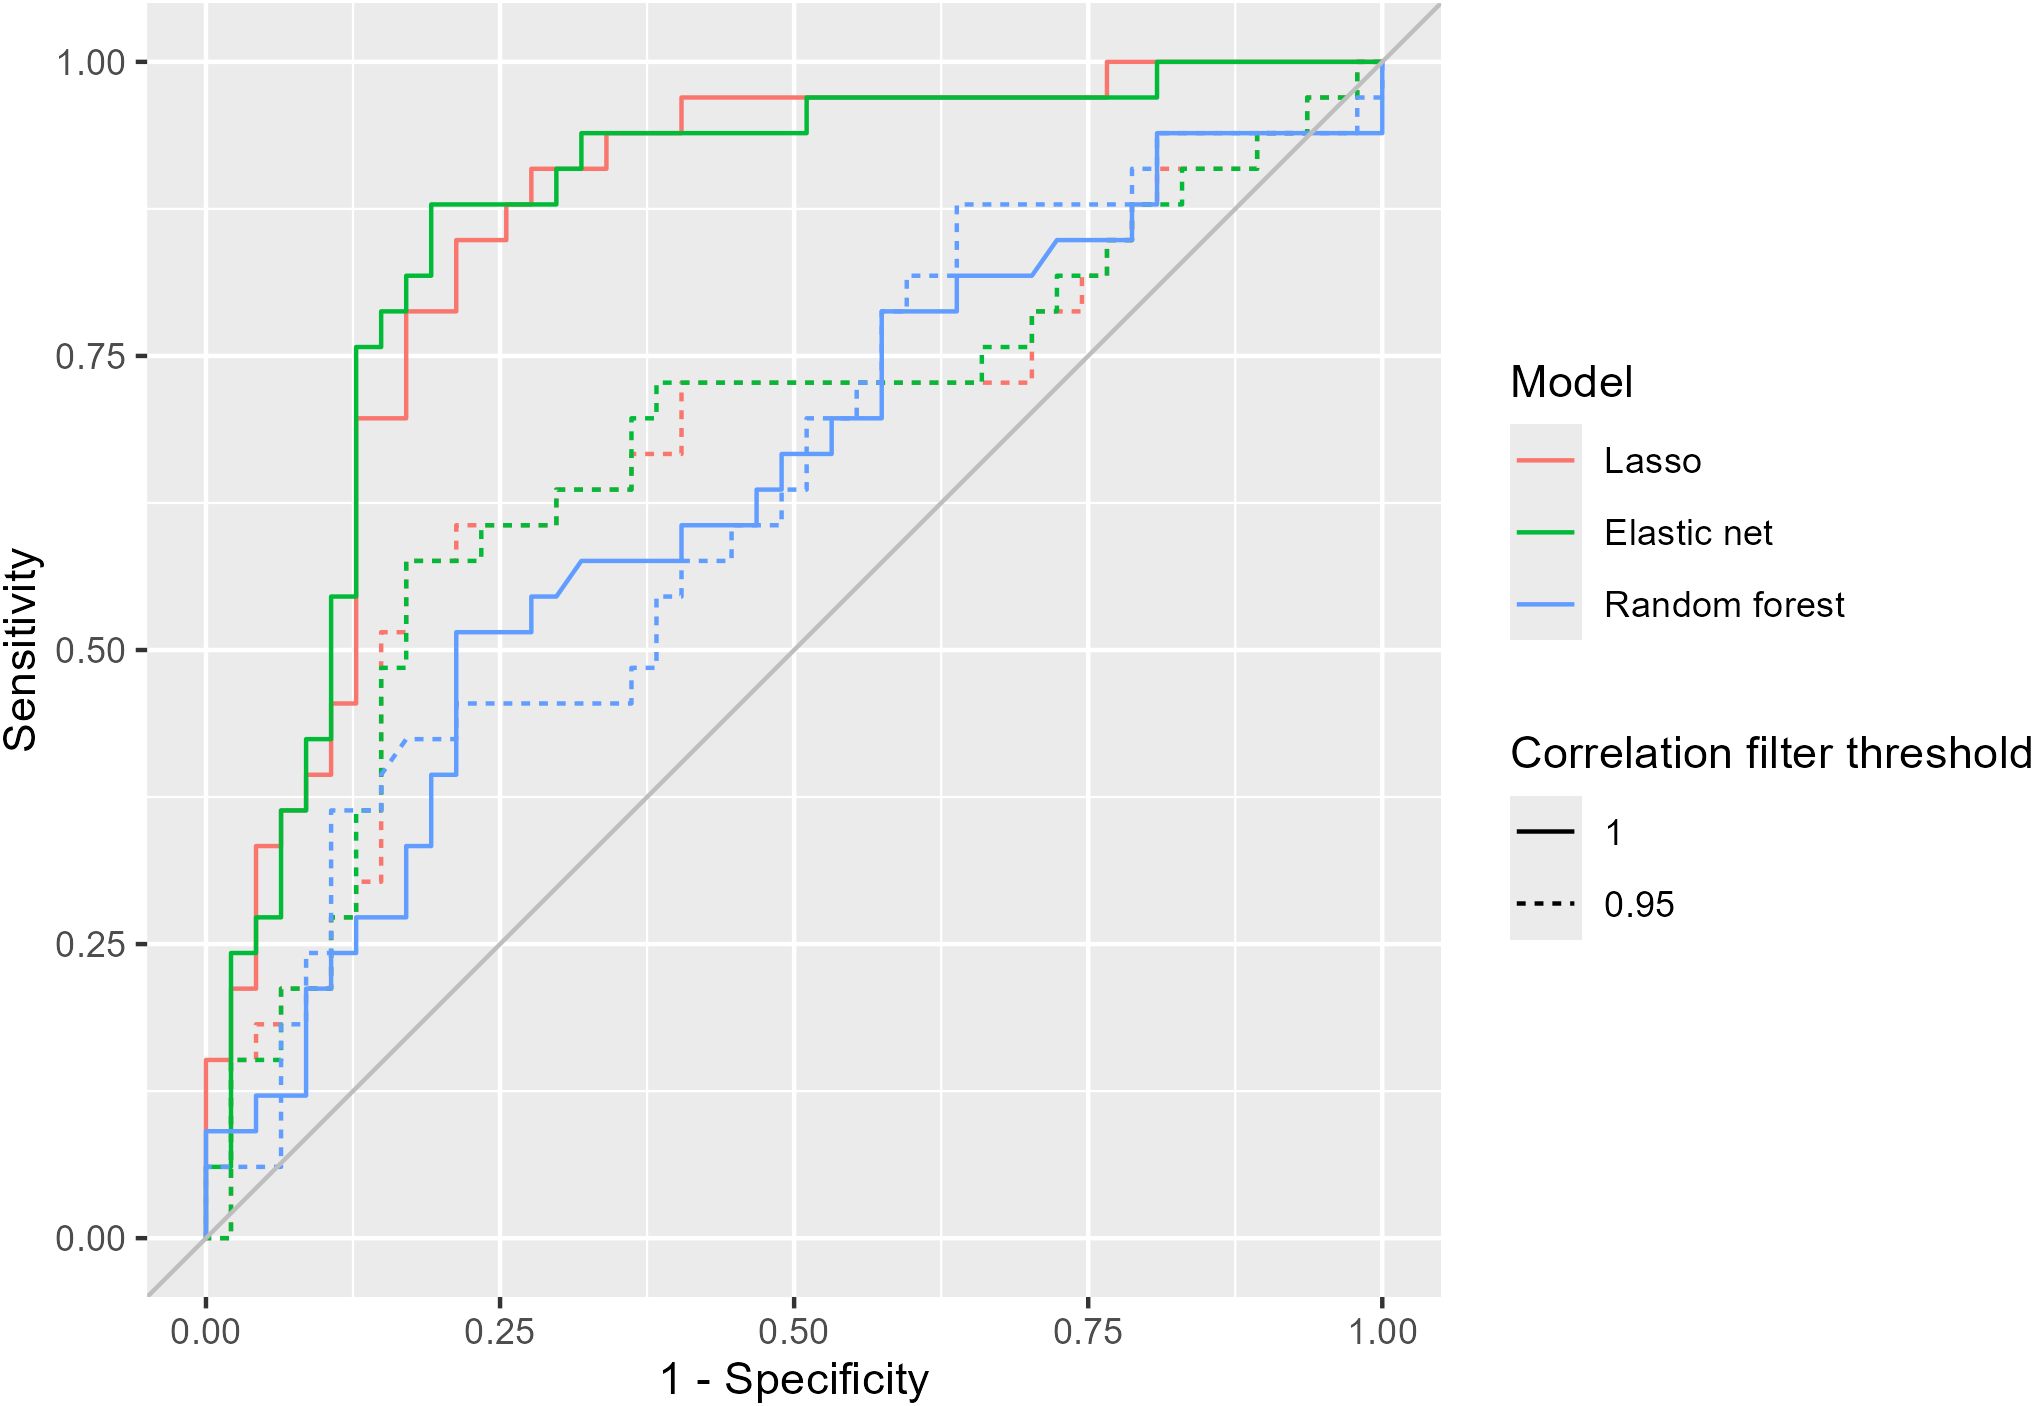
Figure 6. Receiver operating characteristic (ROC) curves for models predicting the presence of drought stress using hyperspectral data. The correlation filter threshold removed all features with an absolute Pearson correlation greater than or equal to that value.
Both linear models (lasso and elastic net) had similar metrics (Figures 5-7), regardless of the task (classification or regression) or presence of a correlation filter. Additionally, these linear models almost universally outperformed the random forest models. The correlation filter reduced most models’ predictive accuracy, affecting the linear models more strongly than the random forest models, but even the reduced prediction quality was considered acceptable for our purposes. Figures 8, 9 demonstrate the Pearson correlations between wavebands and the plant physiological and biomass variables of interest, and mean reflectance by treatment combination, respectively.
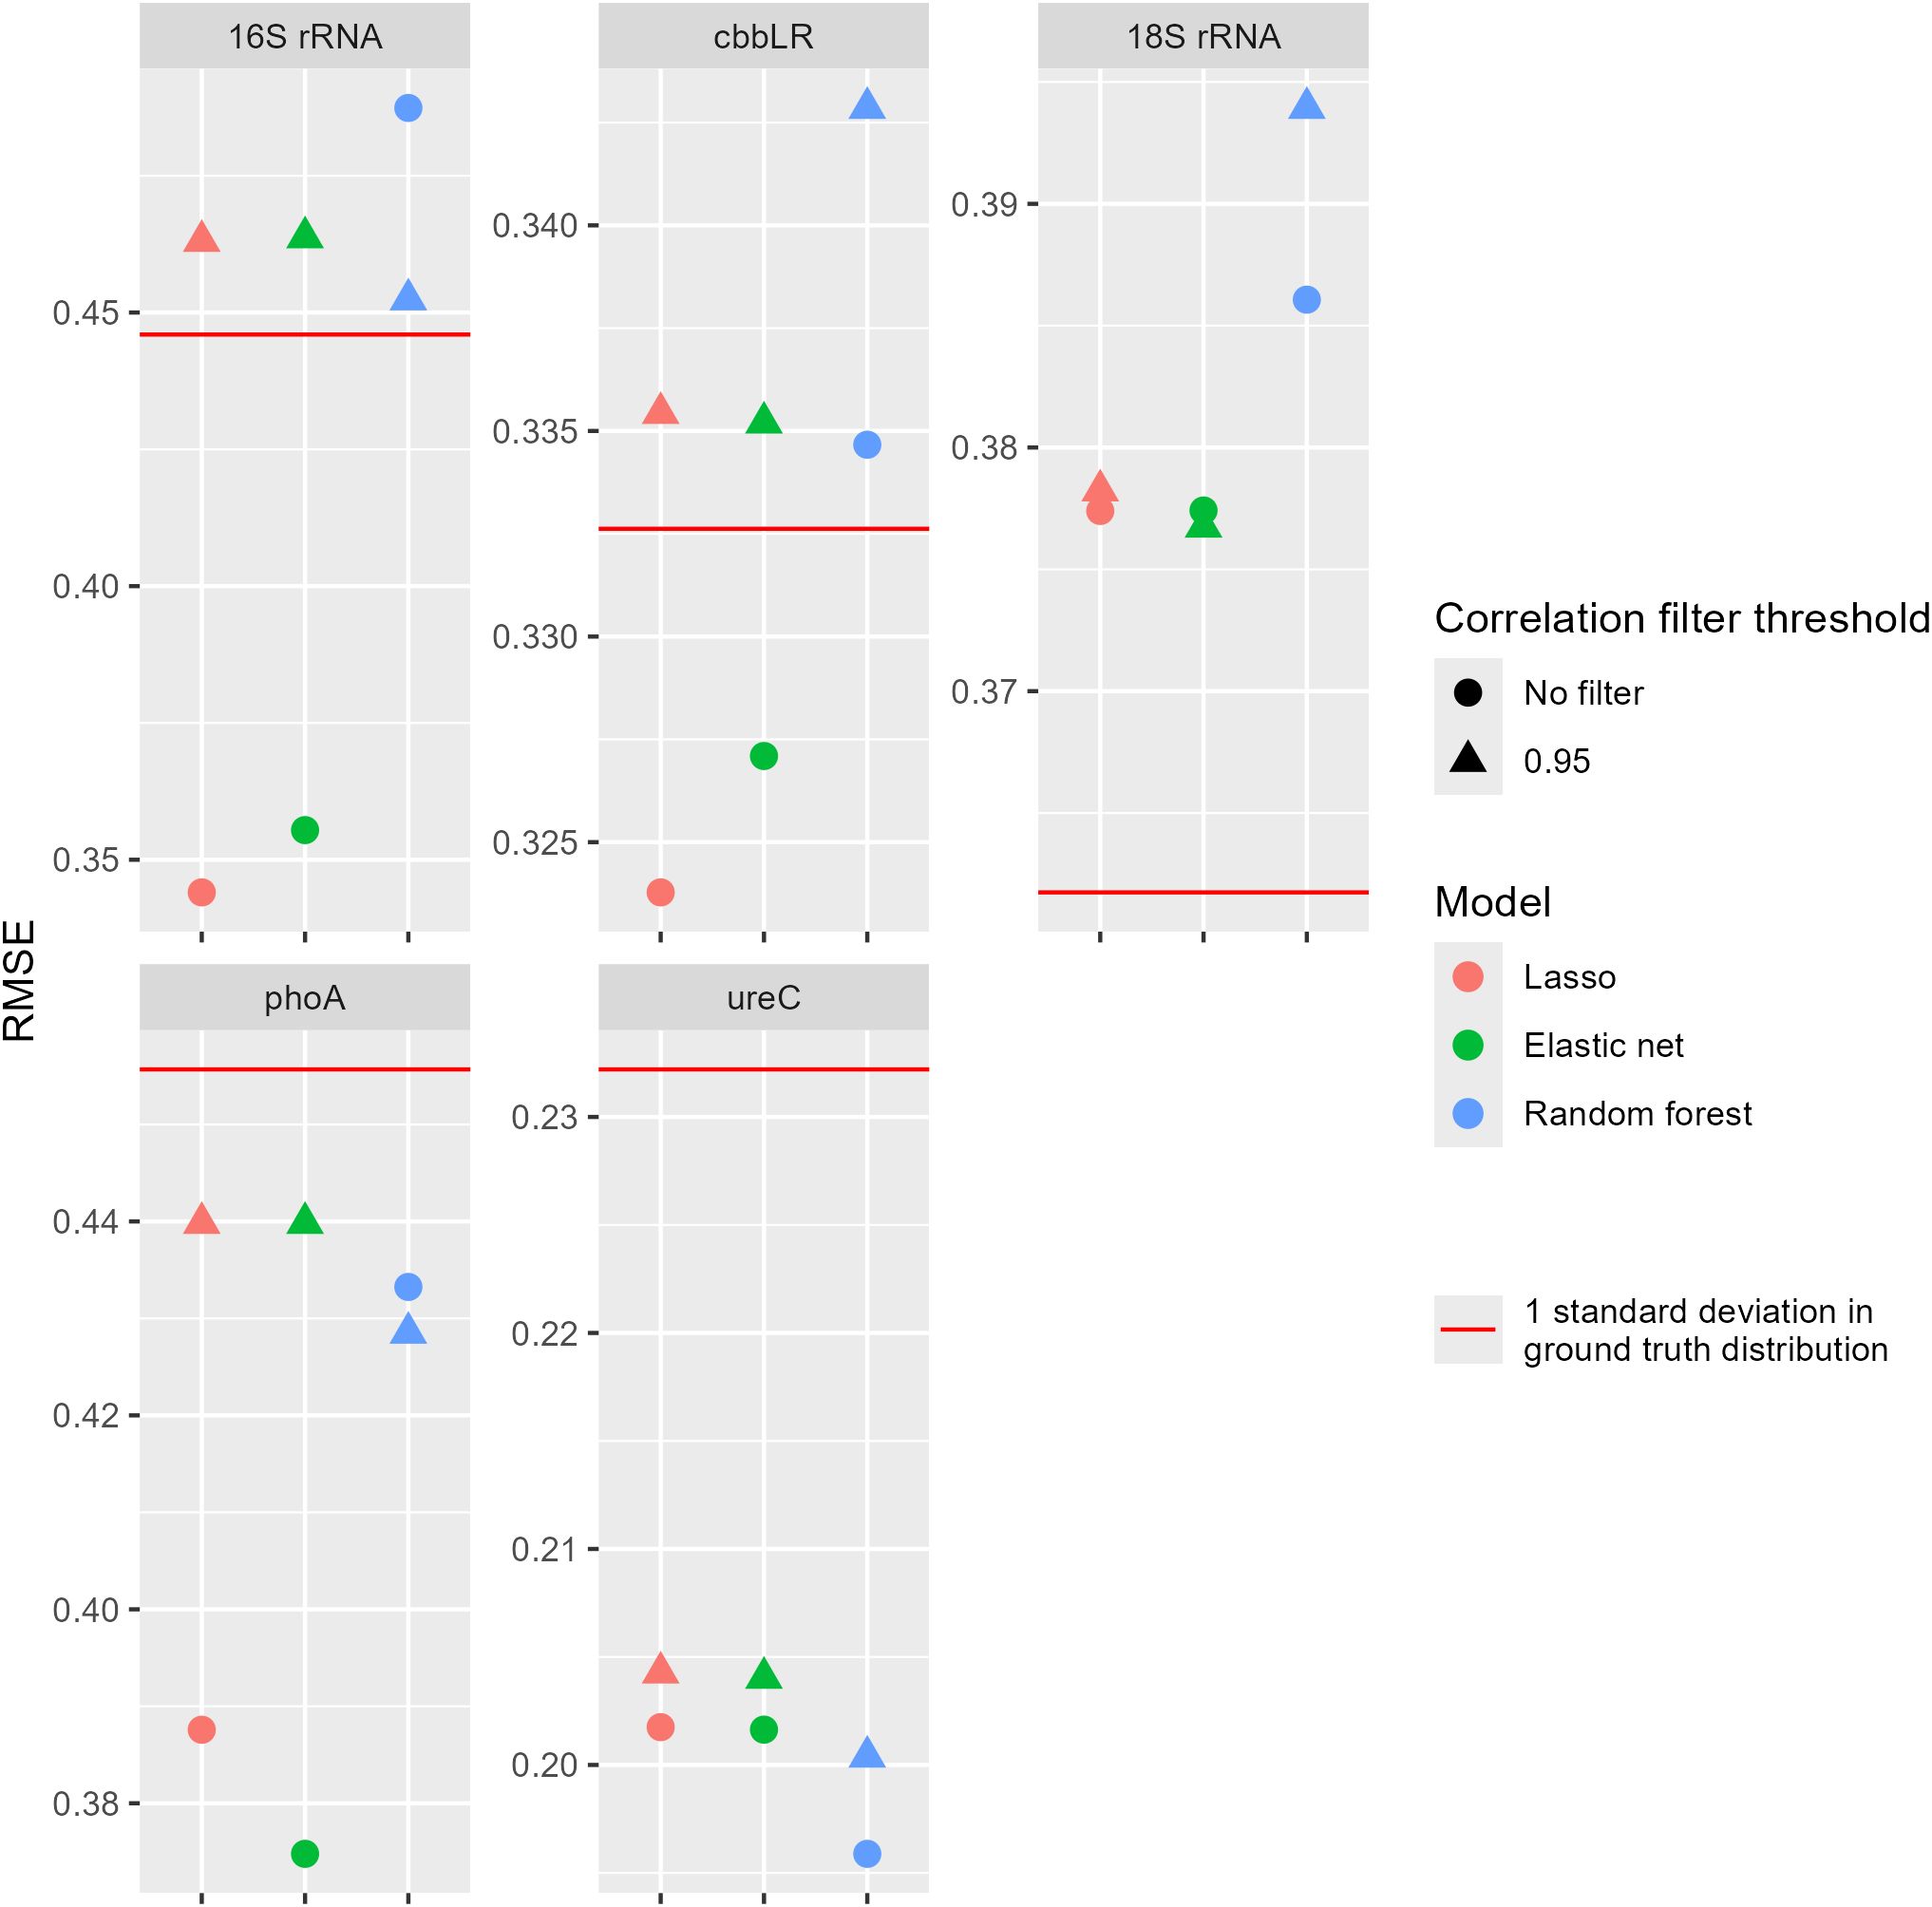
Figure 7. Root mean square error (RMSE) scores for models predicting the log10 qPCR levels using hyperspectral data, with standard deviation within the ground truth distribution included for comparison. The correlation filter threshold removed all features with an absolute Pearson correlation greater than or equal to that value. Genes – 16S rRNA, 16S ribosomal RNA; 18S rRNA, 18S ribosomal RNA; ureC, urease C; phoA, phosphatase A and cbbLR, red-like ribulose-1,5-biphosphate carboxylase/oxygenase form I.
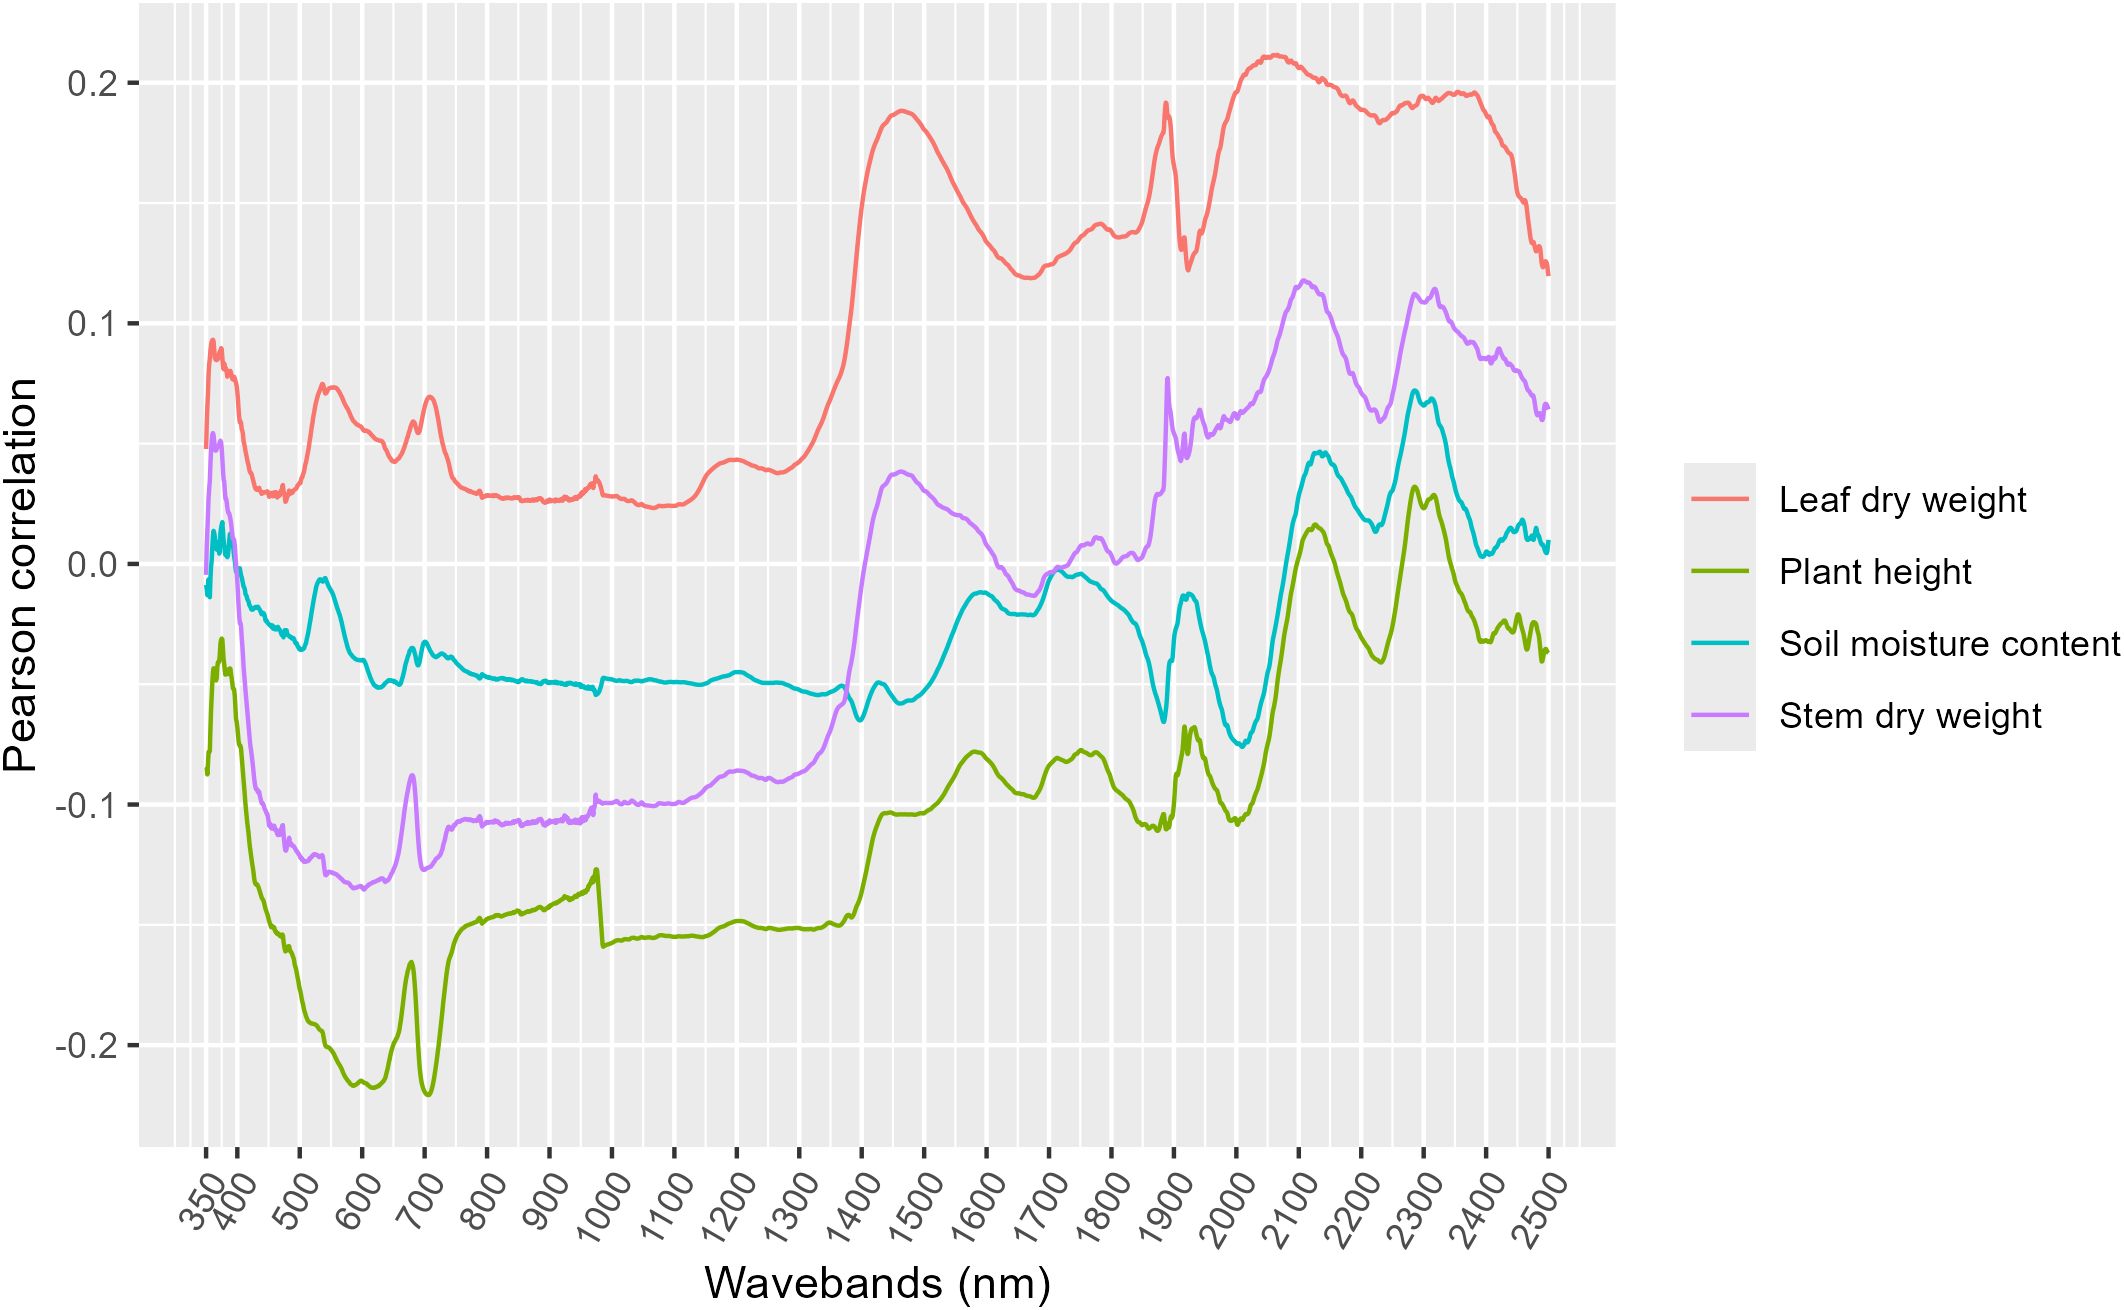
Figure 8. Pearson correlations between each waveband and four variables of particular interest.
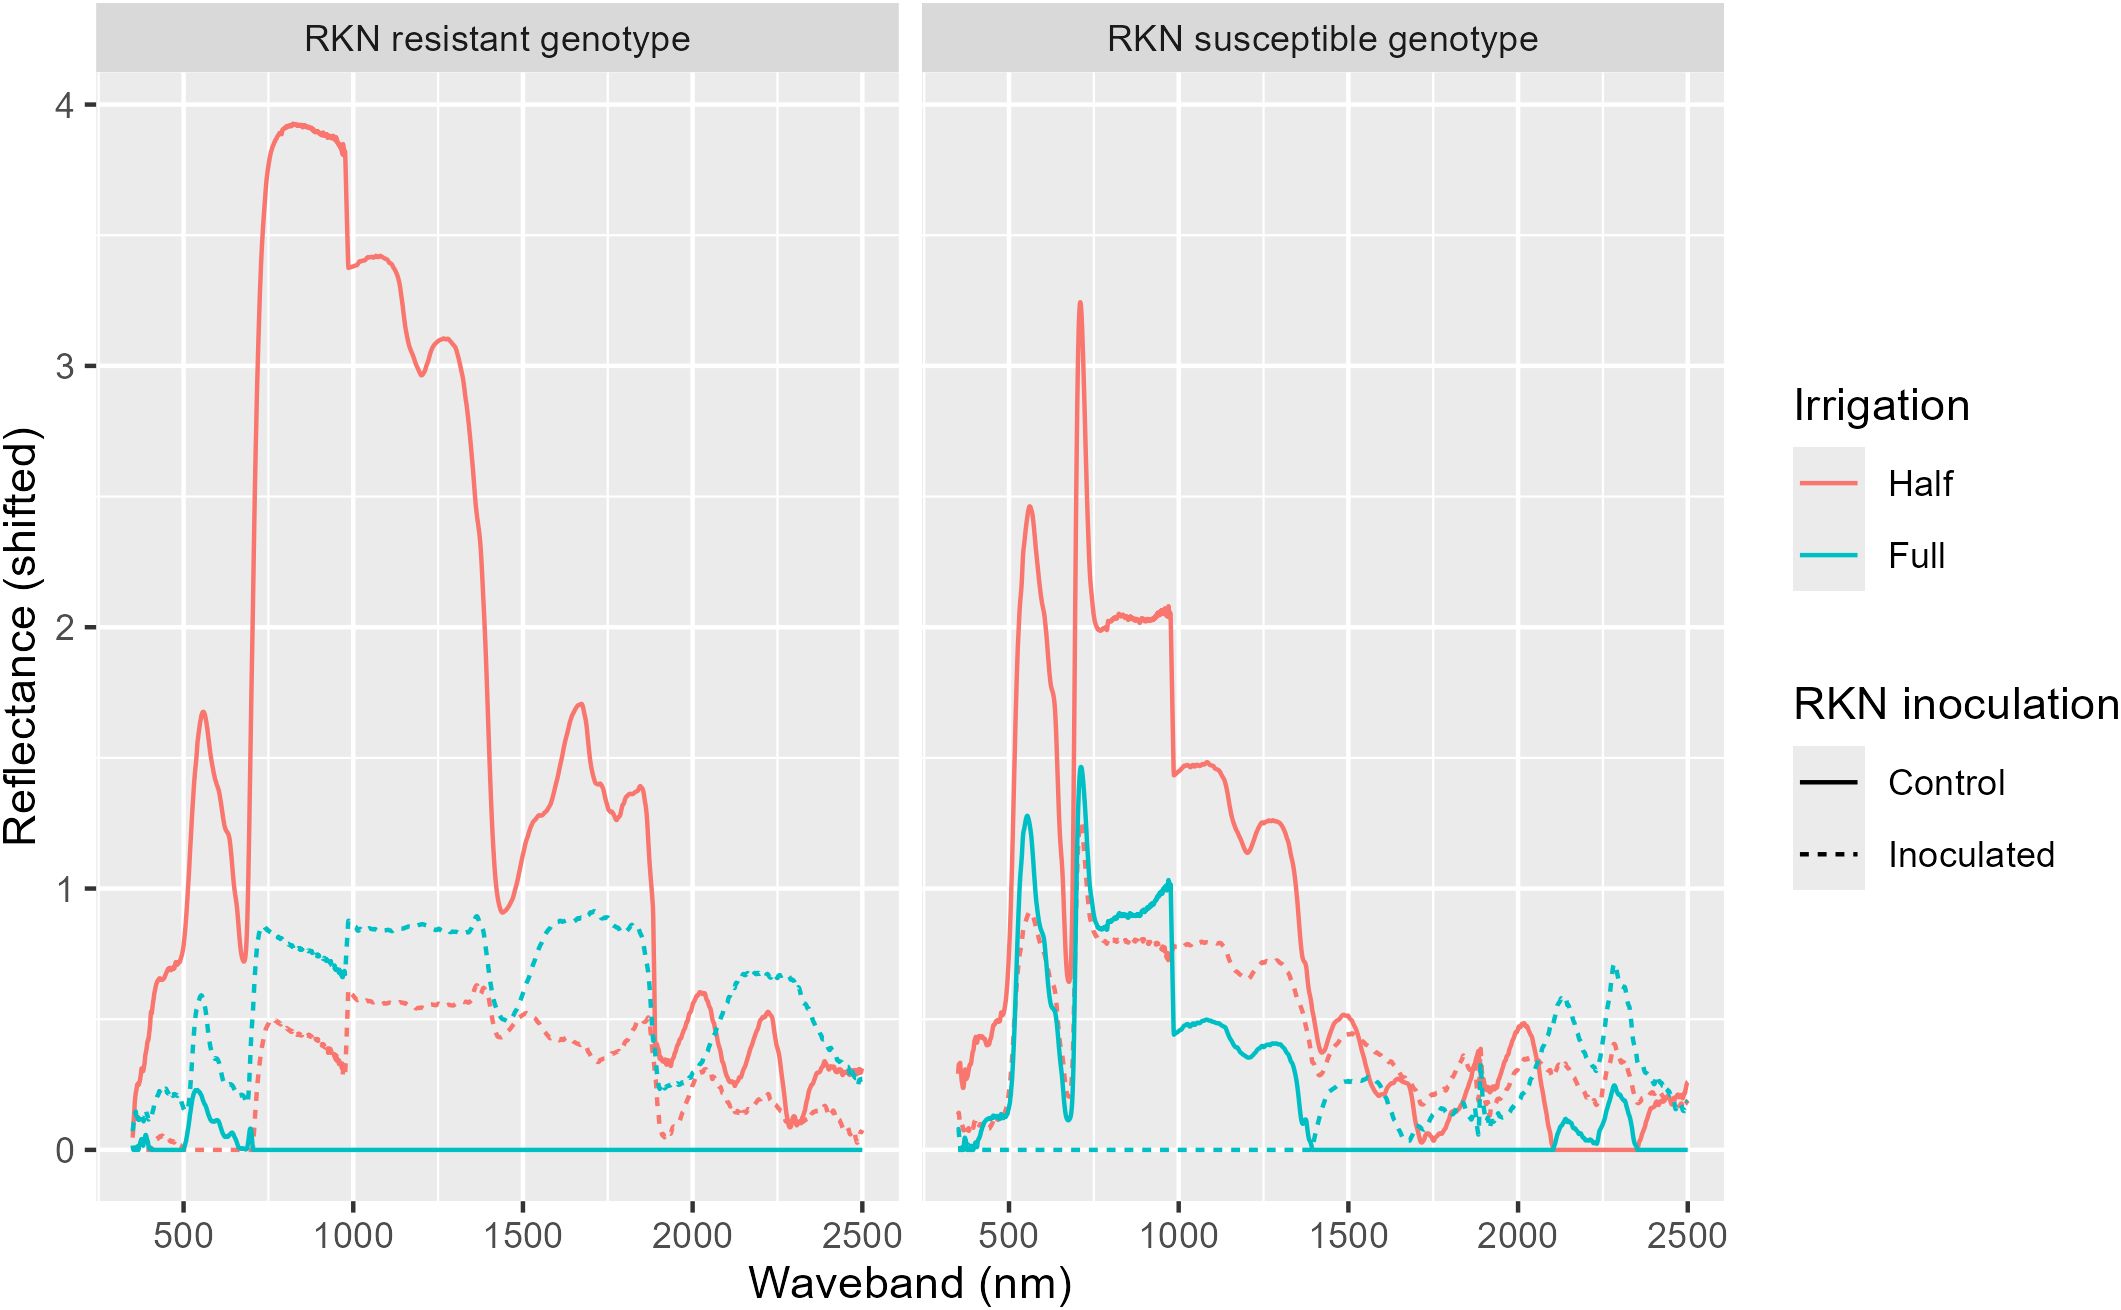
Figure 9. Mean reflectance values for each genotype-treatment combination, shifted by subtracting the minimum mean reflectance at each waveband to display relative differences.
We determined that many measured genes correlated well with the previously reported plant physiological and biomass dataset. In addition, rootzone gene abundances were significantly influenced by soil moisture regimes, a finding similar to the plant physiological dataset (24), which in general was negatively associated with low soil moisture. However, there was little evidence suggesting that cotton genotype (resistant or susceptible to RKN) or inoculation regime affected gene levels. This was also corroborated by the previous publication (24), suggesting that plant physiological and biomass measurements were also not associated with genotype and inoculation.
Gene abundance levels were influenced by soil moisture regime, specifically, linear mixed models suggested that the half moisture regime (i.e., drought) selected for significantly greater levels of 16S rRNA, 18S rRNA, cbbLR, and phoA levels. Additionally, as seen during exploratory visualization (Figure 3), PCA demonstrated that while there is a trend associated with 16S and 18S rRNA towards irrigation and inoculation stresses, the microbial genetic responses overlapped as a result of these stresses. It is important to note that soil samples, for gene abundance levels, were sampled near the root and not the bulk soil, thus the response by the soil microbiome may have been influenced by a plant stress response (17). This was also further corroborated by negative correlations between 18S rRNA, cbbLR, and phoA with soil moisture content, as recorded by probe. While it may seem counterintuitive for gene abundance levels to increase under drought stress, it is possible that the soil microbiome is being positively influenced by the plant’s response to drought stress, as has been reported by others (2, 14, 36). Pineda et al. (36) demonstrated that plant herbivorous insects can be repelled by an inoculated soil microbiome as well as from plant microbiome selection resulting from specific plant species. Similarly, Puschel et al. (14) showed that arbuscular mycorrhizae fungi (AMF) would increase their colonization of plant growth substrate and remained reasonably colonized on plant roots as gravimetric water content decreased. Furthermore, in the current study, plant physiological measurements suggested drought stress was manifested in transpiration and stomatal conductance (24), while visual indicators such as chlorophyll didn’t indicate drought or RKN stress. This may explain the difficulties in directly correlating hyperspectral data with soil gene abundances. The initial wavelengths chosen from the hyperspectral dataset were selected based on key visual indicators (e.g., chlorophyll).
It is well known that members of the fungal microbiome, such as AMF, offer some level of protection from drought stress through the production of glomalin which binds soil particles together, thus enhancing moisture retention (14). In the current study, we noted an increase in overall fungal abundance (18S rRNA) under drought conditions, suggesting that this was a possibility. While AMF were not specifically targeted in this controlled experiment, the fungal abundance primer set captured many fungal species or groups, including AMF. In a recent study, Puschel et al (14) demonstrated that AMF respond to drought stress by increasing P uptake, but also by persisting in root colonization. Other gene abundance levels were also positively selected with drought stress, such as cbbLR and phoA. This may indicate as plant stress increased, the soil microbiome responded by increasing abundance. Likewise, an increase in phoA, may indicate an increase in fungal recruited alkaline phosphatase activity in response to drought stress (37). Phosphatase A (phoA) and cbbLR are each involved in opposite ends of nutrient cycling, with phoA primarily involved in phosphate release from organic matter (9), while cbbLR is associated with CO2 fixation by autotrophic bacteria (35). Drought stress decreases the availability of PO4 (14), thus the presence of increased phoA could indicate a soil microbiome response to promote P availability. Similarly, an increase in plant-mediated communication during drought stress may signal rhizosphere or rootzone bacteria and fungi to increase production of biogeochemical genes (22).
It is also known (38) and was corroborated in the current study, that plant physiology and biomass will respond negatively to drought stress as indicated by transpiration, stomatal conductance, and shoot dry weight (24). Many of the measured gene abundance levels were negatively correlated with plant physiological measurements. For example, carbon fixation (cbbLR) was negatively correlated with stomata conductance and photosynthesis (Fm); however, cbbLR abundance levels were positively correlated with leaf temperature. There is some evidence to suggest that plants can uptake soil C via the rootzone (<5% of total plant C) (39). In a study by Majlesi et al. (39), it was suggested that soil C, determined via C14 labeling, could be up taken at between 3-5% in pine roots. While this may be related to plant specific responses, there is evidence that it happens in other species such as cereal (40). The available soil C is undoubtedly related to the soil rootzone microbiome. An increase in C fixation in the soil by rootzone bacteria may indicate lower intake via stomatal atmospheric C and subsequent photosynthetic-driven C fixation. Furthermore, an increase in cbbLR rootzone gene abundance coupled with an increase in leaf temperature may indicate a response to plant drought stress. An increase in leaf temperature could indicate a decrease in transpiration, which coupled with decreased stomatal conductance suggests a drop in CO2 acquisition. This is further corroborated by negative correlations between cbbLR, phoA, and 18S rRNA and soil moisture content. Furthermore, plant leaf quantum efficiency was also negatively correlated with 18S rRNA abundance levels, further suggesting that as the plants were drought stressed, there was a subsequent response and increase in key microbiome members and genes.
Interestingly, plant biomass characteristics were negatively correlated with most measured gene abundance levels. Plant biomass characteristics, such as plant height, leaf dry weight, stem dry weight, and shoot dry weight were negatively correlated with 16S rRNA, cbbLR, phoA, and 18S rRNA levels. This corroborates the noted interactions stated above, whereby increased plant stress led to increased demand on the soil rootzone microbiome, at least as measured by these five genes. As stated in Ramamoorthy et al. (24), drought stress manifested in negative biomass interactions, such as shoot dry weight losses which decreased by up to 50% relative to control plants.
Infection with RKN and/or cotton genotype susceptibility to RKN did not significantly influence linear mixed model responses for any of the reported gene abundance levels. While this was surprising; as previously reported by Ramamoorthy et al. (24), plant physiological nor biomass were significantly influenced by RKN nor RKN susceptibility genotype. In fact, in order of rank, drought stress and RKN w/drought stress both demonstrated stronger reactions from plant growth measurements, indicating that drought stress was the key stressor. Similarly, gene abundance levels responded the same. However, hyperspectral readings were able to successfully denote RKN stress from control (24).
Overall, the intent and purpose of this experiment was to correlate plant associated hyperspectral reflectance values with rootzone gene abundance levels. Direct relationships were not found utilizing a pared down dataset (e.g., averaging of wavelengths) and simple Pearson correlations; however, through machine learning, the hyperspectral dataset was able to predict soil health genes. The vast amount of data collected in a single hyperspectral session needs to be successfully and correctly dimensionally reduced prior to manual data analysis. Initially, we attempted to reduce some of the data dimensionality by averaging and selecting wavelengths of biological significance, more careful selection is necessary to capture the plant physiological or biomass presentations that were significantly correlated to gene abundance levels. Stomatal conductance, leaf temperature, photosynthetic efficiency, and soil moisture, while all significantly explanatory for gene abundances, may not necessarily be represented in hyperspectral readings (25). As can be seen in Figures 8 and 9, there are trends associated with plant biomass measurements and wavelength, for example leaf dry weight and stem dry weight were both moderately associated with increasing wavelength. There were moderate positive correlations at >1000 nm with leaf dry weight and moderate negative correlations with plant height between 500 and 700 nm. Reflectance (shifted) was also greater in the resistant and susceptible genotypes during drought stress conditions. These peaks occurred between 700 and 1200 nm, covering red and near infrared spectra, both of which are known to suggest plant health (25), thus indicating plant stress.
Utilizing machine learning, lasso and elastic net linear models were capable of predicting drought stress and soil health gene levels. To the best of our knowledge, this is the first time a hyperspectral dataset has been successfully used to accomplish these tasks. While other reports, such as Hamada et al. (1) proposed such an endeavour, there has been little movement on this front. Khan et al. (26) reviewed the literature and only found a few studies utilizing hyperspectral imaging to investigate soil micro- and macro-nutrient concentrations. However, the current study proposed the use of the plant as an intermediary between the soil microbiome and plant phenotypic presentation as captured by hyperspectral imaging. In doing so, we propose that this approach is applicable to diagnostic purposes, whereby specific soil health genes could be used to identify soil microbiome deficiencies. Measuring this by hand is a tedious and costly process, but the use of hyperspectral imaging could allow for a more rapidly deployable method.
In the models tested in this study, wavelengths were treated as distinct variables, unrelated from the models’ perspectives. Future studies might also consider models which treat the reflectance across the spectrum as a single variable. Since each wavelength was highly correlated with neighboring wavelengths, future studies might investigate models incorporating this property. Binning wavelengths together or applying a one-dimensional convolution, as opposed to the simple average approach first conducted, might simulate a coarser spectral resolution, potentially allowing for generalization to more affordable equipment.
Random forest models are more complex than linear ones; this can be a strong advantage when the underlying pattern to be predicted is nonlinear, but it runs a higher risk of overfitting than a simpler model. Since the linear models outperformed the random forest models so thoroughly, it suggests that the underlying pattern is inherently linear, a useful property for any future studies investigating hyperspectral reflectance and gene abundance values. However, it is important to note, the hyperspectral dataset was collected proximally, which reduced the risk of environmental noise without limiting the throughput. Ultimately, the intention is for the application of these approaches utilizing remote sensing mounted to unmanned aerial or ground vehicles. The reflectance was measured across a wide spectrum, but this led to the dataset having far more independent variables (2151 wavelengths) than samples (398, after removing erroneous measurements). This imbalance in dimensionality can be problematic for machine learning models; however, since all wavelengths ultimately represented the same type of value (i.e., reflectance), and since these values were highly correlated among nearby wavelengths, the imbalance proved less of a concern in this study.
Interestingly, the selected five genes were considered for their implications on soil biological health, and in serving that purpose, were generally negatively correlated with plant physiological and biomass metrics, indicating that as the plant was stressed, there was a small but commensurate response from the rootzone microbiome to increase abundance of these bacterial or fungal groups and related physiological pathway genes. This suggests that there is a route forward for understanding and relating the many disciplines associated with agriculture and remote sensing; the key is to correctly analyse these high throughput data sources to biological meaningful corollaries.
In conclusion, this study aimed at establishing a relationship between above ground plant measurements with below ground gene abundance levels. This study demonstrated the feasibility of estimating soil microbial gene abundance and plant properties using hyperspectral reflectance data through machine learning model development.
The raw data supporting the conclusions of this article will be made available by the authors, without undue reservation.
JB: Conceptualization, Data curation, Formal analysis, Funding acquisition, Investigation, Methodology, Project administration, Resources, Software, Supervision, Validation, Visualization, Writing – original draft, Writing – review & editing. MW: Conceptualization, Investigation, Methodology, Project administration, Resources, Writing – original draft, Writing – review & editing. RS: Data curation, Investigation, Methodology, Writing – review & editing. JW: Formal analysis, Methodology, Software, Validation, Writing – original draft, Writing – review & editing. SS: Data curation, Formal analysis, Investigation, Methodology, Software, Validation, Writing – review & editing. PR: Data curation, Formal analysis, Investigation, Software, Writing – review & editing. RB: Conceptualization, Data curation, Formal analysis, Investigation, Methodology, Software, Validation, Writing – review & editing.
The author(s) declare that financial support was received for the research and/or publication of this article. This research was funded by USDA-ARS National Program 216: 6064-21600-001-00D.
The authors declare that the research was conducted in the absence of any commercial or financial relationships that could be construed as a potential conflict of interest.
The author(s) declared that they were an editorial board member of Frontiers, at the time of submission. This had no impact on the peer review process and the final decision.
All claims expressed in this article are solely those of the authors and do not necessarily represent those of their affiliated organizations, or those of the publisher, the editors and the reviewers. Any product that may be evaluated in this article, or claim that may be made by its manufacturer, is not guaranteed or endorsed by the publisher.
Mention of trade names or commercial products in this publication is solely for the purpose of providing specific information and does not imply recommendation or endorsement by the U.S. Department of Agriculture.
1. Hamada Y, Gilbert JA, Larsen PE, Norgaard MJ. Toward linking aboveground vegetation properties and soil microbial communities using remote sensing. Photogrammetric Eng Remote Sens. (2014) 80:311–21. doi: 10.14358/PERS.80.4.311
2. Sokol NW, Slessarev E, Marschmann GL, Nicolas A, Blazewicz SJ, Brodie EL, et al. Life and death in the soil microbiome: how ecological processes influence biogeochemistry. Nat Rev Microbiol. (2022) 20:415–30. doi: 10.1038/s41579-022-00695-z
3. van Eunen K, Bouwman J, Daran-Lapujade P, Postmus J, Canelas AB, Mensonides FI, et al. Measuring enzyme activities under standardized in vivo-like conditions for systems biology. FEBS J. (2010) 277:749–60. doi: 10.1111/j.1742-4658.2009.07524.x
4. Shade A, Hogan CS, Klimowicz AK, Linske M, McManus PS, Handelsman J. Culturing captures members of the soil rare biosphere. Environ Microbiol. (2012) 14:2247–52. doi: 10.1111/j.1462-2920.2012.02817.x
5. Fierer N, Wood SA, Bueno de Mesquita CP. How microbes can, and cannot, be used to assess soil health. Soil Biol Biochem. (2021) 153. doi: 10.1016/j.soilbio.2020.108111
6. Frey SD, Knorr M, Parrent JL, Simpson RT. Chronic nitrogen enrichment affects the structure and function of the soil microbial community in temperate hardwood and pine forests. For Ecol Manage. (2004) 196:159–71. doi: 10.1016/j.foreco.2004.03.018
7. Ochoa-Hueso R. Global change and the soil microbiome: A human-health perspective. Front Ecol Evol. (2017) 5:71. doi: 10.3389/fevo.2017.00071
8. Rousk J, Baath E, Brookes PC, Lauber CL, Lozupone C, Caporaso JG, et al. Soil bacterial and fungal communities across a pH gradient in an arable soil. ISME J. (2010) 4:1340–51. doi: 10.1038/ismej.2010.58
9. Garaycochea S, Altier NA, Leoni C, Neal AL, Romero H. Abundance and phylogenetic distribution of eight key enzymes of the phosphorus biogeochemical cycle in grassland soils. Environ Microbiol Rep. (2023) 15(5):352–369. doi: 10.1111/1758-2229.13159
10. Han J, Jung J, Hyun S, Park H, Park W. Effects of nutritional input and diesel contamination on soil enzyme activities and microbial communities in Antarctic soils. J Microbiol. (2012) 50:916–24. doi: 10.1007/s12275-012-2636-x
11. Fisher KA, Yarwood SA, James BR. Soil urease activity and bacterial ureC gene copy numbers: Effect of pH. Geoderma. (2017) 285:1–8. doi: 10.1016/j.geoderma.2016.09.012
12. Qin J, Li M, Zhang H, Liu H, Zhao J, Yang D. ). Nitrogen Deposition Reduces the Diversity and Abundance of cbbL Gene-Containing CO(2)-Fixing Microorganisms in the Soil of the Stipa baicalensis Steppe. Front Microbiol. (2021) 12:570908. doi: 10.3389/fmicb.2021.570908
13. Xiao KQ, Bao P, Bao QL, Jia Y, Huang FY, Su JQ, et al. Quantitative analyses of ribulose-1,5-bisphosphate carboxylase/oxygenase (RubisCO) large-subunit genes (cbbL) in typical paddy soils. FEMS Microbiol Ecol. (2014) 87:89–101. doi: 10.1111/1574-6941.12193
14. Püschel D, Bitterlich M, Rydlová J, Jansa J. Drought accentuates the role of mycorrhiza in phosphorus uptake. Soil Biol Biochem. (2021) 157. doi: 10.1016/j.soilbio.2021.108243
15. Brooks JP, Tewolde H, Adeli A, Shankle MW, Way TR, Smith RK, et al. Effects of subsurface banding and broadcast of poultry litter and cover crop on soil microbial populations. J Environ Qual. (2018) 47:427–35. doi: 10.2134/jeq2017.09.0382
16. Brooks JP, Adeli A, Smith RK, McGrew R, Lang DJ, Read JJ. Bacterial community structure recovery in reclaimed coal mined soil under two vegetative regimes. J Environ Qual. (2019) 48:1029–37. doi: 10.2134/jeq2018.09.0349
17. Chaparro JM, Sheflin AM, Manter DK, Vivanco JM. Manipulating the soil microbiome to increase soil health and plant fertility. Biol Fertility Soils. (2012) 48:489–99. doi: 10.1007/s00374-012-0691-4
18. Wang G, Li X, Xi X, Cong W-F. Crop diversification reinforces soil microbiome functions and soil health. Plant Soil. (2022) 476:375–83. doi: 10.1007/s11104-022-05436-y
19. Firth AG, Brooks JP, Locke MA, Morin DJ, Brown A, Baker BH. Soil bacterial community dynamics in plots managed with cover crops and no-till farming in the Lower Mississippi Alluvial Valley, USA. J Appl Microbiol. (2023) 134. doi: 10.1093/jambio/lxac051
20. Baldrian P. Forest microbiome: diversity, complexity and dynamics. FEMS Microbiol Rev. (2017) 41:109–30. doi: 10.1093/femsre/fuw040
21. Suzuki N, Rivero RM, Shulaev V, Blumwald E, Mittler R. Abiotic and biotic stress combinations. New Phytol. (2014) 203:32–43. doi: 10.1111/nph.2014.203.issue-1
22. Leach JE, Triplett LR, Argueso CT, Trivedi P. Communication in the phytobiome. Cell. (2017) 169:587–96. doi: 10.1016/j.cell.2017.04.025
23. Enagbonma BJ, Fadiji AE, Ayangbenro AS, Babalola OO. Communication between plants and rhizosphere microbiome: exploring the root microbiome for sustainable agriculture. Microorganisms. (2023) 11. doi: 10.3390/microorganisms11082003
24. Ramamoorthy P, Samiappan S, Wubben MJ, Brooks JP, Shrestha A, Panda RM, et al. Hyperspectral reflectance and machine learning approaches for the detection of drought and root–knot nematode infestation in cotton. Remote Sens. (2022) 14. doi: 10.3390/rs14164021
25. Lowe A, Harrison N, French AP. Hyperspectral image analysis techniques for the detection and classification of the early onset of plant disease and stress. Plant Methods. (2017) 13:80. doi: 10.1186/s13007-017-0233-z
26. Khan A, Vibhute AD, Mali S, Patil CH. A systematic review on hyperspectral imaging technology with a machine and deep learning methodology for agricultural applications. Ecol Inf. (2022) 69. doi: 10.1016/j.ecoinf.2022.101678
27. Barbedo JGA. A review on the combination of deep learning techniques with proximal hyperspectral images in agriculture. Comput Electron Agric. (2023) 210. doi: 10.1016/j.compag.2023.107920
28. Crop Protection Network. Cotton disease loss estimates from United States- 2022 (2023) (Accessed 9/19/2024).
29. Creech RG, Jenkins JN, Tang B, Lawrence GW, McCarty JC. Cotton resistance to root-knot nematode: I. Penetration and Reproduction. Crop Sci. (1995) 35:365–8. doi: 10.2135/cropsci1995.0011183X003500020012x
30. Li X, Y. n. Zhang C, Jia DZ, He Z, Zhang T, Wang X. Declined soil suppressiveness to Fusarium oxysporum by rhizosphere microflora of cotton in soil sickness. Biol Fertility Soils. (2015) 51:935–46. doi: 10.1007/s00374-015-1038-8
31. Adeli A, Brooks JP, Miles D, Mlsna T, Quentin R, Jenkins JN. Effectiveness of combined biochar and lignite with poultry litter on soil carbon sequestration and soil health. Open J Soil Sci. (2023) 13:124–49. doi: 10.4236/ojss.2023.132006
32. Nadkarni MA, Martin FE, Jacques NA, Hunter N. Determination of bacterial load by real-time PCR using a broad-range (universal) probe and primers set. Microbiology. (2002) 148:257–66. doi: 10.1099/00221287-148-1-257
33. Liu J, Sui Y, Yu Z, Shi Y, Chu H, Jin J, et al. Soil carbon content drives the biogeographical distribution of fungal communities in the black soil zone of northeast China. Soil Biol Biochem. (2015) 83:29–39. doi: 10.1016/j.soilbio.2015.01.009
34. Koper TE, El-Sheikh AF, Norton JM, Klotz MG. Urease-encoding genes in ammonia-oxidizing bacteria. Appl Environ Microbiol. (2004) 70:2342–8. doi: 10.1128/AEM.70.4.2342-2348.2004
35. Selesi D, Schmid M, Hartmann A. Diversity of green-like and red-like ribulose-1,5-bisphosphate carboxylase/oxygenase large-subunit genes (cbbL) in differently managed agricultural soils. Appl Environ Microbiol. (2005) 71:175–84. doi: 10.1128/AEM.71.1.175-184.2005
36. Pineda A, Kaplan I, Hannula SE, Ghanem W, Bezemer TM. Conditioning the soil microbiome through plant-soil feedbacks suppresses an aboveground insect pest. New Phytol. (2020) 226:595–608. doi: 10.1111/nph.v226.2
37. Della Monica IF, Godoy MS, Godeas AM, Scervino JM. Fungal extracellular phosphatases: their role in P cycling under different pH and P sources availability. J Appl Microbiol. (2018) 124:155–65. doi: 10.1111/jam.13620
38. Takahashi F, Shinozaki K. Long-distance signaling in plant stress response. Curr Opin Plant Biol. (2019) 47:106–11. doi: 10.1016/j.pbi.2018.10.006
39. Majlesi S, Juutilainen J, Kasurinen A, Mpamah P, Trubnikova T, Oinonen M, et al. Uptake of soil-derived carbon into plants: implications for disposal of nuclear waste. Environ Sci Technol. (2019) 53:4198–205. doi: 10.1021/acs.est.8b06089
Keywords: soil, microbiome, soil health, plant stress, plant physiology, cotton, root-knot nematode, machine learning
Citation: Brooks JP, Wubben MJ, Smith RK, Waldbieser J, Samiappan S, Ramamoorthy P and Bheemanahalli R (2025) Predicting select soil health genes using hyperspectral reflectance in nematode-infected and drought stressed greenhouse cotton. Front. Soil Sci. 5:1499491. doi: 10.3389/fsoil.2025.1499491
Received: 20 September 2024; Accepted: 07 March 2025;
Published: 01 April 2025.
Edited by:
Duraisamy Saravanakumar, The University of the West Indies St. Augustine, Trinidad and TobagoReviewed by:
Luciano Kayser Vargas, Livestock and Irrigation, BrazilCopyright © 2025 Brooks, Wubben, Smith, Waldbieser, Samiappan, Ramamoorthy and Bheemanahalli. This is an open-access article distributed under the terms of the Creative Commons Attribution License (CC BY). The use, distribution or reproduction in other forums is permitted, provided the original author(s) and the copyright owner(s) are credited and that the original publication in this journal is cited, in accordance with accepted academic practice. No use, distribution or reproduction is permitted which does not comply with these terms.
*Correspondence: John P. Brooks, am9obi5icm9va3NAdXNkYS5nb3Y=
Disclaimer: All claims expressed in this article are solely those of the authors and do not necessarily represent those of their affiliated organizations, or those of the publisher, the editors and the reviewers. Any product that may be evaluated in this article or claim that may be made by its manufacturer is not guaranteed or endorsed by the publisher.
Research integrity at Frontiers
Learn more about the work of our research integrity team to safeguard the quality of each article we publish.