 Wasihun Mengiste
 Dereje Tsegaye1
- 1College of Agricultural Sciences, Arba Minch University, Arba Minch, Ethiopia
- 2Faculty Water Resources Engineering and Irrigation Engineering, Arba Minch University, Arba Minch, Ethiopia
- 3Department of Natural Resources Management, Wolkite University, Wolkite, Ethiopia
The characterization and classification of soils in irrigable areas are crucial for understanding soil types and nutrient status, which in turn help to optimize crop yield and to design soil management strategies. This research aimed to characterize and classify soils in the Achewa small-scale irrigation area in Itang special district of southwest Gambella, Ethiopia. Representative pits were excavated at three slope locations, and soil profiles were examined and described directly in the field. To classify soil types, the WRB for Soil Resources guidelines were used. Across horizons, texture classes varied from clay loam to clay, whereas bulk density was within acceptable limits for mineral agricultural soils. Additionally, soil pH ranged from neutral to moderately alkaline. Organic matter content varied among topography positions, with values of 3.78%, 2.96%, and 2.85% at pedons 2 and 3 in the study area. Total nitrogen content was classified as low in pedon 3 and medium on the other two pedons, whereas available phosphorus content was classified as very high in all slope positions. Soil CEC and PBS were high and very high across all slope positions, with the dominant soluble cations being Calcium followed by magnesium, potassium, and sodium and extractable micronutrients (Fe, Mn, Zn, and Cu) were high to medium. Based on morphological, physical, and chemical analysis three soil types were identified: Eutric Fluvisols (Loamic), Pellic Vertisols (Gilgaic, Hypereutric), and Haplic Vertisols (Gilgaic). Therefore, implementing site-specific soil management techniques is recommended to enhance and sustain soil fertility and optimize crop and vegetable production, for ensuring long-term soil productivity in the study area.
1 Introduction
Soil characterization is a critical component for understanding soil, classifying it, and providing a comprehensive view of the environment (1). Understanding the chemical and physical properties of soil is possible through soil characterization. Crop production generally involves complex interactions with the environment (soil and nutrient dynamics). Therefore, soil properties must be studied in order to make them more productive through appropriate management.
The process of soil classification plays a crucial role in structuring knowledge and promoting the exchange of experiences and technologies. It primarily aims to group soils into classes based on comparable properties and susceptibility to external factors (2).
High-quality soil classification is fundamental for understanding soil behavior and provides a solid foundation for efficiently assessing soil suitability and managing fertility (3). However, previous soil surveys in Ethiopia have been largely confined to specific regions (4). As a result, many parts of the country still lack comprehensive soil information, despite its vast landmass and diverse range of soil types.
Soil types and characteristics in Ethiopia vary significantly due to factors such as climate, topography, parent material, and vegetation, which differ in their influence across regions (5, 6), This diversity underscores the importance of soil classification as a tool for facilitating technology transfer and information exchange among stakeholders (7). Despite these needs, Ethiopia’s soil information database remains limited due to insufficient survey activities, attributed to the country’s expansive area and complex topography (8).
Sustainable soil use necessitates a thorough understanding of soil characteristics and fertility management. These factors provide critical insights into soil type, fertility, and productivity, which are essential for supporting livelihoods, ensuring food security, and reducing the risk of malnutrition (9–11). As a consequence, there is currently only limited soil information available in Gambella region relative to its large size (4, 12). Due to farmers’ misuse of agrochemicals as the primary means of nutrient management and their improper use of soil and water management techniques, there is significant deterioration of the soil and pollution of the environment (13).
In the Gambell Region particularly in the current study area specifically Itang special district, Achewa small-scale irrigation area there is a problem of lack of information on soil characterization and classification. The dominant soil type is not known. Consequently, the agricultural experts do not know the available and deficient nutrients in the soil to supply the required amount of inorganic or organic fertilizers to the irrigated fields. This lack of soil information has posed significant challenges in implementing appropriate soil management practices and effectively transferring technology to benefit the stakeholders. Consequently, the effective distribution of up-to-date soil information to the intended recipients has encountered obstacles. To address this critical knowledge gap, a comprehensive soil characterization and classification study was conducted in the Achewa Small-scale irrigation scheme, therefore, the primary objective of this study was to thoroughly characterize and classify the soils in the Achewa Small-Scale Irrigation Area, Itang Special District, Southwest Gambella, Ethiopia.
2 Material and methods
2.1 Study area description
The research was conducted within the Achewa small-scale irrigation scheme, which is situated in the Itang special district of the Gambella region in southwestern Ethiopia. The district is located approximately 50 km west of Gambella city and 837 km west of Addis Ababa. More specifically, the Achewa small-scale irrigation scheme is located within the Itang special district, specifically at coordinates 8°12’37.97”N and 34°14’33.91”E. The scheme sits at an altitude of 440 meters above sea level (m.a.s.l) and features a level to gentle slope (Figure 1).
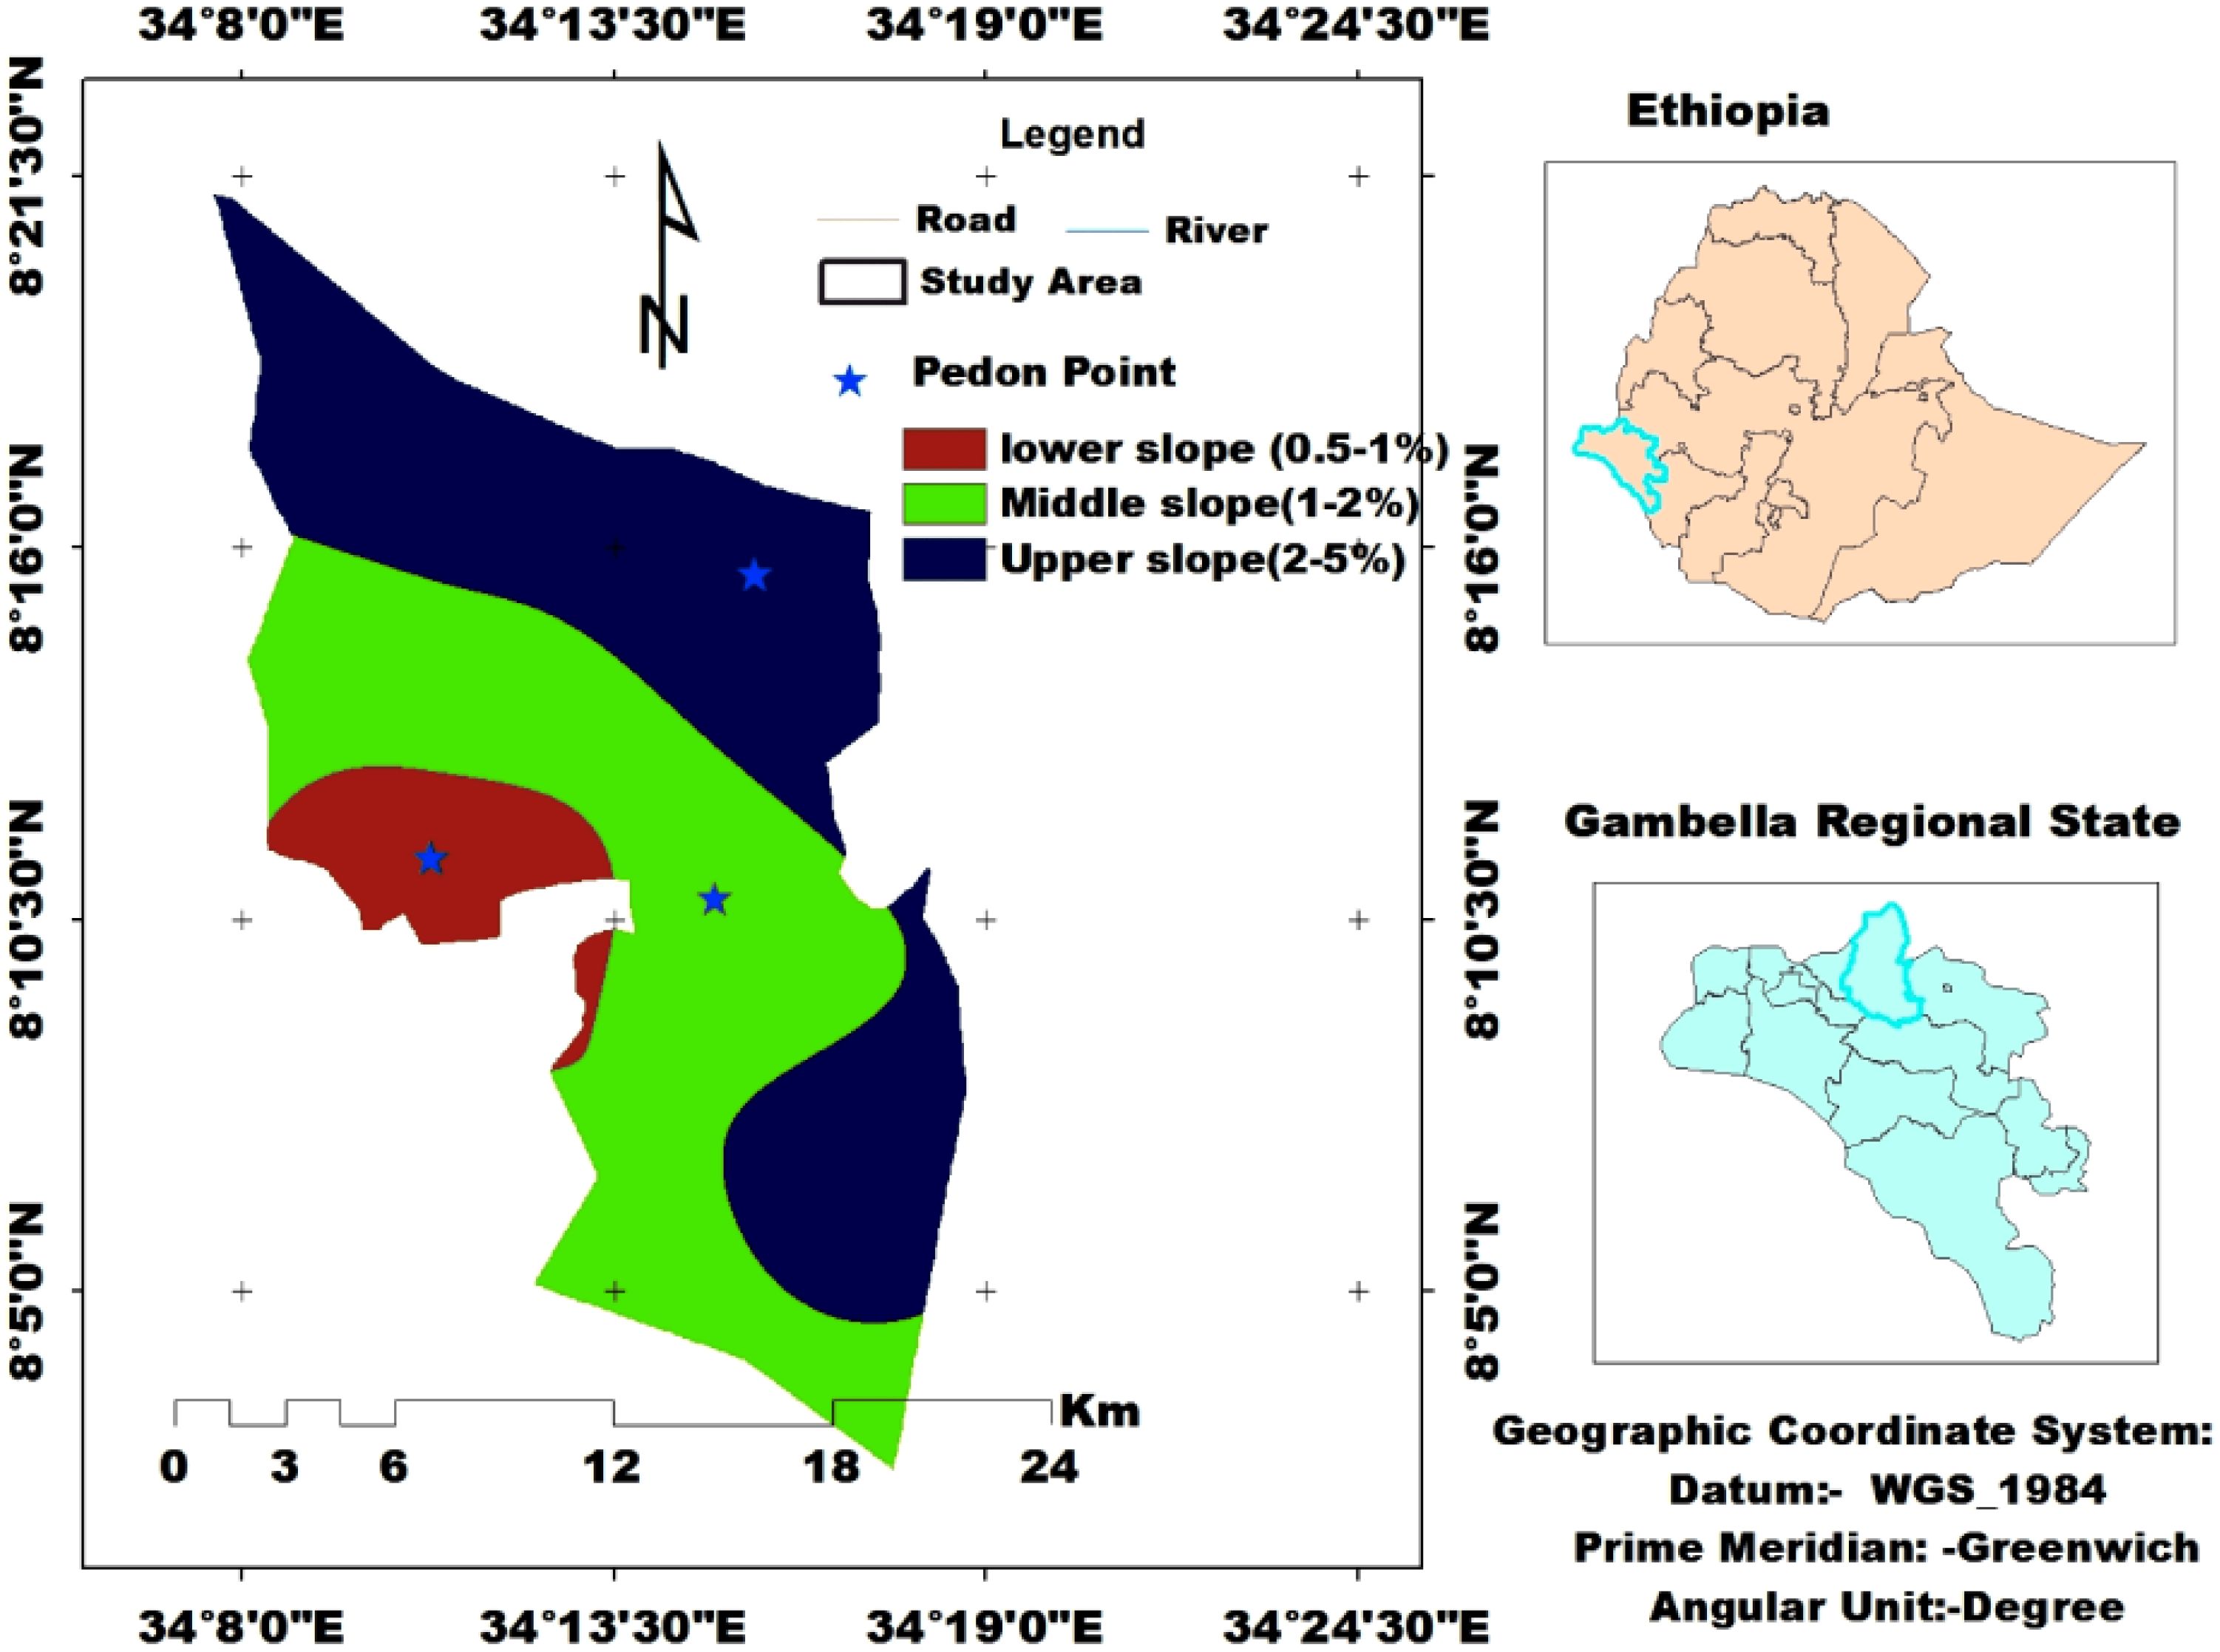
Figure 1. Map of the study area.
2.1.1 Climate
The study area has an unimodal rainfall pattern, with the rainy season usually beginning in April or June and lasting until October. During May and October, intense rainfall events take place. However, the driest months occur in February and March. In terms of temperature, the average low temperature during these dry months is approximately 21.5°C while the average high temperature is around 39.85°C (Figure 2). Based on the meteorological data from 2010 to 2020, it is clear that the dry season is distinguished by hot temperatures and low humidity. The region experiences an average annual rainfall of 1024.9 mm, which is characterized by erratic and uneven distribution across seasons and years. The mean annual minimum and maximum air temperatures in the area are recorded at 21.19°C and 39.84°C, respectively. Smallholder farmers living in the region heavily depend on rain-fed and irrigated farming practices. Their livelihoods are affected by this climate pattern, particularly during the wet season where flooding occurs and the dry season resulting in drought, putting their crops and overall food security at risk (14).
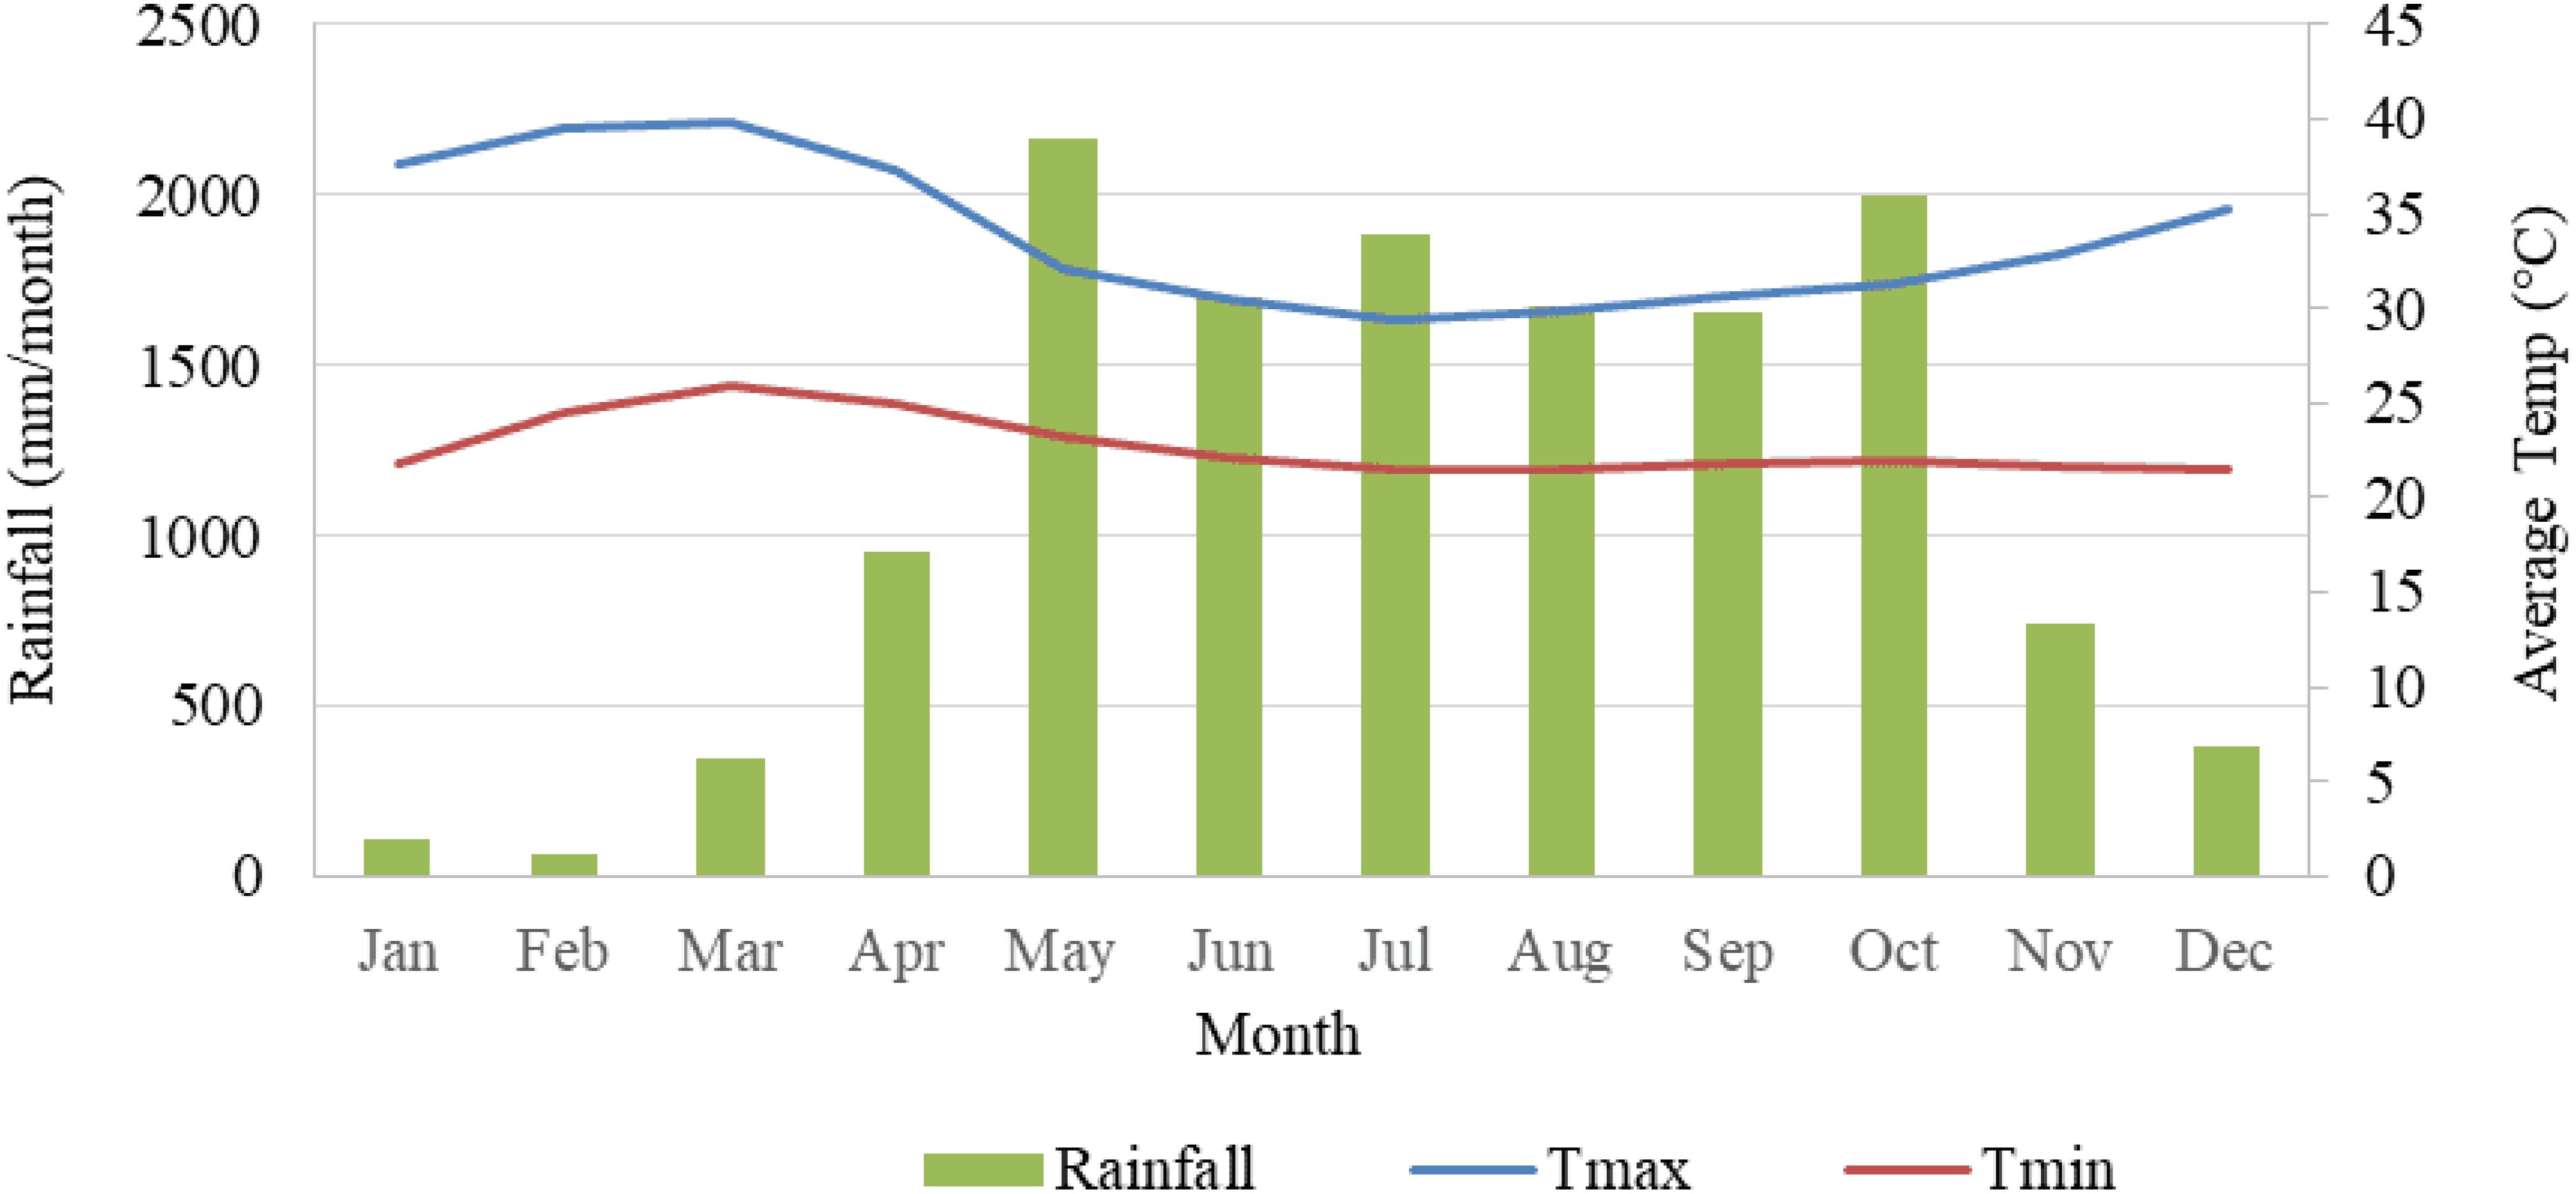
Figure 2. Monthly mean temperature and rainfall of the study area (2010-2020).
2.1.2 Geology and soil
The geology of the study area consists of sandstone, quartz, and Miocene effusive rocks (Gog Basalt), which overlap with Pliocene sedimentary formations (Alwero Formation), crystalline basement rocks, and extensive Quaternary deposits (15). The soil composition of the Gambella region in Ethiopia was uniquely favorable for agriculture. There are different types of soil in the region, including Vertisols, Cambisols, Luvisols, Gleysols, Nitisols, Leptosols, Fluvisols, and Planosols (16). The district is predominantly composed of Vertisols, Fluvisols, and Luvilsols, with the formation of an alluvial plain being a significant geological feature in the area. The soil in this region is characterized by clayey texture compositions, which contribute to its high water-holding capacity. Furthermore, the soil exhibits notable levels of organic carbon and total nitrogen content. Alluvial sediments from the abundant rivers replenished the soil regularly and contributed to improved crop yields (14). Moreover, Gambella had rich mineral deposits, which included gold, copper, and limestone, making it a significant contributor to Ethiopia’s mining industry and overall economic output.
2.1.3 Hydrology
The Gambella National Regional State was recognized as one of the most abundant water resource regions in Ethiopia. Rivers such as the Baro, Akobo, Alwero, and Gillo, along with their tributaries, provided water resources that supported both present and future irrigation demands (17). Initial irrigation schemes had been established in the region, with a total irrigated area of 1315 hectares (ha). Out of this area, 415 ha were on a small scale, while 900 ha were on a medium scale. These rivers originate from the Ethiopian highlands (2000-3500 m) in the east and flow into the Gambella plain (450 m) located in the west (18).
2.1.4 Farming activities
Gambella Regional State is endowed with highly diversified natural resources, particularly a large expanse of arable land, ample rainfall, fertile soil, and plenty of surface and groundwater, which renders the region best suited for agricultural development. Despite the presence of abundant natural resources, the livelihood of people in the region is subsistence and, hence, a strong vulnerability to food shortage. This is mainly due to low agricultural productivity, resulting from traditional farming, such as traditional farming method used in the region. The people in the region primarily rely on traditional tillage methods, such as Shella plowing, instead of oxen or modern machinery. This method minimizes soil disturbance by targeting specific spots for seed planting, helping to preserve soil structure and fertility by reducing the impact on soil aggregates. However, Shella plowing significantly limits the amount of land that can be cultivated and reduces overall productivity, contributing to food insecurity. Furthermore, low human and physical capacity, combined with limited access to agricultural technologies and extension services, exacerbates the challenges to agricultural development in the region (19).
The farming system in Itang Special Woreda is characterized by smallholder subsistence farmers who rely on both rain-fed and irrigated agricultural practices. Livestock also plays an essential role in the farming system, providing draught power for cultivation as well as food and income to households. The primary sources of livelihood for the community include small-scale crop farming, predominantly maize intercropped with cowpea and sorghum, animal husbandry, and fishing, hunting, and wild food collection such as fruits, leaves, and roots (18). The unique cultural practice performing during cultivation in the area is leaving weed material within the crop fields rather than removing it for animal fodder or other purposes. This practice effectively mulches the soil, helping to conserve moisture and promoting the decomposition of organic matter directly within the fields. As the weed material decomposes, it contributes to the addition of organic nutrients, enriching the soil over time.
2.1.5 Demography
Based on the 2017 Ethiopian population projection (20), the Gambella region comprises approximately 436,000 individuals and is considered sparsely populated. Within the Gambella region lies the Itang special district, which is home to a total population of 42,000 people spread across 21 Kebeles (small local administration unit). The district’s population density is estimated to be around 20 persons per square kilometer.
2.2 Field survey and soil description
The free-soil survey approach was used to identify profile excavation locations along the landform, in order to have a general overview of the variation in the land surface of the irrigation site in the study area. Soils within the irrigated site are carefully examined and differentiated along the landscape based on observable site and soil characteristics such as soil slope, soil depth, and texture by following the free survey method as reported by Dent and Young (21). To determine the number of pedons based on heterogeneity of soil, about thirty (30) augers samples were taken. Then after, the study area was categorized into three soil units namely: upper slope, middle slope, and lower slope. In each identified unit, three representative soil pedons (2m width × 2m length × 2m depth) were excavated and described in situ, following the guidelines for field soil description (22).
Soil color was determined using the Revised Munsell Soil Color Chart (23). Soil structure was described in terms of the sequence: grade, size (class), and type (shape) of aggregates whereas horizon boundaries were described in terms of depth and topography. The soil consistence is identified at dry, moist and wet moisture conditions. Both disturbed and undisturbed soil samples 10 were collected from each identified genetic horizon. Disturbed composite soil samples was taken from the all identified horizons from bottom to top layer by using an auger to measure the selected soil physical and chemical properties, where as undisturbed soil samples was taken by core sampler to measure the soil bulk density. After the composite soil sub-samples were taken and packed, it was air dried and finally ground and sieved by 2 mm sieve to the analysis of physical and chemical properties of soil.
2.3 Soil laboratory analysis
The soil samples were air-dried, ground, and sieved through a 2 mm sieve to remove coarse fragments and standardize the sample for general soil analysis. For the determination of organic carbon (OC) and total nitrogen (N), a complete aliquot of the 2 mm-sieved soil was further ground to pass through a 0.5 mm sieve. Particle size distribution was determined by the Bouyoucos hydrometer method (24), after destroying OM using hydrogen peroxide (H2O2) and dispersing the soils with sodium hexametaphosphate (NaPO3). soil The bulk density was determined using the core sampling method described in Blake and Hartge (25) while total porosity was calculated using the particle density and bulk density, based on the following relationship:
Where TP is total porosity, BD is bulk density and Ps is particle density.
The soil pH was determined by measuring soil-water suspensions at a ratio of 1:2.5 using a standard glass electrode. Organic carbon (OC) content of the soil was determined following the wet combustion method (26), which was then converted to organic matter by multiplying it by 1.724. Total nitrogen content was determined using the micro-Kjeldhal method (27). To determine available phosphorus, the Olsen method was employed, with sodium bicarbonate serving as the extractant (28). Cation exchange capacity was determined by 1 N neutral ammonium acetate method in which it was, subsequently, estimated by distillation of ammonium that was displaced by sodium (29). An atomic absorption spectrophotometer (AAS) was utilized to measure the levels of exchangeable calcium (Ca2+) and magnesium (Mg2+), whereas a flame photometer was employed to measure potassium (K+) and sodium (Na+). To determine the percentage of base saturation (PBS), the combined amounts of exchangeable bases were divided by the cation exchange capacity (CEC). Calcium carbonate content was determined following the acid neutralization method in which the soil carbonate was decomposed by excess standard HCl solution and back-titrated with standard NaOH after filtering it (30). Available micronutrient (Fe, Mn, Zn, and Cu) contents of the soils were extracted by the DTPA (diethylenetriaminepentaacetic acid) method (31), and the contents in the extract were determined by atomic absorption spectrophotometer.
2.4 Soil classification
The classification of the soil at the research site was determined using the World Reference Base for Soil Resources (WRB). The WRB serves as an internationally recognized framework for classifying, correlating, and communicating soil properties based on their morphological, physical, and chemical characteristics (32).
2.5 Statistical analysis
Data obtained from field and laboratory was subjected Simple descriptive statistics were used to measure the variability of the soil properties within the horizons of the pedon and coefficient of variation (CV) method, as outlined by Wilding and Drees (33). Was employed to quantify and classify the variability. The CV values were categorized into three groups: low variability (CV< 15%), moderate variability (15%< CV< 35%), and high variability (CV > 35%). Pearson Correlation analysis was also performed to explore relationships between soil properties. All analyses were carried out using STATA software (version 18).
3 Results and discussion
3.1 Soil morphological properties
3.1.1 Soil depth
The soil depths of the studied pedons were very deep and all pedons greater than (>150 cm) cm, indicating that the soils of Achewa irrigation were well developed, as per the rating by the FAO (22). The amount of plant nutrients and water available to plant roots are determined by the rooting depth of the soil and the depth of the soils does not restrict the plants’ roots growth and the availability of nutrients and water in the study area, furthermore, the ample rooting zone supports better water retention and nutrient reserves, contributing to sustainable agricultural practices and improving the resilience of crops during dry periods.
3.1.2 Soil color
The soil color of the pedon 1 varies from brown (7.5YR4/2, dry) to dark brown (7.5YR3/2) when moist, at surface soil that have slight variation in value and Chroma; dark red (2.5YR 3/6) to brown (10YR 4/3) in dry and dark reddish brown (2.5YR3/3) to brown (10YR 4/3) in moist in sub-surface areas of pedon 1. This was observed at lower slope areas of irrigated site (Table 1). At middle slope (pedon 2) of irrigated fields the color of the soil under profile 2 was very dark brown (10YR2/2) in dry to black (10YR2/1) in moist) at surface soil (Table 1). In the subsurface layers, the color ranged from brown (10YR 4/3) to yellowish brown (10YR 5/4) in dry conditions and from dark reddish-brown (2.5YR 3/3) to dark yellowish brown (10YR 4/4) in moist conditions, reflecting changes due to organic matter content and moisture variation. On the other hand, soil color patterns in profile 3 upper slope of irrigated field was showed similar hue and Chroma slight variation in value dark brown (10YR 3/3) in brown (10YR 4/3, moist) in the surface soil; very grayish brown (10YR 3/2) to dark brown (10YR 3/3) when dry and dark grayish brown (10YR 4/2) to brown (10YR 4/3) moist in the sub surface (Table 1).

Table 1. Physical properties of the soils of the Achewa small-scale irrigation scheme.
The dark brown color observed in the surface horizons of pedons at the middle and upper slope positions is likely due to a relatively higher accumulation and decomposition of organic matter (OM) in these areas. In line with this finding, many authors reported that the surface horizon have darker color than the corresponding subsurface horizons (4, 34), whereas the a brown and yellowish-brown subsoil may indicate mineral accumulation.
The structure of all the studied pedons showed variations in grade, size, and form in both the surface and subsurface horizons. In pedon 1, located in the lower slope position, the surface horizon (Ap) displayed a medium to fine granular structure, while the subsurface horizons were characterized by a weak, fine, massive to sub-angular blocky structure. In contrast, pedon 2 and pedon 3, situated in the middle and upper slope positions respectively, showed a range of structures from strong, very coarse angular blocky to strong, very coarse sub-angular blocky in the surface horizons, and moderate, coarse angular blocky to strong, coarse sub-angular blocky in the subsurface horizons (Table 1). Similar results were reported by Yitbarek et al. (4) who found granular soil structure in the surface horizons that changed to angular and sub-angular structure in the subsurface pedons. As the soil depth increases, the clay content rises, resulting in a stronger and coarser.
Consistency: The moist consistency in the sub-surface varied from very friable to very firm, while the wet consistency also varied from non-sticky/non-plastic to sticky/plastic (Table 1). This variation was observed in all three pedons particularly pronounced in pedons 2 and 3. These pedons also had a high clay content, which likely contributed to their exceptional level of stickiness. The friable consistency observed in the surface soils of pedon 1 may be attributed to its high organic matter content. The presence of a higher soil organic matter content in the surface soils of pedons plays a significant role in the development of friable consistency (8). This is an important characteristic as the friable consistency indicates that the soils are workable when they contain an appropriate moisture content (35).
Horizon boundaries: the lower boundaries of surface horizon in pedon 1 were abrupt and smooth in surface and sub-surface of the second layers that changed gradual and wavy in the sub surface layers. This could be due to repeated anthropogenic influence like plowing the land for crop production (36). Pedon 2 had clear and smooth lower boundaries of surface horizons grading to clear and wavy in the subsurface horizons as these lands. The smooth boundary in the A horizon reflects uniform deposition and limited disturbance, likely due to stable surface conditions. In contrast, the wavy boundary in the Biw horizon can be attributed to subsoil processes like clay movement, shrink-swell activity, and the influence of slickensides, which create undulating patterns over time (37), whereas in pedon 3, gradual and wavy boundaries dominate, indicative of slower pedogenic processes on the upper slope. Overall, these differences point towards significant human impacts on the soil’s physical properties, possibly caused by agricultural practices. The amount of clay in soil has a significant influence on its structure, as indicated by Moshago et al. (38), and the soil structures at the Achewa irrigation farm studied had varying soil structures.
3.2 Physical properties
3.2.1 Particle size distribution
The particle size distribution showed that the soils were generally clay loam, sandy clay, and clay in pedon 1 horizon Ap, B1, B2 and C horizons, respectively, whereas pedons 2 and 3 in the middle and upper slope position the particle size distribution were clay throughout the depth (Table 2).
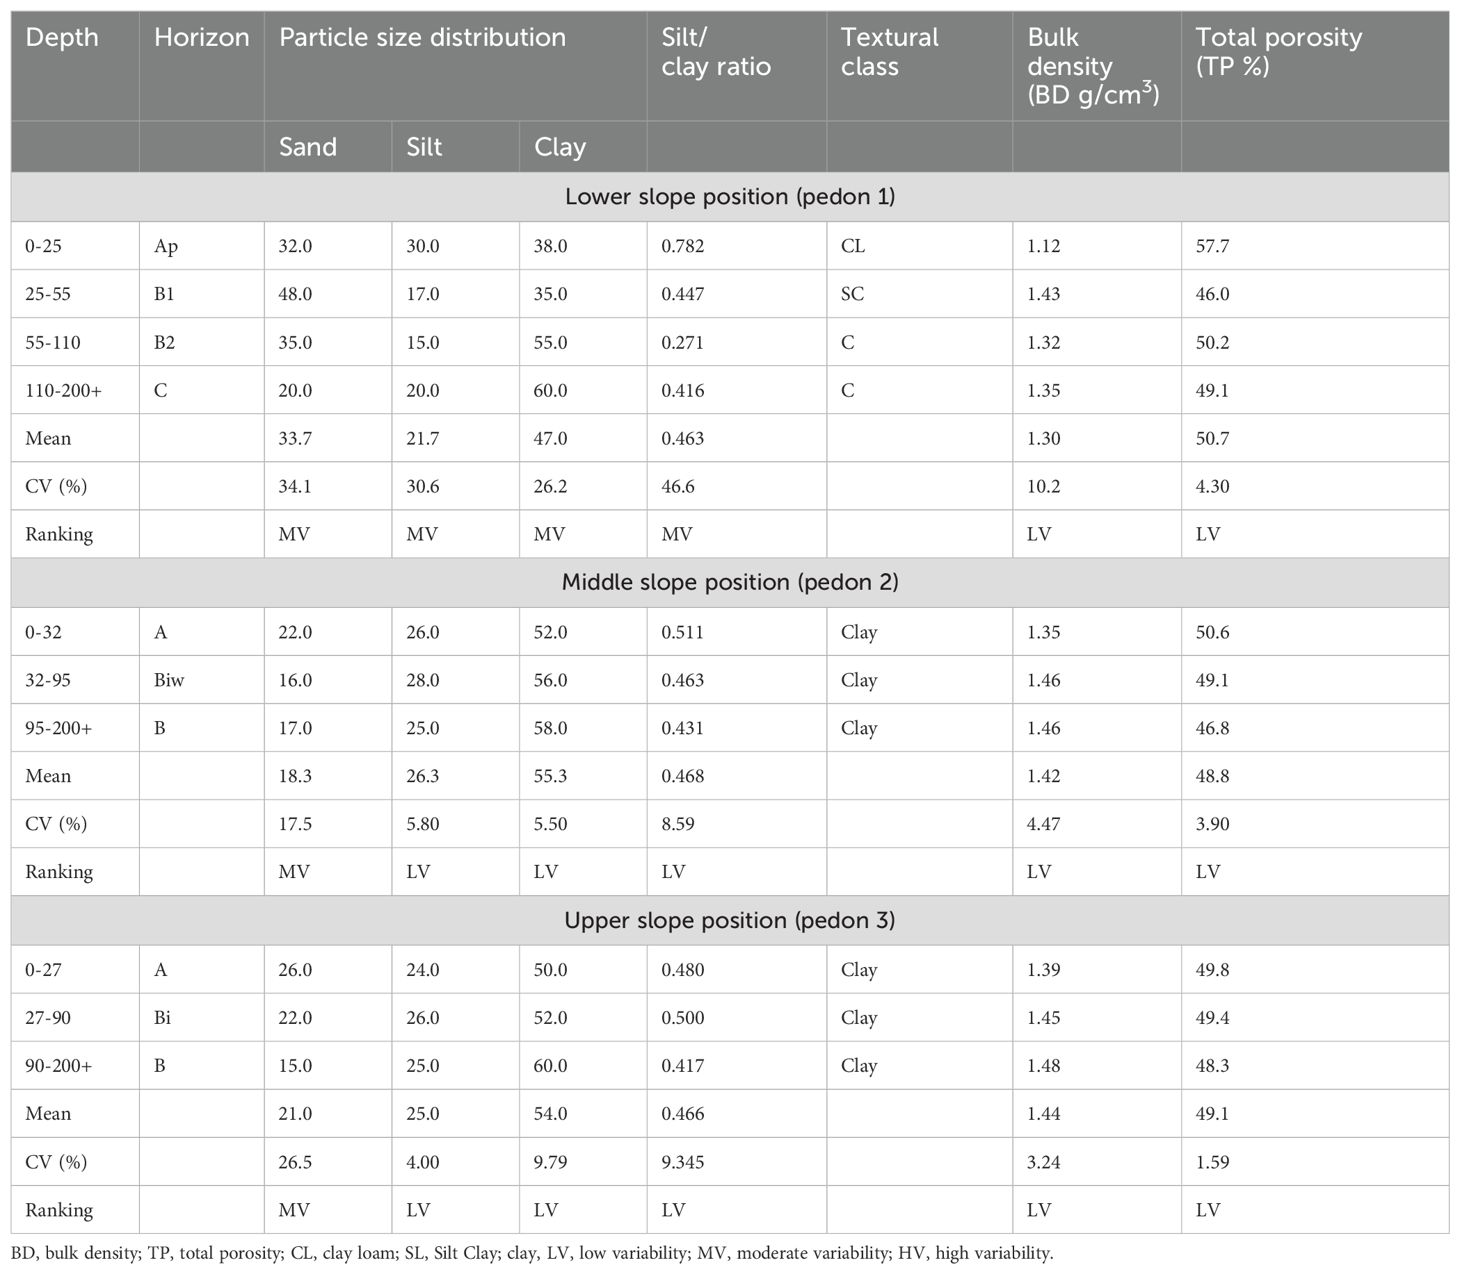
Table 2. Soil texture, Bulk density (BD), total porosity (TP), and silt-to-clay ratio Achewa small-scale irrigation schemes.
The analysis of soil particle size distribution across the three pedons reveals distinct variations in the composition of sand, silt, and clay, which are critical for understanding soil behavior and its implications for land use. In pedon 1, the lower slope position, the particle size distribution shows a notable increase in sand content from the surface horizon (0-25 cm) to the second layer (25-55 cm). Specifically, the sand content rises from 32.0% in the Ap horizon to 48% in the B1 horizon, while silt decreases from 30.0% to 17.0%, and clay remains relatively stable at 38% and 35.0%, respectively. This shift indicates a transition towards a sandy clay texture in the B1 horizon, classified as sandy clay (SC). The increase in sand content can be attributed to several factors, including the natural processes of sediment deposition and erosion that occur on slopes. As water moves down the slope, it tends to transport finer particles away, leaving behind coarser sand particles, which can lead to a higher sand content in the subsurface layers (34).
In contrast, the middle slope position (pedon 2) and upper slope position (pedon 3) exhibit different particle size distributions. For instance, in pedon 2, the A horizon shows a lower sand content of 22.0%, with a higher clay content of 52.0%, indicating a clayey texture. Similarly, pedon 3 has a sand content of 26% in the A horizon, with clay content also at 50%. These differences highlight the influence of topography on soil formation processes, where the lower slope position tends to accumulate coarser materials due to gravitational forces and water movement, while the upper and middle slopes retain finer particles due to less erosive forces. These differences reflect the influence of topography on soil formation, as the lower slope tends to accumulate coarser materials due to gravitational forces and water movement, whereas the upper and middle slopes retain finer particles due to reduced erosive forces. The overall trend across the pedons suggests that soil particle size distribution is significantly affected by slope position, influencing soil fertility, drainage, and erosion potential. These findings align with studies by Chikezie et al. (39) and Malgwi et al. (40), who reported similar trends.
3.2.2 Silt clay ration
The silt/clay ratio of the all the pedons surface horizon were higher than the sub-surface soils (Table 2). The higher silt/clay ratio in the surface horizon and decrement depth wise showed that the presence of clay migration from the upper to the lower horizon which may be attributed to illuviation and pedoturbation processes and an indication of sub soil horizons were more weathered than surface horizons. These results are consistent with findings by Alemayehu (41), which also reported a depth-wise decrease in the silt/clay ratio due to clay migration.
3.2.3 Soil bulk density, total porosity
The bulk density of the three pedon soils in the study area ranged from 1.12 to 1.48 g/cm³, with low variability observed in all pedons. This low variability can be attributed to the similarity in the parent material of the soil, management practices, and climatic conditions. The bulk density of soils generally increased from the surface horizon to the subsurface horizon, likely due to structural aggregation resulting from relatively high organic matter (OM) content. Regardless of landform, there was an observed increase in bulk density with depth. This can be attributed to the weight of the overlying soil and the lower organic matter (OM) content present in the subsurface layers. The acceptable range of bulk density for inorganic agricultural soils is 1.3 to 1.4 g/cm³ (Table 2). Therefore, the value of BD of the surface horizon in the studied pedon soils falls within the acceptable range and should not impede root penetration and tillage practices within the soil group. Soils with higher bulk density can inhibit root penetration, aeration, nutrient and water movement, and the accumulation of toxic gases and root exudates.
The total porosity of the studied soils varied across different slope positions, with the highest mean values observed at the lower slope position (pedon 1) ranging from 46.001% to 57.716%, followed by the upper slope position (pedon 2) ranging from 46.8% to 50.6%, and the middle slope position (pedon 3) ranging from 48.3% to 49.8%. The findings of this study align with previous research (38) that demonstrated a similar trend, where soils with finer textures showed higher porosity compared to those with coarser textures. This can be attributed to the increased presence of micropores in the finer textured soils, which contribute to their enhanced porosity.
Comparatively, the total porosity was also higher in the surface horizon as compared to sub-surface horizons in the studied irrigable area. According to the rating given by the FAO (22), the percent average total porosity across slope position pedons was categorized as very high (> 40%). Indicating that root growth was not restricted. The coefficient of variation showed low variability across all pedons and horizons, suggesting similar parent material and soil structure within each pedon. However, total porosity decreased with depth, except for pedon 1 at a lower slope position. Total porosity decreased with depth, except for pedon 1 at a lower slope position. The decrease in porosity can be attributed to low organic matter content, high bulk density, and the filling of pore spaces by translocating clay particles. This finding is consistent with a previous study (42) that reported a similar decrease in total porosity with increasing soil depth. The decline in porosity can be primarily attributed to two factors: a reduction in organic matter content and an increase in soil compaction.
3.3 Soil chemical properties
3.3.1 Soil pH and electrical conductivity
Soil pH measured in a 1:2.5 soil-to-water ratio (pH in H2O) is preferred over pH measured with KCl or CaCl2 because it more accurately reflects the soil’s natural acidity under typical field conditions. This method simulates real-world interactions with water, making it more relevant for practical applications. KCl and CaCl2, which neutralize soil colloids or displace ions, can yield lower pH readings and may not represent natural soil behavior as effectively (43).
The pH levels in the soil varied across different slope positions, the surface and sub-surface pH values were between 6.80 and 7.34 on the lower slope position (pedon 1), 6.71 to 7.93 on the middle slope (pedon 2), and 6.41 to 7.30 on the upper slope (pedon 3). The middle slope gradient had the highest pH values, followed by the lower slope, and the upper slope positions (Table 3). The variation in pH values among slope positions (pedons) could be influenced by the specific physiographic conditions of each site within the irrigated area, which may have exposed cations to leaching. Additionally, the sub-surface horizon consistently exhibits higher pH values than the surface horizons, except for pedon 1, which indicates the influence of natural induced activities like leaching and irrigation processes (Table 3). This study is consistent with the findings of Assen and Yilma (44), who observed the washing out of basic cations from the surface horizon and their deposition at lower horizons, resulting in higher pH values. Additionally the elevated pH in the sub-surface horizon may be attributed to the reduced release of H+ ions due to decreased organic matter decomposition, which is associated with lower organic matter content at greater depths (45).
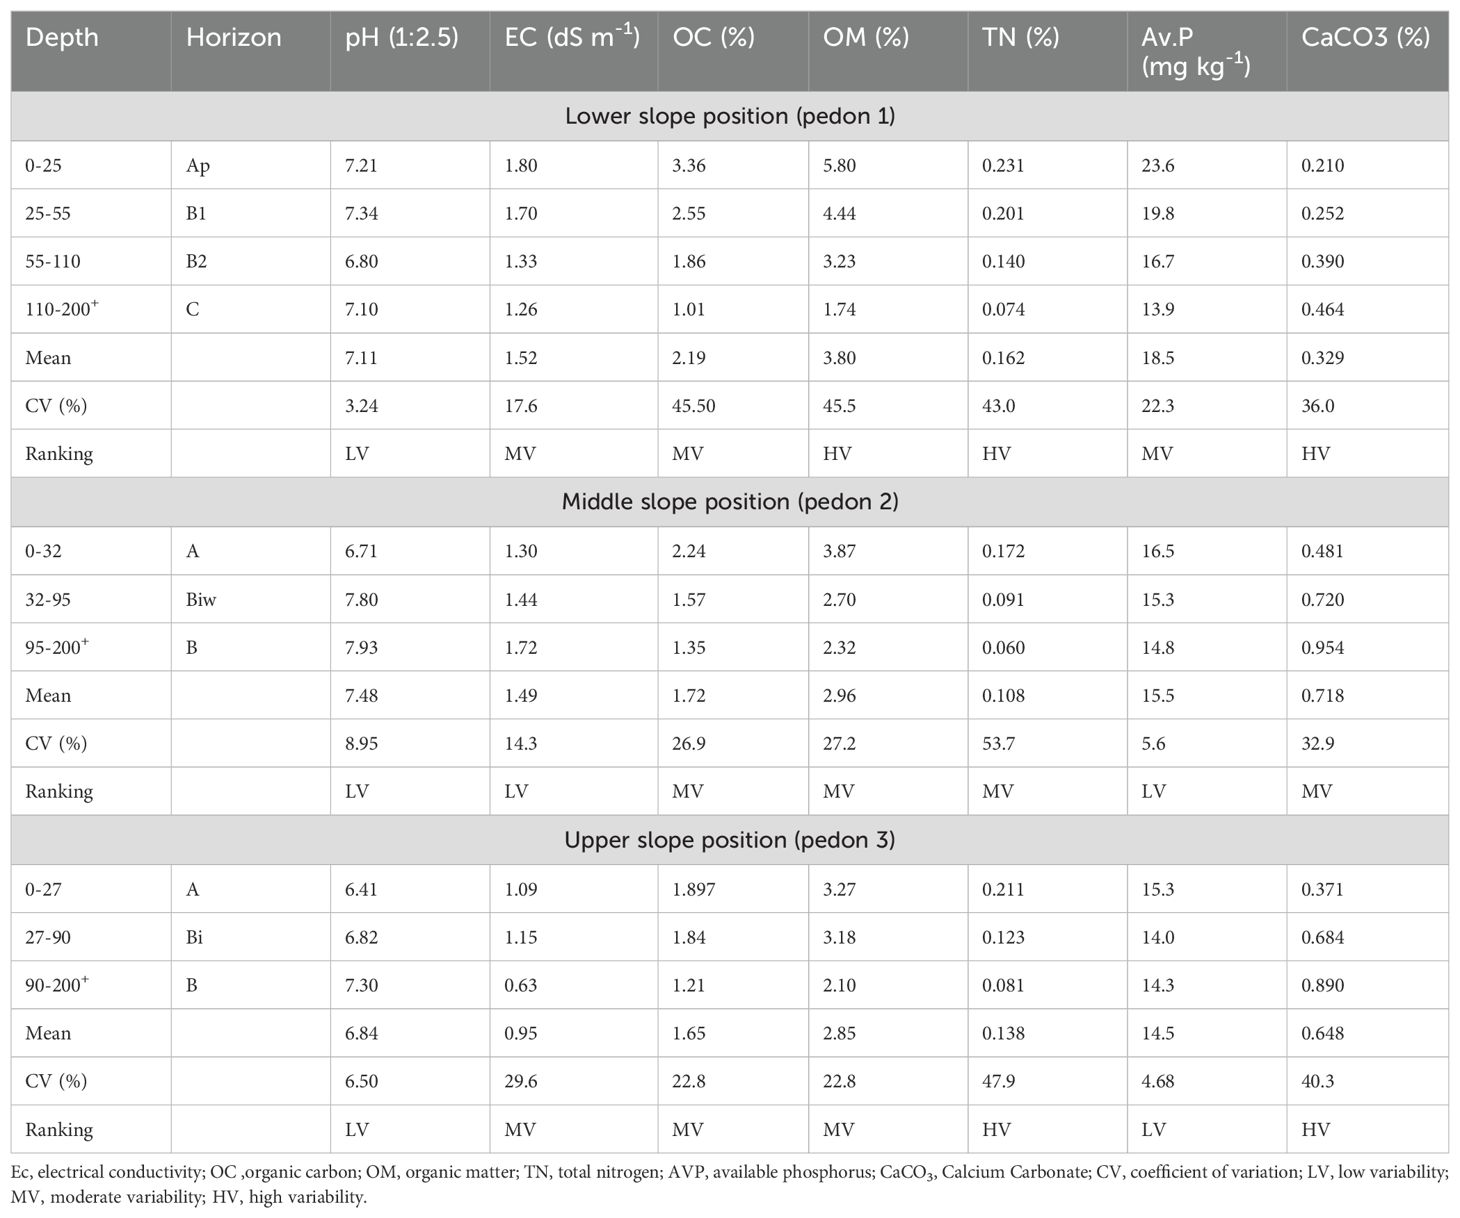
Table 3. Soil pH, electrical conductivity, organic carbon, total nitrogen, available P contents of soils of Achewa small scale irrigation scheme.
Based on the classification provided by Tekalign and Haque (46), the lower slope position (pedon 1) is categorized as neutral, the middle slope (pedon 2) falls within the range of neutral to moderately alkaline, and the upper slope (pedon 3) is classified as slightly acidic to neutral. This indicates that a pH range of 6 to 7.5, which falls within the mean pH value of the studied pedon soil, is considered preferable for the growth of most crops and soil microorganisms. Therefore, the pH conditions in the studied pedon soil align with the optimal range for supporting healthy plant growth and microbial activity.
The electrical conductivity (EC) measurements for the saturation extract of the three soil profiles show variations in EC values among pedons. In the lower slope (pedon 1), the EC values range from 1.26 to 1.80 dS m-1, in the middle slope (pedon 2), EC values vary from 1.30 to 1.72 dS m-1, whereas in the upper slope (pedon 3), the EC values are lowest, ranging from 0.6333 to 1.15 dS m-1. The higher EC values were observed in pedon 1 as compared to the other profiles this could be attributed to when soil is repeatedly irrigated over time; the water applied carries dissolved salts into the soil profile. These salts can then accumulate in the upper layers of the soil, increasing the EC values.
3.3.2 Organic matter, total nitrogen, available phosphorus and calcium carbonate
The average soil organic matter (SOM) content in both surface and sub-surface horizons across all locations was found to be 3.80, 2.96 and 2.85% in pedons 1, 2 and 3 respectively (Table 3). The SOM content showed a decreasing trend with increasing depth, which can be attributed to the accumulation of organic materials primarily in the surface soils. These findings align with previous studies that have reported similar patterns of SOM distribution and depth-dependent variations (38). The surface layer of all profiles had a relatively higher SOM content than the sub-surface horizon indicating low mineralization rates. Mulching was a common practice in the study area during land preparation and weeding, which may have contributed to the increase in SOM content. The addition of organic materials through mulching and the low rates of mineralization in the soil could be attributed to the higher SOM content. Additionally, the proximity of the area to the river bank, where fluvial materials are deposited, may have contributed to the higher SOM content due to the nutrients and organic matter carried by rivers. Similar findings were reported by Assefa (47), who noted that soil organic matter tends to be high in the fluvisols. The Pearson correlation analysis showed strong to moderate positive correlations and very high significant correlations between OM and TN, Fe, and Av. P (r = 0.95***, 0.93***, and 0.650***, P ≤ 0.001). However, OM showed negative correlations with CEC and PBS of the soil (Table 4).
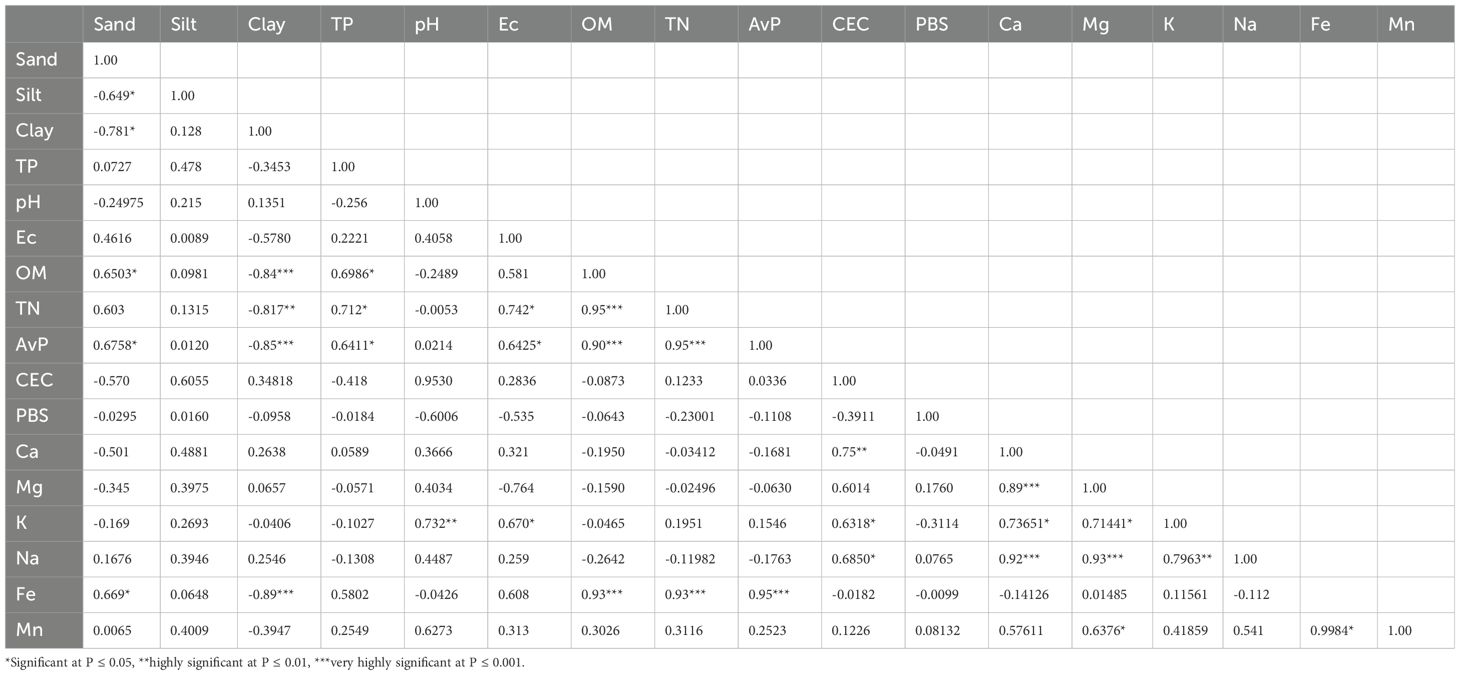
Table 4. Pearson correlation coefficient.
The coefficient of variation revealed high to moderate variability across all slope positions, with values of 45.5%, 27.2%, and 22.8% in pedons 1, 2, and 3, respectively. This can be attributed to the fact that all pedons are derived from a similar parent material and are exposed to similar environmental conditions except pedon1 which shows high variability, such as climate, vegetation, and topography (48). According to the classification suggested by Mamo et al. (49), the SOM levels of the lower slope position (pedon 1) were classified as medium to high. Similarly, the medium slope (pedon 2) was classified as medium, and the upper slope position (pedon 3) fell within the low to medium range for the Achewa irrigable area.
The total nitrogen content (TN) in the irrigated area a relatively decreasing pattern with the depth of soil. The value ranges from the highest in the surface horizon of lower slope position (0.231) and lowest in the middle slope position (0.172) in the surface horizon and the subsurface horizon varied from 0.06 to 0.201 in the sub-surface horizon (Table 3). The TN content of the surface horizons was higher than the subsurface soil horizons, and it followed a similar pattern to that of OM in all the studied profiles, implying a strong relation between OM and TN in the soil system. The amount of Om and TN was relatively high (5.80 and 0.231%, respectively) at the lower slope position of the surface horizons, which might be attributed and correlated to the biomass turnover of the grass.
In line with this result (7), indicated that as much as 93 to 97% of the total N in soils is closely associated with OC. Based on the rating of total N set by Tekalign (50), the mean total N contents of the study area of pedons 1 and 2 were rated as medium (0.12 and 0.25%) while pedon 3 rated as low. The high total nitrogen content in the surface layers suggests that the soils in the study area have the capacity to support proper crop growth and development. The Pearson correlation also revealed a strong and significant positive correlation (r = 0.95***, P ≤ 0.001) between total nitrogen (N) and organic matter (OM) contents, indicating that organic matter is the primary source of nitrogen in the soil. This is consistent with the findings of Kiflu Alemayehu et al. (51), who found that TN concentration dropped as profile depth increased.
The available phosphorus (AvP) content in the studied irrigable site differed across various layers. In pedon 1, the Av P ranged from 13.9 mg/kg to 23.6 mg/kg. Similarly, in pedon 2, the AvP content varied between 14.800 mg/kg and 16.5 mg/kg. In pedon 3, it ranged from 14.0 mg/kg to 15.3 mg/kg, starting from the surface to the sub-surface soil. The lower slope position (pedon 1) had relatively high AvP content compared to the other topography positions, which may be due to the application of farmyard manure and alluvial deposits from the river, as well as its high organic matter (OM) content. This finding is consistent with previous research by Sebnie et al. (52), who reported that the highest amount of available P content in the soil was found in the surface horizon. AvP decreased with increasing depth in all pedons except in pedon 3. There is a positive and significant relationship between this decline and soil OM, so this decline is likely due to this decrease in soil OM. Similarly, a previously published study by Yitbarek et al. (4) found that P availability decreased with depth.
The AvP content showed low variability in all topography positions (pedons), with values of 11.4%, 5.62%, and 4.17%, respectively. This low variability may be attributed to the homogeneity in the parent material from which both horizons have formed. Based on the rating of Olsen et al. (28), the average available phosphorus content of the study area is high in all three slope positions of the pedons.
The calcium carbonate content in Table 3 shows an increasing trend in calcium carbonate content with depth for all three topography positions (pedons). The lower slope position (pedon 1) had values ranging from 0.210% to 0.464%, the middle slope position (pedon 2) had values ranging from 0.481% to 0.954%, and the upper slope position (pedon 3) ranged from 0.371% to 0.890%. This increase can be attributed to the movement of calcium carbonate solutes downwards from the surface horizon to the subsurface horizon and soil parent material. Despite this trend, all three profiles had low CaCo3 contents, with an average value of 0.329%-0.728% throughout the soil depth (Table 3). As a result, there was no visible presence of calcaric soil material in any layer of the profiles. Generally, the result revealed that all layers of the profiles are found to be less than<2%; which resulted in the absence of a calcaric soil material (53).
3.3.3 Exchangeable bases, cation exchange capacity and percent base saturation
The exchangeable base data presented in Table 5 revealed that the middle slope position (pedon 1) had the highest exchangeable bases followed by the upper slope position (pedon 3) and lower slope position bot surface and sub-surface horizon. The predominant cations in the exchange sites of all opened profiles were exchangeable Ca2+ and Mg2+, indicating that the soil parent material was primarily rich in basic cations. The high contents of exchangeable Ca2+ and Mg2+ can be attributed to their higher selectivity coefficient over the monovalent cation, which allows them to be retained in higher concentrations and for longer periods by the soil colloidal particles. These findings are consistent with previous studies conducted in the Abobo area and in Jelo micro-catchment which also reported similar trends in the behavior of exchangeable bases in these regions (4, 54).
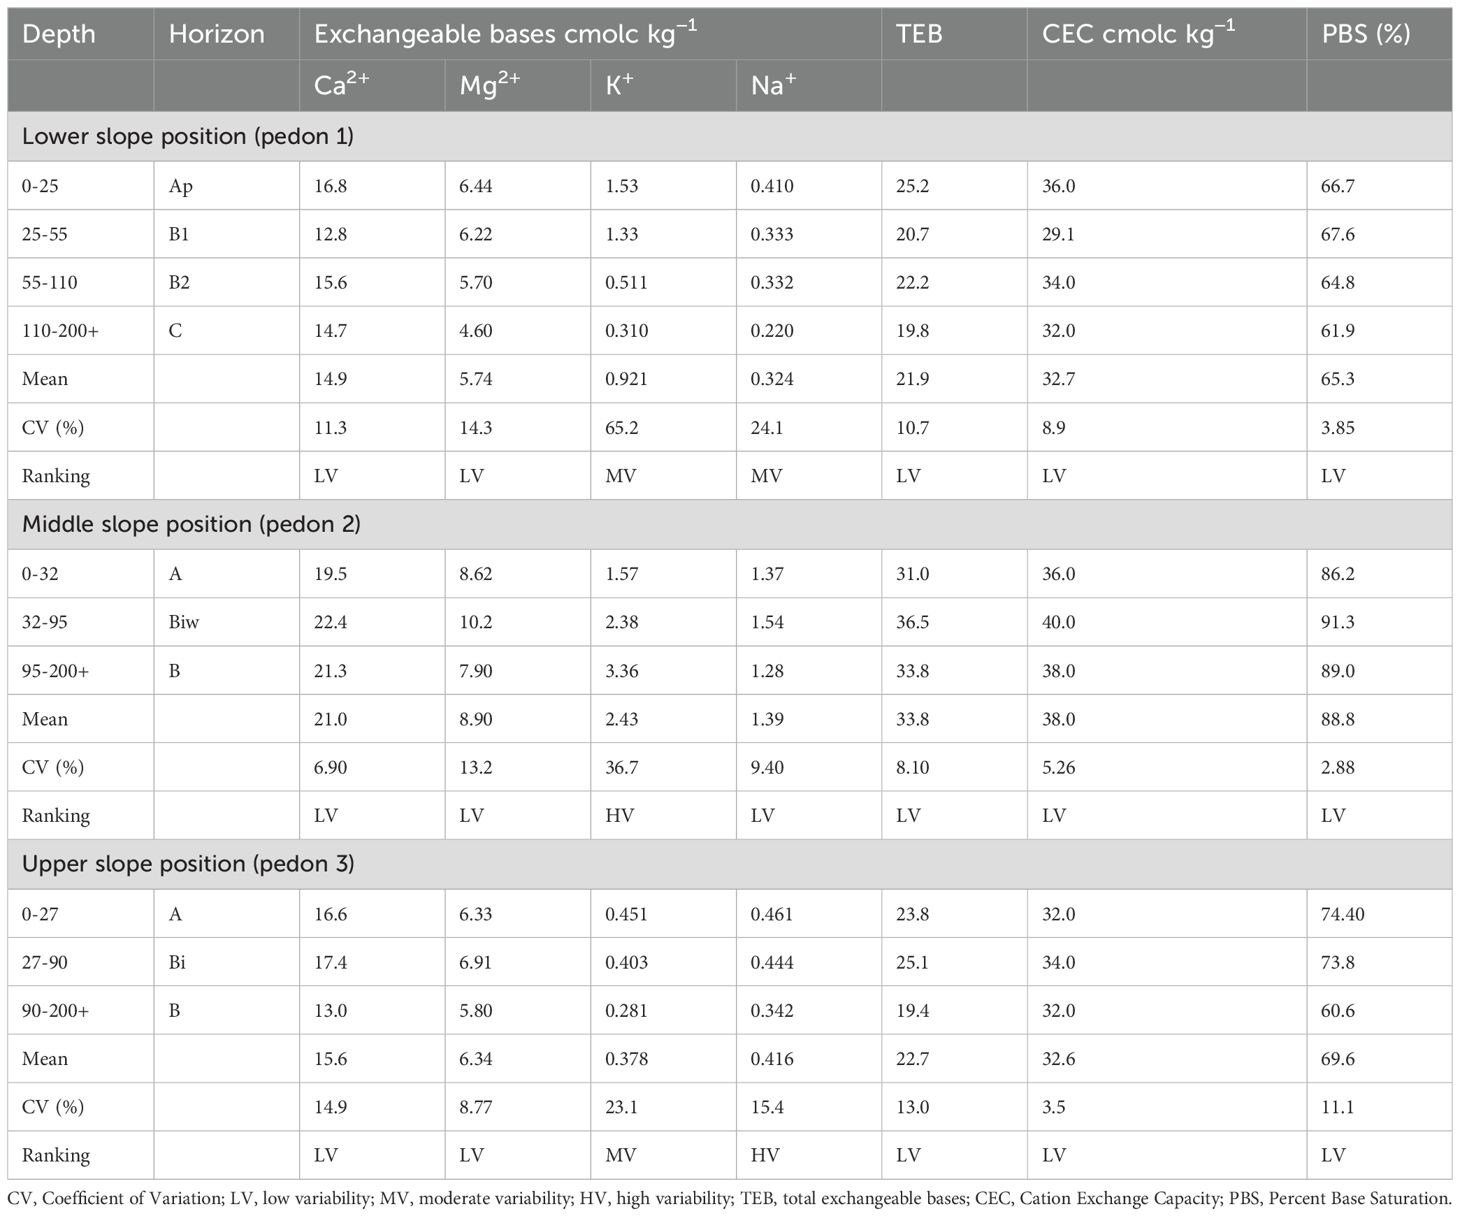
Table 5. CEC, sum of exchange bases, and PBS Achewa irrigated area.
The mean exchangeable bases for all pedons were within the range of optimal nutrient availability for plant growth, according to FAO ratings (22). The coefficient of variation indicated low variability in exchangeable bases for all pedons, which can be attributed to similar parent materials and land use history. The ranking of exchangeable bases in all pedons was in the order of Ca2+ > Mg+ > K+ > Na2+, which is typical of most soils (Table 6). Overall, the physical and chemical properties of the studied pedons showed differences nutrient status that can be attributed to varying soil formation processes, parent materials, and land use history. These findings provide valuable insights into the soil properties and nutrient availability for plant growth in the study area.

Table 6. Available micronutrients in Achewa irrigated area.
The CEC values for the lower slope (pedon 1) ranged from 29.1 to 36.0 Cmol (+) kg-1, for the middle slope (pedon 2) ranged from 36.0 to 40.0 Cmol (+) kg-1, and for upper slope positions (pedon 3) ranged from 32.000 to 34.00 Cmol (+) kg-1, in both surface and subsurface horizon, which are considered high according to the ratings provided by Hazelton and Murphy (53). The irregular trends observed in soil CEC with increasing depth can be attributed to the strong association between soil texture, clay mineralogy, organic matter content, and organic carbon. This finding is consistent with the research of Nahusenay et al. (55), who showed that higher clay and organic matter contents contributed to high CEC. The observed cation exchange capacity values indicated that the soils of the examined area have promising nutrient retention and buffering capacity. Additionally, there was a positive and highly significant correlation with Ca2+ (r = 0.75**, P ≤ 0.01) and a significant correlation with K+ (r= 0.63*, P ≤ 0.5). The similarity in CEC values among the study pedons suggests similarities in parent material and land use and management practices, as suggested by Ukpong (56).
The percentage base saturation (PBS) of soil in the research site pedon 1 varied from 61.9% to 66.7%, while pedon 2 varied from 86.2, %, to 91.3%, whereas pedon 3 varied from 60.6% to 74.4% obtained in both surface and sub-surface horizon (Table 5). Overall, the entire opened pedon showed an irregular trend with increasing depth in PBS, which may be attributed to its similar relationship with the CEC of soil. The CEC of soil is strongly related to the soil organic matter content. The high exchangeable bases registered in the pedon 2 soils of the study area could have contributed to the high base saturation (BS) observed in pedon 3. As per rating by Hazelton and Murphy (53), the BS of the studied pedons 1 and 2 were rated as medium to high, whereas pedon3 rated as high range. Based on the classification set by Landon (57), soils having base saturation >60% are categorized as fertile soils. Based on the rating, the soils in the current research site can be classified as fertile due to their high PBS.
3.3.4 Available micronutrients
The available, micronutrients (Fe, Mn, Zn, and Cu) decrease with increasing soil depth (Table 6). The mean concentrations of available micronutrients in all three pedons show that Fe has the highest concentration, followed by Mn, Zn, and Cu. These patterns suggest that micronutrient availability decreases with increasing soil depth, regardless of the substrate. However, there are differences in the concentration of these micronutrients in each pedon, indicating possible factors such as soil composition, microorganisms, or environmental conditions that contribute to the observed patterns.
The environmental factors in the study area play a great role in the distribution of micronutrients since the area is in warm climates and flooded during the rainy season. Regarding the micronutrient status, Fe > Mn > Zn > Cu. Elevated iron levels result from the weathering of iron-rich minerals and anaerobic conditions, which enhance its solubility for plant uptake (58). Manganese availability also increases in these wet conditions due to reduced oxidation states (59). In contrast, zinc and copper are less abundant due to leaching and lower concentrations in soil parent materials (60). Organic matter can enhance nutrient availability but also contributes to leaching during rapid decomposition in the rainy season (61). Overall, warm temperatures and high moisture levels significantly impact micronutrient distribution in these environments.
Based on the critical values of available micronutrients determined by Jones (62), the average concentration of all micronutrients is high, except Cu, which is in the middle range. The micronutrient contents were high except for Cu; therefore, no deficiency of these micronutrients is expected in the Achewa irrigation fields. This is consistent with various works that found that micronutrients in particular are usually contained in sufficient quantities in Gambella soils (4).
3.4 Pearson correlation matrix
The results of the analysis showed that certain soil attributes exhibited significant correlations with each other, while others did not show meaningful relationships. Among the positively correlated parameters, organic matter (OM) was significantly correlated with sand (r = 0.65*), total nitrogen (TN) (r = 0.95***), available phosphorus (AvP) (r = 0.90***), and Fe (r = 0.93***), calcium with CEC and Mg positively correlated with CEC and pH. These positive correlations suggest that organic matter enhances the soil’s ability to retain nutrients and improves overall soil fertility. For instance, TN and AvP, both vital for plant growth, showed strong positive correlations with OM, which indicates that higher organic content supports nutrient availability in the soil. Similarly, Fe and OM showed a strong positive correlation (r = 0.93***), suggesting that organic matter may help in the mobility and availability of iron in the soil, a critical nutrient for plants.
On the other hand, some parameters showed negative correlations. Clay showed a significant negative correlation with total porosity (TP) (r = -0.34), which indicates that higher clay content tends to reduce the total pore space in the soil, possibly due to the smaller size of clay particles and their tendency to compact. Furthermore, Fe showed a significant negative correlation with pH (r = -0.046), indicating that higher levels of Iron in the soil might reduce the soil’s pH value. Similarly, Ca showed a negative correlation with Sand (r = -0.55), which could suggest that an increase in calcium might Sand. These relationships highlight how certain soil properties can inhibit or promote others, underlining the complex interdependence of soil chemistry and structure (Table 4).
3.5 Soil classification
The soil classification in the study area followed the guidelines outlined in the World Reference Base for Soil Resources (32) and considered the diagnostic horizons, properties, and materials of the different slope positions. Starting with the lower slope position (pedon 1), which was located in an irrigated field adjacent to the Baro River (Figure 3), the soil exhibited deep and well-drained characteristics with an effective depth exceeding 200 cm. The prominent feature observed was stratification due to Fluvic materials, leading to the classification of this soil as Eutric Fluvisols (Loamic) (Table 7). The base saturation throughout the profile was 50% or more, qualifying it as Eutric principal qualifier. Additionally, the soil texture in a layer of at least 30 cm thickness, within 100 cm of the mineral soil surface, fell into the clay loam and silty clay loam classes, classifying it as Loamic supplementary qualifier.
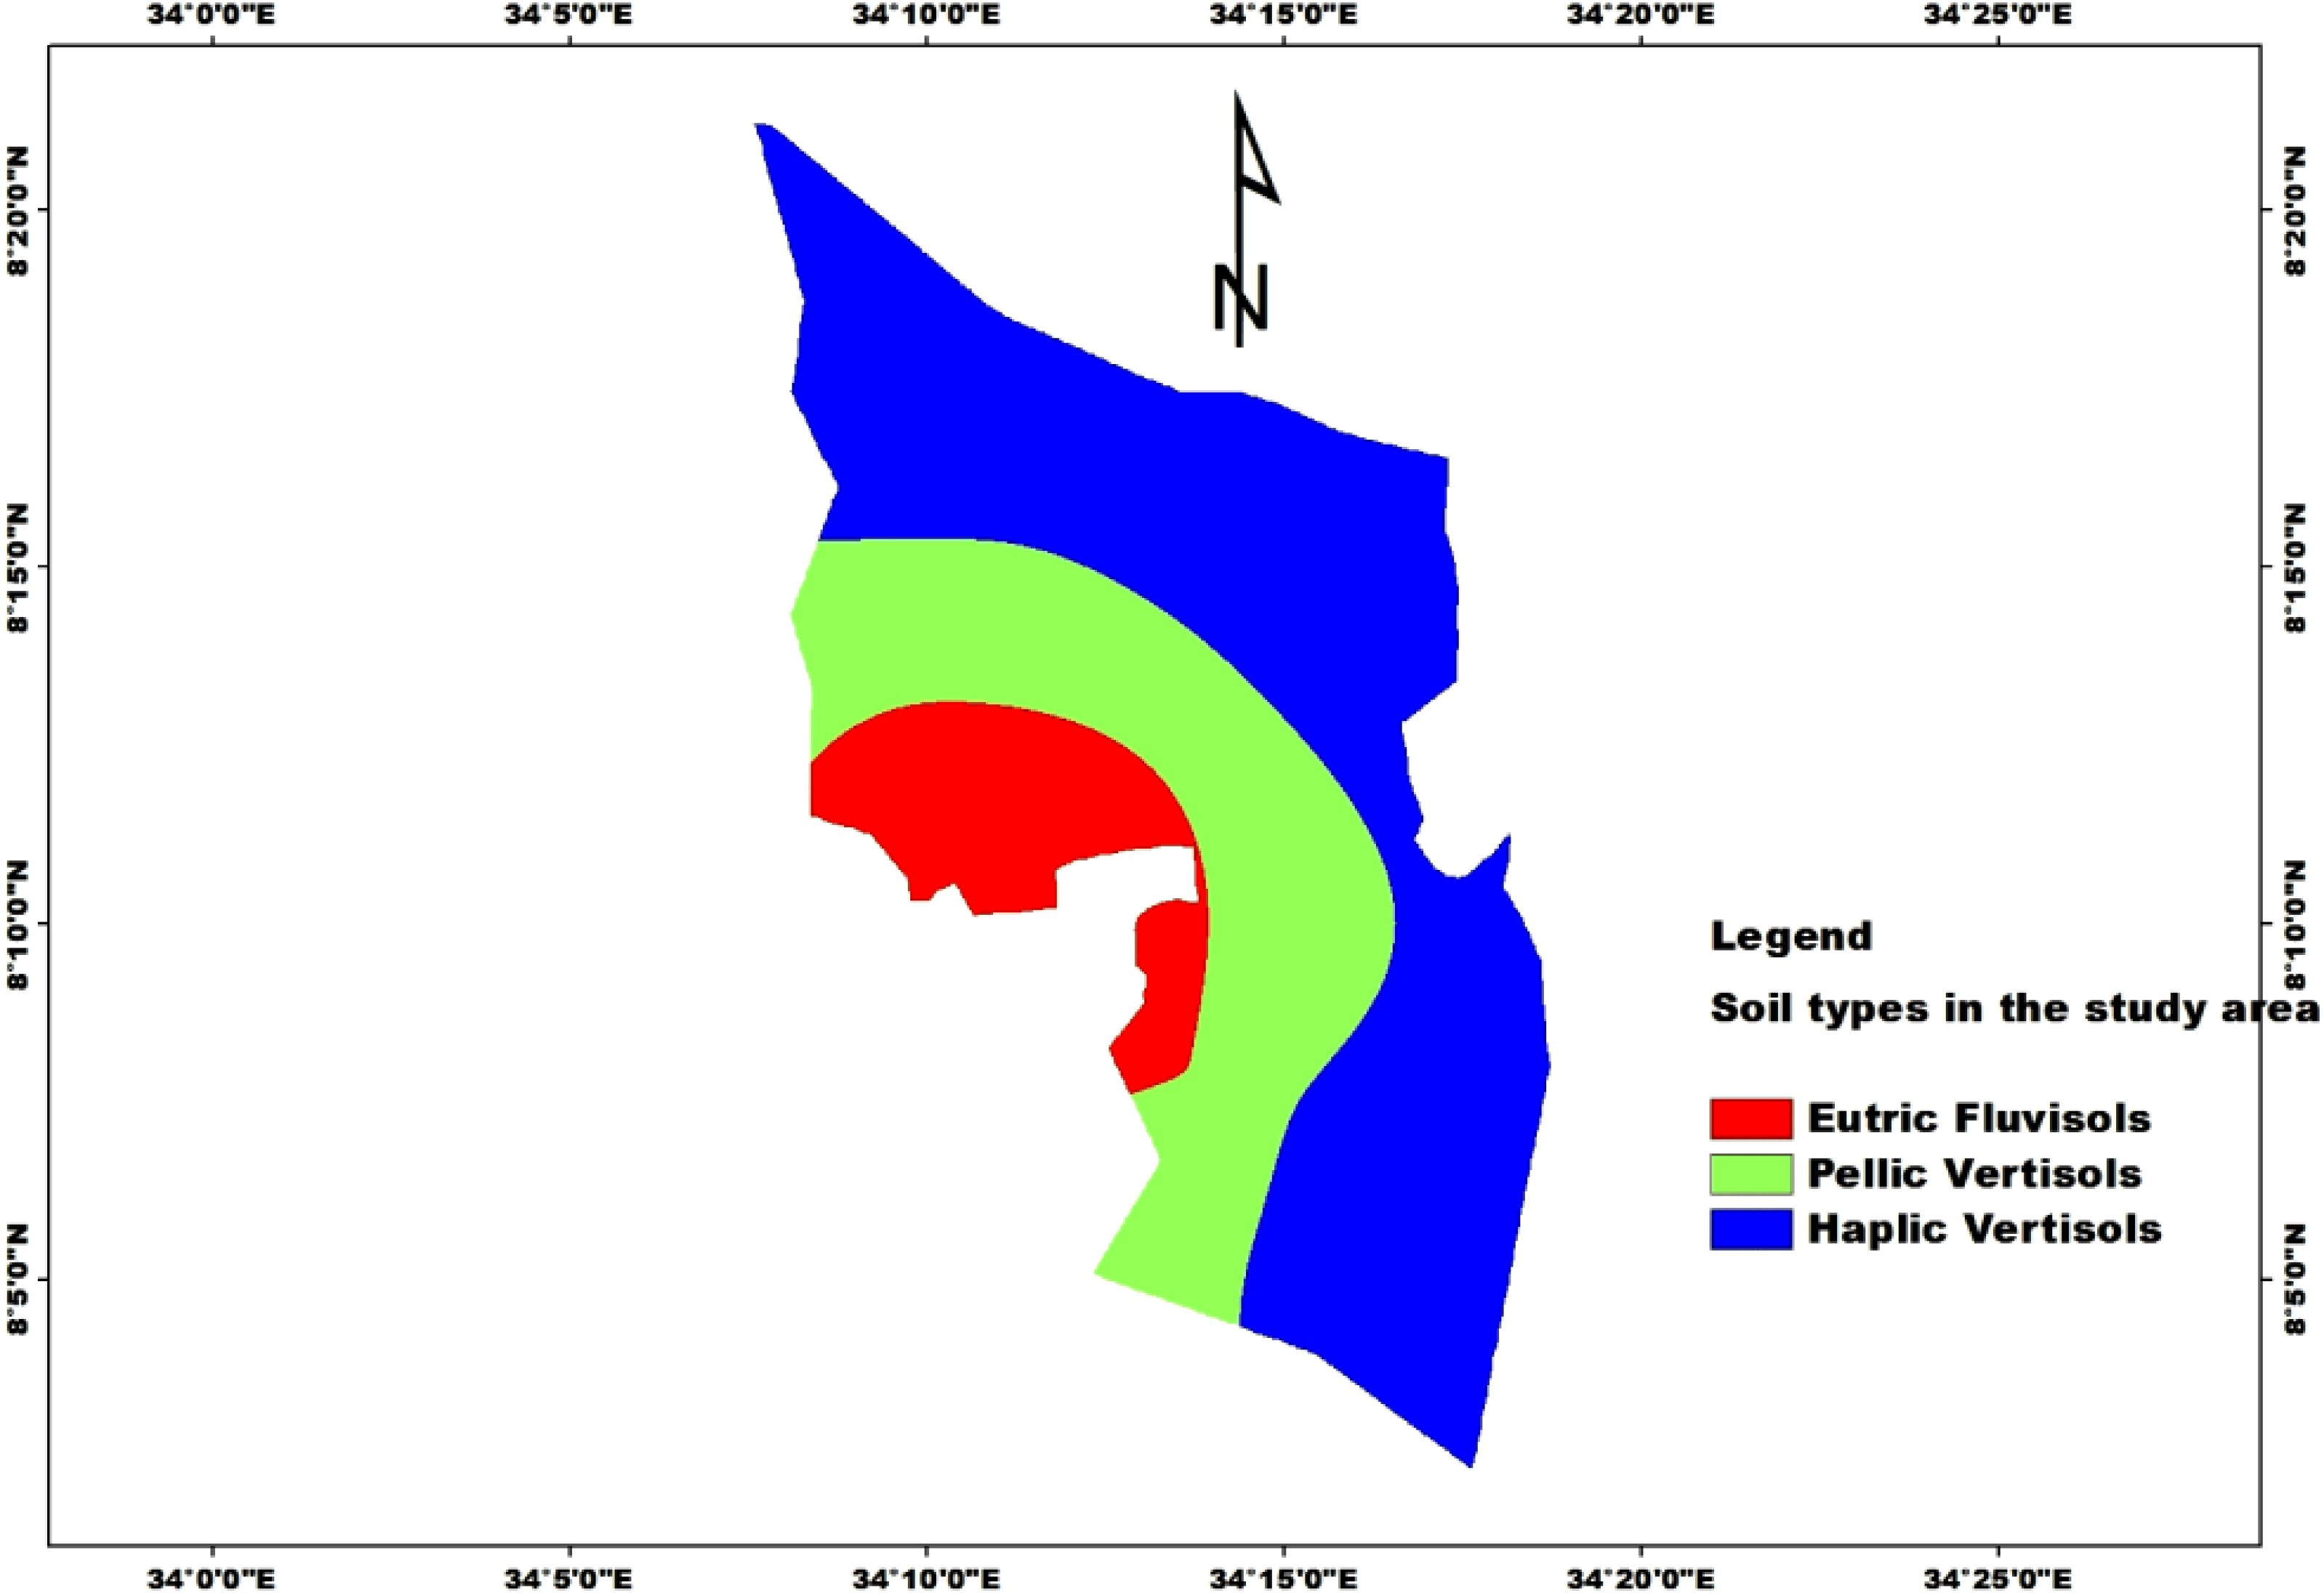
Figure 3. Map of the profile distribution.
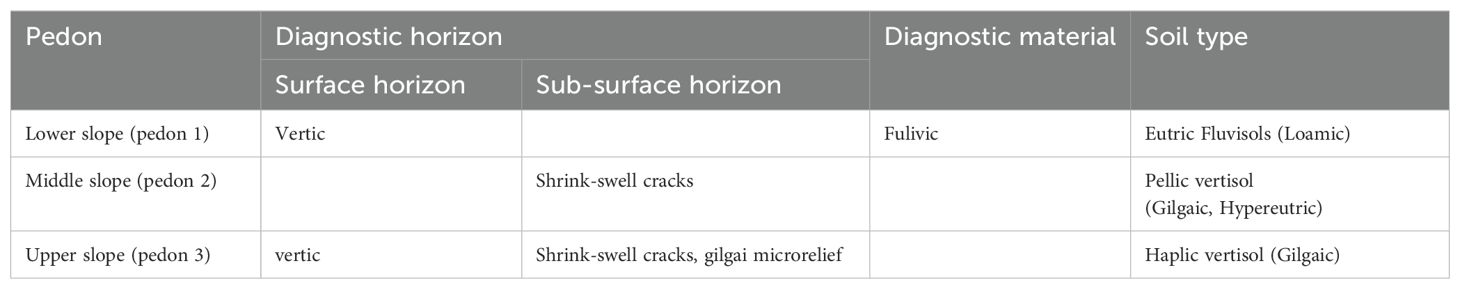
Table 7. Diagnostic horizons, properties, qualifiers, and soil types of Achewa irrigable area according to WRB.
Moving on to the middle slope positions (pedon 2), these soils exhibited distinctive characteristics that led to their classification as Pellic Vertisols (Gilgaic, Hypereutric) (Table 7). They contained more than 30% clay content and displayed wedge-shaped soil aggregates, slickensides, and shrink-swell cracks. The Munsell moist color value in the upper 30 cm was equal to or less than 3, with a chroma equal to or less than 2, meeting the criteria for Pellic principal qualifier. Base saturation levels were consistently above 50% within the depth range of 20-100 cm from the mineral soil surface, with some layers exceeding 80%, indicating Hypereutric supplementary qualifier. Additionally, the presence of Gilgai microrelief further confirmed the classification of these soils as Pellic Vertisols (Gilgaic, Hypereutric).
In contrast, the upper slope positions (pedon 3) were characterized by a high clay content (>30%), slickensides, and shrink-swell cracks, meeting the criteria for Vertic diagnostic horizon. Gilgai microrelief was also observed, confirming the presence of Gilgaic supplementary qualifier. Therefore, these soils were classified as Haplic Vertisols (Gilgaic). The soil classification results revealed the presence of Eutric Fluvisols (Loamic) in the lower slope positions (pedon 1), Pellic Vertisols (Gilgaic, Hypereutric) in the middle slope positions (pedon 2), and Haplic Vertisols (Gilgaic) in the upper slope positions (pedon 3) (Table 7). These classifications provide valuable insights into the soil properties and behavior, enabling the development of appropriate management strategies for sustainable land use in the area.
4 Conclusion
All the soil profiles examined had considerable depth, exceeding 200 cm. The predominant soil types identified in the area were Eutric Fluvisols (Loamic), Pellic Vertisols (Gilgaic, Hypereutric), and Haplic Vertisols (Gilgaic). The soil structures in the study area showed variations in the grade, size, and type across different slope positions of the studied pedons. The lower slope position (pedon 1) showed a granular structure in the surface horizons, while the sub-surface horizons consisted of single-grain, angular blocky to sub-angular blocky structures. Pedons 2 and 3 exhibited angular to sub-angular blocky structures in the surface and sub-surface horizons, respectively. These structural variations can be attributed to differences in soil organic matter content and management practices. Regarding soil consistency, the surface layer across all three slope positions ranged from soft to slightly hard, while the moist subsurface layer varied from very friable to very firm. Wet consistency ranged from slightly sticky/slightly plastic to very sticky/very plastic. Chemical analysis revealed that the mean soil pH for pedons 1 and 2 was registered as neutral (7.11 and 7.48, respectively), while pedon 3 exhibited a neutral pH (6.84). It is worth noting that plant nutrients are most readily available within the pH range of 6.5 to 7.5, which promotes healthy root growth. The study also found that the mean soil organic matter content fell within the medium range, while total nitrogen was categorized as medium to high, and available phosphorus was classified as high across all pits. Therefore, for sustainable agricultural land management practices, the addition of organic fertilizer and retention of crop residue during weeding should be continued to enhance nutrient accumulation.
Moreover, the exchangeable bases in the study area showed a decreasing trend from surface to sub-surface horizon, and the highest exchangeable bases were observed in the pedon 2 followed by pedon 3 and lowest was obtained in pedon 1 similar trend is observed in CEC and PBS, On the other hand, the availability of micronutrients (Fe, Mn, Cu, Zn) tended to decrease with increasing profile depth. The data collected from this study on soil properties are critical for the development and interpretation of effective, site-specific management practices in the current study area. It also provides essential baseline information for future investigations into the region’s soil resources. Therefore, site-specific soil management practices, combined with comprehensive studies on soil fertility and irrigation water quality, are essential for enhancing and sustaining soil productivity in both irrigable areas and surrounding regions.
Data availability statement
The raw data supporting the conclusions of this article will be made available by the authors, without undue reservation.
Author contributions
WM: Conceptualization, Formal analysis, Investigation, Software, Writing – original draft, Writing – review & editing. DT: Conceptualization, Investigation, Supervision, Writing – original draft, Writing – review & editing. SD: Conceptualization, Investigation, Supervision, Writing – original draft, Writing – review & editing. TY: Conceptualization, Investigation, Supervision, Writing – original draft, Writing – review & editing.
Funding
The author(s) declare that no financial support was received for the research, authorship, and/or publication of this article.
Acknowledgments
We would like to express our sincere gratitude to Gambella and Arba Minch Universities for financial support and provision of opportunity for one of the authors to attend PhD program. Additionally, we extend our thanks to the Gambella University and Itang Special Woreda Agricultural Office for their generous provision of equipment for sample collection and analysis.
Conflict of interest
The authors declare that the research was conducted in the absence of any commercial or financial relationships that could be construed as a potential conflict of interest.
Publisher’s note
All claims expressed in this article are solely those of the authors and do not necessarily represent those of their affiliated organizations, or those of the publisher, the editors and the reviewers. Any product that may be evaluated in this article, or claim that may be made by its manufacturer, is not guaranteed or endorsed by the publisher.
References
1. Onyekanne C, Nnaji G. Characterization and classification of soils of Ideato North local government area. Niger J Soil Sci. (2012) 22:11–7.
2. Ampontuah EO, Robinson J, Nortcliff S. Assessment of soil particle redistribution on two contrasting cultivated hillslopes. Geoderma. (2006) 132:324–43. doi: 10.1016/j.geoderma.2005.05.014
3. Dessalegn D, Beyene S, Ram N, Walley F, Gala TS. Effects of topography and land use on soil characteristics along the toposequence of Ele watershed in southern Ethiopia. Catena. (2014) 115:47–54. doi: 10.1016/j.catena.2013.11.007
4. Yitbarek T, Beyene S, Kibret K. Characterization and classification of soils of abobo area, western Ethiopia. Appl Environ Soil Sci. (2016) 2016:4708235. doi: 10.1155/2016/4708235
5. Chemeda M, Kibret K, Fite T. Influence of different land use types and soil depths on selected soil properties related to soil fertility in Warandhab area, Horo Guduru Wallaga Zone, Oromiya, Ethiopia. Int J Environ Sci Nat Resour. (2017) vol:555634. doi: 10.19080/IJESNR.2017.04.555634
6. Hurni H, Bantider A, Herweg K, Portner B, Veit H. Landscape Transformation and Sustainable Development in Ethiopia: Background information for a study tour through Ethiopia, 4-20 September 2006 (2007). Bern, Switzerland: Geographisches Institut, Universität Bern. Available online at: https://boris.unibe.ch/71076/ (Accessed Nov. 22, 2024). info:eu-repo/semantics/report.
7. Fekadu E, Kibret K, Bedadi B, Melese A. Characterization and classification of soils of yikalo subwatershed in lay gayint district, northwestern highlands of Ethiopia. Eurasian J Soil Sci. (2018) 7:151–66. doi: 10.18393/ejss.376267
8. Mulugeta D, Sheleme B. Characterization and classification of soils along the toposequence of Kindo Koye Watershed in Southern Ethiopia. East Afr J Sci. (2010) 4:65–77.
9. Merumba M, Msanya BM, Semu E, Semoka JM. Pedological characterization and suitability assessment for cassava production in bukoba, missenyi and biharamulo districts, Tanzania. Available online at: https://papers.ssrn.com/abstract=4883961 (Accessed Nov. 22, 2024).
10. Mohamed SH, Msanya BM, Tindwa HJ, Semu E. Pedological characterization and classification of selected soils of morogoro and mbeya regions of Tanzania. Int J Nat Resource Ecol Manag. (2021) 6:79–92.
11. Uwitonze P, Msanya BM, Mtakwa PW, Uwingabire S, Sirikare S. Pedological characterization of soils developed from volcanic parent materials of Northern Province of Rwanda. Agric For Fish. (2016) 5(6):225–36. doi: 10.11648/j.aff.20160506.13
12. Yacob A, Heluf G, Sheleme B. Pedological characteristics and classification of soils along landscapes at Abobo, southwestern lowlands of Ethiopia. J Soil Sci Environ Manage. (2014) 5:72–82.
13. Stewart ZP, Pierzynski GM, Middendorf BJ, Prasad PV. Approaches to improve soil fertility in sub-Saharan Africa. J Exp Bot. (2020) 71:632–41. doi: 10.1093/jxb/erz446
14. Yeshibir B. Gambella people’s regional state land-use/land allotment study. Section 9, soils, yeshibir, addis ababa, Ethiopia, 2003. (2003).
15. Davidson A. “Reconnaissance geology and geochemistry of southwest Ethiopia. Ethiopian Institute of Geological Surveys, Addis Ababa, Bulletin 2, pp. 1-129.,” Ethiopian Institute of Geological Surveys, Addis Ababa, Ethiopia, (1983).
16. Leul Y, Assen M, Damene S, Legass A. Effects of land use types on soil quality dynamics in a tropical sub-humid ecosystem, western Ethiopia. Ecol Indic. (2023) 147:110024. doi: 10.1016/j.ecolind.2023.110024
17. Sewnet Y, Elemo E, Derso D. A review of Agricultural Research, Extension and Farmers linkage in Ethiopia. Agric Biol JN Am. (2016) 7:116–20.
18. Degife AW. (2020). lmu. Available online at: https://edoc.ub.uni-muenchen.de/25786/ (Accessed Nov. 22, 2024).
19. Jembere T, Ulfina GG, Atnaf M, Sileshi Y. Transforming agriculture in GAMBELLA REGION: strategic priorities and interventions (2023). Available online at: https://www.researchgate.net/profile/Tewodros-Mulualem-Beyene/publication/375952766_Transforming_Agriculture_in_GAMBELLA_REGION_Strategic_Priorities_and_Interventions_Book_April_2023_CITATIONS_0_READS_86/links/6564c2a7b1398a779dbe1006/Transforming-Agriculture-in-GAMBELLA-REGION-Strategic-Priorities-and-Interventions-Book-April-2023-CITATIONS-0-READS-86.pdf (Accessed Nov. 25, 2024).
20. CSA (Central Statistical Agency). Population projection of Ethiopia for all regions at wereda level from 2014–2017. Addis Ababa Ethiop. (2017) 3:18.
21. Dent D-Y, Young A. A. (1981): soil survey and land evaluation. London: George Aller Unwin (1981).
22. FAO (Food and Agriculture Organization). Guidelines for soil description. 4th ed. Rome, Italy: Viale delle Terme di Caracalla (2006).
23. Munsell Soil Colour Chart. Revised washable edition. Munsell® Soil color charts. Baltimore 18, Maryland, USA: Munsell Soil Colour Company Inc. (1994).
24. Bouyoucos GJ. Hydrometer method improved for making particle size analyses of soils1. Agron J. (1962) 54:464–5. doi: 10.2134/agronj1962.00021962005400050028x
25. Blake GR, Hartge KH. Bulk density. In methods of Soil Analysis. 2nd ed Vol. 9. Klute A, editor. Madison: ASA and SSA (1986) p. 363–375.
26. Walkley A, Black IA. An examination of the Degtjareff method for determining soil organic matter, and a proposed modification of the chromic acid titration method. Soil Sci. (1934) 37:29–38. doi: 10.1097/00010694-193401000-00003
27. Bremner JM, Mulvaney C. Nitrogen—total. Methods Soil Anal Part 2 Chem Microbiol Prop. (1982) 9:595–624.
28. Olsen S, Cole CV, Fs W, LA D, CV C, FS W, et al. Estimation of available phosphorus in soil by extraction with sodium bicarbonate. USDA Circ. (1954) 939:1–19.
29. Chapman H. Cation Exchange Capacity. In: Black CA, Eds, Methods of Soil Analysis, American Society of Agronomy, Madison. (1965) 9:891–901.
30. Jackson M. Soil chemical analysis, prentice Hall,” Inc Englewood Cliffs NJ. (New Delhi: Prentice Hall of India, Private Limited, New Delh) (1958) 498:183–204. doi: 10.1002/jpln.19590850311
31. Lindsay WL, Norvell WA. Development of a DTPA soil test for zinc, iron, manganese, and copper. Soil Sci Soc Am J. (1978) 42:421–8. doi: 10.2136/sssaj1978.03615995004200030009x
32. IUSS Working Group WRB-FAO. IUSS Working Group WRB. 2015. World Reference Base for Soil Resources 2014, update 2015 International soil classification system for naming soils and creating legends for soil maps. World Soil Resources Reports N°. 106. Vienna, Austria: International Union of Soil Sciences (IUSS) (2015).
33. Wilding L, Drees L. Spatial variability and pedology. In: Developments in soil science, vol. 11. Elsevier: New York, NY, USA: Elsevier (1983). p. 83–116.
34. Agbugba S. Characterization and Classification of soils of dissimilar Topographic units in Owerri area, Imo state, Nigeria. Elsevier (2018).
35. Ali A, Esayas A, Beyene S. Characterizing soils of Delbo Wegene watershed, Wolaita Zone, Southern Ethiopia for planning appropriate land management. J Soil Sci Environ Manage. (2010) 1:184–99.
36. Hailu AH, Kibret K, Gebrekidan H. Characterization and classification of soils of kabe subwatershed in south wollo zone, northeastern Ethiopia. Afr J Soil Sci. (2015) 3:134–46.
37. Prasad J, Anil Kumar KS, Nair KM, Dhanorkar BA, Niranjan KV, Mohekar DS, et al. Shrink-swell soils of Palakkad district, Kerala: Their characteristics and classification. J Indian Soc Soil Sci. (2021) 69:113–8. doi: 10.5958/0974-0228.2021.00033.5
38. Moshago S, Regassa A, Yitbarek T. Characterization and classification of soils and land suitability evaluation for the production of major crops at anzecha watershed, gurage zone, Ethiopia. Appl Environ Soil Sci. (2022) 2022:112. doi: 10.1155/2022/9733102
39. Chikezie I, Eswaran H, Asawalam D, Ano A. Characterization of two benchmark soils of contrasting parent materials in Abia State, Southeastern Nigeria. Glob J Pure Appl Sci. (2010) 16(1):23–9. doi: 10.4314/gjpas.v16i1.66190
40. Malgwi W, Ojanuga A, Chude V, Kparmwang T, Raji B. Morphological and physical properties of some soils at Samaru, Zaria, Nigeria. Niger J Soil Res. (2000) 1:58–64.
41. Alemayehu K. Characterisation of agricultural soils in CASCAPE intervention woredas in Southern Nations Nationalities People Regional State. Hawassa Univ Coll Agric Sch Plant Hortic Sci Hawasa Ethiop. (2015) 1:58–64.
42. Rai M. Principles of soil science. 3rd ed. New Delhi: Rajiv Beri for Macmillan India Limited (1995).
43. U.S. (United States) Salinity Laboratory Staff. Diagnosis and improvement of saline and alkali soils Vol. 60. United States Department of Agriculture (1954). 145p.
44. Assen M, Yilma S. Characteristics and classification of the soils of gonde micro-catchment, Arsi highlands, Ethiopia. SINET Ethiop J Sci. (2010) 33:101–16.
45. Abay A, Sheleme B. Characterization of soils at Angacha district in southern Ethiopia. J Biol Agric Healthc. (2012) 2:6–16.
46. Tekalign M, Haque I. Phosphorus status of some Ethiopian soils. III. Evaluation of soil test methods for available phosphorus. Trop Agric. (1991) 68:51–6.
47. Assefa E. Characteristics, classification and potentials of soils in Werkaryia area, South Welo, Ethiopia. SINET Ethiop J Sci. (2002) 25:45–70. doi: 10.4314/sinet.v25i1.18073
48. Osujieke DN, Obasi NS, Imadojemu PE, Ekawa M, Angyu MD. Characterization and classification of soils of Jalingo metropolis, North-East, Nigeria. Nigerian J Soil Sci. (2018) 28:7280. Available online at: https://www.cabidigitallibrary.org/doi/full/10.5555/20193252102 (Accessed Nov. 23, 2024).
49. Mamo T, Richter C, Heiligtag B. Phosphorus availability studies on ten Ethiopian Vertisols. J Agric Rural Dev Trop Subtrop JARTS. (2002) 103:177–83.
50. Tekalign T. Soil, plant, water, fertilizer, animal manure and compost analysis. Working Document No. 13. International Livestock Research Center for Africa, Addis Ababa, Ethiopia. and Subtropics. Addis Ababa Ethiop. (1991) 28(2):72–80.
51. Kiflu Alemayehu KA, Beyene Sheleme BS, Schoenau J. Characterization of problem soils in and around the south central Ethiopian Rift Valley. (2016).
52. Sebnie W, Adgo E, Kendie H. Characterization and classification of soils of zamra irrigation scheme, northeastern Ethiopia. Air Soil Water Res. (2021) 14:11786221211026577. doi: 10.1177/11786221211026577
53. Hazelton P, Murphy B. Interpreting soil test results. What do all the numbers mean? Australia: CSIRO publishing (2007).
54. Assen M, Le Roux P. Soils of Jelo Micro-catchment in the chercher highlands of Eastern Ethiopia: i morphological and physicochemical properties. Ethiop J Nat Resour. (2005) 7:55–81.
55. Nahusenay A, Kibebew K, Heluf G, Abayneh E. Characterization and classification of soils along the toposequence at the Wadla Delanta Massif, North Central Highlands of Ethiopia. J Ecol Nat Environ. (2014) 6:304–20. doi: 10.5897/JENE2014.0463
56. Ukpong IE. Ecological classification of Nigerian mangroves using soil nutrient gradient analysis. Wetl Ecol Manage. (2000) 8:263–72. doi: 10.1023/A:1008452923256
57. Landon JR. “Booker tropical soil manual; a handbook for soil survey and agricultural land evaluation in the tropics and subtropics. New York: John Wiley and Sons (1991) p. 94–5.
58. Sparks D. “Environmental Soil Chemistry”, In: 2nd Edition Academic Press: San Diego, USA. (2002), 259p.
59. Reid RJ. Mechanisms of micronutrient uptake in plants. Funct Plant Biol. (2001) 28:661–8. doi: 10.1071/PP01037
60. Alloway BJ. Micronutrient deficiencies in global crop production. Springer Science & Business Media (2008).
61. Tisdale S, Nelson W, Beaton J, Havlin J. Soil fertility and fertilizers. 5th edn. New York: Macmillan (1993).
Keywords: characterization, irrigable land, soil classification, soil profile, slope
Citation: Mengiste W, Tsegaye D, Dagalo S and Yitbareke T (2025) Characterization and classification of soils in the irrigable land of Achewa small-scale irrigation area, Itang special district, southwest Gambella, Ethiopia. Front. Soil Sci. 4:1451271. doi: 10.3389/fsoil.2024.1451271
Received: 18 June 2024; Accepted: 04 December 2024;
Published: 31 January 2025.
Edited by:
Sunita K. Meena, Dr. Rajendra Prasad Central Agricultural University, IndiaReviewed by:
Sunday Ewele Obalum, University of Nigeria, NigeriaLarry Joseph Cihacek, North Dakota State University, United States
Copyright © 2025 Mengiste, Tsegaye, Dagalo and Yitbareke. This is an open-access article distributed under the terms of the Creative Commons Attribution License (CC BY). The use, distribution or reproduction in other forums is permitted, provided the original author(s) and the copyright owner(s) are credited and that the original publication in this journal is cited, in accordance with accepted academic practice. No use, distribution or reproduction is permitted which does not comply with these terms.
*Correspondence: Wasihun Mengiste, cHJhcy0wNzktMTNAYW11LmVkdS5ldA==