 Julie Jung
 Carie M. Frantz
 Diego P. Fernandez
 Michael S. Werner
- 1Department of Biological Sciences, University of Utah, Salt Lake City, UT, United States
- 2Department of Earth and Environmental Sciences, Weber State University, Ogden, UT, United States
- 3Department of Geology and Geophysics, University of Utah, Salt Lake City, UT, United States
Terminal lakes (without outflow) retain elements and compounds that reach them through fluvial, point source or atmospheric deposition. If the lake sediment is exposed, some of these chemicals could become toxic dust particulates. The Great Salt Lake (GSL) in Utah is a terminal lake that experienced record-low lake elevation in 2021-22, exposing vast areas of playa. Here, we used inductively coupled plasma mass spectrometry to analyze the environmental chemistry of GSL shallow sediment during historic lows in spring, summer, and fall of 2021. Contaminants at the subsurface interface are most able to influence diffusion into the water column and uptake by benthic biota. We focused our analysis on copper, thallium, arsenic, mercury, lead, and zinc, which have been historically deposited in this region and are toxic when at high concentrations. We compared records of regional mining activity to understand the current contamination and assess relevant spatial and temporal gradients. We also used two different extraction methods (EPA 3050b and NH4AcO at pH=7) that can distinguish “environmentally available” vs. tightly associated and less available fractions. We observed consistent concentration of copper across sites indicating a larger relative impact of atmospheric deposition, with some evidence indicating further impacts of point sources. Arsenic, on the other hand, is maintained at high levels in submerged sediments and is likely geologically- and fluvially- derived. Thallium and mercury fluctuate seasonally and correlate with lake elevation. Lead and zinc levels are relatively low in GSL sites compared with freshwater input sites, indicating the deep brine layer may sequester these heavy metals, preventing their release into the water column. Overall, the concentrations of most metals in GSL sediments have declined from historic highs. However, each contaminant has distinct sources, seasonality, mobility and transmission. Complete recovery (if possible) may require many more decades and individual remediation strategies.
Introduction
Lake sediments – especially in terminal (endorheic) basins – are a repository for environmental and anthropogenic contaminants (1–5). Heavy metals are among the most problematic pollutants due to their persistence, toxicity, and bioaccumulation. Their origin in bodies of water may be natural (from geological events such as volcanic eruptions, or natural weathering of bedrock) or anthropogenic (from industry, urbanization, agriculture, aquaculture, tourism, etc.) (5–12). The dominant sources of heavy metals differ at the continental scale. In Africa, the dominant source of heavy metals is bedrock weathering, while in Asia and Europe the main source is domestic wastewaters. In North America, mining and industry account for the majority of heavy metal contamination in the environment (13). Since lacustrine sediments act as major sinks for heavy metals in water environments, their concentrations are often measured to assess exposure, and can be used to identify spatial and temporal human impacts on local, regional, and global scales (14, 15).
The Great Salt Lake (GSL) in Utah, USA is the largest inland body of water in the western US and serves as a model ecosystem for other saline environments (Figure 1). The GSL is historically fed by three rivers (the Weber, Jordan, and Bear) that provide ~2/3 of its annual inflow and originate in the nearby Uinta Mountain Range. This inflow carries 1-2 million tons of salts and other dissolved minerals annually (16). As a terminal lake with no outlet, the GSL retains the elements and compounds that reach it. In 1986, the total dissolved mineral accumulation in the GSL basin was four to five billion tons (16). The major ions that are found in GSL are sodium (34.4% dry weight), chloride (58.3%), sulfate (2.9%), potassium (2.2%), magnesium (1.6%), and calcium (0.6%) (17). Some of it is useful and can be mined as a commodity. For instance, the production of table salt and potash from brines dates from the 19th century, while magnesium production on a large scale began in 1971 (18). On the other hand, the lack of surface outflow can also lead to toxic levels of metals in waters and sediments (19).
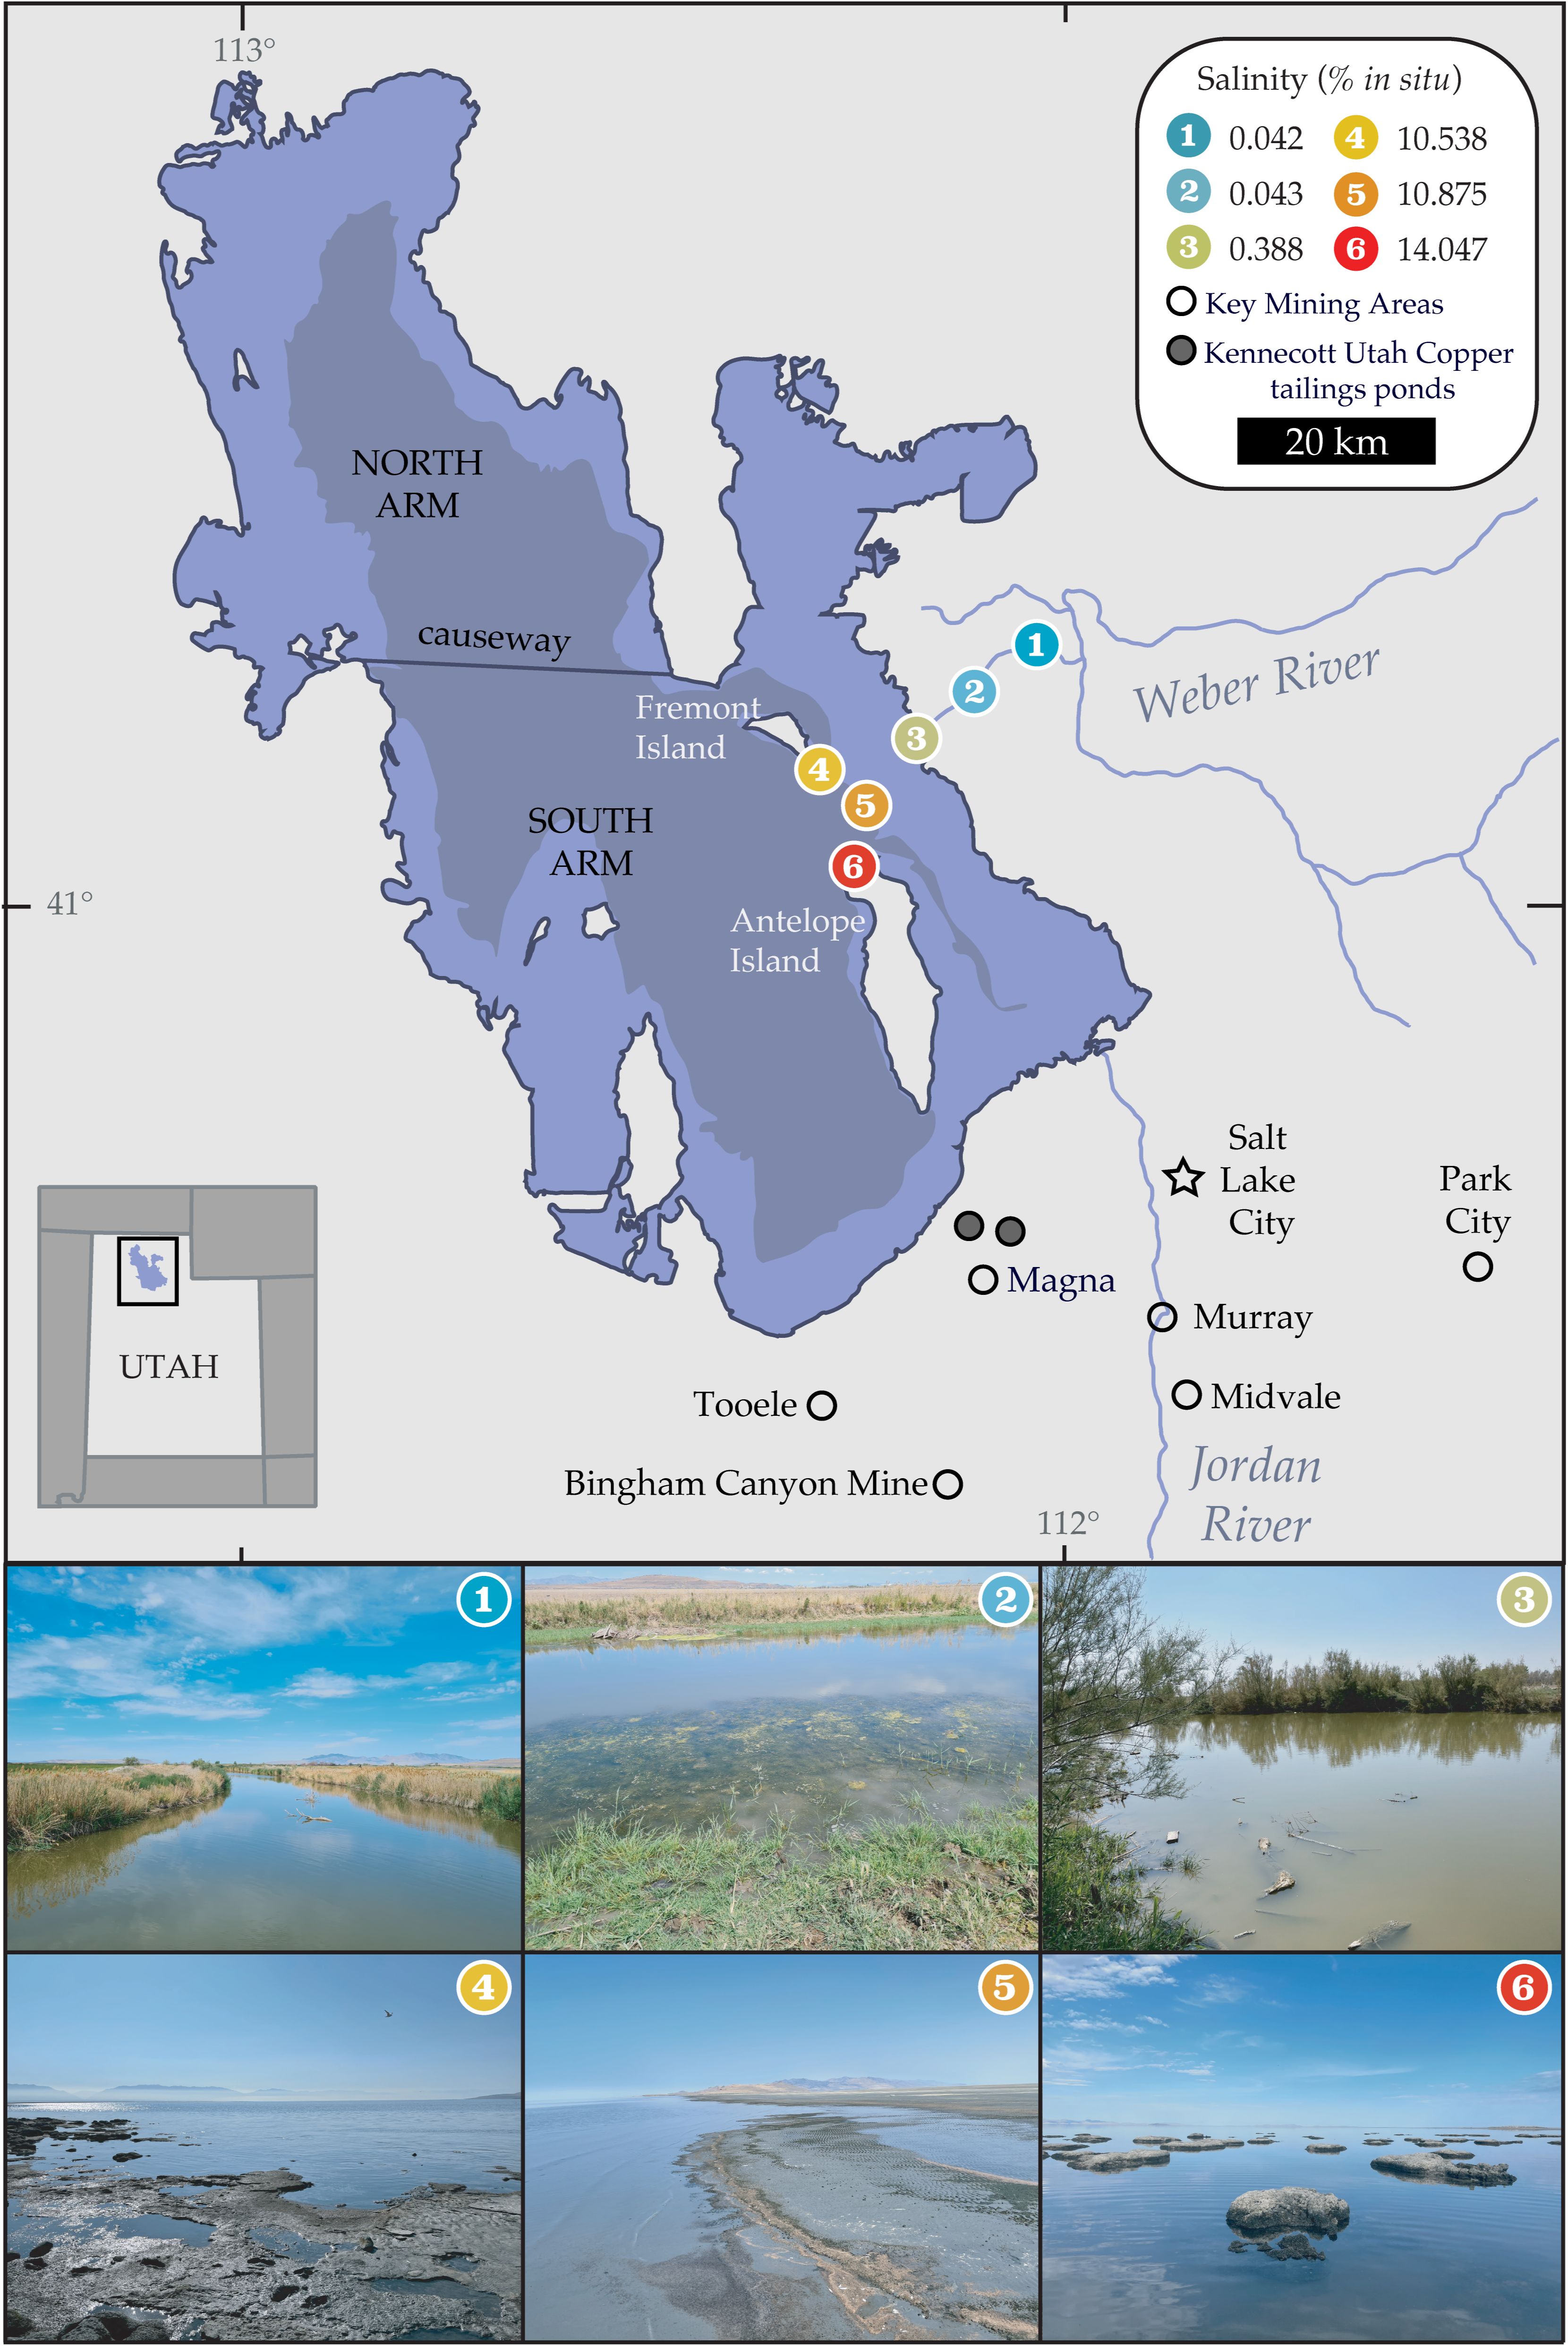
Figure 1. Our six sampling sites near (1-3) and in (4-6) the Great Salt Lake spanned a range of salinity levels and varying distances from industrial sources of pollution, indicated with black unfilled circles. Two Kennecott Utah Copper tailings ponds, named Dike (KCC05, 1338m, 40.7439°N, -112.0858°E) and Center Tailings (KCC13, 1353m, 40.7488°N, -112.1281°E) are denoted with a gray-filled circle. Samples were collected in spring, summer, and fall of 2021. Average salinity measurements per site are shown and labeled with their respective sites. Distinct colors denote site and are used in all figures in this manuscript. Lake topographies depict NASA SRTM2 v.2 data from 2007 and UGRC LiDAR data from 2016. Figure adapted from Jung et al. (49).
The GSL watershed covers a vast swath of land encompassing almost 70,000 km2 that spans four states and four drainage basins (20), and its ecosystem receives industrial, urban, mining, and agricultural discharge from a growing population exceeding two million people in 2019 (US Census 2020). Metal concentrations were low in the sediment record prior to the onset of mining in 1860 but began increasing – particularly lead, zinc, and copper – in the late 1800s, with peaks in the mid-1950s concomitant with heavy mining and smelting activities (21). The 1963 U.S. Clean Air Act, reduction in mining activity beginning in the 1970s and 1980s, and improved pollution control technologies have contributed to a decline in surface metal concentrations by two to five fold since the 1960s (21). Yet, mitigating active contributions to the lake does not necessarily affect legacy sediments. If the lakebed is exposed, the accumulated metals in sediment could be picked up by wind to create toxic dust storms (22).
Due to the shallow shoreline of the GSL, small changes in elevation lead to large changes in exposed lakebed sediment. Consumptive water uses in the watershed have lowered the lake’s elevation by 3.4 m, reduced its volume by 64%, and decreased its area by 51% (23), leading to over 750 square miles of newly exposed lakebed (22). Dust plumes originating from exposed lakebed from the GSL between 2016 and 2018 had a significant impact on local air quality and contained heavy metals that might pose a threat to human health (22). Additionally, reports on the metal isotopic composition indicate large-scale contributions of dust flux from the dry lakebed of the GSL to the surrounding areas, including the Wasatch Front, the Uinta Mountains, and the Wasatch Mountains (24, 25). Thus, it is important to document the abundance of toxic chemicals in lakebed sediment, especially during times of peak exposure.
Conventionally, sediments serve as a record of accumulation or depletion across decades or centuries, as represented by depth of sediment cores analyzed using dating techniques like 210Pb. Here, we use inductively coupled plasma mass spectrometry (ICP-MS) to profile metal concentrations in benthic surface sediments from Gilbert Bay within the south arm of the GSL over the course of a single year – 2021 – a year during which the lake reached historic lows of water elevation (Supplementary Figure S1). We sampled at higher temporal resolution than is conventionally considered in order to evaluate any possible seasonal fluctuations. As well, we consider and compare distinct geochemical methods (namely EPA 3050b and NH4AcO at pH=7), which each address different questions in terms of bioavailability (and thus potential toxicity) and comparability to previous works on GSL sediments. In all, we provide an update on the geochemical composition of submerged sediments in a critical but endangered lake habitat.
Results & discussion
We studied surface sediment from six sites along the south arm of the GSL and one of its tributaries, the Weber River, during spring, summer, and fall of 2021. We used different methods of extraction depending on the element or compound: 1) NH4AcO pH=7 and 2) EPA 3050b method. The former method uses the chemical solution ammonium acetate at pH 7 (26) to represent the pH of the extracellular lung fluid of the human respiratory system during inhalation bioaccessibility tests (27). This buffer also targets plant-available metals and can be used as a proxy for bioavailability. The latter method is a standardized geochemical method that uses strong acids to dissolve almost all elements that could become available in sediments, sludges, and soils (28). Thus, the extraction methods employed in this study address different questions about the bioavailability of metals in our sediment samples. We focused our analysis on elements that have been previously measured during higher water levels (21) and are known to have high toxicity above certain levels, including copper (Cu), thallium (Tl), arsenic (As), mercury (Hg), lead (Pb), and zinc (Zn).
Copper levels remain elevated in the Great Salt Lake region via atmospheric deposition
Pre-industrial “background” levels of sediment copper concentrations are 11 µg/g dry mass, which rose to 500 µg/g by the 1950s due to mining activity (21). The most recent report of exposed sediments from 2019 described average GSL PM10 (particles with a diameter of 10 µm or less, small enough to pass through the throat and nose and enter the lungs) soil abundance of 64 mg/kg, which is 2.6x enriched compared to the average abundance of Cu in the Earth’s crust (22). We found that the level of copper in GSL benthic sediment in 2021 is still elevated; although there is a large variance, every site had samples that exceeded the background level of copper concentrations. Notably, six samples also exceeded the threshold effect concentration (TEC, below which harmful effects are unlikely to be observed) for copper of 32 µg/g dry (Figure 2A) (29).
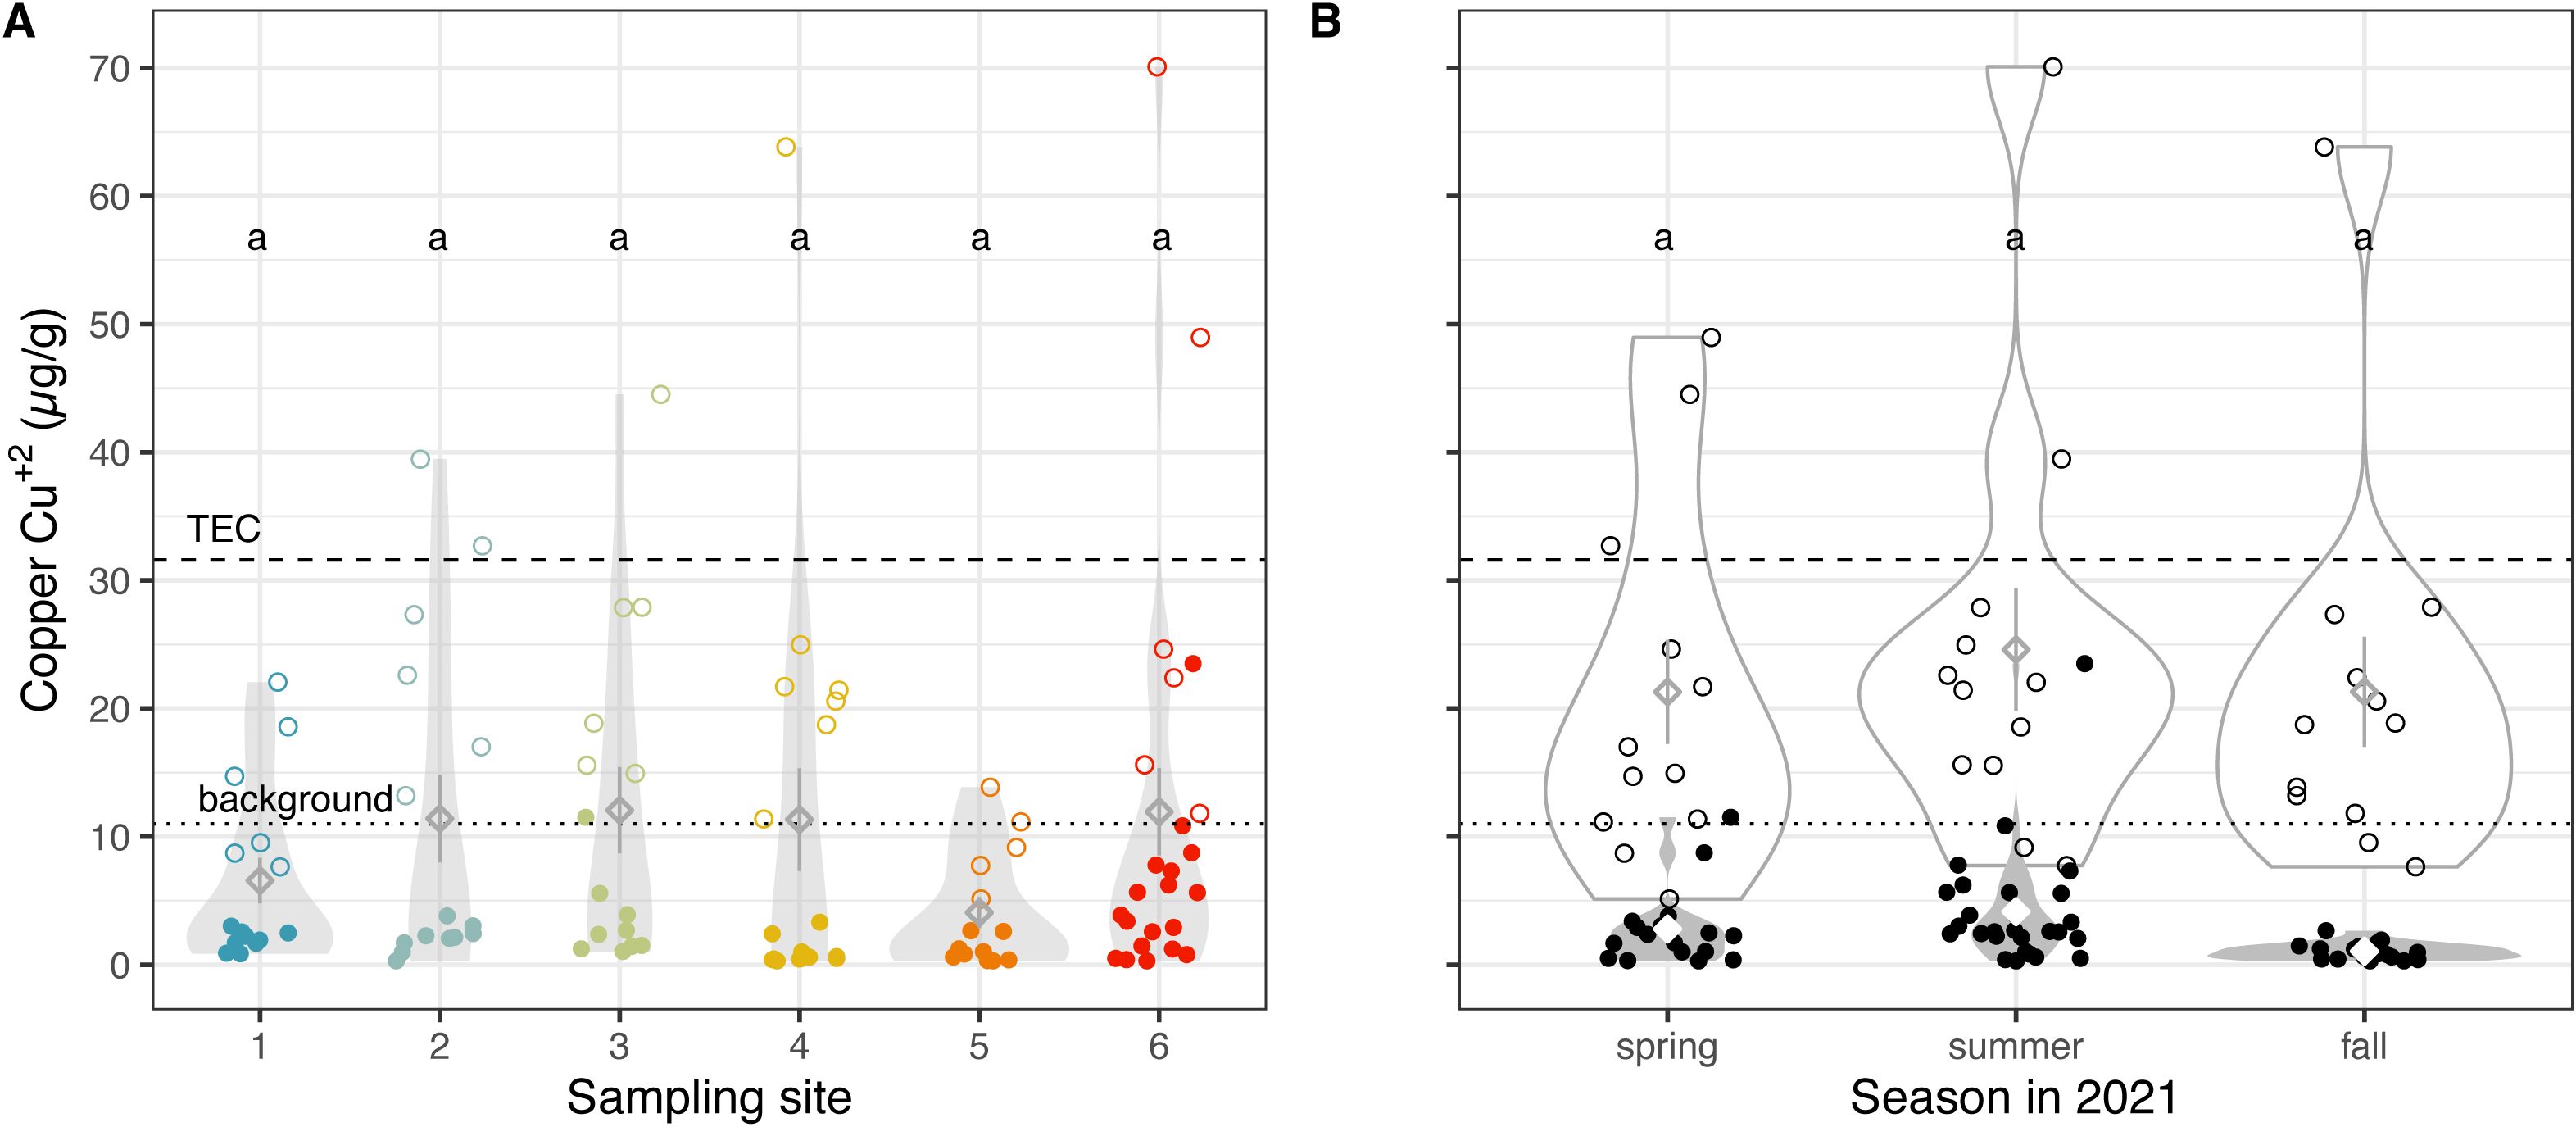
Figure 2. Copper levels remain elevated in the Salt Lake region. Copper concentrations (A) across sampling sites, colored by the site from which the soil was collected, and (B) across three seasons in 2021, using two extraction methods. Each datum represents measurements from a single dried benthic sediment sample. Unfilled points represent sediment samples analyzed with the EPA 3050b method, while filled points show samples analyzed with NH4AcO pH = 7, a proxy for bioavailability. Diamonds indicate means; whiskers indicate standard error; and violin plots indicate distribution of data (A) per site and (B) per extraction method, per season. Means not sharing any letter are significantly different by a post-hoc test at the 5% level of significance. The dry mass background level (11 µg/g dry mass) (21) is shown with a dotted horizontal line, while the threshold effects concentration (TEC = 31.6 µg/g, below which harmful effects are unlikely to be observed) is shown with a dashed horizonal line and probable effect concentration (PEC = 149 µg/g, above which harmful effects are likely to be observed) of copper in soil is not exceeded (29).
When considering data from both extraction methods combined, we found a consistent level of copper in submerged sediment across all six sites (Figure 2A; Supplementary Table S1, ANOVA, Chi Sq = 7.7739, df = 5, p = 0.17), and Great Salt Lake sites compared with freshwater sites (Wilcoxon rank sum test, z = 0.7189, p = 0.2361), as well as across seasons (Figure 2B; Supplementary Table S1, ANOVA, Chi Sq = 0.3265, df = 2, p = 0.85), which ranged from 0.3 to 70.1 µg/g. The consistency of elevated copper in submerged sediments across all six sites (Figure 2A) suggests atmospheric transport of copper may dominate in this system, as opposed to fluvial transport of contaminants via rivers. Interestingly however, the concentrations differed significantly between methods, with consistently higher values measured by EPA 3050b (Figure 2A, Wilcoxon rank sum test, z = 7.8160, p = 2.727e-15). As expected, the values from EPA 3050b are closer to concentrations found in dust using total digestion (22) and comparable to concentrations from Antelope Island surface sediments (21). When we consider extracted fractions from EPA 3050b data separately, our results pick up significant differences in copper concentrations by site with the southernmost site 6 (on the northern end of Antelope Island) having the highest concentration (Figure 2A; Supplementary Table S1). This geographic pattern is consistent with spatial patterns found by Perry et al., (22) that may reflect closer proximity to Kennecott Utah Copper tailings pile on the south shore of the lake.
Altogether, when viewed holistically our results show that shallow subsurface sediment in GSL continues to have above background copper concentrations. However, comparing the two different extraction methods reveals that bioavailable copper is at relatively low levels and appears to be distributed atmospherically. Meanwhile, the higher levels of copper, which have a geographic bias, are not readily available because they are only observed with the EPA 3050b method.
Thallium levels are low but fluctuate seasonally in GSL sediments
Thallium is a highly toxic metal that is naturally found in its oxidized states Tl+ and Tl3+ in trace amounts in the air, water, and soil. General sources of thallium to the environment include fossil fuel combustion, electronics industry, cement industry, and waste incineration. Much of the observed thallium in Salt Lake valley dust traps can be attributed to direct particulate pollution from copper mining, concentrating, and/or smelting activities (30). Although historically used to make electronics and rat poison, thallium is no longer produced in the US, as it can be fatal from a dose of more than 1.5 mg per 1 kg body mass (31). Our samples range from 0.0023 to 1.3262 µg/g, with one sample exceeding the environmentally safe limit of 1 µg/g (31) (Figure 3). If we consider the two extraction methods separately, we uncover some differences in thallium concentration by site, where site 4 is high in the carbonate fraction and site 6 is high in the bioavailable fraction of thallium (Supplementary Table S1).
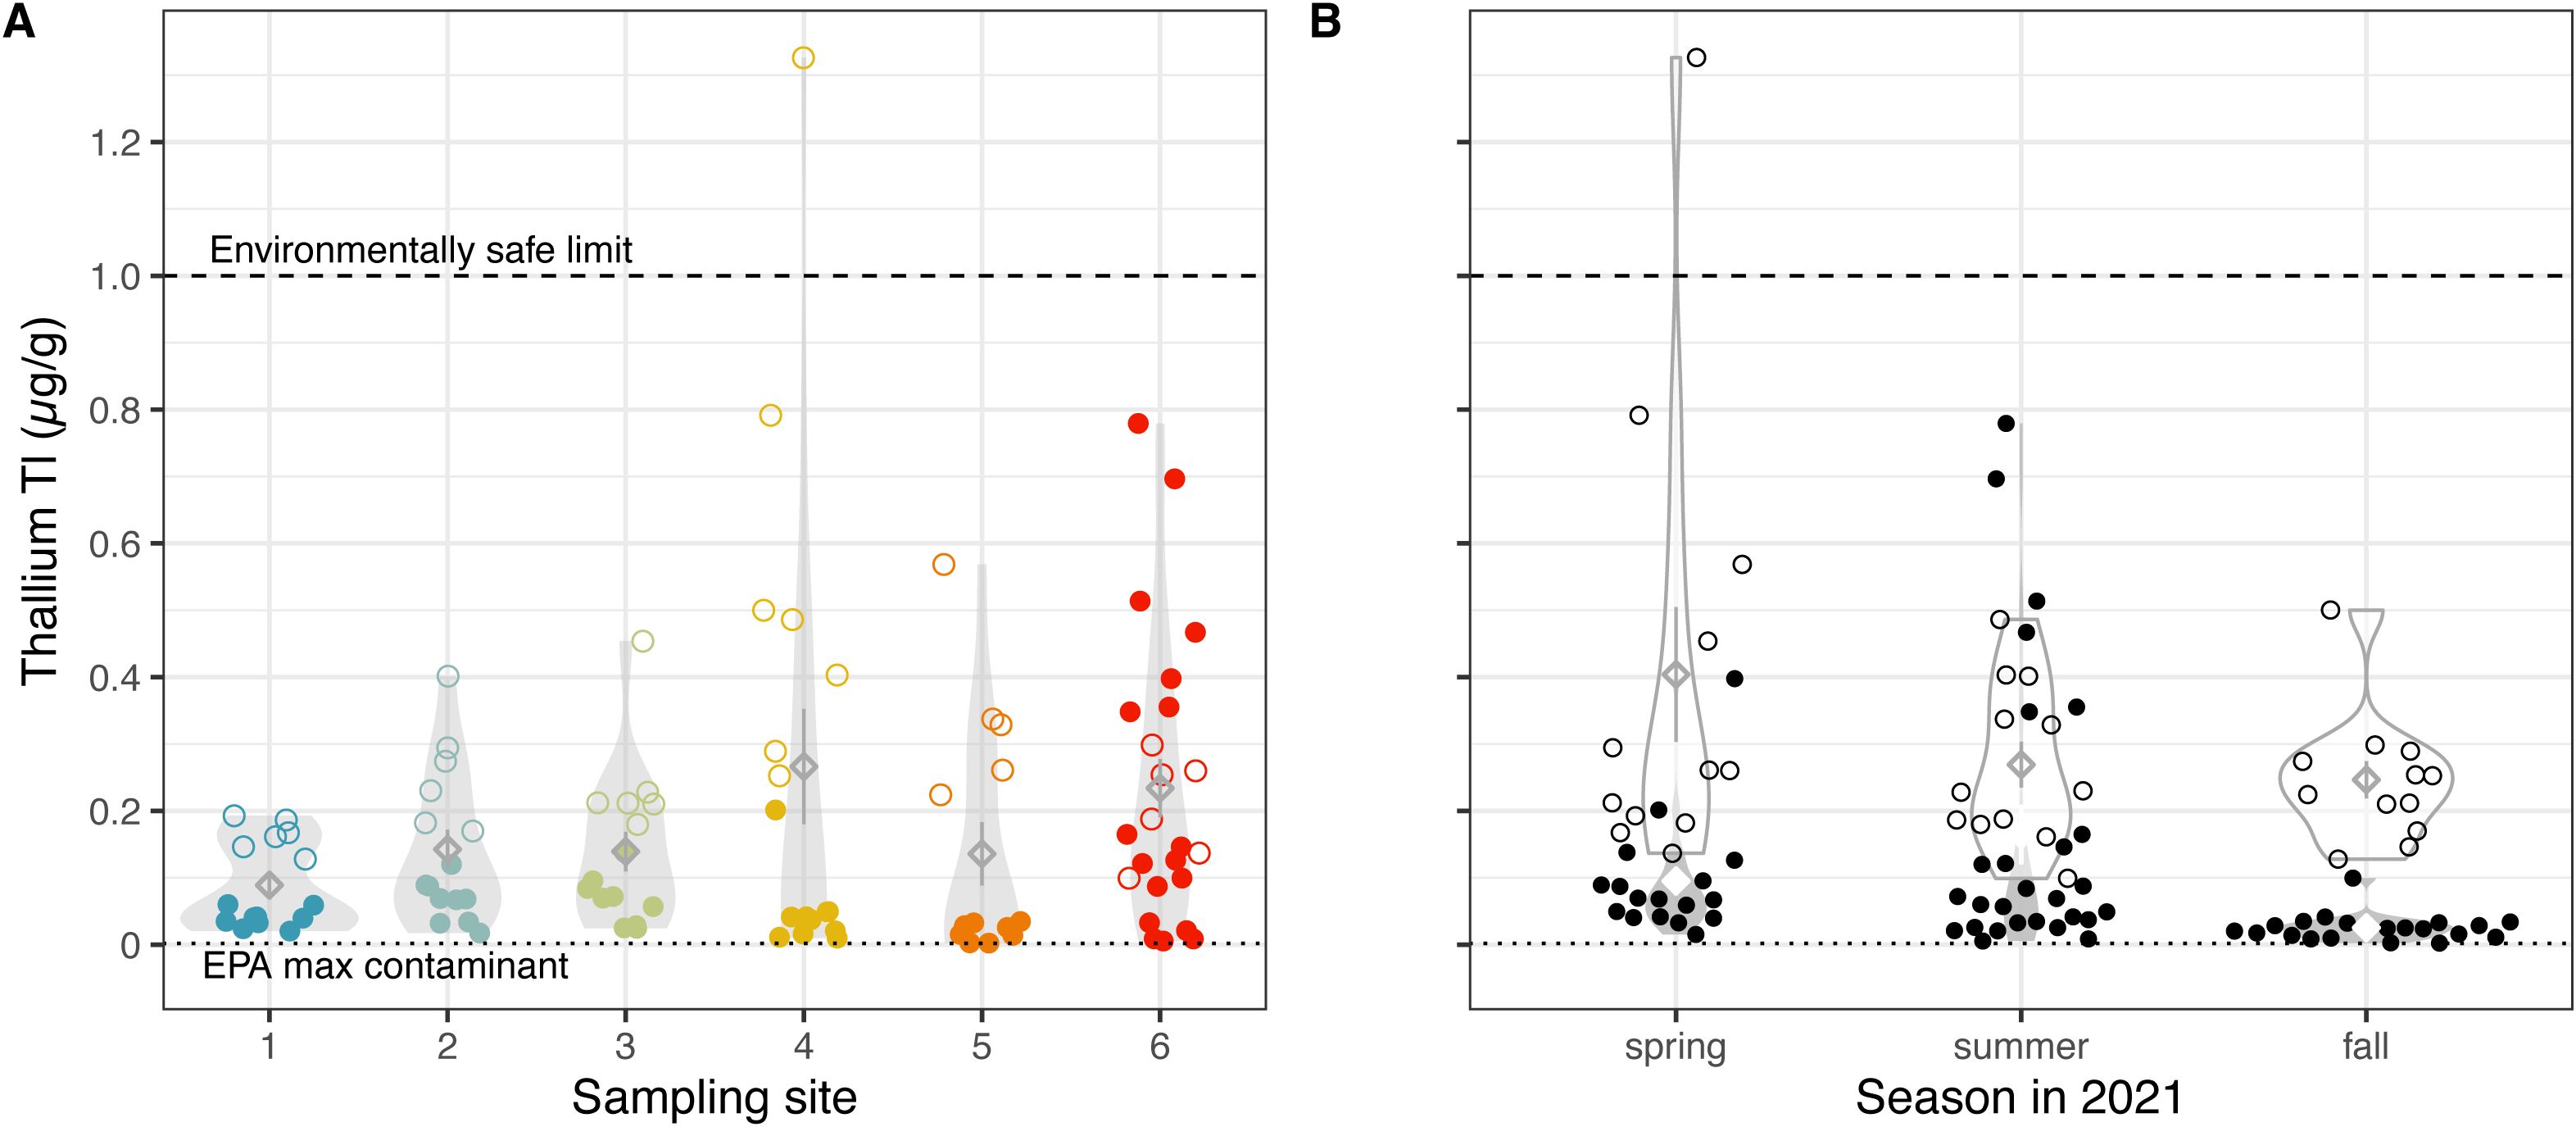
Figure 3. Thallium levels approach concentrations of environmental concern. Thallium concentrations (A) across sampling sites, colored by the site from which soil was collected, and (B) across three seasons in 2021, using two extraction methods. Each datum represents measurements from a single dried benthic sediment sample. Unfilled points represent sediment samples analyzed with the EPA 3050b method, while filled points show samples analyzed with NH4AcO pH=7, a proxy for bioavailability. Diamonds indicate means; whiskers indicate standard error; and violin plots indicate distribution of data (A) per site and (B) per extraction method, per season. Means not sharing any letter are significantly different by a post-hoc test at the 5% level of significance. The environmentally safe limit for Thallium concentrations in sediments (31) is denoted by a horizonal dashed line.
Our values for thallium in submerged GSL sediments largely correspond to recent investigations of thallium in unsubmerged sediment (22). However, our temporal sampling uncovered significant seasonal differences in thallium that largely correspond to lake elevation levels; i.e., highest in spring (Supplementary Figure S1, Supplementary Table S1). Interestingly, this trend is followed by higher levels of bioavailable thallium in the summer. One possibility is that GSL collects additional thallium in the spring due to the influx of fresh snowmelt from mountains. Altogether, we observed relatively low – but fluctuating – levels of thallium in GSL sediment. Thallium does not break down in the environment and even traces of the metal can pose major health concerns, thus its levels should continue to be monitored, particularly as lake levels change.
Arsenic is maintained at high levels in Great Salt Lake benthic sediment
Background levels of arsenic in GSL sediments from Gilbert Bay were ~13 µg/g and began increasing in the late 1800s, reaching 25 – 50 µg/g during the second half of the past century (21). Unlike the progression of most metals in this lake, concentrations of arsenic have not declined in recent history (21). Our measured arsenic concentrations ranged from 0.18 to 118.89 µg/g, and these levels are largely coincident with other recent studies examining unsubmerged sediment (22), except for two samples at site 6 with especially high arsenic concentrations of 96.25 and 118.89 µg/g. These surpassed the TEC of arsenic (9.79 µg/g) by more than 1000% (29) (Figure 4). In fact, 60.0% of samples collected within Gilbert Bay exceeded the TEC of arsenic and 27.3% of samples exceeded the Probable Effects Concentration (PEC) of arsenic (33.0 µg/g), indicating likely harmful effects from arsenic in the GSL ecosystem (29) (Figure 4). The EPA3050b method yielded higher values than neutral pH extraction methods, especially in sites in the south arm (Wilcoxon rank sum test, z = 4.112, p = 1.962e-5), suggesting that not all the arsenic within the GSL is environmentally available. Nevertheless, the two exceptionally high samples were measured using neutral pH extraction methods and a proxy for bioavailable fractions.
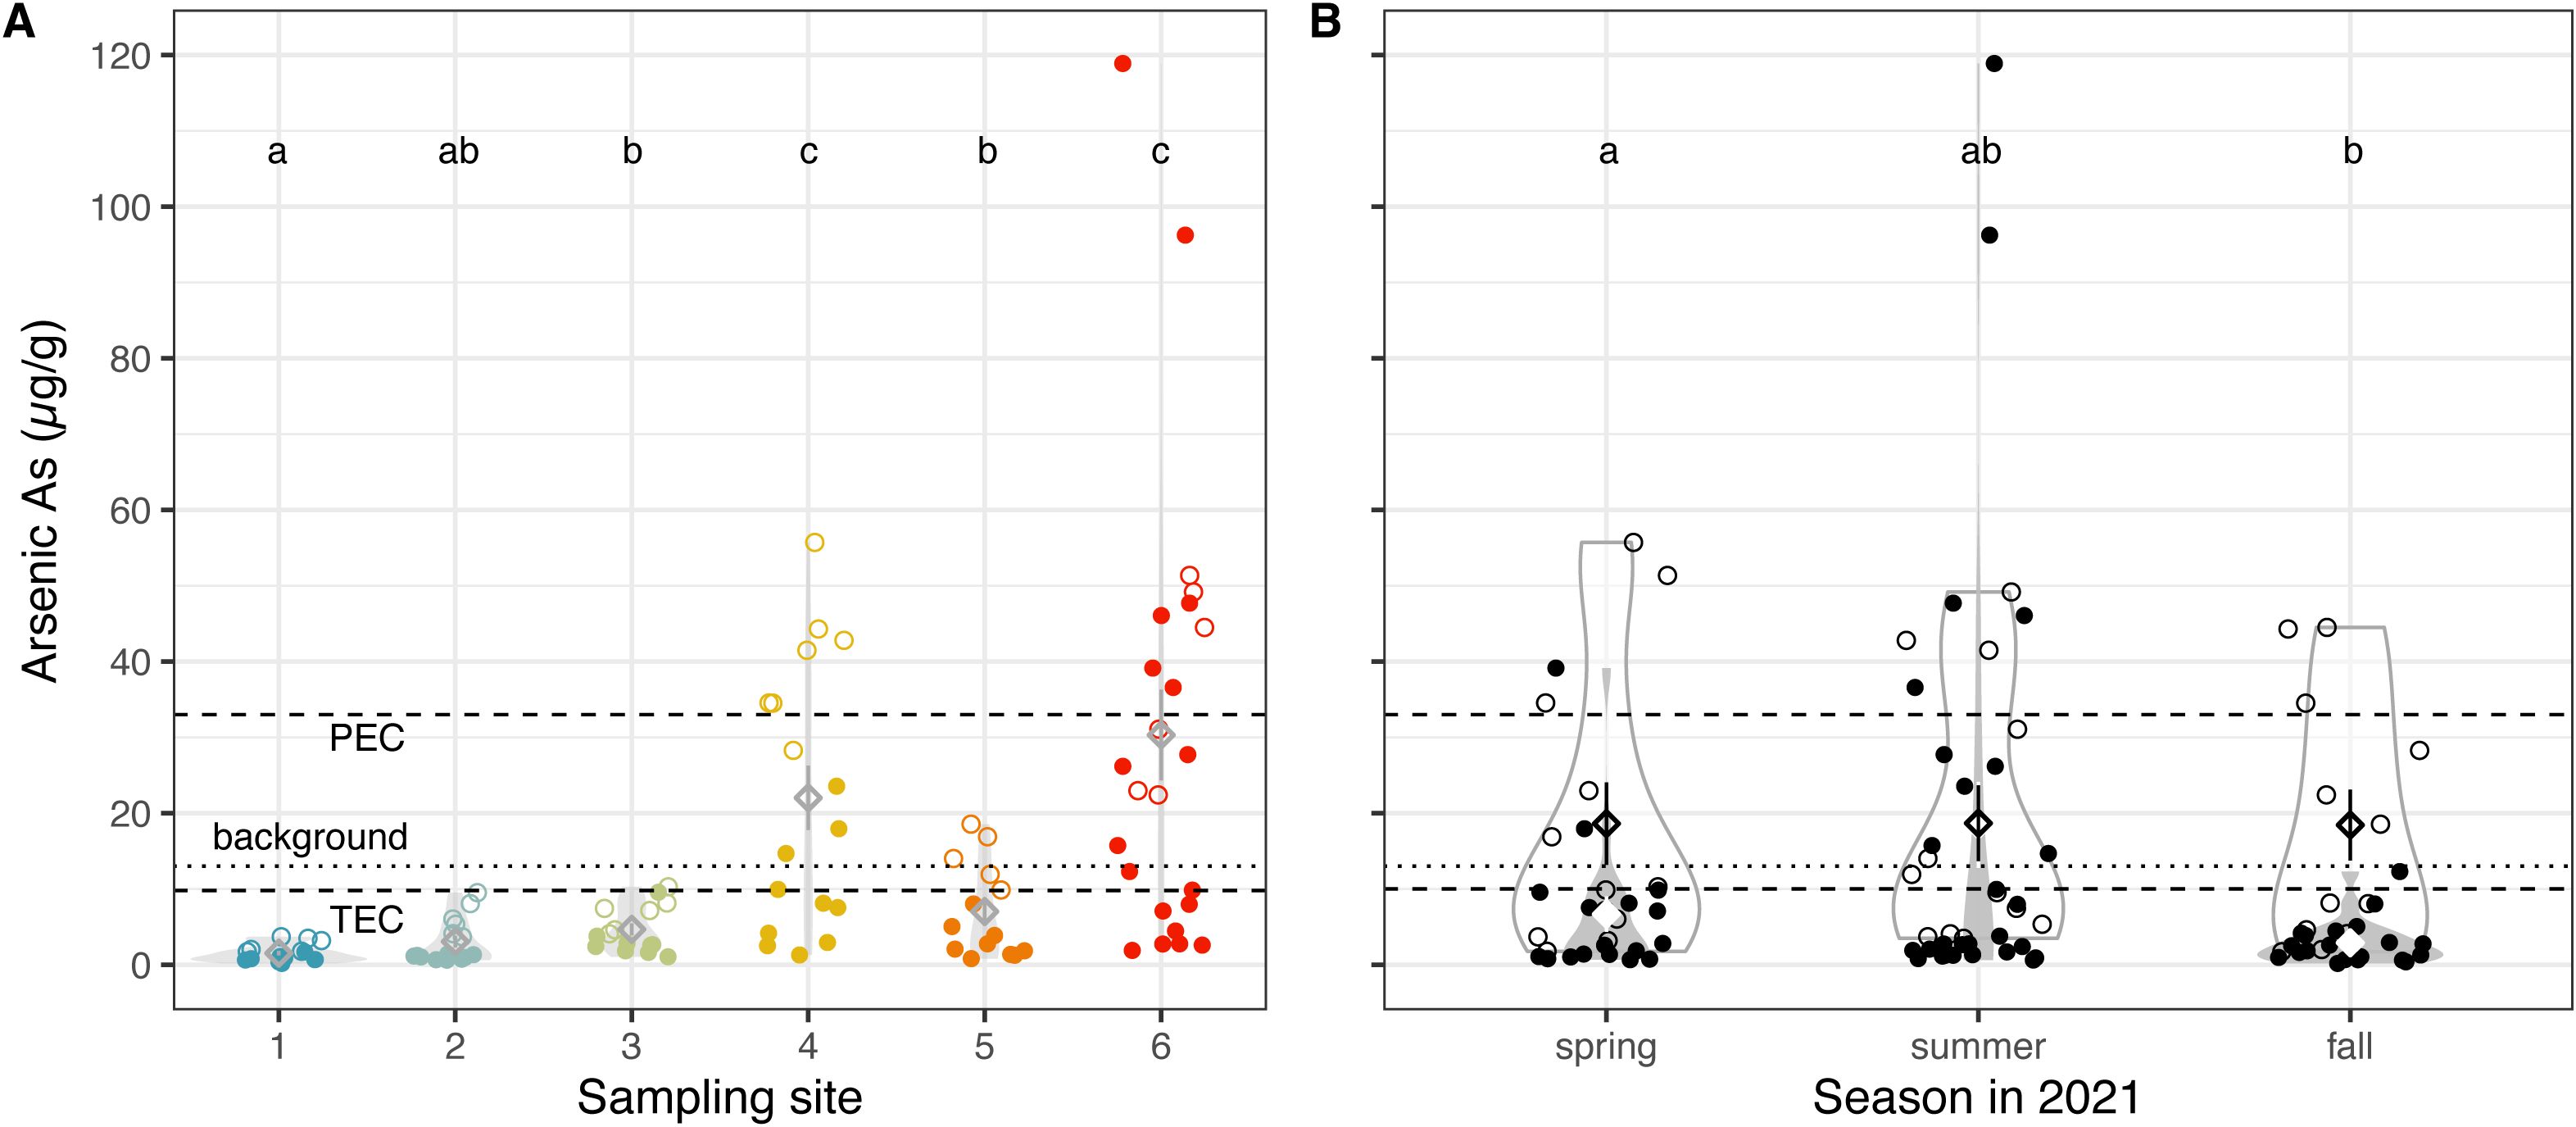
Figure 4. Arsenic levels remain high in Great Salt Lake benthic soils. Arsenic concentrations (A) across sampling sites, colored by the site from which soil was collected, and (B) across three seasons in 2021, using two extraction methods. Each datum represents measurements from a single dried benthic sediment sample. Unfilled points represent sediment samples analyzed with the EPA 3050b method, while filled points show samples analyzed with NH4AcO pH=7, a proxy for bioavailability. Diamonds indicate means; whiskers indicate standard error; and violin plots indicate distribution of data (A) per site and (B) per extraction method, per season. Means not sharing any letter are significantly different by a post-hoc test at the 5% level of significance. The dry mass background level (13 µg/g dry mass) (21) is shown with a dotted horizontal line, while the threshold effects concentration (TEC = 9.79 µg/g, below which harmful effects are unlikely to be observed) and probable effect concentration (PEC = 33.0 µg/g, above which harmful effects are likely to be observed) of arsenic in soil are shown with a dashed horizonal line (29).
Interestingly, arsenic concentrations within Gilbert Bay were consistently higher than in freshwater and brackish sites (Figure 4A, Wilcoxon rank sum test, z = 5.908, p = 1.734e-9). All but one sample collected at freshwater and brackish sites were under background levels, whereas all but one sample from GSL sites measured with the EPA3050b method were above background levels. The difference between river input and lakebed sediment suggests that retention of fluvial-derived As-bearing particulates is the main source of arsenic in the lake. The arsenic in this region is generally thought to be geologically sourced from ancient volcanic rocks. Therefore, it is high in many rivers and lakes across much of West and Southwest (32), and has accumulated in low-elevation basins over time (33). Mining activity (roasting, smelting) and acid mine drainage can leach additional arsenic and result in locally higher concentrations (33).
Total mercury in submerged sediments peaked during low lake elevation
Mercury is a toxic heavy metal and global environmental pollutant of major concern (34–37). Mercury exists in nature in three different forms, namely as elemental or metallic mercury Hg(0)/Hg0, divalent or mercuric mercury Hg(II)/Hg2+, and organomercury compounds such as monomethylmercury (MeHg). Herein, we measured total mercury, including inorganic, methyl, and elemental mercury forms. Our data indicate that total mercury levels from benthic soil samples were lower than the TEC (0.18 µg/g) (29) and mostly (with the exception of one sample) within the background historic level of mercury concentrations (0.1 µg/g) (21) in Gilbert Bay (Figure 5). All our study sites had similar levels of mercury (Figure 5A, χ2 = 9.814, p = 0.0807), although there were notable high-concentration outliers in sites 4-6. Nevertheless, the consistency of average concentrations suggests that much of the mercury in GSL originates from a global mercury pool and atmospheric deposition rather than a particular point source or through fluvial transport.
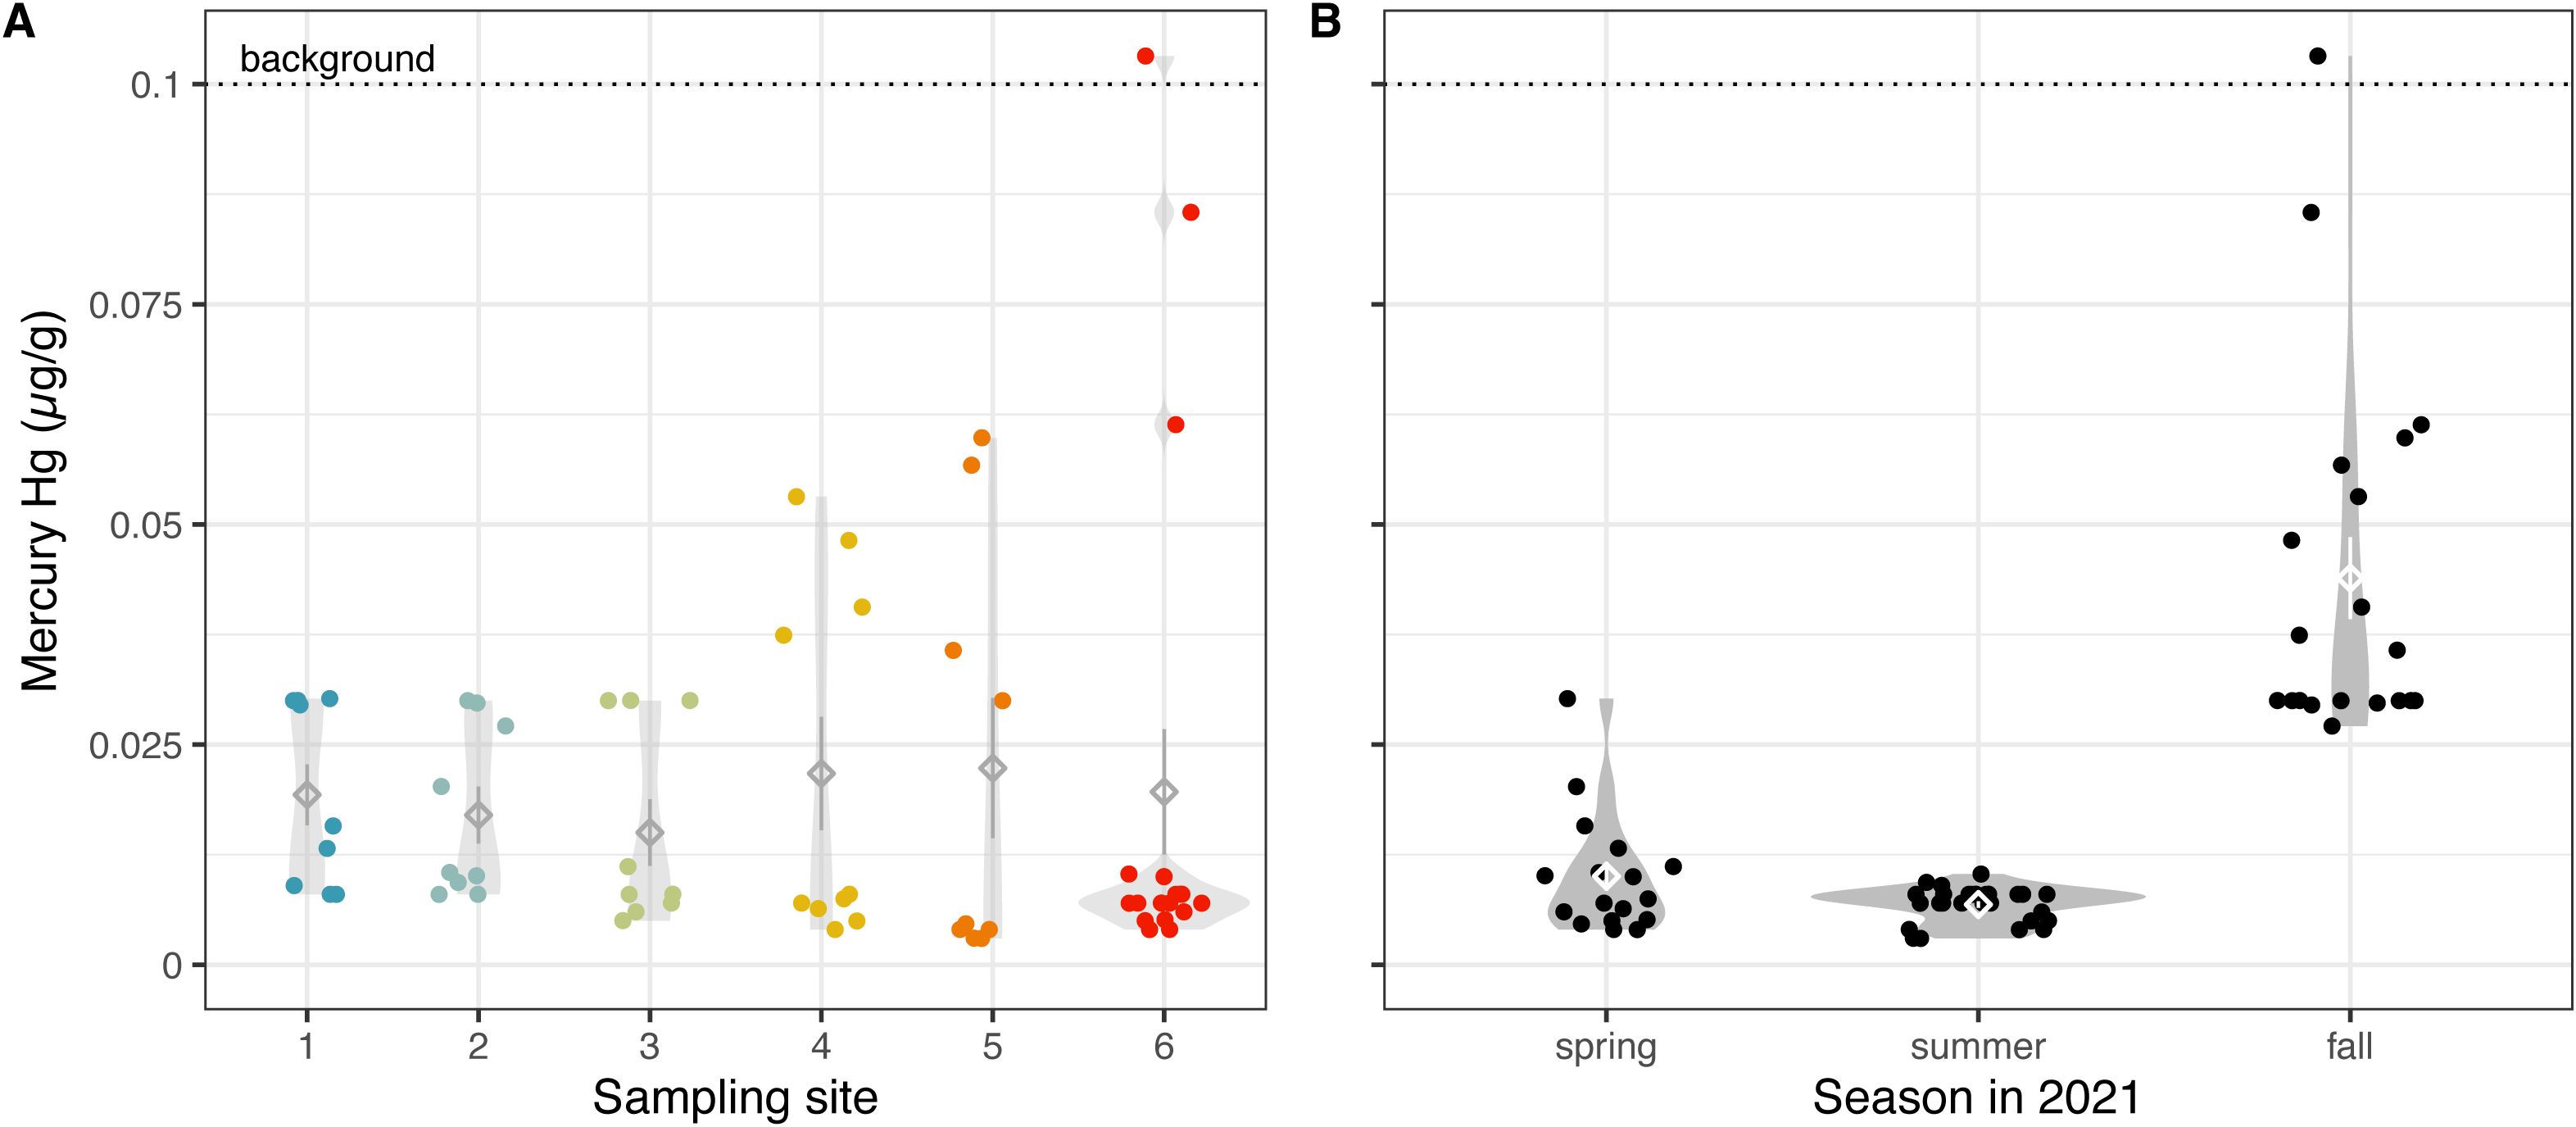
Figure 5. Trends in mercury concentrations are highly seasonal. Mercury concentrations (A) across sampling sites, colored by the site from which soil was collected, and (B) across three seasons in 2021, using two extraction methods. Each datum represents measurements from a single dried benthic sediment sample using the NH4AcO pH=7 extraction method, a proxy for bioavailability. Diamonds indicate means; whiskers indicate standard error; and violin plots indicate distribution of data (A) per site and (B) per extraction method, per season.
Lower lake levels typically correlate with lower mercury concentrations in sediment cores (38). Therefore, we were surprised to find a significant increase of mercury in the fall, which coincided with the lowest lake elevation in 2021 (4190.44 ft) (χ2 = 232.78, p < 2.2e-16, Figure 5B; Supplementary Figure S1). It’s tempting to speculate that this high level is a result of the extreme record low lake elevation that pushed the ecosystem passed historical patterns, but at the moment the reason behind this seasonal increase remains unknown.
Lead & zinc are potentially sequestered in the deep brine layer
Lead and zinc share similar chronologies. Both had historically low background concentrations of 7 (Pb) and 45 (Zn) µg/g, but after the railroad was completed in 1869 and mining of both minerals became the goal of a commercial operation, levels increased well above background. The subsequent decrease in sediments deposited since the mid-1970s is likely due to cessation of smelting, the temporary halt at the Kennecott mine in 1985, and emissions controls after mining resumed in 1987 (Bill Johnson, personal communication).
For most sediments in our study, the EPA 3050b is 10 to 20 times larger than the NH4AcO pH=7 method (Figure 6, Pb: z = 4.28, p = 9.2e-6, Zn: z = 7.29, p = 1.6e-13). For the most contaminated samples, however, both methods give similar results, indicating that the lead and zinc is bioavailable in those sites. Lead levels are in line with recent findings from exposed sediments from the lakebed (22), but zinc levels are largely below what was observed (average 133 µg/g vs. average 31 µg/g herein), which is likely due to the Perry et al. (22) values being from total digestion.
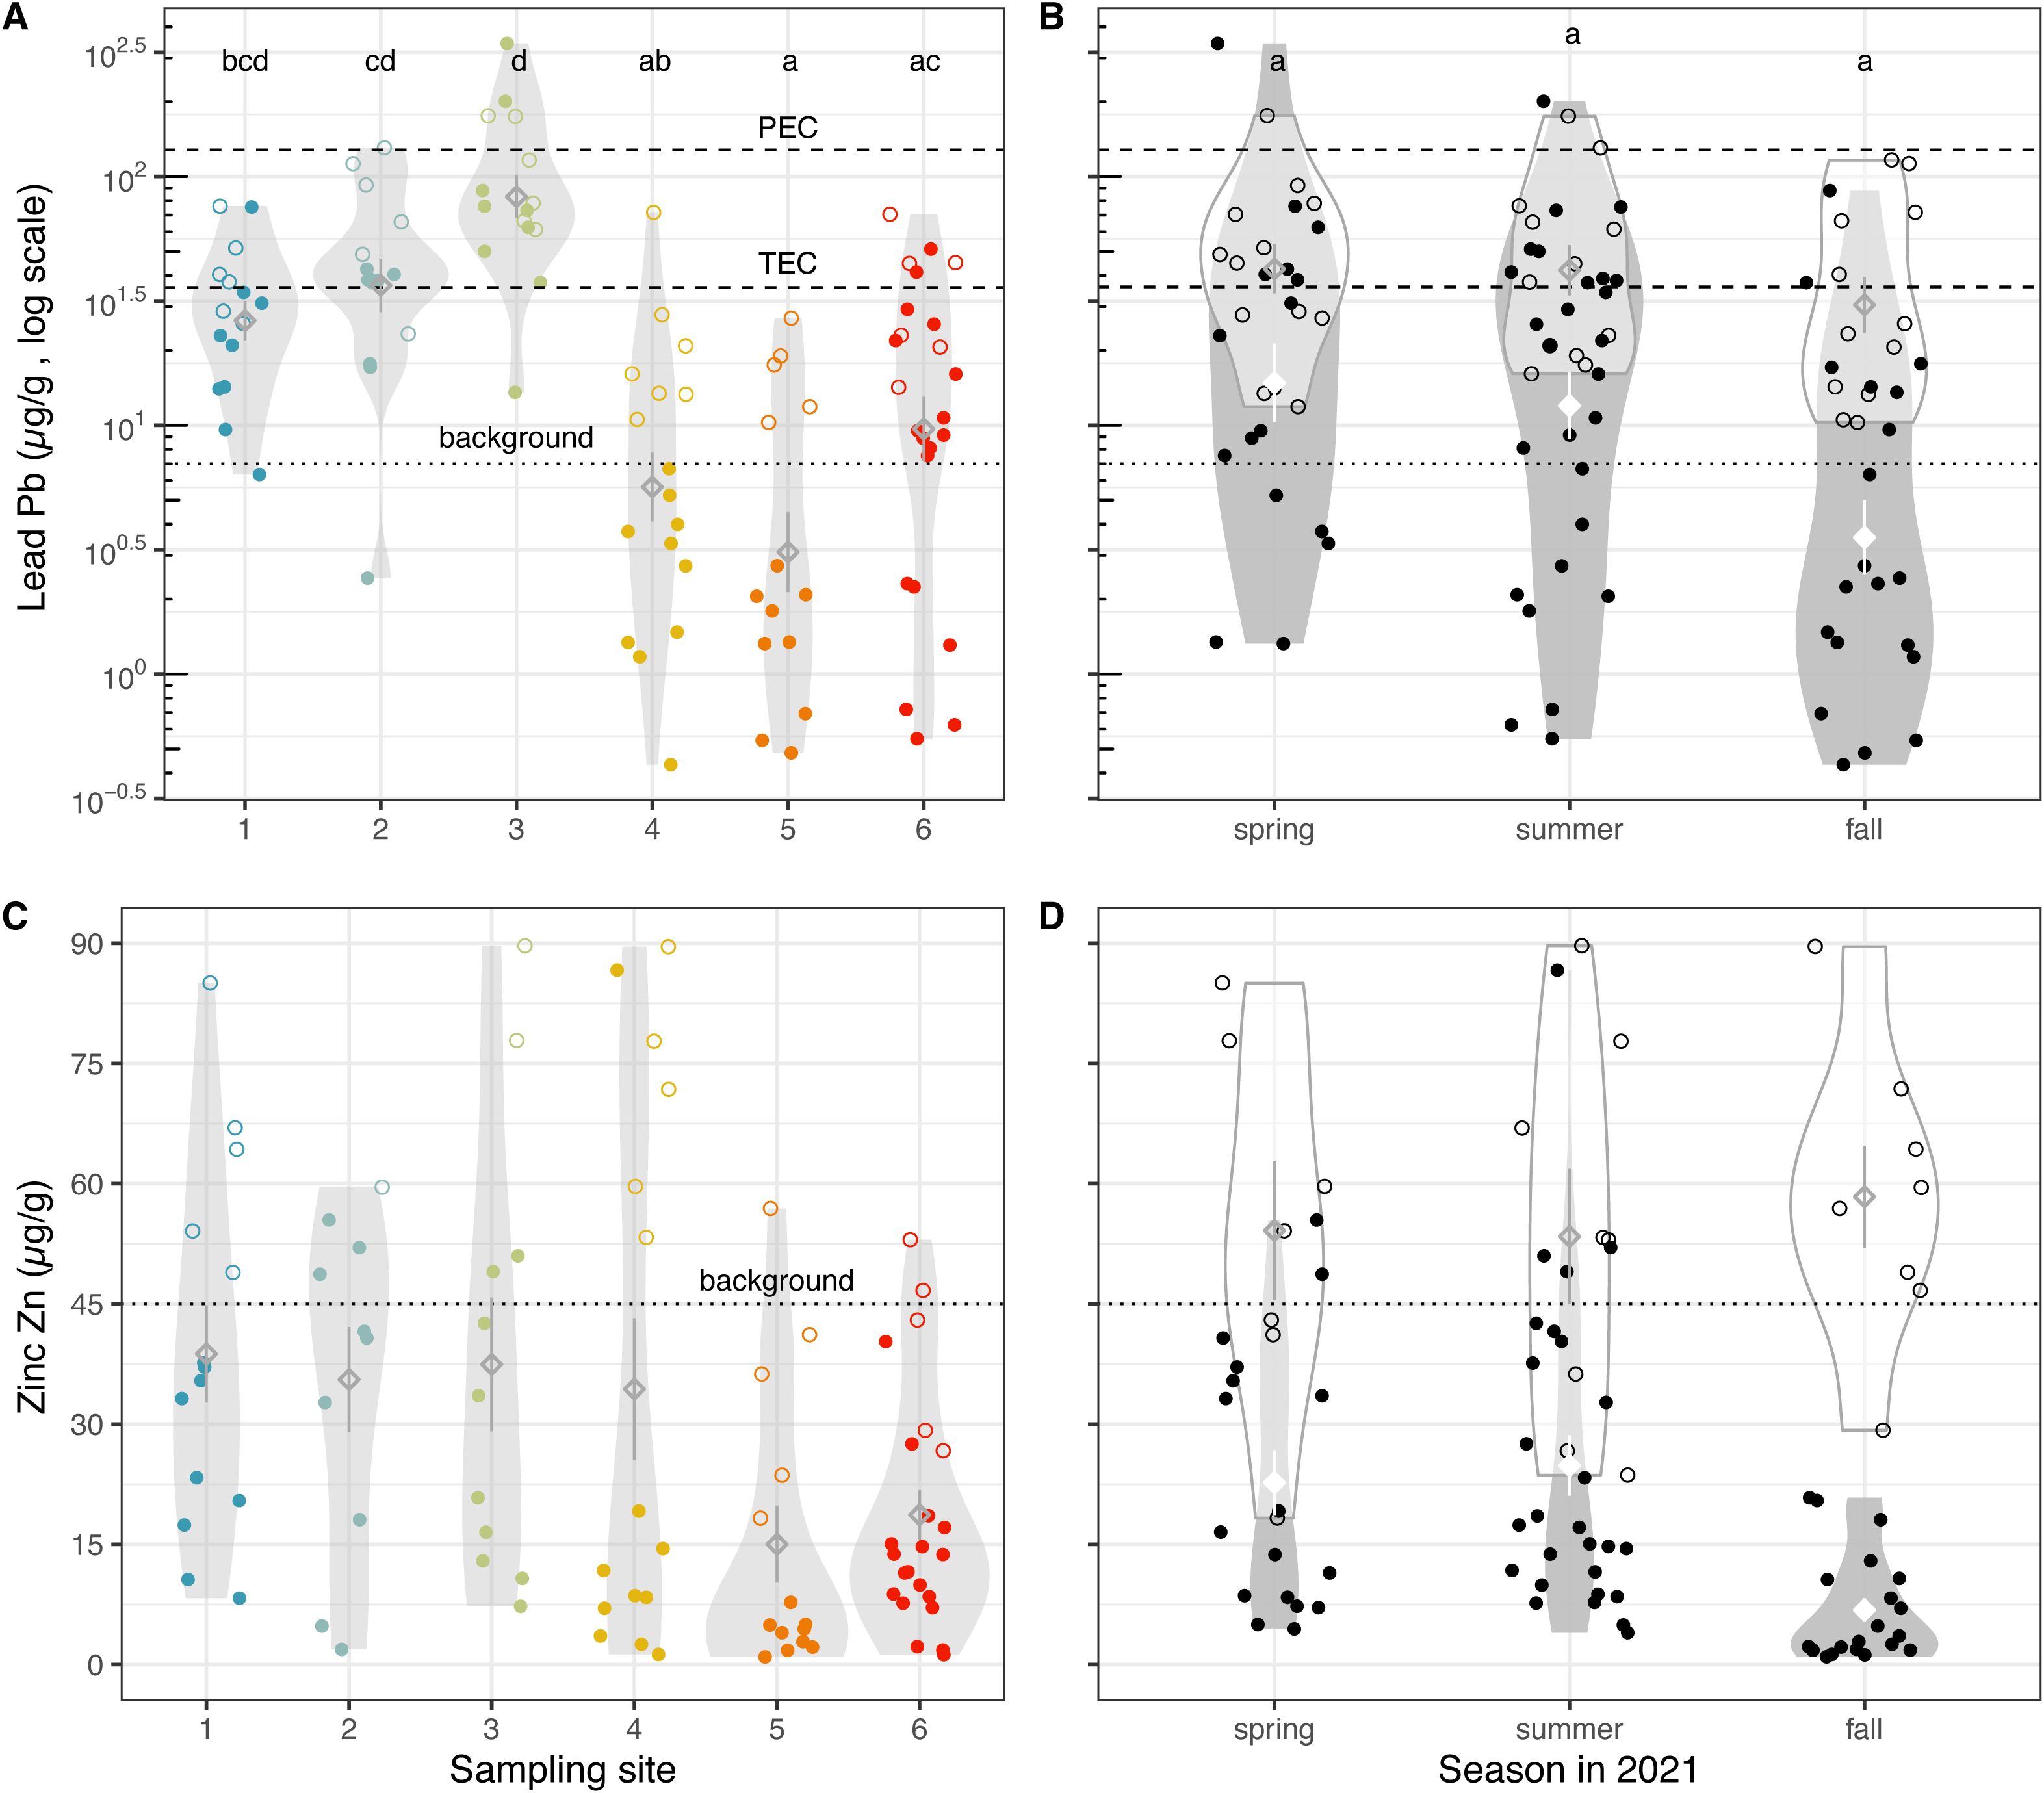
Figure 6. Lead and zinc are potentially sequestered in the deep brine layer. Lead concentrations (A) across sampling sites, colored by the site from which soil was collected, and (B) across three seasons in 2021, using two extraction methods and shown on a log scale. Zinc concentrations (C) across sampling sites, colored by the site from which soil was collected, and (D) across three seasons in 2021, using two extraction methods. Unfilled points represent sediment samples analyzed with the EPA 3050b method, while filled points show samples analyzed with NH4AcO pH=7, a proxy for bioavailability. Diamonds indicate means; whiskers indicate standard error; and violin plots indicate distribution of data (A, C) per site and (B, D) per extraction method, per season. Means not sharing any letter are significantly different by a post-hoc test at the 5% level of significance. The average background or historic level of each metal is shown with a dotted horizontal line (21), while the threshold effects concentration (TEC = 35.8 µg/g, below which harmful effects are unlikely to be observed) and probable effects concentration (PEC = 128 µg/g, above which harmful effects are likely to be observed) of lead in soil are shown with a dashed horizonal line (29).
Overall, we observed that several sediment samples were above background concentration levels. Six out of 92 GSL samples (6.52%) surpass the TEC for lead contamination in soil, and 30 samples (32.61%) exceed background levels (Figures 6A, B), while 12 samples (13.04%) exceed background levels for zinc (Figures 6C, D). Both lead and zinc were found in elevated levels in Weber River waters in 1999 to 2000, and researchers implicated mining in the area (39). Herein we found that there was less lead in GSL samples (median 9 µg/g, mean 14 µg/g) than in freshwater input samples (median 40 µg/g, mean 63 µg/g; z = 6.32, p = 1.338e-10), and similarly less zinc in GSL samples (median 14 µg/g, mean 31 µg/g) than in freshwater input samples (median 49 µg/g, mean 62 µg/g; z = 3.888, p = 5.052e-05). It’s possible that the deep brine layer in the GSL may sequester these toxins when they reach the lake, preventing their release into shallower layers of the lake (Figures 6A, C).
Materials and methods
Sites and sampling
From each of the six sites we performed ICP-MS on approximately three samples across each season (spring, summer and fall, except site 5 spring, of which we only analyzed two samples, and site 4 and 5 fall, of which we analyzed four samples), providing a total of 55 samples. As input, we used 400-600 mL of shallow (<10 cm) sediment near the water interface, as its metals most readily diffuse into the water column and are the most likely to become toxic dust if exposed. Moreover, metals from surface sediment are more likely to be taken up by photosynthetic microorganisms that are important primary producers in the lake. Sediment samples were collected from six sites of varying salinities in and around the GSL (Figure 1) during three seasons between May and October of 2021, encompassing a period when the lake was experiencing historic lows in elevation (Supplementary Figure S1). Site 1 (41°13’2.0”N, 112°09’38.8”W) and Site 2 (41°13’18.5”N, 112°12’03.4”W) were freshwater sites along the Weber River, one of the three rivers flowing into the GSL. Site 3 (41°10’08.4”N, 112°11’27.5”W) was a transition zone with intermediate salinity very near the Weber River input into the GSL. Site 4 (41°07’51.0”N, 112°18’21.0”W) was at the southern tip of Fremont Island within the GSL, while Site 5 (41°07’3”N, 112°16’10”W) was a coastal area at the edge of the receding lake, and Site 6 (41°03’18”N, 112°15’18”W) was along the beach at Bridger Bay on the northwestern end of Antelope Island. To collect shallow submerged sediments, we used a shovel or PVC pipe cupped at one end by hand. Since the lake was too saline to use a motor, we were limited by how far we could paddle, bike, or hike in a single day. Sea kayaks were used as transport between islands in the Spring and Fall to sample from positions not reachable on foot or by bike. Sediment samples were returned to the lab, stored wet in plastic containers at 15°C, and processed over the following week. Sediments were dried for 48 h at greater than 100°C and sieved through a 2 mm plastic mesh to remove coarse plant material and rock fragments.
Determination of extractable elements at pH = 7
Dry sediments were leached with 1 M NH4AcO (as known as NH4CH3CO2 or ammonium acetate) buffer at pH = 7 for the determination of the bioavailable fractions of Cu, Zn, As, Hg, Tl and Pb (26). Since this leaching method with ammonium acetate displaces exchangeable cations on clay and organic matter, typically in agricultural soils, it is typically associated with the estimation of plant-available base cations, i.e. those available to roots and environmentally available in sediments. However, it is a softer digestion method compared to the total digestion method employed by Perry et al. (22), which may account for the relatively low values found in our submerged sediments compared to that found in their unsubmerged dust. About 100 mg of sediments were mixed with ~5 g buffer using a vortex and left for 24 h with occasional stirring. After centrifuging at 5000 rpm for 10 min, a 0.100 mL aliquot of the supernatant was diluted with 2.4% HNO3 to 10.0 mL; 10 ppb indium (In) was added as internal standard and mixed in a polystyrene tube. Determination of Na, Mg, K, Ca, P, Mn, Fe, Cu, Zn, As, Hg, Tl and Pb in this solution was performed using a triple quadrupole inductively coupled plasma mass spectrometer (ICP-MS, Agilent 8900, Santa Clara, California, USA) at the ICP-MS lab of the Department of Geology and Geophysics, University of Utah (https://earth.utah.edu/research_facilities/earth-core-facility/icp-ms.php). The total dilution factor was around 5000, making the Na concentration introduced in the ICPMS a maximum of 20 μg/mL for any of the sediments studied. 23Na, 24Mg, 55Mn, 63Cu, 202Hg, 205Tl and 208Pb were measured with He flowing at 2 mL/min in the collision cell; 39K, 43Ca and 56Fe were measured using 1 mL/min H2 in the collision cell; 31P, 66Zn and 75As were measured using 4 mL/min O2 in the collision cell. An external calibration curve was prepared from 1,000 mg/L single-element standards (Inorganic Ventures, Christiansburg, VA, USA) with maximum concentrations of 0.04, 0.2, 0.04, 0.002 and 0.02 μg/mL for Cu, Zn, As, Tl and Pb respectively. A second calibration curve was prepared for P and Hg, with maximum concentrations of 10 and 0.003 μg/mL respectively. Diluted samples, calibration solutions and blanks were added 10 ng/mL in as internal standard and run in the ICP-MS using a dual-pass quartz spray chamber; PTFE nebulizer and dual-syringe introduction system (Teledyne, AVX 71000), platinum cones and sapphire injector in a platinum-shielded quartz torch. Limit of determinations (LoD) for each element were calculated as three times the standard deviation of the blanks, multiplied by the total dilution factor used for samples (~5,000). Standard reference material 1643f (Trace Elements in Water, National Institute of Standards and Technology, Gaithersburg, MD, US) was run with calibration curve and samples (one standard every 10 samples) at a dilution of 1:20, reproducing certified values for Cu, Zn, As, Tl and Pb within 5%. An in-house P standard solution prepared gravimetrically from high-purity KH2PO4 (Suprapur, Millipore-Sigma) with a concentration of 4 μg/mL, was run with P calibration curve and samples, reproducing the calculated value within 5%. The ICP-MS instrument is in a filtered air positive pressure lab and sample handling and dilutions were performed in laminar flow benches and using calibrated pipettors (Eppendorf Reference, Hamburg, Germany). All chemicals used were trace metal grade quality. Solution and dilution factors were used to calculate the concentration reported for each extracted element, in units of micrograms per g (µg/g) of sediment.
Determination of extractable elements using EPA method 3050b
Sediments were also treated with a strong acid under oxidative conditions as another standard method for extracting environmentally available elements. For this purpose, EPA Method 3050b (28) was scaled down for a homogenized sediment sample size of ~100 mg, which was mixed with 1 mL of 35% HNO3 in a PTFE closed vial and refluxed in a hot block at 95°C for 15 min. Subsequent additions of 0.5 mL concentrated HNO3 and heating cycles were performed until evolution of brown fumes ceased. In a second step, the room temperature acid digest was treated with several 0.5 mL aliquots of 20% H2O2 until no more reaction was observed. These digests were then transferred into an acid leached centrifuge tube and diluted to 10 mL. This solution was then analyzed for elemental concentration of Cu, Zn, As, Hg, Tl and Pb using the same way procedure as described above. Since all carbonate and most clay oxides are digested with the strong acids used by EPA3050b, we expect the concentrations found using this method to be closer to the ones found in Perry et al. (22) compared with the NH4AcO pH=7 method described above. On a separate study (22), the ICP-MS lab of the Department of Geology and Geophysics, University of Utah, obtained good agreement between the values obtained using total digestion of PM2.5 dust with ICP-MS detection and the ones obtained using X-ray fluorescence (XRF).
Statistics
To evaluate the statistical differences in element content in water and sediments from different sites and seasons, we performed ANOVAs using generalized linear models with site and season as categorical variables and Tukey post-hoc tests. All differences were tested for significance at p < 0.05. All statistical tests were carried out in the R statistical environment (version 4.1.2, R Development Core Team 2019, http://www.r-project.org) in RStudio (version 1.4.869, RStudio Team 2019).
Conclusion
The Great Salt Lake in northern Utah is a terminal lake without outflow; hence when water evaporates it concentrates elements and compounds from montane runoff, atmospheric deposition, and anthropogenic sources of pollution. Given that the GSL is also shallow, small changes in lake water elevation can lead to large changes in the surface area of exposed lakebed. Metals in the lakebed can be transported with dust, a potential problem for neighboring ecosystems, human health, and even the region’s snowpack (40, 41).
To better understand the health risks of exposed lakebed sediment, we measured metal concentrations in shallow benthic zones of the GSL during a record low year of lake elevation (Supplementary Figure S1). We also compared these values to sediment in an upstream river (Weber) that feeds into the GSL, and used two different extraction methods to distinguish between bioavailable and (largely) unavailable contaminants. Our analysis revealed both expected and surprising results. First, the concentrations of most metals in the GSL’s sediments have declined relative to historic highs. However, copper, thallium, and arsenic levels remain elevated, which is consistent with other recent studies (21, 22). Copper was relatively consistent across sample areas, indicating atmospheric deposition. In contrast, arsenic exhibited significantly higher concentrations in Gilbert Bay sites 4 and 6. This spatial difference might reflect accumulation in south arm benthic sediment from fluvial transmission or proximity to point sources of contamination (especially site 6). Meanwhile, lead and zinc were higher in the Weber River sites compared to sites in the south arm.
The different patterns between metals may reflect differences in mobility. The major environmental reduced form of arsenic, oxoanion AsO33- arsenite/As(III), does not interact readily with minerals and is therefore highly mobile in groundwater (42). The other dominant environmental form of arsenic, arsenate/As(V), is charged and relatively immobile. The lower concentration of total arsenic in the Weber River input indicates that as arsenic travels through this delta it is in the reduced mobile form of As(III), either as H2AsO3 or H3AsO3, depending on pH. Meanwhile, higher lead and zinc concentrations in the Weber River suggest that they are comparatively immobile, which is consistent with their propensity to sorb to fine particulate sediment that is present at these sites (43, 44). However, we note that we did not directly measure mobility rates in this study, which is required to confirm these hypotheses.
Several studies have shown that the GSL’s deep brine layer is prone to mixing. An estimated 40% of the deep brine layer is entrained into the shallow brine layer annually (45). Limited mixing also occurred between the deep and shallow brine layers of the lake during strong wind events (46). Temporary culvert closures in 2013 and 2023, which blocked water flow between the north and south arms, can also lead to the destratification and disappearance of the deep brine layer in the south arm. The dissolution of the monimolimnion into the epilimnion coincided with dramatic mercury loss from deep waters and downstream effects on biota (47, 48). If indeed lead and zinc are sequestered, our results suggest that we should continue to monitor their levels as natural and anthropogenic disturbances to the brine layer could lead to their release.
Finally, total mercury exhibited a stark increase in concentration during the nadir of lake elevation (Supplementary Figure S1), which is opposite historical trends in the GSL (38). It’s unclear what caused the increase in mercury in the Fall, but it may be insightful to explore whether a tipping point was reached for benthic organisms that metabolize or uptake mercury.
In summary, these data, along with others, indicate 1) regulatory strategies are helping to reduce toxic elements in surface sediment, 2) the source of contamination depends on the metal, and 3) several questions remain unanswered concerning sequestration by the deep brine layer and how low elevation/high salinity impacts the distribution of metals in the GSL system. As water-policy strategies are implemented in the coming years and lake elevation waxes and wanes it will be important to continue to monitor metal levels to see how they are affected.
Data availability statement
The original contributions presented in the study are included in the article/Supplementary Material. Further inquiries can be directed to the corresponding author.
Author contributions
JJ: Conceptualization, Data curation, Formal analysis, Funding acquisition, Investigation, Methodology, Resources, Software, Validation, Visualization, Writing – original draft, Writing – review & editing. CF: Writing – review & editing. DF: Methodology, Writing – review & editing. MW: Conceptualization, Funding acquisition, Methodology, Project administration, Supervision, Validation, Writing – review & editing.
Funding
The author(s) declare financial support was received for the research, authorship, and/or publication of this article. This research is based upon work supported by the NSF Postdoctoral Research Fellowships in Biology Program under Grant No. IOS-1354072 to JJ and start-up funds for MW. Any opinions, findings, and conclusions or recommendations expressed in this material are those of the authors and do not necessarily reflect the views of the National Science Foundation.
Acknowledgments
We thank Cody Fitzgerald, Samantha Nestel, Hiraya Natividad, Hannah Lee, Audrey Brown, and Thomas King for assistance during field research. We thank William P. Johnson and members of the Werner lab for multiple discussions of this research and helpful comments on the manuscript.
Conflict of interest
The authors declare that the research was conducted in the absence of any commercial or financial relationships that could be construed as a potential conflict of interest.
Publisher’s note
All claims expressed in this article are solely those of the authors and do not necessarily represent those of their affiliated organizations, or those of the publisher, the editors and the reviewers. Any product that may be evaluated in this article, or claim that may be made by its manufacturer, is not guaranteed or endorsed by the publisher.
Supplementary material
The Supplementary Material for this article can be found online at: https://www.frontiersin.org/articles/10.3389/fsoil.2024.1445792/full#supplementary-material
Supplementary Figure S1 | Daily Great Salt Lake elevations (ft) from April 1 to December 31, 2021. Sample collection days for data from this paper are shown in red. Data were collected from USGS Lake Site 10010000 at the Saltair Boat Harbor, UT (40°43’53.0”N, 112°12’46.0”W).
Supplementary Table S1 | Statistical analyses of two different methods of extraction utilized in this study (EPA 3050b method vs. NH4AcO pH=7), combined and individually. Results of statistical ANOVA test demonstrate whether the fixed effect listed has a significant effect on the given element.
References
1. Graney JR, Halliday AN, Keeler GJ, Nriagu JO, Robbins JA, Norton SA. Isotopic record of lead pollution in lake sediments from the northeastern United States. Geochimica Cosmochimica Acta. (1995) 59:1715–28:pp. doi: 10.1016/0016-7037(95)00077-D
2. Baker PA, Seltzer GO, Fritz SC, Dunbar RB, Grove MJ, Tapia PM, et al. The history of South American tropical precipitation for the past 25,000 years. Science. (2001) 291:640–3. doi: 10.1126/science.291.5504.640
3. Ma L, Wu J, Abuduwaili J. Climate and environmental changes over the past 150 years inferred from the sediments of Chaiwopu Lake, central Tianshan Mountains, northwest China. Int J Earth Sci. (2013) 102:959–67. doi: 10.1007/s00531-012-0838-4
4. McLauchlan KK, Williams JJ, Craine JM, Jeffers ES. Changes in global nitrogen cycling during the Holocene epoch. Nature. (2013) 495:352–5. doi: 10.1038/nature11916
5. Li S, Hu X, Tang Y, Huang C, Xiao W. Changes in lacustrine environment due to anthropogenic activities over 240 years in Jiuzhaigou National Nature Reserve, southwest China. Quaternary Int. (2014) 349:367–75. doi: 10.1016/j.quaint.2014.07.069
6. Hu J, Zhou S, Wu P, Qu K. Assessment of the distribution, bioavailability and ecological risks of heavy metals in the lake water and surface sediments of the Caohai plateau wetland, China. PloS One. (2017) 12:e0189295. doi: 10.1371/journal.pone.0189295
7. Yong J, Jie Z, Liwei Z, Xiaoli L, Dingding W, Jiali L, et al. Analysis of heavy metals in the surface sediments of shallow lakes in Nanjishan (Poyang Lake) Natural Wetland in China. J Environ Biol. (2017) 38:561–70. 10.22438/jeb/38/4/PRN-129.
8. Shyleshchandran MN, Mohan M, Ramasamy EV. Risk assessment of heavy metals in Vembanad Lake sediments (south-west coast of India), based on acid-volatile sulfide (AVS)-simultaneously extracted metal (SEM) approach. Environ Sci pollut Res. (2018) 25:7333–45. doi: 10.1007/s11356-017-0997-8
9. El-Alfy MA, El-Amier YA, El-Eraky TE. Land use/cover and eco-toxicity indices for identifying metal contamination in sediments of drains, Manzala Lake, Egypt. Heliyon. (2020) 6:e03177. doi: 10.1016/j.heliyon.2020.e03177
10. Keser G, Topak Y, Sevgiler Y. Concentrations of some heavy metal and macroelements in sediment, water, macrophyte species, and leech (Hirudo sulukii n. sp.) from the Kara Lake, Adiyaman, Turkey. Environ Monit Assess. (2020) 192:75. doi: 10.1007/s10661-019-8035-6
11. Redwan M, Elhaddad E. Assessment the seasonal variability and enrichment of toxic trace metals pollution in sediments of Damietta branch, Nile River, Egypt. Water. (2020) 12:3359. doi: 10.3390/w12123359
12. Haghnazar H, Hudson-Edwards KA, Kumar V, Pourakbar M, Mahdavianpour M, Aghayani E, et al. Potentially toxic elements contamination in surface sediment and indigenous aquatic macrophytes of the Bahmanshir River, Iran: Appraisal of phytoremediation capability. Chemosphere. (2021) 285:131446. doi: 10.1016/j.chemosphere.2021.131446
13. Niu Y, Chen F, Li Y, Ren B. Trends and Sources of Heavy Metal Pollution in Global River and Lake Sediments from 1970 to 2018. In: Voogt P, editor. Reviews of Environmental Contamination and Toxicology, vol. 257 . Springer International Publishing (Reviews of Environmental Contamination and Toxicology, Cham (2021). p. 1–35. doi: 10.1007/398_2020_59
14. Jaishankar M, Tseten T, Anbalagan N, Mathew BB, Beeregowda KN. Toxicity, mechanism and health effects of some heavy metals. Interdiscip Toxicol. (2014) 7:60–72. doi: 10.2478/intox-2014-0009
15. Abdel-Raheem KHM, Khalil MM, Abdelhady AA, Tan L. Anthropogenic-induced environmental and ecological changes in the Nile Delta over the past half-century. Sci Total Environ. (2024) 926:171941. doi: 10.1016/j.scitotenv.2024.171941
16. Hassibe WR, Keck WG. The Great Salt Lake, General Information Product. Denver, CO: U.S. Government Printing Office (1991). doi: 10.3133/70039229
17. Gwynn JW, Notarianni PF. Saline Minerals. In: Whitley C, editor. From the Ground Up. Logan, UT: University Press of Colorado (A History of Mining in Utah (2006). p. 101–25. doi: 10.2307/j.ctt4cgn2r.9
19. Javor B. Hypersaline Environments. Berlin, Heidelberg: Springer (Brock/Springer Series in Contemporary Bioscience (1989). doi: 10.1007/978-3-642-74370-2
20. Woolley RR. Water powers of the Great Salt Lake basin. Water-Supply Paper 517. Washington, D.C: Department of the Interior (1924). Available at: https://pubs.usgs.gov/wsp/0517/report.pdf.
21. Wurtsbaugh WA, Leavitt PR, Moser KA. Effects of a century of mining and industrial production on metal contamination of a model saline ecosystem, Great Salt Lake, Utah. Environ pollut. (2020) 266:115072. doi: 10.1016/j.envpol.2020.115072
22. Perry DK, Crosman ET, Hoch SW. Results of the Great Salt Lake dust plume study, (2016-2018). Salt Lake City, UT: University of Utah (2019). Available at: https://d1bbnjcim4wtri.cloudfront.net/wp-content/uploads/2019/12/10101816/GSL_Dust_Plumes_Final_Report_Complete_Document.pdf.
23. Null SE, Wurtsbaugh WA. Water Development, Consumptive Water Uses, and Great Salt Lake. In: Baxter BK, Butler JK, editors. Great Salt Lake Biology: A Terminal Lake in a Time of Change. Springer International Publishing, Cham (2020). p. 1–21. doi: 10.1007/978-3-030-40352-2_1
24. Goodman MM, Carling GT, Fernandez DP, Rey KA, Hale CA, Bickmore BR, et al. Trace element chemistry of atmospheric deposition along the Wasatch Front (Utah, USA) reflects regional playa dust and local urban aerosols. Chem Geol. (2019) 530:119317. doi: 10.1016/j.chemgeo.2019.119317
25. Carling GT, Fernandez DP, Rey KA, Hale CA, Goodman MM, Nelson ST. Using strontium isotopes to trace dust from a drying Great Salt Lake to adjacent urban areas and mountain snowpack. Environ Res Lett. (2020) 15:114035. doi: 10.1088/1748-9326/abbfc4
26. Food and Agriculture Organization of the United Nations. Standard operating procedure for cation exchange capacity and exchangeable bases 1N ammonium acetate, pH 7.0 method. Rome, Italy: FAO (2022). Available at: https://openknowledge.fao.org/server/api/core/bitstreams/cfc7409a-422e-4daf-86e0-6364f3d5d0fa/content.
27. Kastury F, Smith E, Juhasz AL. A critical review of approaches and limitations of inhalation bioavailability and bioaccessibility of metal(loid)s from ambient particulate matter or dust. Sci Total Environ. (2017) 574:1054–74. doi: 10.1016/j.scitotenv.2016.09.056
28. U.S. EPA. EPA method 3050B: acid digestion of sediments, sludges, and soils. Revision 2 revision 2 (1996). Washington DC. Available online at: https://www.epa.gov/esam/epa-method-3050b-acid-digestion-sediments-sludges-and-soils (Accessed 31 October 2023).
29. MacDonald DD, Ingersoll CG, Berger TA. Development and evaluation of consensus-based sediment quality guidelines for freshwater ecosystems. Arch Environ Contamination Toxicol. (2000) 39:20–31. doi: 10.1007/s002440010075
30. Putman AL, Jones DK, Blakowski MA, DiViesti D, Hynek SA, Fernandez DP, et al. Industrial particulate pollution and historical land use contribute metals of concern to dust deposited in neighborhoods along the Wasatch Front, UT, USA. GeoHealth. (2022) 6:e2022GH000671. doi: 10.1029/2022GH000671
31. Karbowska B. Presence of thallium in the environment: sources of contaminations, distribution and monitoring methods. Environ Monit Assess. (2016) 188:640. doi: 10.1007/s10661-016-5647-y
32. Anning DW, Paul AP, McKinney TS, Huntington JM, Bexfield LM, Thiros SA. Predicted nitrate and arsenic concentrations in basin-fill aquifers of the Southwestern United States, Scientific Investigations Report. Reston, VA: U.S. Geological Survey (2012) p. 2012–5065. doi: 10.3133/sir20125065
33. Miller OL. Quantifying trends in arsenic, nitrate, and dissolved solids from selected wells in Utah, Scientific Investigations Report. Reston, VA: U.S. Geological Survey (2020) p. 2020–5047. doi: 10.3133/sir20205047
34. Clarkson TW, Magos L. The toxicology of mercury and its chemical compounds. Crit Rev Toxicol. (2006) 36:609–62. doi: 10.1080/10408440600845619
35. Mergler D, Anderson HA, Chan LHM, Mahaffey KR, Murray M, Sakamoto M, et al. Methylmercury exposure and health effects in humans: a worldwide concern. Ambio. (2007) 36:3–11. doi: 10.1579/0044-7447(2007)36[3:meahei]2.0.co;2
36. Karagas MR, Choi AL, Oken E, Horvat M, Schoeny R, Kamai E, et al. Evidence on the human health effects of low-level methylmercury exposure. Environ Health Perspect. (2012) 120:799–806. doi: 10.1289/ehp.1104494
37. Syversen T, Kaur P. The toxicology of mercury and its compounds. J Trace Elements Med Biol. (2012) 26:215–26. doi: 10.1016/j.jtemb.2012.02.004
38. Naftz D, Fuller C, Cederberg J, Krabbenhoft D, Whitehead J, Garberg J, et al. Mercury inputs to Great Salt Lake, Utah: Reconnaissance-Phase results. Natural Resour Environ Issues. (2009) 15:37–49. https://digitalcommons.usu.edu/nrei/vol15/iss1/5.
39. Gerner SJ. Water quality at fixed sites in the Great Salt Lake basins, Utah, Idaho, and Wyoming, water years 1999-2000, Water-Resources Investigations Report. Salt Lake City, UT: U.S. Geological Survey (2003) p. 2003–4236. doi: 10.3133/wri034236
40. Skiles SM, Mallia DV, Hallar AG, Lin JC, Lambert A, Petersen R, et al. Implications of a shrinking Great Salt Lake for dust on snow deposition in the Wasatch Mountains, UT, as informed by a source to sink case study from the 13–14 April 2017 dust event. Environ Res Lett. (2018) 13:124031. doi: 10.1088/1748-9326/aaefd8
41. Lang OI, Mallia DV, Skiles SM. The shrinking Great Salt Lake contributes to record high dust-on-snow deposition in the Wasatch Mountains during the 2022 snowmelt season. Environ Res Lett. (2023) 18(6):1–11. doi: 10.1088/1748-9326/acd409
42. Meng X, Jing C, Korfiatis GP. A Review of Redox Transformation of Arsenic in Aquatic Environments. In: Biogeochemistry of Environmentally Important Trace Elements. Washington, DC: American Chemical Society (2002). p. 70–83. doi: 10.1021/bk-2003-0835.ch006
43. Jenne EA. Trace element sorption by sediments and soils: sites and processes. In: Chappell WR, Peterson KK, editors. Molybdenum in the environment. Marcel Dekker, New York (1977). p. 425–553.
44. Roque-Álvarez I, Sosa-Rodríguez FS, Vazquez-Arenas J, Escobedo-Bretado MA, Labastida I, Corral-Rivas J, et al. Spatial distribution, mobility and bioavailability of arsenic, lead, copper and zinc in low polluted forest ecosystem in North-western Mexico. Chemosphere. (2018) 210:320–33. doi: 10.1016/j.chemosphere.2018.07.004
45. Jones EF, Wurtsbaugh WA. The Great Salt Lake’s monimolimnion and its importance for mercury bioaccumulation in brine shrimp (Artemia franciscana). Limnol. Oceanogr. (2014) 59:141–55. doi: 10.4319/lo.2014.59.1.0141
46. Beisner K, Naftz DL, Johnson WP, Diaz X. Selenium and trace element mobility affected by periodic displacement of stratification in the Great Salt Lake, Utah. Sci Total Environ. (2009) 407:5263–73. doi: 10.1016/j.scitotenv.2009.06.005
47. Wurtsbaugh W, Jones E. The Great Salt Lake’s deep brine layer and its importance for mercury bioaccumulation in brine shrimp (Artemia franciscana). Final Rep to Utah Division Forestry Fire State Lands. (2012) Watershed Sciences Faculty Publications. Paper 551, 1–36. Available at: https://digitalcommons.usu.edu/wats_facpub/551.
48. Valdes C, Black FJ, Stringham B, Collins JN, Goodman JR, Saxton HJ, et al. Total mercury and methylmercury response in water, sediment, and biota to destratification of the great salt lake, utah, United States. Environ Sci Technol. (2017) 51:4887–96. doi: 10.1021/acs.est.6b05790
Keywords: heavy metals, anthropogenic activity, paleolimnology, pollution, contamination, arsenic, monimolimnion, ecotoxicology
Citation: Jung J, Frantz CM, Fernandez DP and Werner MS (2024) Toxic elements in benthic lacustrine sediments of Utah’s Great Salt Lake following a historic low in elevation. Front. Soil Sci. 4:1445792. doi: 10.3389/fsoil.2024.1445792
Received: 08 June 2024; Accepted: 27 August 2024;
Published: 13 September 2024.
Edited by:
Mohd Yusoff Ishak, Putra Malaysia University, MalaysiaReviewed by:
Jinsung An, Hanyang University, Republic of KoreaArbind Kumar Patel, Jawaharlal Nehru University, India
Copyright © 2024 Jung, Frantz, Fernandez and Werner. This is an open-access article distributed under the terms of the Creative Commons Attribution License (CC BY). The use, distribution or reproduction in other forums is permitted, provided the original author(s) and the copyright owner(s) are credited and that the original publication in this journal is cited, in accordance with accepted academic practice. No use, distribution or reproduction is permitted which does not comply with these terms.
*Correspondence: Michael S. Werner, bWljaGFlbC53ZXJuZXJAdXRhaC5lZHU=