 Jaswant S. Khokhar
 Martin R. Broadley
 E. Louise Ander1,3
- 1School of Biosciences, University of Nottingham, Loughborough, United Kingdom
- 2Sustainable Soils and Crops, Rothamsted Research, Harpenden, United Kingdom
- 3Inorganic Geochemistry Centre for Environmental Geochemistry, British Geological Survey, Nottingham, United Kingdom
Mineral micronutrient deficiencies are widespread in global food systems and can affect plant growth, crop quality, and human and livestock health. The mapping of soils and soil properties linked to micronutrient supply in food systems is now enabling us to better understand the linkages between soil health and function and its relationship with food quality and human health. Zinc (Zn) deficiencies in Indian soils are of particular concern in the context of crop yields and food quality. This current review aims to understand the data landscapes on soil Zn and related soil properties in India, with a particular focus on three states: Uttar Pradesh (UP), Bihar, and Odisha. The scope of the review is to identify and describe data sets from national and state-wide programmes and research experiments in which soil Zn has been reported, which could be used to provide a framework for integrated surveys and would combine wider agriculture, food systems, nutrition, and public health sectors. The largest data set on soil Zn was collected under a soil health management (SHM) programme, during which the Indian government analysed more than 30 million soil samples for Zn concentration (mg/kg) from 2015 to 2019. This study showed that 39% of Indian soils are considered Zn deficient for crop production (i.e., based on a threshold of <0.6 mg/kg); soil Zn deficiency varied from 2% to 67% across different Indian states. From this survey, soil Zn deficiency was 29%, 67%, and 48% in UP, Bihar, and Odisha, respectively. Individual data points are available for re-use at the Government of India soil health card website (https://www.soilhealth.dac.gov.in/). In addition, the All India Coordinated Research Project on Micro and Secondary Nutrients and Pollutant Elements in Soils and Plants (AICRP-MSPE) programme under the Indian Council of Agricultural Research (ICAR) analysed >240,000 soil samples from 2012 to 2018 from 28 states of India and reported ~38% soil Zn deficiency in the Indian soils. There is no programme in India that currently maps micronutrients in soil and crops together using “GeoNutrition” approaches recently reported in two countries in Africa, Ethiopia, and Malawi. Future co-ordinated soil and crop micronutrient mapping in India can help us to understand better the movement of Zn (and other micronutrients) in food systems and to inform strategies to improve the Zn status in the soil, e.g., the use of Zn fertilisers for yield and agronomic biofortification, and in the edible tissues of crops, e.g., through genetic biofortification.
Background
Zinc is an essential trace element that plants, animals, and humans require in small quantities for the normal functioning of different metabolic processes (1, 2). Approximately 20% of the human population is estimated to suffer from Zn deficiency globally. In India, dietary Zn deficiency risk has risen to ~30%, based on the Food and Agriculture Organization of the United Nations (FAO) food balance sheets for 2011 (3). At the national scale, based on a plasma/serum Zn concentration, the prevalence of plasma Zn deficiency was 19% in children of age between 1 and 4 years, varying from 1% to 41% across Indian states (n = 8,662), 28.4% in girls of age between 10 and 19 years (n = 5,737), and 35% in boys of age between 10 and 19 years (n = 5,638). Among adolescents (aged between 10 and 19 years), Zn deficiency varied from 4% to 55% across the different Indian states (4). Zinc deficiency risk is greater in people from lower socioeconomic backgrounds who have limited access to a source of high Zn food (animal products, fish, etc.) and depend upon less diversified, low Zn cereal-based diets, mainly wheat and rice, and foods with low Zn bioavailability. For example, a higher Zn deficiency rate was observed in the least wealthy people in both urban and rural areas in Malawi (5, 6).
Wheat and rice combined provide more than 60% of daily calorie intake in the Indian population and are significant sources of daily dietary Zn intake. Wheat alone supplies ~50% of daily Zn needs in India (3, 7, 8). Modern wheat varieties are inherently low in grain Zn concentration. Globally, field-grown modern wheat varieties have typical grain Zn concentrations of 20 to 31 mg/kg, which is 10 to 20 mg/kg less than a notional biofortification target of 40 mg/kg (9). A screen of 36 diverse Indian wheat varieties under marginal soils showed grain Zn concentrations from 25 to 35 mg/kg (10), whilst a screen of 24 advanced wheat lines, derived from Watkins landraces under field conditions in the UK, had 16 to 53 mg/kg Zn in wholegrain wheat flour (11). White wheat flour generally has 2.5 times less Zn than whole wheat flour, and Khokhar et al. (11) found 8 to 15 mg/kg Zn in wheat white flour (after removal of the aleurone layer and embryo). The Indian whole wheat and whole wheat flour are reported to contain 29 mg/kg Zn (69), whole wheat supplies 517 kcal/capita of total calories required per day, and the Weighted Estimated Average Requirement (WtdEAR) of Zn for India is 10.39 mg capita−1 d−1; whole wheat supply is thus 4.6 mg capita−1 d−1, which is 45% of the WtdEAR for India (12, 13).
To improve the grain Zn concentration in Indian wheat germplasm, the HarvestPlus programme has released wheat varieties with higher grain Zn concentrations in India. The HarvestPlus target was to enhance the grain Zn concentration in wheat varieties by 8 to 12 mg/kg, from a notional baseline of 25 mg/kg, without compromising the grain yield. The HarvestPlus programme with Indian partners has now released more than six wheat varieties in India, for example, BHU-3, BHU-6, BHU-25, BHU-31, WB02, and HPBW-01, for different wheat growing zones of India (14–16) and Zincol-2016, Akbar 2019, and Nawab 2021 in Pakistan (17).
In addition to the genetic biofortification approach to improve the grain Zn concentration in wheat and other crops, there are other factors that affect the grain Zn concentration, for example, spatial variation in soil Zn concentration, soil pH, soil organic carbon, and different geographical factors, together with crop management strategies adopted by farmers. A screen of biofortified and non-biofortified wheat varieties at three locations in Pakistan showed that the biofortified wheat variety (Zincol-2016) did not show greater grain Zn concentration than non-biofortified wheat varieties at the Islamabad and Pir Sabak sites, and both sites were low in soil Zn (12). A survey of wheat grain samples collected from 328 farmers’ fields in Ethiopia (in 2017 and 2018) showed a grain Zn range from 11.8 to 63.9 mg/kg (median of 25.3 mg/kg), a sixfold variation exceeding the biofortified breeding target in some locations. Soil organic carbon and soil pH contributed substantially to this variation (18). More generally, studies in sub-Saharan Africa show that soil and environment may influence grain Zn concentration in cereal crops (19) and, ultimately, human nutrition. Maize grain Zn concentration was 30% greater on Vertisols than on other soils in Malawi (20, 21); this higher grain Zn concentration on Vertisols was linked with the higher dietary Zn supply in the smallholder farmer communities living in these areas in Malawi (22). Thus, soil Zn status, pH, organic carbon, soil types, and other geographical factors affect the Zn content of different food grain crops, particularly cereal crops. Consequently, this spatial variation affects human health.
Interestingly, several recent studies have reported linkages between soil Zn status and public health outcomes. For example, Morton et al. (23), using 27 million soil data points from the Indian soil health card programme, showed a positive association between soil Zn availability [diethylene triamine pentaacetic acid (DTPA) extraction method] and stunting of children in India. Similarly, Bevis et al. (24) correlated DTPA-extractable soil Zn concentration of 11,670 soil samples from the Tarai region of Nepal with anthropometric data of 4,388 children from Nepal’s Demographic Health Survey and showed a positive association between soil Zn deficiency and children stunting in Nepal. De Groote et al. (25) reported a positive relationship between soil Zn deficiency and high serum Zn deficiency in children under 5 years of age in Ethiopia when they combined Ethiopian Soil Zn (Zn extraction by Mehlich 3 extraction method) mapped data with serum Zn data of 1,171 children under 5 years age. However, there is scope to extend and strengthen these approaches to jointly map micronutrients in soil and crops using “GeoNutrition” type approaches, as recently reported in two African countries, Ethiopia and Malawi (18). Specifically in India, there is the potential for soil and crop micronutrient mapping in India to understand better the movement of Zn in food systems and to inform strategies to improve the Zn status in the soil (e.g., use of Zn fertilisers for yield and agronomic biofortification) and crops (e.g., through genetic biofortification).
This current review aims to understand the data landscapes on soil Zn and related soil properties in India, focussing on three states: Uttar Pradesh (UP), Bihar, and Odisha. The scope of the data landscaping exercise is to identify and describe data sets from national and state-wide programmes and research experiments in which soil Zn has been reported, which could be used to provide a framework for integrated surveys and would combine wider agriculture, food systems, nutrition, and public health sectors.
Methodology
Data sets were identified from public sector sources in India. Data were accessed from national and state-wide programmes and research experiments in which soil Zn was reported. Soil Zn and other soil property data at the national scale are available for re-use at the Government of India soil health card website (https://www.soilhealth.dac.gov.in/).
Landscaping of Indian soils for Zn and other properties
The mineral composition of soil depends upon its parent material and other soil properties. Indian soils, based on their origin and other soil properties, are divided into 11 major types of soils, which cover the total geographical area of India (328.7 million ha) (Table 1). Among the three focus states, Uttar Pradesh has red, terai, and black soils; Bihar has alluvial and black soils and some terai soil in eastern Bihar along with the Nepal border; Odisha has alluvial, coastal alluvial, and black soils.
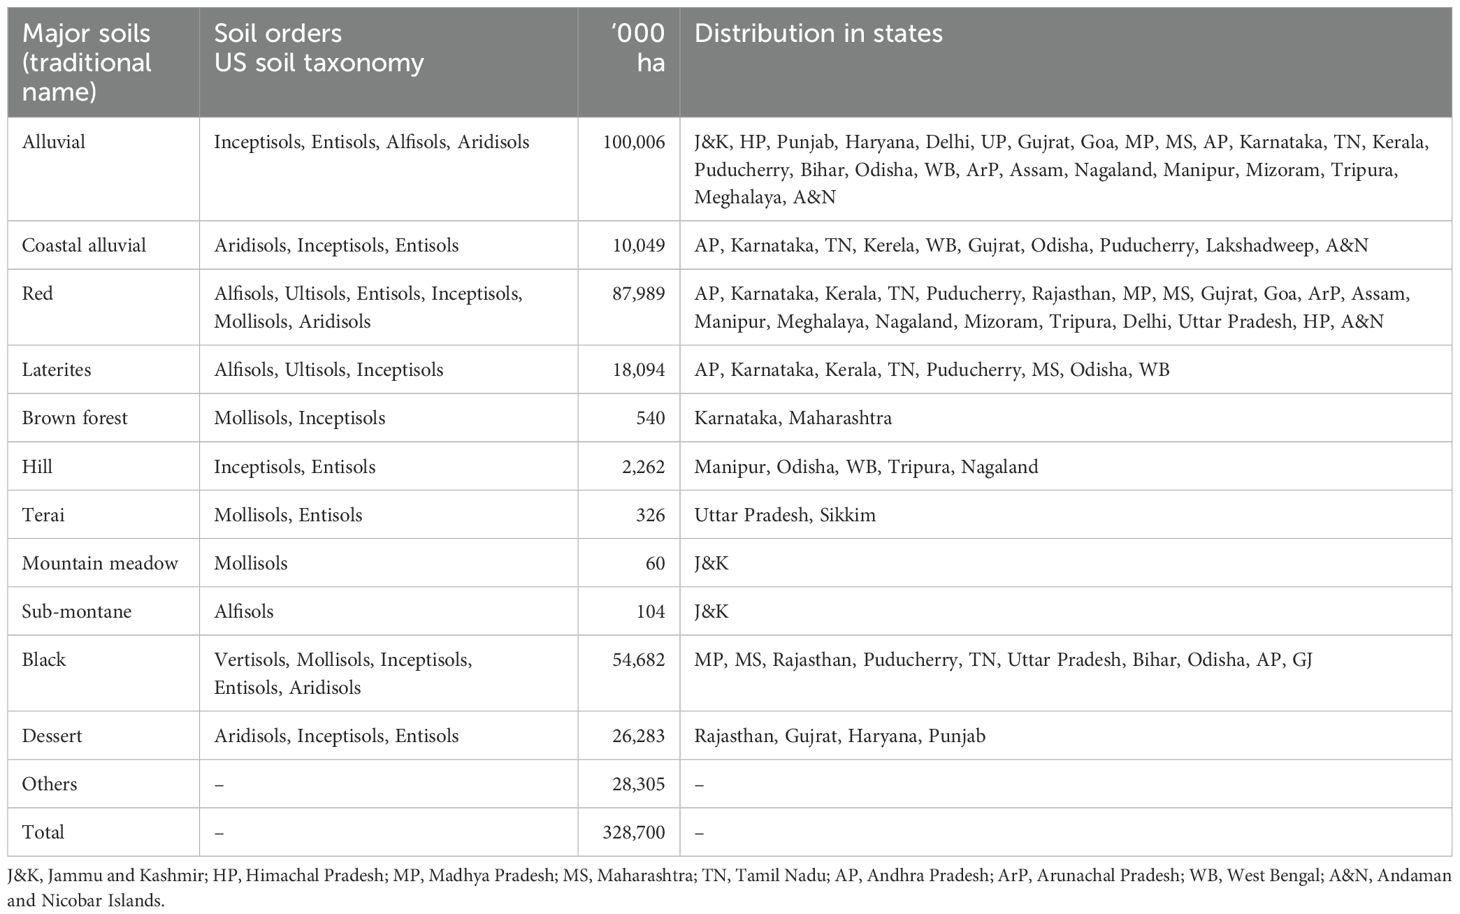
Table 1. The extent and distribution of the different soil classes of India as represented in the soil maps on a 1:250,000 scale along with their equivalent according to the United States Department of Agriculture, USA nomenclature system (redrawn from 26).
On a national scale, there are two pilot projects in India that map soils for Zn concentration and other properties.
Soil health management data
First, the soil health management (SHM), under the “National Mission for Sustainable Agriculture (NMSA)” programme of the Ministry of Agriculture & Farmers Welfare, Government of India, is one of many interventions to improve soil health by adopting an integrated nutrient management approach. The SHM programme, with the support of state governments, collects and analyses soil samples from farmers’ fields and issues soil health cards (SHCs) to them. The SHC contains information about soil Zn content, other macro- and microelements, and soil properties [soil pH, electrical conductivity (EC), and organic carbon (OC)].
The purpose of SHC is to advise farmers on the judicious use of different fertilising materials and give recommendations to improve soil health using different chemical, biological, and organic fertilisers to improve yield and nutritional quality. The SHM programme is being carried out on a time-scale basis. To date, ~52 million soil samples have been collected and analysed in two cycles across India: Cycle 1 from 2015 to 2017 (n = 25,349,546) and Cycle 2 from 2017 to 2019 (n = 27,431,824). All the data points are available with geospatial references for most states at the Ministry of Agriculture &Farmers Welfare, Government of India website under the Department of Agriculture and Farmers Welfare (27).
A grid of 2.5 ha for irrigated land and 10 ha for rainfed land was used for soil sampling, with four to nine samples collected from each grid. Each composite soil sample was obtained from five subsamples collected from a farmer’s field, which were then mixed thoroughly to get a homogenised sample. However, it varied from state to state (27; https://www.soilhealth.dac.gov.in/Content/Guideline_SoilTestingLab_Project.pdf).
Soil mineral content and other soil properties were measured according to the Indian government guidelines, documented in a manual “Soil Testing in India” (https://agriculture.uk.gov.in/files/Soil_Testing_Method_by_Govt_of_India.pdf), briefly, soil pH (1:2, soil/water suspension solutions), electrical conductivity (1:2 soil/water suspension solution), and organic carbon, by wet chemical or dry combustion methods, depending on the availability of facilities in different labs. Plant-available micronutrients, for example, copper (Cu), iron (Fe), manganese (Mn), and Zn, were extracted using DTPA methods and followed by atomic absorption spectrophotometry (AAS) analysis. Soil samples with plant-available Zn concentration ≥0.6 mg/kg have been reported sufficient, and soil samples with Zn concentration <0.6 mg/kg have been reported to be soil Zn deficient.
Out of 52 million soil samples, 45 million were analysed for plant-available soil Zn concentration in two cycles over a 4-year period (2015 to 2019). It showed that 39.1% of Indian soils are Zn deficient (<0.06 mg/kg), and between states, soil Zn deficiency varied greatly, ranging from 2% (Delhi) to 67% (Bihar) (27; https://www.soilhealth.dac.gov.in/NewHomePage/StateWiseNPKChart).
In Cycle 1 (2015 to 2017), the mean soil Zn deficiency was 40% (N = 22.76 million soil samples), and it varied from 7.1% to 88.4% across different Indian states (Table 2). Out of 34, five states showed more than 50% soil Zn deficiency. The highest soil Zn deficiency was in Telangana (88%), followed by Bihar (85%), Gujrat (59%), Karnataka (54%), and Maharashtra (51%) (27).
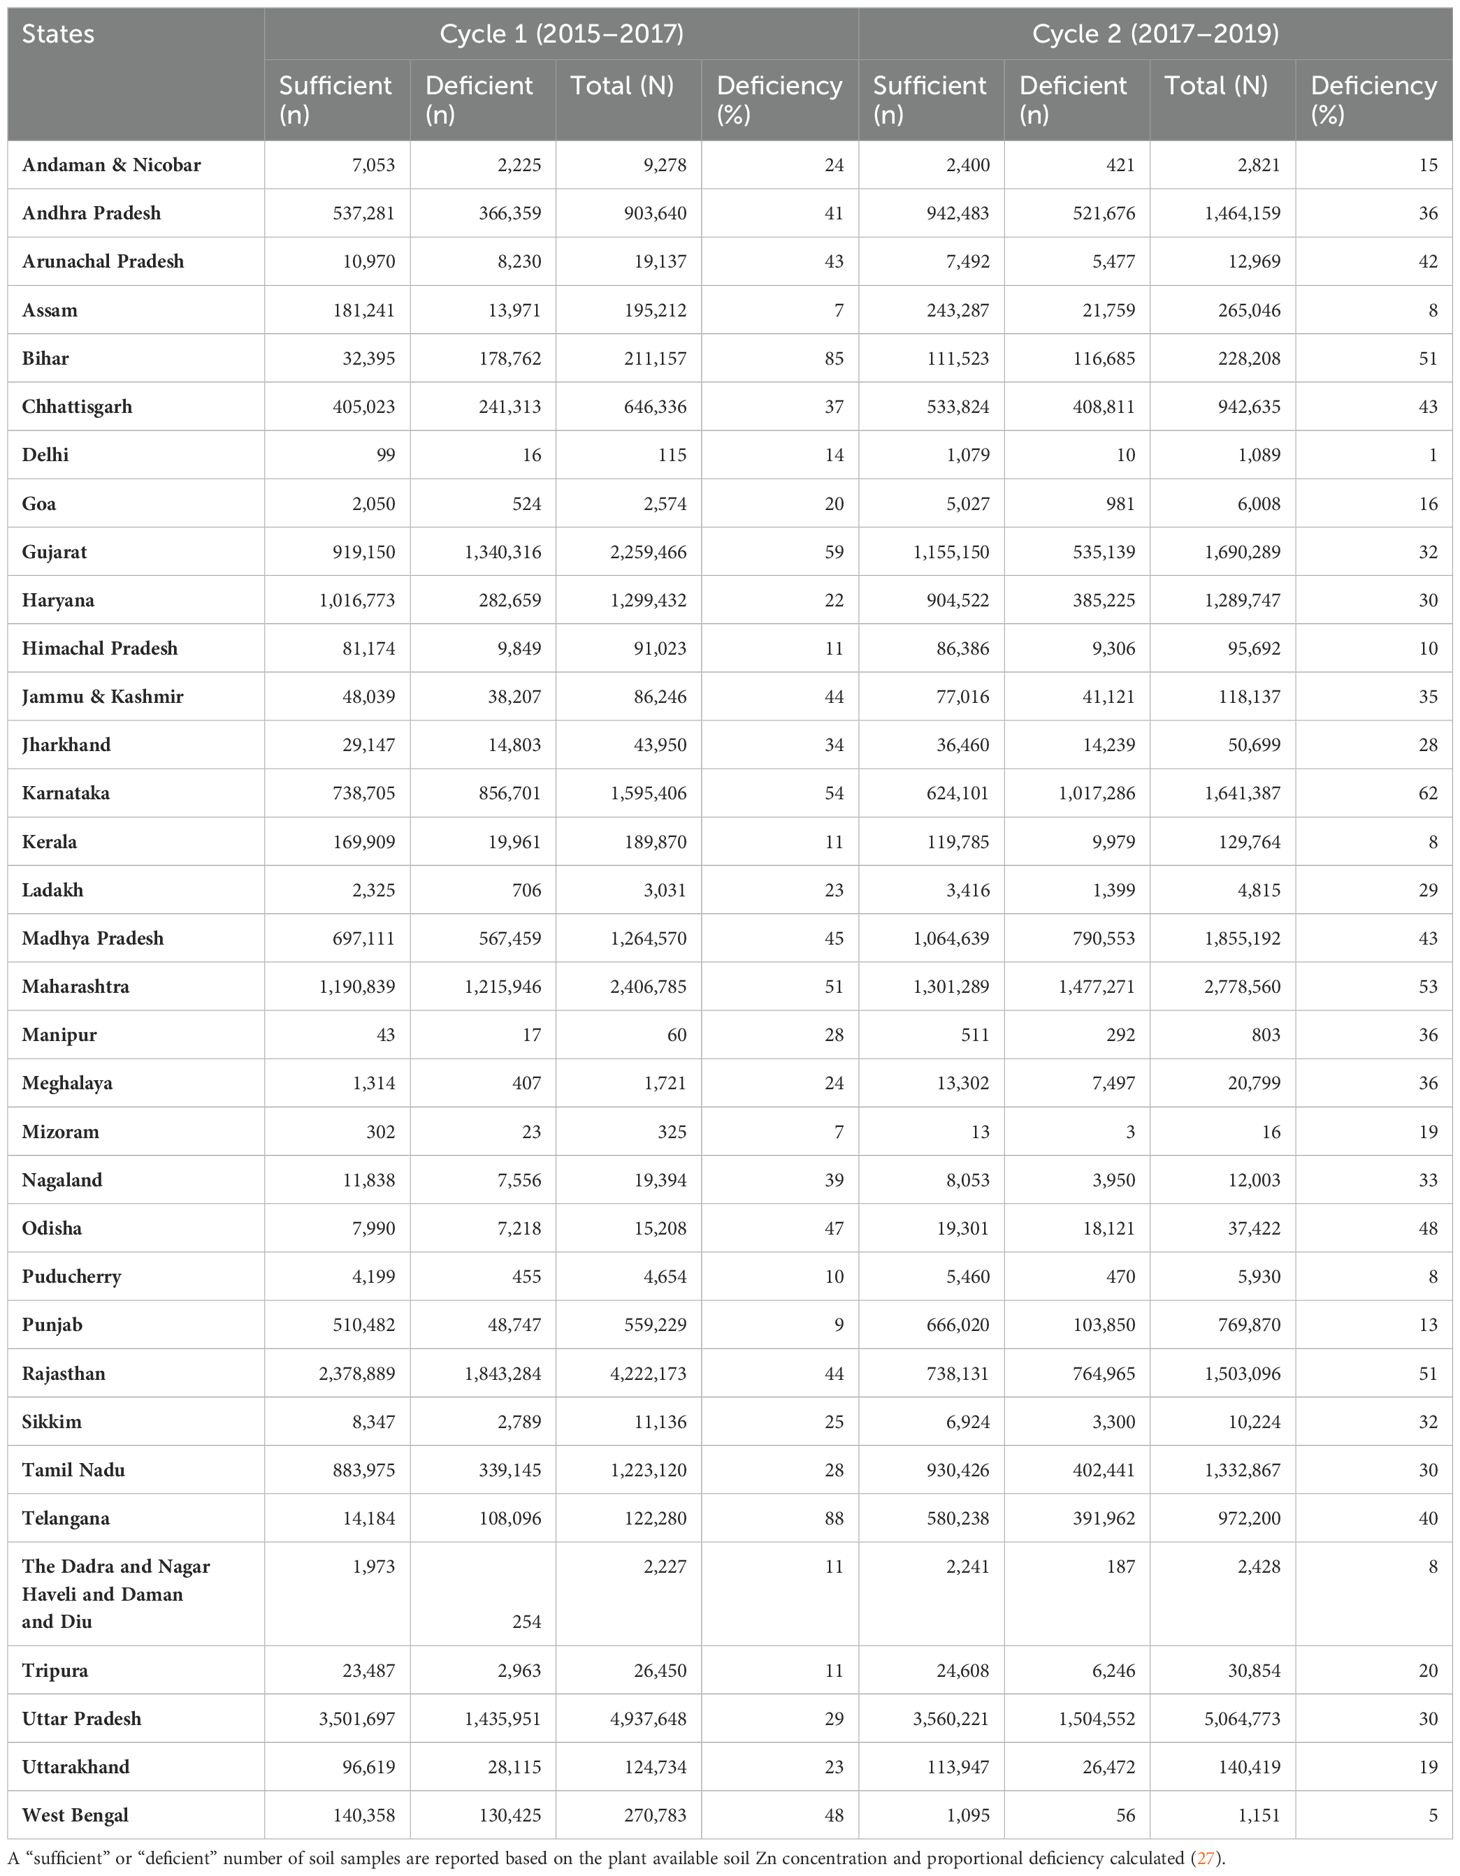
Table 2. Zinc deficiency in Indian state soils over a period of 4 years in Cycle 1 (2015 to 2017) and Cycle 2 (2017 to 2019).
In Cycle 2 (2017 to 2019), mean soil Zn deficiency was 38% (N = 22.48 million soil samples), ranging from 1% to 62% across different Indian states. Four states showed more than 50% soil Zn deficiency: these were Karnataka (62%), followed by Maharashtra (53%), Bihar (51%), and Rajasthan (48%) (27) (Table 2).
All India coordinated research project on micro and secondary nutrients and pollutant elements in soils and plants
The second-largest national programme is the All India Coordinated Research Project on Micro and Secondary Nutrients and Pollutant Elements in Soils and Plants (AICRP-MSPE), initiated by the Indian Council of Agricultural Research (ICAR). This programme aims to understand the micronutrient status of Indian soils and crops. This programme has 21 centres across the country conducting research, sampling, and analysis of plant and soil samples. Mandates of ICAR-AICRP-MSPE programmes are mapping micronutrients in soil and crops and defining/revising the critical and toxic limits of micronutrients in soil and crops, including vegetables (28). The critical limit of any nutrients in the soil is the level below which crops respond after their application. The critical limit for zinc in Indian soils is 0.60 mg/kg; however, for Gujrat and Tamil Nadu soils, it is 0.50 and 1.20 mg/kg, respectively (29).
The ICAR-AICRP-MSPE programme collected geo-referenced soil samples (n = 242,827) from 28 Indian states covering 615 districts over 6 years, from 2012 to 2018. Soil samples were collected according to each district’s agricultural land size holdings. For example, up to four soil samples were collected from a landholding of less than 1 ha, six to seven subsamples from 1–3 ha of land, and 9–10 subsamples from a landholding of more than 3 ha.
Plant-available soil Zn was extracted using the DTPA method, and soil Zn concentration was measured using AAS (30). Based on plant-available Zn concentration in the soil, soils were grouped into five categories: 1) acute deficient (≤0.3 mg/kg), deficient (>0.30 to ≤0.6 mg/kg), latent deficient (>0.6 to ≤0.90 mg/kg), adequate (>1.20 to ≤1.80 mg/kg), and high (>1.80 mg/kg).
This programme reported that 36.5% of the total soil samples (n = 242,827) were Zn deficient (acute + deficient). The mean plant-available soil Zn concentration was 1.40 mg/kg (SD ± 1.60) and varied from 0.01 to 59.8 mg/kg in the Indian soils. Among the Indian states, Tamil Nadu (63.3%) and Mizoram (2%) showed the highest and lowest soil Zn deficiency, respectively. Out of 28 states, 13 states showed that more than 25% of the total soil samples were Zn deficient (Figure 1). Among the three soil surveys (Figure 1), Cycle 1 showed higher soil Zn deficiency in Bihar, Gujrat, Telangana, and West Bengal than Cycle 2 and AICRP-MSPE; it could be due to soil sampling in Zn-deficient field sites in Cycle 1 than other soil surveys.
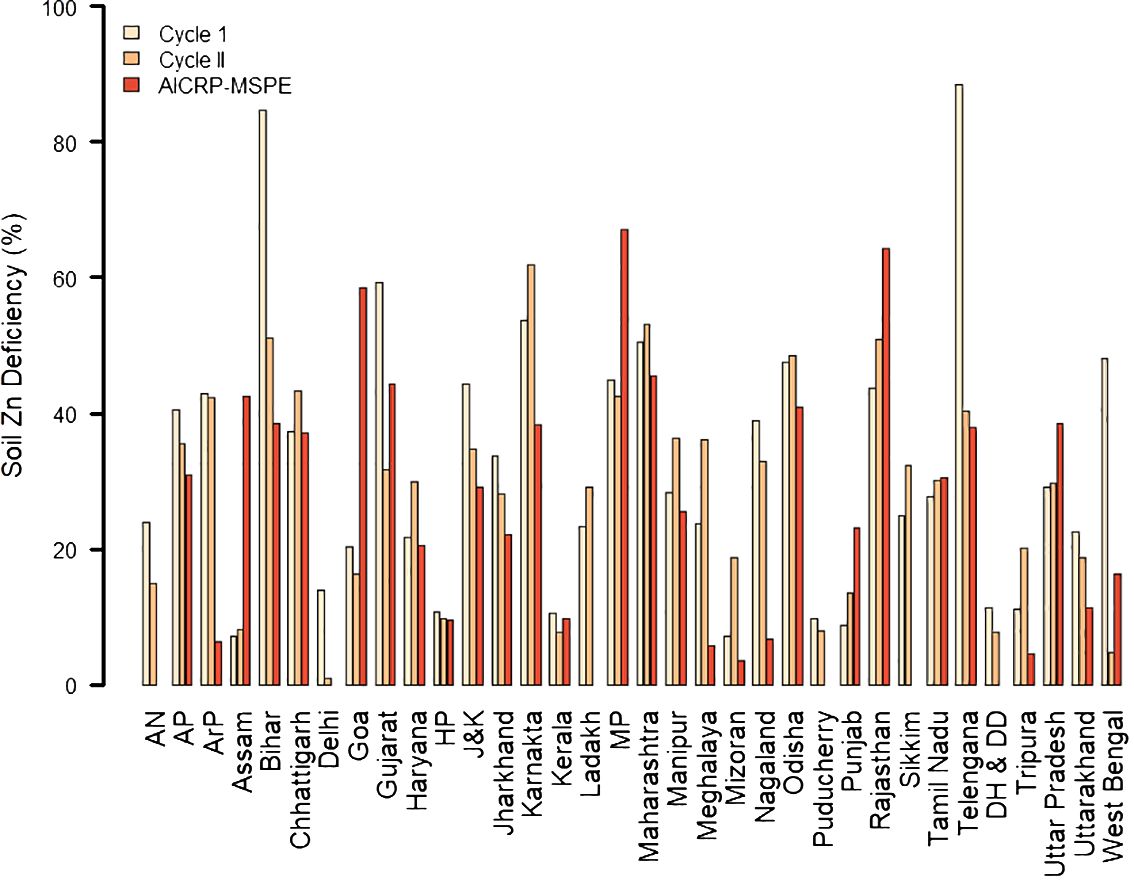
Figure 1. Plant available soil available Zn [diethylene triamine pentaacetic acid (DTPA)-extractable] deficiency of Indian states. Data represented here were collected during three different soil surveys: Cycle 1 from 2015 to 2017, Cycle 2 from 2017 to 2019 [Table 2; (27)], and AICRP-MSPE (All India Coordinated Research Project on Micro and Secondary Nutrients and Pollutant Elements in Soils and Plants) from 2012 to 2018 [redrawn from (30)]. AN, Andaman & Nicobar; AP, Andhra Pradesh; ArP, Arunachal Pradesh; HP, Himachal Pradesh; J&K, Jammu & Kashmir; MP, Madhya Pradesh; DH & DD, Dadra and Nagar Haveli and Daman and Diu.
Similarly, a soil survey was carried out by AICRP-MSPE over a period of 5 years (2009 to 2014) across 16 states of the country, covering 210 districts out of 748 districts in India. More than 95,000 soil samples were collected and analysed for plant-available soil Zn concentration using the DTPA extraction method. It showed that 43% of the total soil sample analysed were Zn deficient, and soil Zn concentration varied from 0.01 to 52.93 mg/kg (29). Shukla et al. (29) further reported Zn deficiency in Indian soil over two different time scales: from 1980 to 2008 and from 2009 to 2014, soil Zn deficiency decreased from 49 to 43%, respectively, in Indian soils (Figure 2).
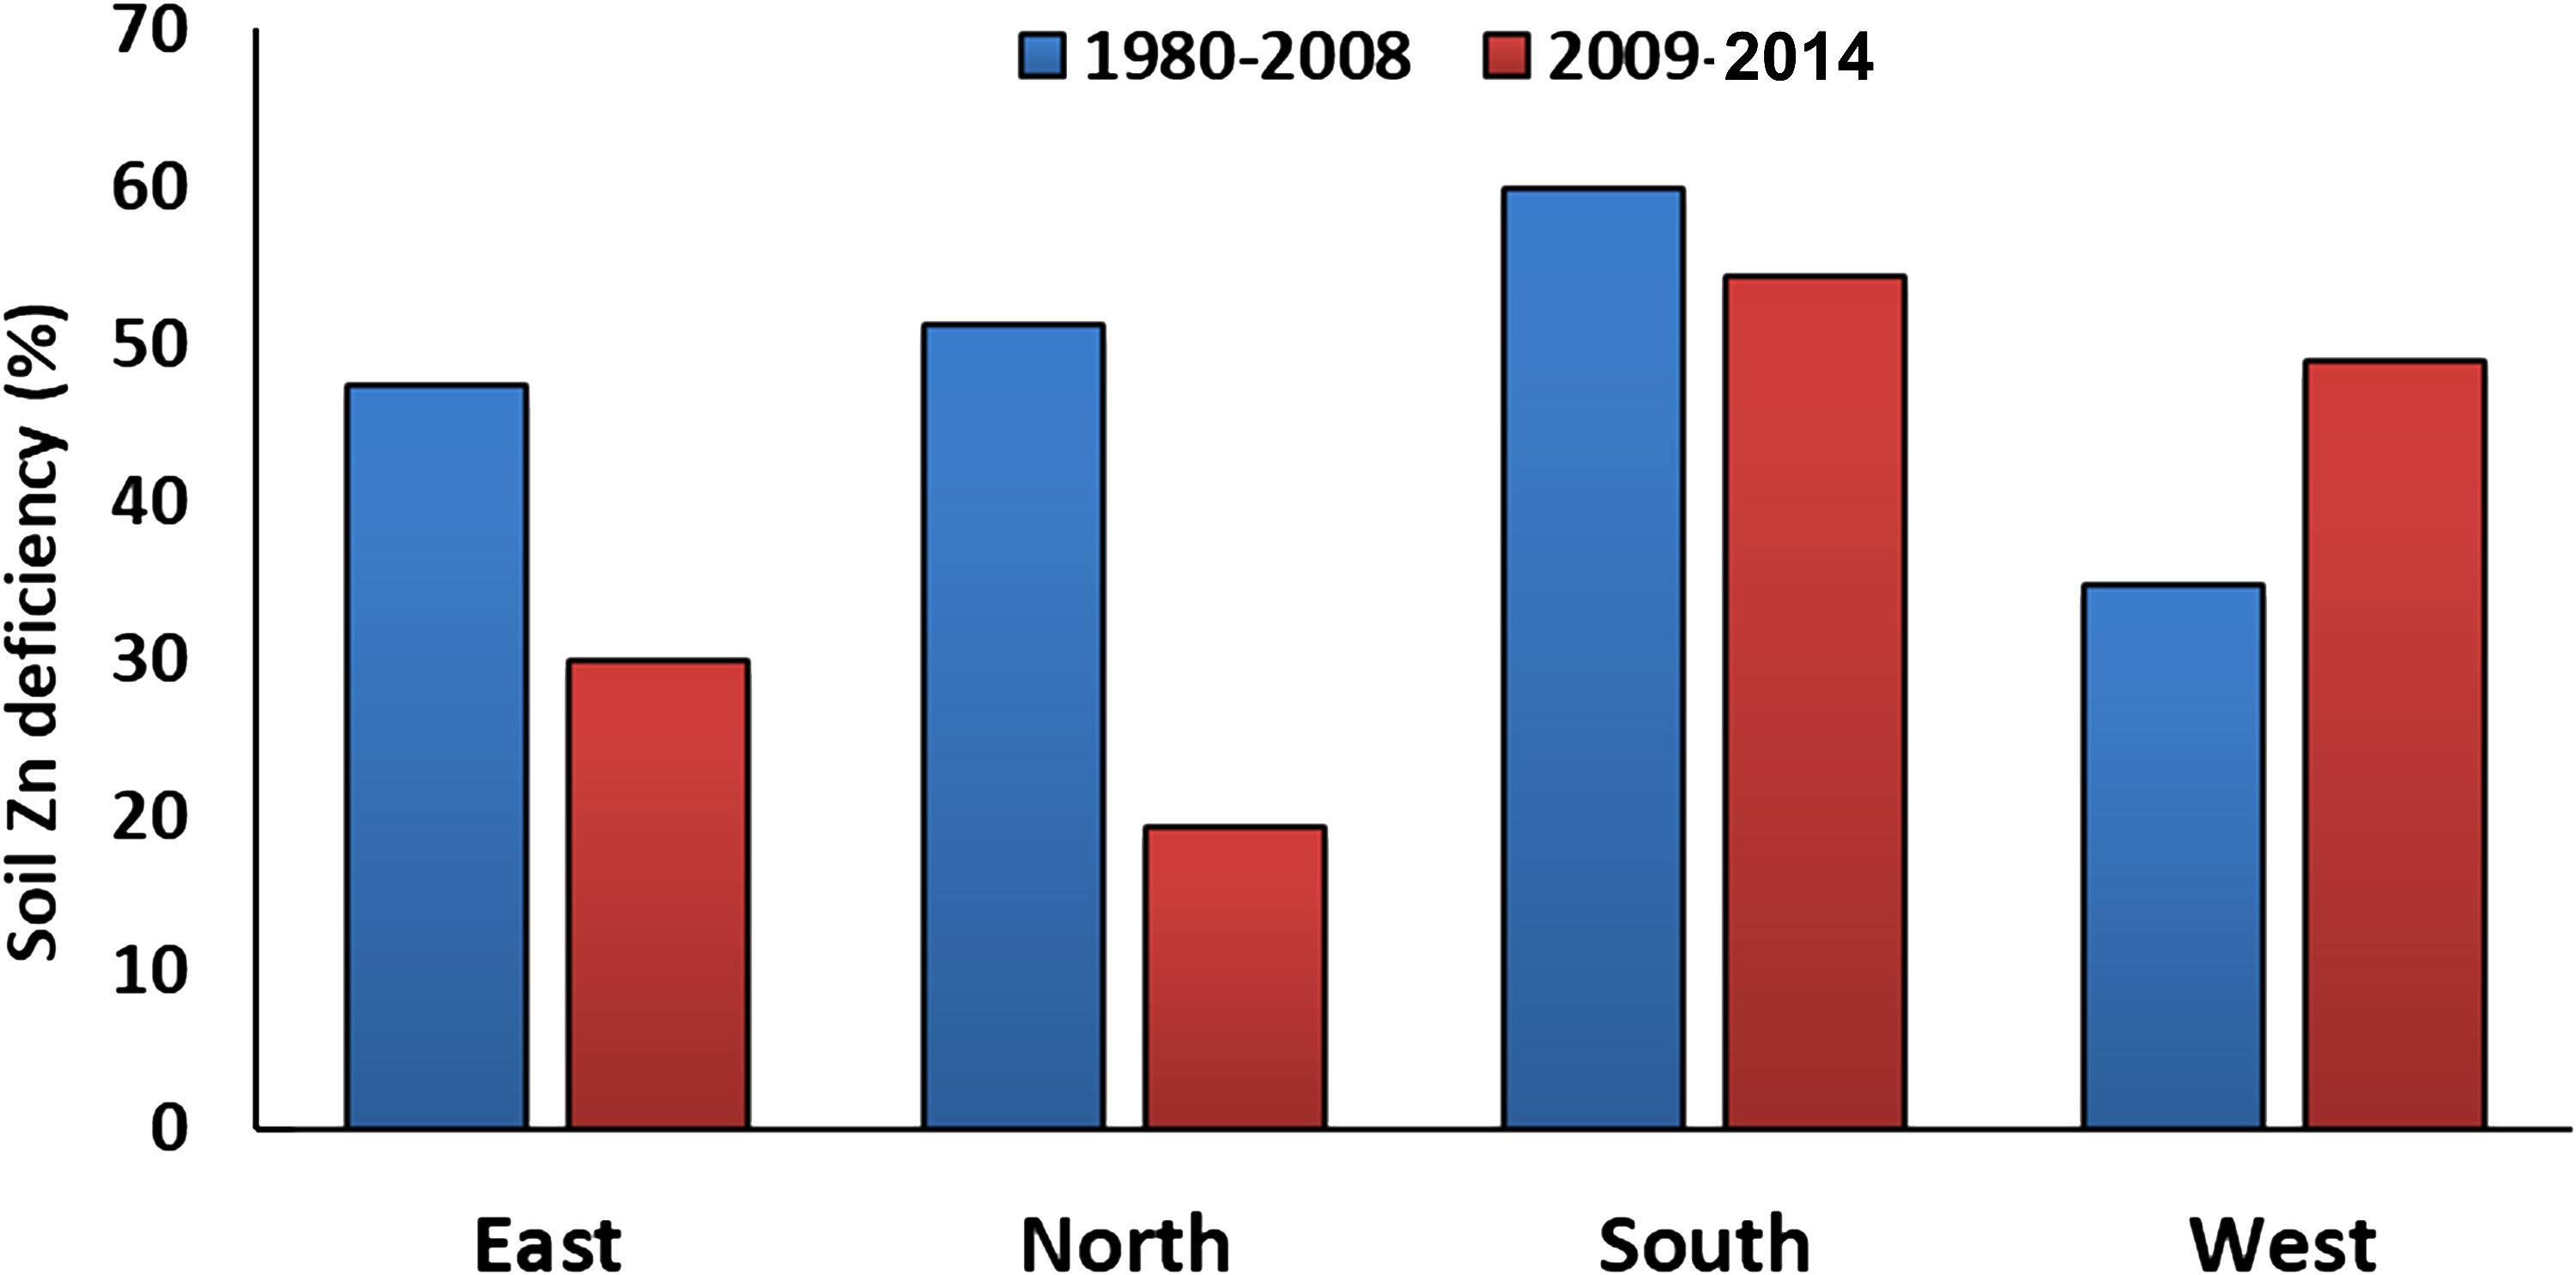
Figure 2. Soil zinc deficiency in different zones of India during a period from 1980 to 2008 and from 2009 to 2014 (29).
The prevalence of soil Zn deficiency declined in the North and Eastern zones of India, whilst it increased in the West Zone of India. In the Western zone, Gujrat (23%), Maharashtra (54%), and parts of Madhya Pradesh (62%) showed higher soil Zn deficiency.
Overview of soil Zn data and other properties for Uttar Pradesh, Bihar, and Odisha
Uttar Pradesh
The SHM programme analysed ~10 million soil samples over a 4-year period (2015–2019) in UP and reported that 29% of soil samples were deficient in plant-available Zn content. From 75 districts, there were 20 with more than 50% of samples being Zn deficient (27). The AICRP-MSPE programme analysed 4,788 soil samples for plant-available soil Zn concentration (DTPA extractable) in UP over a period of 5 years (2009 to 2014) and reported a prevalence of 33% soil Zn deficiencies (29). Shukla et al. (30), under the AICRP-MSPE programme, analysed more than 240,000 soil samples across India over a 6-year period (2012 to 2018) and reported 39% soil Zn deficiency in Uttar Pradesh. Singh et al. (31) analysed 2,500 surface soil samples (0–15 cm) for DTPA-extractable plant-available soil Zn in four districts, Varanasi, Mirzapur, Sant Ravidas Nagar, and Chandauli, reporting 46%, 30%, 16%, and 32% soil Zn deficiency, respectively.
Phyto-availability of Zn in the soil depends upon various soil properties, for example, pH, organic carbon, cation exchange capacity, and other soil textural properties (32). In UP, the SHM programme reported that 47% of soils are alkaline, and the pH varied from 7.9 to 8.3. The SHM also reported that 69% and 11% of soils were low (0.2 to 0.4%) and very low (<0.2%) in OC content, respectively (27, 33). Singh et al. (31) analysed 2,500 soil samples from four districts in UP (Varanasi, Mirzapur, Sant Ravidas Nagar, and Chandauli) and reported that the mean pH varied from 7.2 (Chandauli) to 8.1 (Varanasi). In the Varanasi district, 80% and 73% of soil samples were slightly alkaline (pH = 7.5 to 8.5) and low in organic content, respectively. In Mirzapur, 60% and 40% of soil samples were slightly alkaline and low in organic content, respectively. In Sant Ravidas Nagar, 61% and 11% of soil samples were slightly alkaline and low in OC, respectively. In Chandauli, 40% and 57% of soil samples were slightly alkaline and low in OC, respectively.
Bihar
In Bihar, more than 400,000 samples were analysed by the SHM programme over a 4-year period (2015 to 2019), and it was reported that 68% of soil samples were deficient (soil Zn < 0.6 mg/kg) in plant-available soil Zn content. Out of 38 districts, 16 had a prevalence of more than 65% soil Zn deficiency (27; https://soilhealth.dac.gov.in/PublicReports/DistrictMicroNS). Similarly, the AICRP-MSPE programme analysed 7,304 soil samples for plant-available soil Zn (DTPA-extractable) content in Bihar over 5 years (2009 to 2014) and reported 41% soil Zn deficiencies in the state (29).
In Bihar, the SHM programme reported that 64% of soils are moderately alkaline in nature. The SHM also reported that 28%, out of 447,940 soil samples of Bihar soil, were low (OC between 0.2% and 0.4%) in organic carbon content (27; https://soilhealth.dac.gov.in/PublicReports/DistricPHPercentagewise).
Sherpa et al. (34) collected 3,182 georeferenced soil samples from rice–wheat farming fields in 21 districts of Bihar as part of the Soil Intelligence System India project (SIS). Samples were collected over a period of three seasons (2018 to 2021), and available nutrients and other soil properties were measured as per SHC guidelines for the state. Of the 3,182 SIS soil samples, 48% were Zn deficient, 49% were calcareous, and 34% had low organic carbon. The SIS also developed 250-m-resolution gridded digital soil maps (https://sisindia.isric.org/) using legacy SHC and AICRP-MSPE data for the Bihar and Andhra Pradesh states. In Bihar, maps were generated using 13,429 AICRP-MSPE samples for boron (B), Cu, EC, Fe, potassium (K), Mn, OC, phosphorus (P), S, Zn, and pH, whilst nitrogen (N) maps were based on 14,118 sample points from SHC Cycle 2 (2017 to 2019).
Odisha
In Odisha, approximately 52,000 samples were analysed for plant-available soil Zn concentration by the SHM programme (2015 to 2019), and it was reported that 48% of the soil samples were Zn deficient. Out of 30 districts, 12 showed more than 50% soil Zn deficiency (27; https://soilhealth.dac.gov.in/PublicReports/DistrictMicroNS). Jena et al. (35) collected 6,991 soil samples from 22 districts of Odisha over a period of 6 years (2012 to 2018) and analysed for soil Zn concentration using the DTPA extraction method. The mean plant-available soil Zn concentration was 1.1 mg/kg and varied from 0.08 to 32 mg/kg. They reported that 33% of the soil samples tested were Zn deficient, and Zn deficiency varied from 4% (Sambalpur) to 68% (Malkangiri) across the 22 districts of Odisha.
The SHM programme reported that 31% and 46% of soils are highly acidic (pH < 4.5) and moderately acidic (pH = 4.5 to 5.5), respectively. The SHM also reported that 40% out of 500,000 soil samples of Odisha were low in organic carbon content (OC between 0.2% and 0.4%) and that 20% of soil samples were very low (OC < 0.2%) in organic carbon content (27; https://soilhealth.dac.gov.in/PublicReports/DistricPHPercentagewise). The AICRP programme on Soil Test Crop Response (STCR), collaborating with the Odisha state government, analysed more than one million soil samples across 30 districts of the state over a 6-year period (2002 to 2008). This programme reported that 40% of soil samples tested were low in organic carbon (OC < 0.50%) and that 60% were medium in organic carbon (OC = 0.05%–0.75%) (36).
Grain Zn concentration data for Indian wheat and rice
Indian food and nutrition security mainly depend upon two crops, wheat and rice, which constitute 76% of India’s total food grain production (37). Compared to the vast archive of soil data available from the programmes described above (27, 28), there is a paucity of grain Zn concentration data, especially from on-farm settings. These data have immense value in supporting the understanding of the nutritional value of the grain for those living on low-diversity diets, but also whether food systems dominated by local consumption may create a geospatial control on dietary adequacy of Zn and other nutrients (10, 18).
Grain Zn concentration in wheat
Wheat is inherently low in grain Zn. A panel of 20 wheat genotypes was evaluated at 14 field locations in the eastern Gangetic plains of India over a 3-year period (2004 to 2007). It showed a range of mean grain Zn concentration from 32 to 34 mg/kg (38). Fifteen wheat varieties were evaluated for grain Zn concentration under a field experiment at the Punjab Agriculture University, Ludhiana (India), over a 2-year period (2007 to 2009). The mean grain Zn concentration of 15 wheat varieties was 30.2 mg/kg and varied from 27.7 to 32.5 mg/kg (39). A screen of 36 Indian commercial wheat varieties showed grain Zn concentration from 25 to 35 mg/kg, under Zn-deficient soil field conditions in India over a period of 2 years (2013 to 2015; 10). A panel of 121 advanced wheat genotypes was evaluated under the All India Coordinated Research Project (AICRP) on wheat for grain Zn concentration at 19 locations under five different wheat growing zones in India from 2020 to 2021. The mean grain Zn concentration was 38.2 mg/kg and varied from 30 to 50 mg/kg. Soil Zn data of all the locations were not reported (40; www.iiwbr.icar.gov.in).
A panel of 75 Pakistani wheat lines showed a mean grain Zn concentration of 24.9 mg/kg under low soil Zn field conditions in Pakistan (41), whilst a later screen of 28 Pakistani wheat varieties showed grain Zn concentration from 21 to 33 mg/kg (mean 27.5 mg/kg) under field conditions (42). Velu et al. (43) evaluated 40 wheat genotypes at five different locations in India for grain Zn concentration and reported a mean grain Zn concentration of 33.5 mg/kg (range 28.5 to 44.1 mg/kg). In this study, they showed significant genotype × environment interaction; however, they showed similar performance of genotypes across different locations due to the high heritability of the Zn trait. Grain samples of a panel of 121 Indian wheat genotypes were taken from Sam Higginbottom Institute of Agriculture, Technology and Sciences, Allahabad, India, which were originally collected from different wheat-growing regions in the northern part of India, then analysed for grain Zn concentration, and showed grain Zn concentration from 10.7 to 59.4 mg/kg (mean 29 mg/kg) (44). Similarly, Saha et al. (45) screened 80 commercial Indian wheat varieties under field conditions and showed grain Zn concentration from 21 to 29 mg/kg (mean 25.3 mg/kg). A set of 18 commercial Indian wheat cultivars were evaluated for grain Zn concentration in a pot experiment, which showed grain Zn concentration from 22 to 35.9 mg/kg (46).
Grain Zn concentration in rice
Rice typically has a lower grain Zn concentration than wheat, ranging from 12 to 16 mg/kg in polished (white) rice grains (47). Rao et al. (48) reported grain Zn concentration of 12 to 32 mg/kg in unpolished (brown) rice of a panel of 170 rice advance lines under field conditions, and most of the lines showed grain Zn concentration from 15 to 25 mg/kg in brown rice. Recently, the HarvestPlus programme has increased their target threshold for breeding for increased grain Zn concentration in polished rice from 24 to 28 mg/kg (48, 49).
Grain Zn concentration in the white rice kernel of five scented rice varieties varied from 7.8 to 12.4 mg/kg, grown under field conditions in India over a 2-year period (2013 to 2014) (50). Five aromatic rice varieties, grown under low soil Zn conditions at the research farm of the Indian Agricultural Research Institute, New Delhi, India, showed grain Zn concentration from 32 to 35 mg/kg over a 2-year period (2004 to 2005) (51). Saha et al. (45) evaluated a panel of 12 commercial rice varieties under field conditions and reported grain Zn concentration from 15 to 34 mg/kg. Similarly, Saha et al. (52) reported grain Zn concentrations in six Indian rice varieties from 19 to 28 mg/kg under field conditions in India.
Micronutrient fertilisers in India
Among micronutrients, Zn is considered the fifth most important nutrient after N, P, K, and S in India, whilst in lowland crops (e.g., rice), it is second only to N (53). From 2019 to 2020, India consumed 211,275 tonnes of Zn fertiliser, 35,745 tonnes of ferrous sulphate, 25,559 tonnes of boric acid/borax, 17,396 tonnes of manganese sulphate, and 3,815 tonnes of copper sulphate.
Despite the high prevalence of Zn deficiency in Indian soils, Zn fertilisers in the Indian cropping systems are not used at the required level. The limited use of Zn fertilisers in India may be due to inadequate availability, the cost of fertilisers, and the lack of perceived benefit of using Zn fertilisers, particularly for marginal farmers (landholding of less than 1 ha). However, in recent years, the application of Zn fertiliser has increased from 130,974 tonnes in 2010 to 211,275 tonnes in 2019. It has been estimated that ~70% of total zinc sulphate fertiliser used in India is consumed by only five states (Punjab, Haryana, Uttar Pradesh, Karnataka, and Maharashtra) (53).
Many Zn fertiliser products are available for soil and foliar application in India. For example, zinc sulphate heptahydrate (ZnSO4.7H2O; 21% Zn), zinc sulphate monohydrate (ZnSO4.H2O; 33% Zn), zinc oxide suspension (ZnO; 39.5% Zn), and chelated zinc (Zn-EDTA, 12% Zn; Zn-HEDP, 17% Zn). Zinc sulphate is the main Zn fertiliser due to its solubility in water and used in both soil and foliar application; lower cost makes it the first choice among the farmers over the more expensive Zn chelated and other Zn fertilisers in the Indian market (30). It has been estimated that Zn fertiliser application contributes more than 18 Mt of extra to the Indian food grain and 15 Mt to wheat and rice only (54).
The current demand for Zn fertilisers, based on Zn deficiency in Indian soil and its mining from the soil, is 285,000 tonnes, and it will increase to 347,000 tonnes by 2035. The future demand for Zn fertilisers can be seen by the fact that out of 30 Mha area under wheat cultivation in India, only 30% of the area is receiving Zn fertilisers, and for rice, out of ~45 Mha, 50% of the area is receiving Zn fertiliser application (54). The wheat-rice cropping rotation covers approximately 10 million ha and is dominant in north-western India; the application of Zn fertiliser in rice has a residual effect on the grain Zn content, not on the grain yield, on the following wheat crop (55).
The application of micronutrient fertilisers has shown improvement in both grain yield and quality in different crops, particularly under micronutrient-deficient soil conditions. In a pilot study, 4,144 Zn fertiliser trials were carried out on farmer’s fields in different states of India to study the response of Zn fertilisers to the crop yield of different crops during a period from 1967 to 1984. The soil was considered responsive to Zn fertiliser (2 to 5 kg/ha Zn) when it gave more than 200 kg/ha economic yield above the control (no Zn fertiliser). This study showed that 58% of trials were Zn fertiliser-responsive (56, 57).
Zinc fertiliser-responsive trials increased to 63% from 1985 to 2000, 72% from 2000 to 2010, and 80% from 2011 to 2016. In addition to crop yield, Zn fertiliser application has also shown improvement in grain Zn concentration in different crops.
Prasad et al. (58) reported 62% and 51% higher grain Zn concentrations in rice and wheat varieties, respectively, with Zn fertiliser application (granular) than control (without Zn fertiliser). Wheat grain yield increased by 8% and 14% in the Punjab and Sindh regions, Pakistan, respectively, by applying ~5 kg of ZnSO4.H2O fertiliser per hectare, in a survey of more than 2,500 farmers (41). Application of Zn fertiliser (ZnSO4.7H2O at 5 kg/ha) increased wheat grain yield from 4 to 5.6 tonne/ha in Haryana under Zn-deficient soil conditions (<0.6 mg/kg) (28). Similarly, three wheat varieties (C 306, JW 14, and HW 2004) showed an increase in grain yield from 2.27 to 3.96 tonne/ha, and grain Zn concentration increased from 43 to 64 mg/kg, with the application of 5 to 10 kg/ha of ZnSO4.7H2O fertiliser under field condition in Bhopal, India (28). A screen of three wheat varieties in Pakistan at three locations showed grain Zn concentration increased by 6.9 to 18 mg/kg by application of foliar Zn fertiliser (ZnSO4.H2O at1.58 kg/ha at the booting stage) compared to control treatments (12). Dhaliwal et al. (59) showed that foliar application of Zn fertiliser (ZnSO4.7H2O @ 2.5 zinc sulphate in 500 L solution ha−1) increased grain Zn concentration in 16 wheat genotypes from 48% to 69% under field conditions compared to control treatment (no application of Zn fertiliser).
Soil properties can guide human nutrition studies
Many soil properties influence the plant available zinc concentration in soils, which in turn influences the uptake of zinc by food crops and, in turn, the dietary intake of zinc by people consuming these crops. For example, soil pH influences the strength of Zn adsorption and Zn in the solution. Increasing soil pH has shown higher exchangeable Zn in soil, which is available to plants (60). When considered together, studies by Gashu et al. (18) and Botoman et al. (61) in Ethiopia and Malawi showed that soil pH, organic carbon, and temperature were linked to spatial variation in crop grain zinc concentration. Wood et al. (21) proposed that increasing soil carbon by 1 g/kg of soil could increase 0.15 mg/kg Zn concentration in wheat grain and can support human health improvement. Quantifying the links between soil properties and the spatial variation in the Zn composition of staple crops is, therefore, undoubtedly an important factor to consider in understanding the prevalence of Zn deficiency (reviewed by Lowe et al., 2023).
Discussion
There is substantial variation in Zn concentration in Indian soils, combined with variations in soil pH and organic carbon. The largest Indian soil sampling and testing programme “Soil Health Card” under the government of India analysed ~52 million soil samples. Soil Zn concentration varied from 0.08 to 21 mg/kg and showed that 39% of Indian soils are Zn deficient (DTPA extractable; soil Zn content <0.6 mg/kg). This survey also reported that 64% of soil samples were deficient in organic carbon (OC < 0.5%) and that 21% of samples contained a medium level of organic carbon (0.5%–0.75%). Similarly, 71% of samples were moderately alkaline (pH = 7.9–8.3) (27, 62).
Zinc concentration and its availability in soil are affected by different factors, for example, soil pH, organic matter, soil types, and environmental factors (63). Shukla et al. (64) reported significant negative relations between soil pH and plant available Zn concentration (DTPA extractable) and a positive relationship between soil Zn concentration and soil organic carbon. They showed soil Zn concentration <0.6 mg/kg in South-Western Haryana than in Northern Haryana; the reason was low organic carbon and of sandy nature of the soil in South-Western Haryana. Zia et al. (65) reported negative relationships between soil pH and Zn concentration in the soil solution. A study by Khokhar et al. (10) showed that plant-available soil Zn [Ca(NO3)2-extractable] concentration was lower (0.03 mg/kg) in alkaline soil at Kumarganj site in Uttar Pradesh (pH = 9.8) than normal soils (0.1 mg/kg) at Karnal site in Haryana (pH = 7.5). Zinc adsorption on soil particles increases with increasing soil pH, which decreases the Zn phyto-availability in the soil (32).
There are few studies to our knowledge that have reported spatial variation in grain Zn concentration in farmer-grown cereal crops in India. A panel of 36 Indian commercial wheat varieties was evaluated at six field sites in India under hostile soils. The authors of this study reported that the mean grain Zn concentration of 36 wheat varieties was greater (35 mg/kg) in normal soil at Karnal (pH = 7.8) than in sodic soils (26 mg/kg) at the Kumarganj-sodic site (pH = 9.5) (10, 66).
However, there is evidence showing that spatial variation in soil Zn concentration, soil pH, and environmental factors affect the grain Zn concentration in cereal grain crops (11, 18, 21, 61). For example, the GeoNutrition survey reported by Gashu et al. (18) reported wheat grain samples, collected from >1,000 different field sites in Ethiopia over a 2-year period (2017 and 2018), for grain Zn concentration and reported a positive significant relationship between wheat grain Zn concentration and soil organic carbon. The Zn concentration in wheat grain samples varied from 11.8 to 63.9 mg/kg. Soil organic carbon contributed substantially to the variation in wheat grain Zn concentration at different locations in Ethiopia. Khokhar et al. (10) reported higher grain Zn concentration in a panel of 36 Indian wheat varieties in normal soil (pH = 7.8) at Karnal (35 mg/kg) than in sodic soils at Kumarganj-sodic (26 mg/kg) site (pH = 9.5). Zia et al. (12) screened a biofortified wheat variety, “Zincol-2016” with locally grown wheat varieties at three locations in Pakistan and found no difference in grain Zn concentration between Zincol-2016 and locally grown wheat varieties at two locations. Zincol-2016 showed greater grain Zn concentration than other varieties only at one site where soil Zn concentration (DTPA extractable) was greater than in soil Zn level of the other two sites.
Spatial variations in grain Zn concentration in different crops are linked with dietary Zn intake and affect human health. The AICRP-MSPR project conducted an experiment in Nalgonda and Ranga Reddy districts in Andhra Pradesh, India, that plants and grains grown on Zn-deficient soil showed lower Zn concentration and that people fed on these vegetation and grains showed lower blood plasma Zn concentration than those people who were fed with grain and vegetation that were grown on sufficient soil Zn areas (67).
Wheat is a major source of daily dietary Zn intake in India. Wheat alone supplies ~50% of daily Zn needs in India (8). There is an unmet need for an evidence-based study in India, which explores spatial variation for soil Zn concentration, soil properties, and environmental factors known to affect wheat grain Zn concentration. Given the dietary importance of wheat, this is expected to affect human and animal nutrition, especially where local foods are consumed and soil-crop deficiencies exist. At present, there is no programme in India that maps micronutrients in soil and crops together using the GeoNutrition approaches recently reported in Africa; the existing soil fertility monitoring systems in India could be a vehicle to achieve this. There is potential for soil and crop micronutrient mapping in India to understand better the movement of Zn (and other micronutrients) in food systems and understand the prevalence of human Zn deficiency (68). This can inform, and later monitor the success of, strategies to improve the Zn status in the soil (e.g., use of Zn fertilisers for yield, agronomic biofortification, and soil organic matter management) and crops (e.g., through genetic biofortification) and thus into diets. This evidence in a dietary evaluation framework is particularly needed because Zn grain (or flour) concentration is an invisible trait that cannot be evaluated by the farmer or the consumer but can vary to such an extent that it can alter the dietary adequacy of Zn.
Author contributions
JK: Conceptualization, Data curation, Formal Analysis, Investigation, Methodology, Validation, Visualization, Writing – original draft, Writing – review & editing. MB: Conceptualization, Writing – review & editing. ELA: Conceptualization, Funding acquisition, Supervision, Writing – review & editing.
Funding
The author(s) declare financial support was received for the research, authorship, and/or publication of this article. This work was supported primarily by the Bill & Melinda Gates Foundation through the Micronutrient Action Policy Support (MAPS) project [INV-002855]. Further support is acknowledged for the Excellence in Agronomy (EiA) Incubation Phase (INV-005431) sub-project, “Innovation R&D on Agronomic Biofortification”. Rothamsted Research receives strategic funding from the Biotechnology and Biological Sciences Research Council of the United Kingdom (BBSRC), and we acknowledge support from the Growing Health Institute Strategic Programme [BB/X010953/1; BBS/E/RH/230003C]. Funders were not involved in the study design; the collection, management, analysis, and interpretation of data; the writing of the report; or the decision to submit the report for publication.
Acknowledgments
We would like to thank Dr. Hakunawadi Pswarayi and Dr. Christopher Chagumaira for helping in drawing Figure 1 in this manuscript.
Conflict of interest
The authors declare that the research was conducted in the absence of any commercial or financial relationships that could be construed as a potential conflict of interest.
Publisher’s note
All claims expressed in this article are solely those of the authors and do not necessarily represent those of their affiliated organizations, or those of the publisher, the editors and the reviewers. Any product that may be evaluated in this article, or claim that may be made by its manufacturer, is not guaranteed or endorsed by the publisher.
References
1. Broadley MR, White PJ, Hammond JP, Zelko I, Lux A. Zinc in plants. New Phytol. (2007) 173:677–702. doi: 10.1111/j.1469-8137.2007.01996.x
2. Sturikova H, Krystofova O, Huska D, Adam V. Zinc, zinc nanoparticles and plants. J Hazard Mater. (2018) 349:101–10. doi: 10.1016/j.jhazmat.2018.01.040
3. Kumssa DB, Joy EJ, Ander EL, Watts MJ, Young SD, Walker S, et al. Dietary calcium and zinc deficiency risks are decreasing but remain prevalent. Sci Rep. (2015) 5:10974. doi: 10.1038/srep10974
4. National Health Mission N. Comprehensive national nutrition survey(2016-18) reports. New Delhi: Ministry of Health and Family Welfare, Government of India (2023). Available at: https://nhm.gov.in/index1.php?lang=1&level=2&sublinkid=1332&lid=713.
5. Gibson RS, Bailey KB, Gibbs M, Ferguson EL. A review of phytate, iron, zinc, and calcium concentrations in plant-based complementary foods used in low-income countries and implications for bioavailability. Food Nutr Bull. (2010) 31:S134–46. doi: 10.1177/15648265100312S206
6. Tang K, Adams KP, Ferguson EL, Woldt M, Kalimbira AA, Likoswe B, et al. Modeling food fortification contributions to micronutrient requirements in Malawi using Household Consumption and Expenditure Surveys. Ann New York Acad Sci. (2022) 1508:105–22. doi: 10.1111/nyas.14697
7. Black RE, Victora CG, Walker SP, Bhutta ZA, Christian P, de Onis M, et al. Maternal and child undernutrition and overweight in low-income and middle-income countries. Lancet. (2013) 382:427–51. doi: 10.1016/S0140-6736(13)60937-X
8. HarvestPlus. Zinc wheat. Washington, USA: HarvestPlus c/o IFPRI (2023). Available at: https://www.harvestplus.org/crop/zinc-wheat/.
9. Chen XP, Zhang YQ, Tong YP, Xue YF, Liu DY, Zhang W, et al. Harvesting more grain zinc of wheat for human health. Sci Rep. (2017) 7:7016. doi: 10.1038/s41598-017-07484-2
10. Khokhar JS, Sareen S, Tyagi BS, Singh G, Wilson L, King IP, et al. Variation in grain Zn concentration, and the grain ionome, in field-grown Indian wheat. PloS One. (2018) 13:e0192026. doi: 10.1371/journal.pone.0192026
11. Khokhar JS, King J, King IP, Young SD, Foulkes MJ, De Silva J, et al. Novel sources of variation in grain Zinc (Zn) concentration in bread wheat germplasm derived from Watkins landraces. PloS One. (2020) 15:e0229107. doi: 10.1371/journal.pone.0229107
12. Zia MH, Ahmed I, Bailey EH, Lark RM, Young SD, Lowe NM, et al. Site-specific factors influence the field performance of a zn-biofortified wheat variety. Front Sustain Food S. (2020) 4. doi: 10.3389/fsufs.2020.00135
13. FAO. FAOSTAT food balance sheets (2020). Rome, Italy: Food and Agriculture Organization of the United Nations. Available online at: www.faostat.org (Accessed 4th July 2022).
14. Velu G, Singh R, Arun B, Mishra V, Tiwari C, Joshi A, et al. Reaching out to farmers with high zinc wheat varieties through public-private partnerships-An experience from Eastern-Gangetic Plains of India. Adv Food Technol Nutr Sci. (2015) 1:73–5. doi: 10.17140/AFTNSOJ-1-112
15. Singh R, Velu G. Zinc-biofortified wheat: harnessing genetic diversity for improved nutritional quality. Bonn, Germany: Trust, C (2017).
16. Saroj S, Kumar A, Joshi PK. Adoption of new wheat crop varieties in India: status, determinants, and impacts. J Developing Areas. (2022) 56:247–70. doi: 10.1353/jda.2022.0053
17. HarvestPlus. Biofortified crops released. Washington, USA: HarvestPlus (2023). Available at: https://bcr.harvestplus.org/varieties_released_list.
18. Gashu D, Nalivata PC, Amede T, Ander EL, Bailey EH, Botoman L, et al. The nutritional quality of cereals varies geospatially in Ethiopia and Malawi. Nature. (2021) 594:71–6. doi: 10.1038/s41586-021-03559-3
19. Manzeke MG, Mtambanengwe F, Watts MJ, Hamilton EM, Lark RM, Broadley MR, et al. Fertilizer management and soil type influence grain zinc and iron concentration under contrasting smallholder cropping systems in Zimbabwe. Sci Rep. (2019) 9:6445. doi: 10.1038/s41598-019-42828-0
20. Chilimba AD, Young SD, Black CR, Rogerson KB, Ander EL, Watts MJ, et al. Maize grain and soil surveys reveal suboptimal dietary selenium intake is widespread in Malawi. Sci Rep. (2011) 1:72. doi: 10.1038/srep00072
21. Wood SA, Tirfessa D, Baudron F. Soil organic matter underlies crop nutritional quality and productivity in smallholder agriculture. Agr Ecosyst Environ. (2018) 266:100–8. doi: 10.1016/j.agee.2018.07.025
22. Siyame EW, Hurst R, Wawer AA, Young SD, Broadley MR, Chilimba AD, et al. A high prevalence of zinc-but not iron-deficiency among women in rural Malawi: a cross-sectional study. Int J Vitam Nutr Res. (2013) 83:176–87. doi: 10.1024/0300-9831/a000158
23. Morton CM, Pullabhotla H, Bevis L, Lobell DB. Soil micronutrients linked to human health in India. Sci Rep. (2023) 13:13591. doi: 10.1038/s41598-023-39084-8
24. Bevis L, Kim K, Guerena D. Soil zinc deficiency and child stunting: Evidence from Nepal. J Health Econ. (2023) 87:102691. doi: 10.1016/j.jhealeco.2022.102691
25. De Groote H, Tessema M, Gameda S, Gunaratna NS. Soil zinc, serum zinc, and the potential for agronomic biofortification to reduce human zinc deficiency in Ethiopia. Sci Rep. (2021) 11:8770. doi: 10.1038/s41598-021-88304-6
26. Bhattacharyya T, Pal DK, Mandal C, Chandran P, Ray SK, Sarkar D, et al. Soils of India: historical perspective, classification and recent advances. Curr Sci. (2013) 104:1308–23.
27. SHC. Soil health card. Ministry of Agriculture and Farmers Welfare, Government of India (2023). Available at: https://www.soilhealth.dac.gov.in/legacy.
28. Shukla AK, Behera SK. All India coordinated research project on micro- and secondary nutrients and pollutant elements in soils and plants: research achievements and future thrusts. Indian J Fertil. (2019) 15:522–43.
29. Shukla AK, Tiwari PK, Prakash C. Micronutrients deficiencies vis-a-vis food and nutritional security of India. Indian J Fertilisers. (2014) 10:94–112.
30. Shukla AK, Behera SK, Prakash C, Tripathi A, Patra AK, Dwivedi BS, et al. Deficiency of phyto-available sulphur, zinc, boron, iron, copper and manganese in soils of India. Sci Rep. (2021) 11:19760. doi: 10.1038/s41598-021-99040-2
31. Singh SK, Dey P, Sharma PK, Singh YV, Latare AM, Singh CM, et al. Primary and cationic micronutrient status of soils in few districts of eastern uttar pradesh. J Indian Soc Soil Sci. (2017) 64:319–32. doi: 10.5958/0974-0228.2016.00045.1
32. Desta MK, Broadley MR, McGrath SP, Hernandez-Allica J, Hassall KL, Gameda S, et al. Plant available zinc is influenced by landscape position in the amhara region, Ethiopia. Plants-Basel. (2021) 10:254. doi: 10.3390/plants10020254
33. Suchithra MS, Pai ML. Improving the prediction accuracy of soil nutrient classification by optimizing extreme learning machine parameters. Inf Process Agricul. (2020) 7:72–82. doi: 10.1016/j.inpa.2019.05.003
34. Sherpa S, Poonia S, Kumar S, Sharma S, Ajay A, Wu W, et al. Soil wet chemistry data and mid-infrared spectra collected from rice-wheat farmers’ fields in Bihar, India (2022). Available online at: https://hdl.handle.net/11529/10548646. 4th January, 2023.
35. Jena B, Nayak RK, Biswas PK, Da J. Zn distribution in soils of Odisha and its management in a cereal based cropping system through graded dose of ZnSo4 application. Int J Chem Stud. (2019) 7:2026–31.
36. Nanda SK, Mishra A, Pradhan NK, Muralidharudu Y. Soil testing and fertilizer recommendation in Orisa. Orissa: Department of Soil Science and Agricultural Chemistry, College of Agriculture, OUAT, Bhubaneswar (2008).
37. DAFW. Agricultural Statistics at a Glance 2022 (2023). New Delhi: Department of Agriculture & Farmers Welfare. Available online at: https://agricoop.nic.in/en/Agricultural_Statistics_at_a_Glance (Accessed 4th July 2023).
38. Joshi AK, Crossa J, Arun B, Chand R, Trethowan R, Vargas M, et al. Genotype×environment interaction for zinc and iron concentration of wheat grain in eastern Gangetic plains of India. Field Crops Res. (2010) 116:268–77. doi: 10.1016/j.fcr.2010.01.004
39. Dhaliwal SS, Ram H, Shukla AK, Mavi GS. Zinc biofortification of bread wheat, triticale, and durum wheat cultivars by foliar zinc fertilization. J Plant Nutr. (2019) 42:813–22. doi: 10.1080/01904167.2019.1584218
41. Joy EJM, Ahmad W, Zia MH, Kumssa DB, Young SD, Ander EL, et al. Valuing increased zinc (Zn) fertiliser-use in Pakistan. Plant Soil. (2017) 411:139–50. doi: 10.1007/s11104-016-2961-7
42. Rehman A, Farooq M, Nawaz A, Al-Sadi AM, Al-Hashmi KS, Nadeem F, et al. Characterizing bread wheat genotypes of Pakistani origin for grain zinc biofortification potential. J Sci Food Agric. (2018) 98:4824–36. doi: 10.1002/jsfa.9010
43. Velu G, Singh RP, Huerta-Espino J, Pena RJ, Arun B, Mahendru-Singh A, et al. Performance of biofortified spring wheat genotypes in target environments for grain zinc and iron concentrations. Field Crops Res. (2012) 137:261–7. doi: 10.1016/j.fcr.2012.07.018
44. Pandey A, Khan MK, Hakki EE, Thomas G, Hamurcu M, Gezgin S, et al. Assessment of genetic variability for grain nutrients from diverse regions: potential for wheat improvement. SpringerPlus. (2016) 5:1912. doi: 10.1186/s40064-016-3586-2
45. Saha S, Mandal B, Hazra GC, Dey A, Chakraborty M, Adhikari B, et al. Can agronomic biofortification of zinc be benign for iron in cereals? J Cereal Sci. (2015) 65:186–91. doi: 10.1016/j.jcs.2015.06.007
46. Debnath S, Mandal B, Saha S, Sarkar D, Batabyal K, Murmu S, et al. Are the modern-bred rice and wheat cultivars in India inefficient in zinc and iron sequestration? Environ Exp Botany. (2021) 189:104535. doi: 10.1016/j.envexpbot.2021.104535
47. Yadava DK, Hossain F, Choudhury PR, Kumar D, Singh AK. Biofortification of crops: A sustainable tool for nutritional security in India. Indian Farming. (2018) 68:37–42.
48. Rao SD, Neeraja CN, Madhu Babu P, Nirmala B, Suman K, Rao LVS, et al. Zinc biofortified rice varieties: challenges, possibilities, and progress in India. Front Nutr. (2020) 7:26. doi: 10.3389/fnut.2020.00026
49. Babu V, Neeraja CN, Sanjeeva Rao D, Sundaram RM, Longvah T, Usharani G, et al. Biofortification in rice [81/2014]. (2014) Hyderabad, Directorate of Rice Research.
50. Ghasal PC, Shivay YS, Pooniya V, Choudhary M, Verma RK. Zinc partitioning in basmati rice varieties as influenced by Zn fertilization. Crop J. (2018) 6:136–47. doi: 10.1016/j.cj.2017.09.001
51. Shivay YS, Prasad R, Rahal A. Genotypic variation for productivity, zinc utilization efficiencies, and kernel quality in aromatic rices under low available zinc conditions. J Plant Nutr. (2010) 33:1835–48. doi: 10.1080/01904167.2010.503832
52. Saha S, Chakraborty M, Padhan D, Saha B, Murmu S, Batabyal K, et al. Agronomic biofortification of zinc in rice: Influence of cultivars and zinc application methods on grain yield and zinc bioavailability. Field Crops Res. (2017) 210:52–60. doi: 10.1016/j.fcr.2017.05.023
53. FAI. Fertiliser statistics 2019-20. New Delhi: The Fertiliser Association of India (2020). Available at: https://www.faidelhi.org/statistics/statistical-database.
54. Shukla AK, behera SK. Micronutrients fertilisers for higher productivity. Indian J Fertil. (2012) 8:100–17.
55. Veni VG, Datta S, Rattan R, Meena M, Sharma J. Residual effect of Zn fertilization on wheat (Triticum aestivum L.) grown in soils with divergent characterstics. Int J Curr Microbiol Appl Sci. (2019) 8:69–81. doi: 10.20546/ijcmas.2019.810.008
56. Takkar P, Chhibba I, Mehta S. Twenty years of coordinated research on micronutrients in soils and plants. (1989). Bhopal, Indian Institute of Soil Science. 314 p.
57. Singh MV. Evaluation of micronutrient stocks in different agroecological zones of India. Fertiliser News (2001) 42(2):25–42.
58. Prasad R, Shivay YS, Kumar D. Zinc fertilization of cereals for increased production and alleviation of zinc malnutrition in India. Agric Res. (2013) 2:111–8. doi: 10.1007/s40003-013-0064-8
59. Dhaliwal SS, Sharma V, Shukla AK, Verma V, Behera SK, Singh P, et al. Foliar zinc application for zinc biofortification in diverse wheat genotypes under low Zn soil. Cereal Res Commun. (2022) 50:1269–77. doi: 10.1007/s42976-022-00251-8
60. Mossa AW, Gashu D, Broadley MR, Dunham SJ, McGrath SP, Bailey EH, et al. The effect of soil properties on zinc lability and solubility in soils of Ethiopia - an isotopic dilution study. Soil. (2021) 7:255–68. doi: 10.5194/soil-7-255-2021
61. Botoman L, Chagumaira C, Mossa AW, Amede T, Ander EL, Bailey EH, et al. Soil and landscape factors influence geospatial variation in maize grain zinc concentration in Malawi. Sci Rep. (2022) 12:7986. doi: 10.1038/s41598-022-12014-w
62. Khurana A, Kumar V. State of biofertilizers and organic fertilizers in India. New Delhi: Environment (2022).
63. Gupta AP. Micronutrient status and fertilizer use scenario in India. J Trace Elem Med Biol. (2005) 18:325–31. doi: 10.1016/j.jtemb.2005.04.003
64. Shukla AK, Behera SK, Lenka NK, Tiwari PK, Prakash C, Malik RS, et al. Spatial variability of soil micronutrients in the intensively cultivated Trans-Gangetic Plains of India. Soil Tillage Res. (2016) 163:282–9. doi: 10.1016/j.still.2016.07.004
65. Zia A, van den Berg L, Ahmad MN, Riaz M, Zia D, Ashmore M. Controls on accumulation and soil solution partitioning of heavy metals across upland sites in United Kingdom (UK). J Environ Manage. (2018) 222:260–7. doi: 10.1016/j.jenvman.2018.05.076
66. Khokhar JS, Sareen S, Tyagi BS, Singh G, Chowdhury AK, Dhar T, et al. Characterising variation in wheat traits under hostile soil conditions in India. PloS One. (2017) 12:e0179208. doi: 10.1371/journal.pone.0179208
67. Singh MV. Micronutrient nutritional problems in soils of India and improvement for human and animal health. Indian J Fertil. (2009) 5:11–16, 19-26, 56.
68. Lowe NM, Hall AG, Broadley MR, Foley J, Boy E, Bhutta ZA. Preventing and controlling zinc deficiency across the life course: A call to action. Adv Nutr. (2024) 15:100181. doi: 10.1016/j.advnut.2024.100181
69. Indian Food Composition Tables (2017). National Institute of Nutrition. Hyderabad, Telangana, India. Available at: file:///C:/Users/sbzjs9/Downloads/IFCT.pdf (Accessed on 11the February 2023).
Keywords: soil fertility, soil and crop zinc, zinc deficiency, Zn fertilisers, human nutrition
Citation: Khokhar JS, Broadley MR and Ander EL (2024) Soil zinc surveillance frameworks can inform human nutrition studies: opportunities in India. Front. Soil Sci. 4:1421652. doi: 10.3389/fsoil.2024.1421652
Received: 22 April 2024; Accepted: 06 August 2024;
Published: 03 September 2024.
Edited by:
Shahid Hussain, Bahauddin Zakariya University, PakistanReviewed by:
Maja Manojlović, University of Novi Sad, SerbiaAsif Naeem, Nuclear Institute for Agriculture and Biology, Pakistan
Copyright © 2024 Khokhar, Broadley and Ander. This is an open-access article distributed under the terms of the Creative Commons Attribution License (CC BY). The use, distribution or reproduction in other forums is permitted, provided the original author(s) and the copyright owner(s) are credited and that the original publication in this journal is cited, in accordance with accepted academic practice. No use, distribution or reproduction is permitted which does not comply with these terms.
*Correspondence: Jaswant S. Khokhar, SmFzd2FudC5raG9raGFyQG5vdHRpbmdoYW0uYWMudWs=