 Xue Li1,2,3
 Na Li
Na Li Xiao-Ri Han
95% of researchers rate our articles as excellent or good
Learn more about the work of our research integrity team to safeguard the quality of each article we publish.
Find out more
ORIGINAL RESEARCH article
Front. Soil Sci. , 02 February 2023
Sec. Soil Biogeochemistry & Nutrient Cycling
Volume 3 - 2023 | https://doi.org/10.3389/fsoil.2023.1010677
This article is part of the Research Topic Biochar Addition Affecting Soil Physical, Chemical, and Biological Properties View all 4 articles
Introduction: To comprehend soil P transformation and crop P uptake, it is necessary to understand how the long-term substitution of mineral fertilizers with stover or biochar affects soil properties and P forms. However, the effects of large-scale continuous stover or biochar application on soil P forms and fractions and the response of P uptake by corn are largely unknown. The purpose of this study was to investigate the role of stover and its biochar in the variation of P forms and Hedley-P fractions.
Methods: A five-year field experiment in brown soil was carried out using the following treatments: non-fertilizer (CK), chemical fertilizer (NPK), chemical fertilizer + corn stover (SNPK), and chemical fertilizer + biochar (CNPK). Hedley fractionation and 31P nuclear magnetic resonance spectroscopy were used to determine P compounds.
Results and discussion: The greatest increases in P uptake occurred during the CNPK treatment, specifically orthophosphate and Resin-P, and coincided with increases in total inorganic P and Hedley-P fractions. On the other hand, total organic P accumulation was found to be highest in the SNPK treatment, as was total inositol hexakisphosphate and orthophosphate diester accumulation. Treatments with SNPK and CNPK significantly increased adenosine monophosphate and DNA. However, no difference was found between NaHCO3-Pi and NaOH-Pi of the NPK, SNPK, and CNPK treatments. Decreasing chemical fertilizer and partially replacing it with biochar in brown soil may increase crop P uptake by degrading applied organic P forms and multiplying inorganic P forms.
Phosphorus (P) is a major limiting factor in plant productivity and is critical to the system’s ecological balance (1, 2). However, P is easily fixed in soils, which is a significant problem with soil fertility (3).
It is well understood that in the soil, P is generally classified as inorganic or organic (4). P uptake by microorganisms and crops is influenced by different P forms (5). The technique of 31P-NMR spectroscopy is commonly used to obtain detailed information about soil P (6). It is a better method than traditional grading methods for detecting the reflection of dynamic changes in soil P (7). Obtaining data on P forms and P fractions can aid in better illustrating the biological cycle of P, as well as changes in P forms caused by the soil formation process (8).
Biochar is a solid product derived from biomass via thermochemical conversion under anoxic conditions (9). Biochar has a large surface area and unique chemical and physical properties (10, 11), and can boost soil enzyme activity, microbial biomass carbon (C), nitrogen (N), and P contents, soil bacteria, and crop production and quality (12, 13). Crop stover is an important source of nutrients in soils (14). Crop stover or biochar incorporation into agricultural soils could be a common and effective strategy for soil fertility and plant growth (15). The majority of research on the effects of stover or biochar on C sequestration, N sequestration, and emission reduction has been carried out (11). On the other hand, the dynamics of soil P amended with stover or biochar have not been thoroughly investigated.
Biochar reduces P fixation in a variety of soils and promotes soil activation in soils that cannot accommodate P directly (16). Some authors contend that the carbonization process of biochar can promote the release of phosphate from the woody tissues of plant residues. Stower is the most abundant organic resource when applied to the fields (17), improving soil quality, microbial activity, and soil pH and activating fixed P (18). Several studies have shown that using residual stover in the field can boost the available P and total P content of the soil (19). However, the applied stover has a lower P activation coefficient than biochar (20), which increases the conversion of organic P to inorganic P in the soil (21). Many studies have shown that fertilizer types and fertilization practices alter the P forms in the soil (22). However, very few studies have been conducted to investigate the effects of stover and its biochar on the P forms and P fractions in the field. We conducted a five-year field experiment to investigate the role of stover and biochar application in soil P dynamic variation. We measured soil P fractions and forms using Hedley fractionation and 31P-NMR spectroscopy. This study hypothesized that applying a combination of biochar (corn stover) and chemical fertilizers would have different effects on soil Hedley-P fractions and P forms than mineral fertilizers. The objectives of this study are to 1) determine the effect of combining corn stover (and its biochar) with chemical fertilizers on P forms and Hedley-P fractions in arable soils, and 2) understand the relationship between Hedley-P fractions, P forms, and P uptake by corn.
This research was carried out in April 2013 at Shenyang Agricultural University in Liaoning Province, China, as part of the Long-term stationary biochar experiment (40°48’N and 123°33’E). According to the FAO classification, the soil in the region belongs to the Alfisols profile (23). The site climate has been given in detail by Li et al. (24). Each treatment was repeated three times, the plot area was 25.5 m2 (3.6 m×7.0 m), and all treatments were randomly arranged. The following were the basic physical and chemical properties of the initial soil (CK0): 6.0 soil pH, 9.9 g kg–1 organic C, 0.9 g kg–1 total nitrogen (N), 112.65 mg kg–1 alkali-hydrolyzable N, 16.30 mg kg–1 Olsen-P, 109.90 mg kg–1available potassium (K), 1.25 g cm-3 There were four treatments: CK (no fertilizers), NPK: urea (46% N) +superphosphate (5% P) +potassium chloride (42% K) fertilizers; CNPK: biochar +NPK; and SNPK: corn stover +NPK. As shown in all figures, CK was the control treatment from 2018, and CK0 was the initial soil from 2013. At a surface density of 3000 kg ha–1 yr–1, biochar was applied. At a surface density of 9000 kg ha–1 yr–1, corn stover was cut into 2–3 cm and applied, as well as corn stover from the harvested crop. The annual surface densities of N, P, and K fertilizers were 195 kg ha–1, 39 kg ha–1, and 62 kg ha–1, respectively. Corn stover, biochar, and chemical fertilizer were applied annually (April 2013 to 2018) before sowing and spread on the soil surface before being tilled into a 0–20 cm soil layer by a rotavator. Corn was planted in April–May and harvested in September–October. The experimental field cropping system included one annual spring crop of corn in continuous cultivation using the cultivar mongolia6531, with a planting density of 60000 plants hm–2. The biochar was produced from corn stover and heated at 450–600°C with a pH of 10.4, 490. 0 g kg–1 total C, 14.4 g kg–1 total N, 8.5 g kg–1 total P, 14.08 g kg–1 total K, 22.34 m2 g–1 specific surface area, 0.043 cm3 g–1 pore volume, 7.12 nm pore size, and 33.5% ash content. The total N, P, K, and C contents of the stover were 0.96%, 0.32%, 0.72%, and 42.08%, respectively.
For all treatments, soil samples were taken from 0–20 cm depth after harvesting in October. Each plot had five randomly selected points where the soil was mixed as a soil sample, air-dried naturally, and sieved through 0.85 mm and 0.15 mm sieves.
The alkali diffusion method was used to determine the available N in the soil using 1.0 mol L–1 of NaOH (25). Olsen-P was measured using the molybdenum-antimony anti-colorimetric method in 0.5 mol L–1 of NaHCO3 (26). The available K was determined with 1.0 mol L–1 of NH4OAc (Shanghai, China) using the flame photometric method (27). The pH of the water:soil mixture was 2.5:1, according to a Lei Magnetic PHS-3C type pH meter from China. The total P content was determined using the sodium hydroxide melting-molybdenum-barium colorimetric method (28). The C and N contents of the soil were determined using an elemental analyzer (Elemental III, Germany).
In the current study, the Hedley-P fractions were classified into seven soil P fractions based on previous research (29). (1) In 50 mL screw-cap centrifuge tubes, soil samples weighing about 0.5 g (0.15 mm) were collected. These samples were shaken for 16 h with 30 mL of deionized water and two saturated anion resin membranes. The resin membranes were removed and shaken in a 0.5 mol L–1 HCl solution for 16 h. The inorganic phosphorus, labeled Resin-P, was determined using the molybdenum blue method. (2) The soil residue was centrifuged in a centrifuge tube at 0°C for 10 min at 25000 g before being filtered and rinsed with 30 mL NaHCO3. After shaking for 16 h, the solution was centrifuged for 10 min. The supernatant was separated into two parts: one labeled as NaHCO3-Pi (NaHCO3 extracted inorganic P, primarily adsorbed on the soil’s surface, and this part of the P was effective), and the other was frozen and centrifuged for further analysis. Ammonium sulfate was added to the other part and heated in an autoclave for 1 h to 121°C, yielding NaHCO3-Po (NaHCO3 extracted organic P, which was easy to mineralize and could be used by plants within a short period). (3) The soil was washed with 30 mL NaOH on the filter membrane in a centrifuge tube. After shaking for 16 h, the sample was centrifuged for 10 min and filtered. The supernatant was divided into two parts; to the first, 0.9 mol L–1 of H2SO4 was added, which was then frozen and centrifuged for analysis and labeled as NaOH-Pi (inorganic P extracted with NaOH, chemically adsorbed to the soil Fe, Al compounds, and on the surface of clay particles). Ammonium sulfate was added to the other part, which was autoclaved for 1.5 h at 121°C and labeled as NaOH-Pt (NaOH extracted total P); NaOH-Po (organic P) = NaOH-Pt minus NaOH-Pi. (4) The soil was washed through a filter membrane in a centrifuge tube with 30 mL of 1 mol L–1 HCl. After shaking for 16 h, the sample was centrifuged for 10 min and filtered. As HCl-Pi, the supernatant was labeled and analyzed. (5) Approximately 10 mL of concentrated HCl was added to the soil residual sample and heated in a water bath for 10 min at 80°C. After treating the sample with 5 mL of concentrated HCl, it was centrifuged for 10 min. The supernatant was tested and labeled with HCl-Pt (HCl extracted total P). HCl-P = HCl-Pt -HCl-Pi (6) Of concentrated H2SO4, 5 mL was added to the soil residue. The sample was treated with H2O2 and digested several times at 360°C. The sample was shaken, filtered, and set aside for a short period. The supernatant was referred to as Residual-P. Table S1 shows the recovery rate of the Hedley-P fraction.
The Swiss Bruker AVANCE III Bruker-500MHz nuclear magnetic resonance instrument installed at Jilin University and Shenyang Agriculture University was used to perform liquid-state 31P-NMR spectroscopy of soil samples (extracts) (30, 31). The soil sample was pretreated by passing approximately 3.00 g through a 2 mm sieve into a 100 mL centrifuge tube and treating it with a 60 mL mixture of 0.25 mol L–1 NaOH and 0.05 mol L–1 Na2EDTA extractant at a water-soil ratio of 20:1. After mixing, the sample was shaken for 16 h at 20°C before being centrifuged (20°C, 10000 g, 20 min) and the supernatant filtered through a 0.45-micron filter membrane. A small amount of the extract, about 15 mL, was frozen. After dissolving the lyophilized sample in 1 mL of 0.25 mol L–1 NaOH, it was centrifuged for 5 min (4°C, 10000 g). The supernatant was removed. Before being transferred to a 5 mm NMR tube for analysis, 0.6 mL of supernatant was treated with 0.05 mL of D2O. After digesting 5 mL of the filtered extract with the H2SO4-HClO4 mixture, the total extracted P concentration in the soils was determined using ICP-OES. The standard was orthophosphoric acid (85%) with a chemical shift of 6 ppm (32), and the other peaks were assigned to P forms based on the spiked experiment results and references (30, 33, 34). Although the spin-lattice relaxation times for these samples were not measured using 31P-NMR, the delay time was estimated using the P/(Fe + Mn) ratio for these extracts (6). Using the MestReC software, the nuclear magnetic resonance spectra were plotted, and the integrals and peak areas were calculated. Through integration, we also used MestReNova software (Mestrelab Research, S.L., Spain) to determine the relative proportion of each compound in the spectrum. We calculated the concentration of all compounds in each group from the total extracted P concentration and obtained relative proportion.
SPSS 21.0 (IBM Corp., Armonk, NY, USA) was used for the statistical analyses. The data are presented as arithmetic means with standard deviations. Before analysis, data were checked for variance homogeneity (Levene’s test) and residual normality (Shapiro-Wilk test) and transformed to log or square root if necessary. A one-way analysis of variance procedure was used to test the effect of different fertilization treatments on soil properties and NaOH-EDTA P extraction. To determine whether the differences in P forms between treatments were significant, the least significant difference (LSD) test was used (P <0.05). The correlations between the P fractions and P forms were investigated using Pearson’s correlation coefficients.
Several studies have found that some biochar contains a high concentration of base cations, which can cause a significant increase in soil pH (35, 36). In our soils, chemical fertilizers significantly decreased soil pH. The combination of corn stover (and its biochar) and chemical fertilizers application did not increase soil pH compared to the initial soil pH (Figure 1). This meant that the soil pH remained unchanged, and the combination of corn stover (and its biochar) and chemical fertilizer application reduced the impact of chemical fertilizer to some extent. Soil total C increased significantly with the combination of biochar and chemical fertilizers application, followed by the combination of corn stover and chemical fertilizers application when compared to the control treatment (Figure 1). Indeed, biochar was found to be more beneficial to soil C accumulation than corn stover application (37). The aging process influences biochar decomposition and mineralization, increasing soil organic C. (38). The study found that total N was lowest in control soils. Highest in soils treated with NPK (Figure 1). The alkali-hydrolyzable N was reduced compared to the initial soil, whether fertilized or not. The minimum value was obtained in the control soils (Figure 1). In comparison to the control soils, the combination of biochar and chemical fertilizers application slightly increased alkali-hydrolyzable N, indicating that N availability increases when biochar and chemical fertilizers are combined. These findings were consistent with those of Fiorentino et al. (39), who discovered that biochar could reduce inorganic N immobilization in natural soil and fertilizers by increasing microbial activity. Our research found that the highest C/N ratio was 11.5 in biochar application, ranging from 9.8 to 11.5 in all treatments. Other studies suggested that higher C/N ratios occurred in applied amounts of biochar as more stable C input to soils (40).
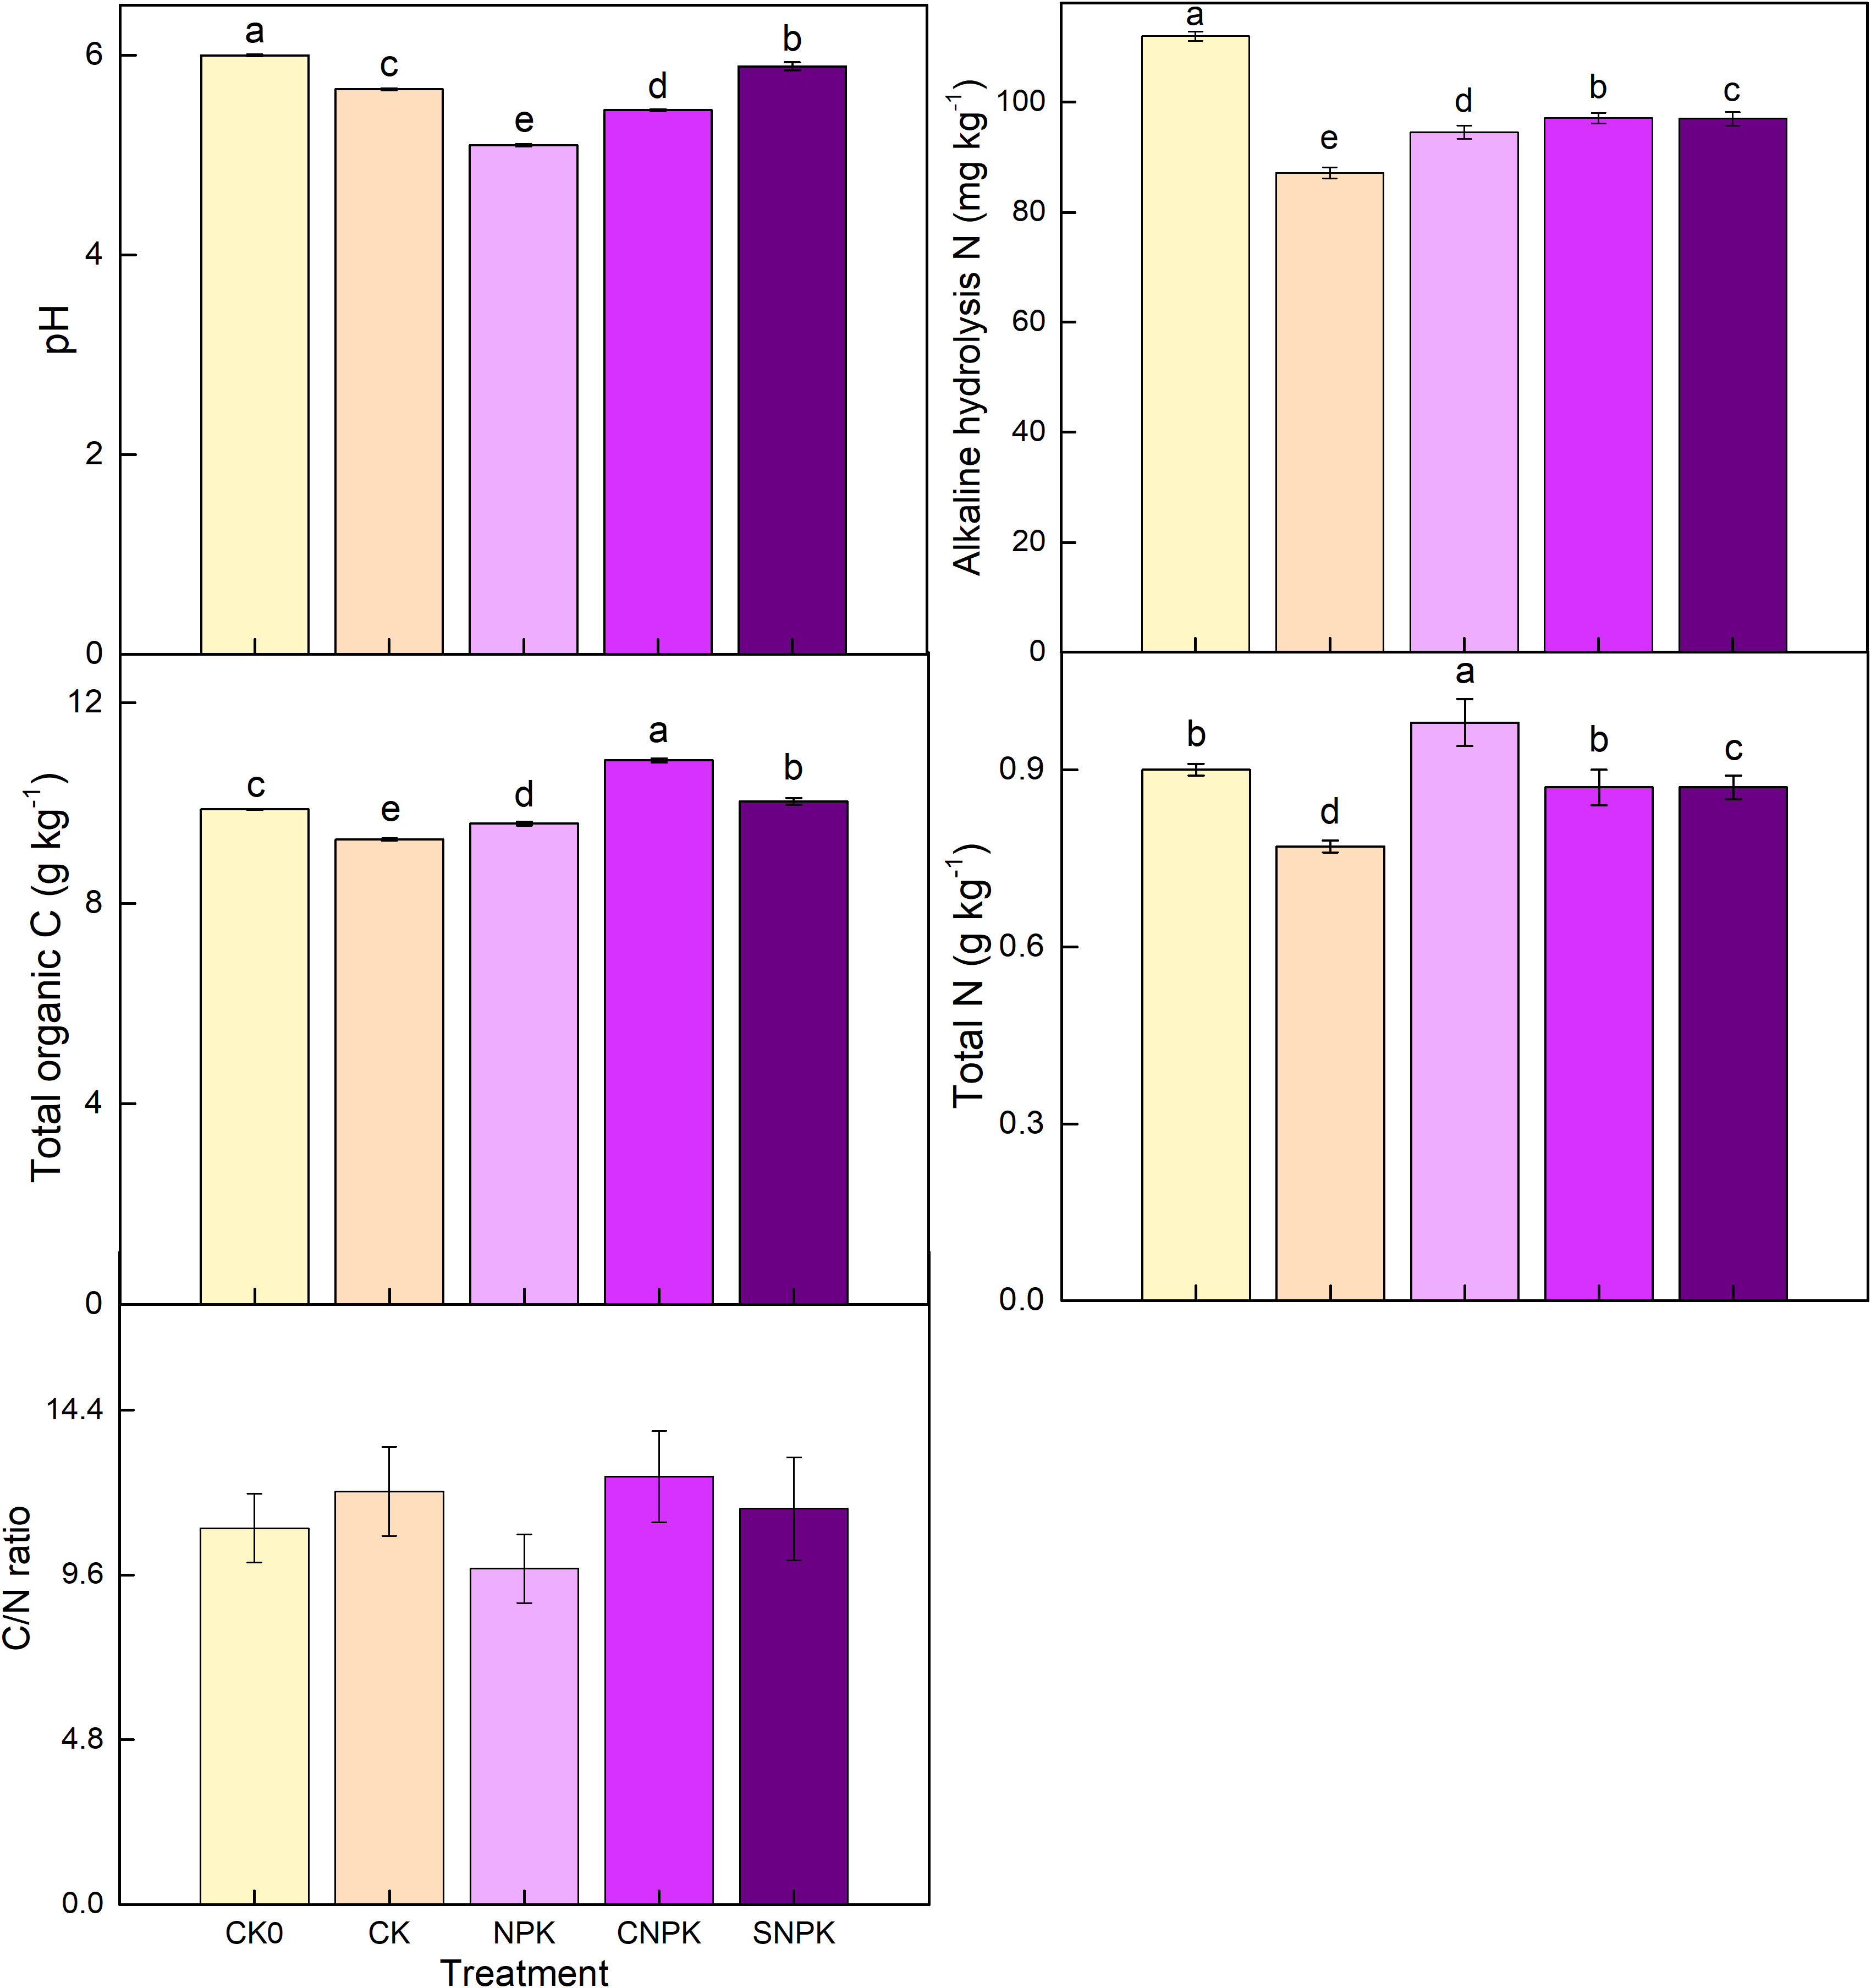
Figure 1 Effects of the different treatments on soil pH, alkali-hydrolyzable N, total N, total C, and C/N ratio. Error bars represent standard deviation, n = 3. Different letters in a column indicate significant differences at the 0.05 level. CK0: initial soil; CK: non-fertilizer; NPK: NPK fertilizer; CNPK: biochar + NPK fertilizer; SNPK: corn stover + NPK fertilizer.
Higher total P levels were found after the soil was treated with a combination of biochar and chemical fertilizers, which coincided with high organic matter additions (Figure 2), indicating that adding the combination of biochar and chemical fertilizers increased total P. Both biochar (41, 42) and corn stover (43, 44) are likely to be good sources of P. The plots with the highest increase in Olsen-P had a combination of corn stover, and chemical fertilizers applied. The second-largest had a combination of biochar and chemical fertilizers applied (Figure 2). The Olsen-P level in the chemical fertilizer-added soils then increased to the level in the initial soils when compared to the control soil. These findings indicated that adding P to mineral and organic sources positively affected Olsen-P, which could be attributed to Olsen-P being directly transformed by labile organic P produced by additional mineral fertilizer or stover application (45, 46). Furthermore, biochar’s surface is rich in oxygen-containing functional groups. Its negative charge and complex pore structure endow it with a high cation exchange capacity and adsorption capacity (47). When biochar combined with chemical fertilizer, biochar could be used as a slow-release fertilizer carrier to delay the release of fertilizer nutrients. 5 years of Olsen-P changes that could be attributed to P were added at high rates (39 kg ha–1 yr–1).
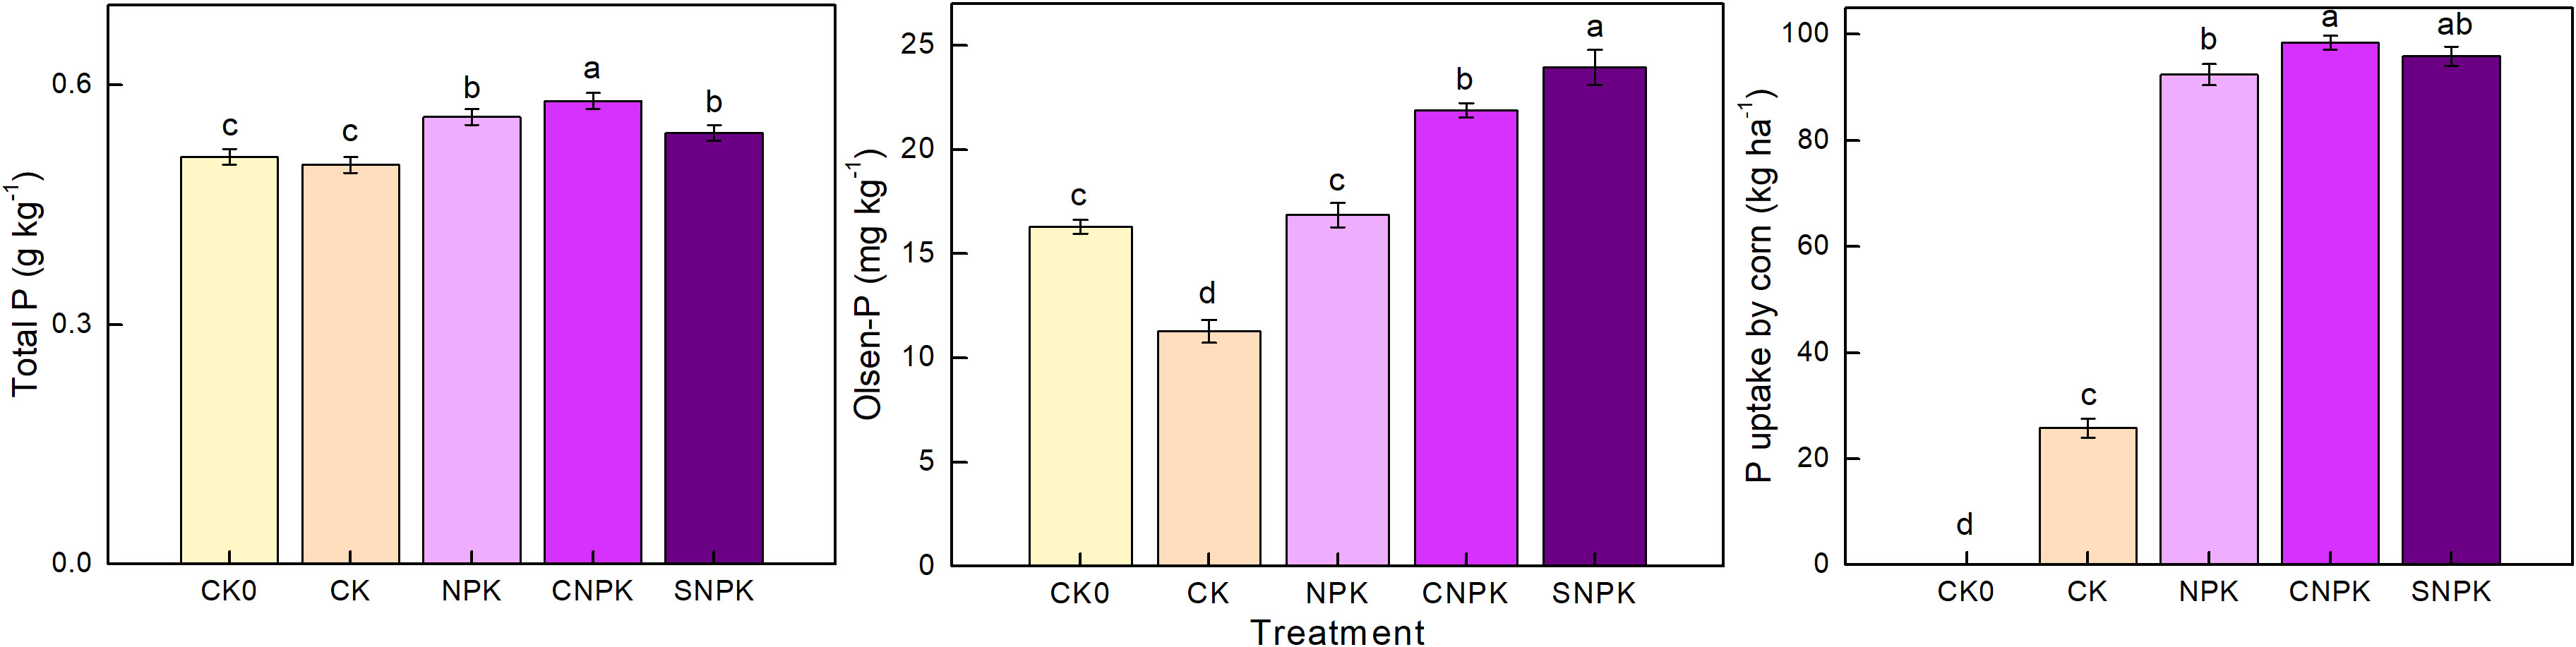
Figure 2 Effects of the different treatments on soil total P, Olsen-P, and P uptake by corn. Error bars represent standard deviation, n = 3. Different letters in a column indicate significant differences at the 0.05 level. CK0: initial soil; CK: non-fertilizer; NPK: NPK fertilizer; CNPK: biochar + NPK fertilizer; SNPK: corn stover + NPK fertilizer.
Corn’s increased P uptake after the addition of corn stover (and its biochar) and chemical fertilizers was most likely due to an increase in soil organic matter and pH value (Figures 1, 2). In contrast to Barrow et al. (48), a pH of 5 may have promoted plant P uptake. This deviation from our results could be attributed to differences in soil parent material, soil P content, and crop variety. The highest yield was obtained in the combination of biochar and chemical fertilizers, and there was no significant difference between chemical fertilizers and the combination of corn stover and chemical fertilizers. Therefore, we propose that adding the combination of biochar and chemical fertilizers may be a more effective strategy for increasing soil total P, P uptake by corn, and yield; however, the effects of biochar on P uptake from soil P and plants remain unknown.
The combination of biochar and chemical fertilizers resulted in a significant increase in total Hedley-P fraction concentrations (Figure 3). Resin-P increased more when biochar and chemical fertilizers were used together than when corn stover and chemical fertilizers were used together. It increased slightly in chemical fertilizer soils, as it did in corn stover and chemical fertilizer soils. This could be attributed to changes in soil properties and higher availability of P in soils. The current study found no significant differences between initial soil and control soils at NaHCO3-Pi, indicating that five years of planting had no effect on NaHCO3-Pi, and there were no significant differences between fertilized treatments at NaHCO3-Pi (Figure 3). NaOH-Pi followed a similar pattern to NaHCO3-Pi, with the lowest levels found in control soils. Our findings revealed that the combination of corn stover (and its biochar) and chemical fertilizer application increased the content of inorganic P fractions. The organic P fractions (NaHCO3-Po and NaOH-Po) of biochar with chemical fertilizers were significantly higher than that of the combination of corn stover and chemical fertilizers. This could be due to the distinct physical properties of biochar, which is also a rich source of organic P fractions than corn stover. On the other hand, it could be due to the interaction of chemical fertilizers and biochar/corn stover. NaOH-Po is commonly referred to as sorbed P, and biochar with a larger surface area has a greater adsorption capacity for sorbed P. Furthermore, biochar influences soil P adsorption capacity by influencing various factors, including soil pH, P content, cation content, and microbial activity. In all treatments, Resin-P followed the same pattern as NaHCO3-Po. In this study, we found no significant effects of chemical fertilizers or the combination of corn stover and chemical fertilizers soils on Residual-P, but the opposite was true for HCl-P, which was lowest in the combination of biochar and chemical fertilizers soils and highest in chemical fertilizers soils (Figure 3). In comparison to chemical fertilizers, the application of corn stover (biochar) and chemical fertilizers can increase soil available P content by changing soil pH. The findings of our study were also consistent with previous research (49, 50).
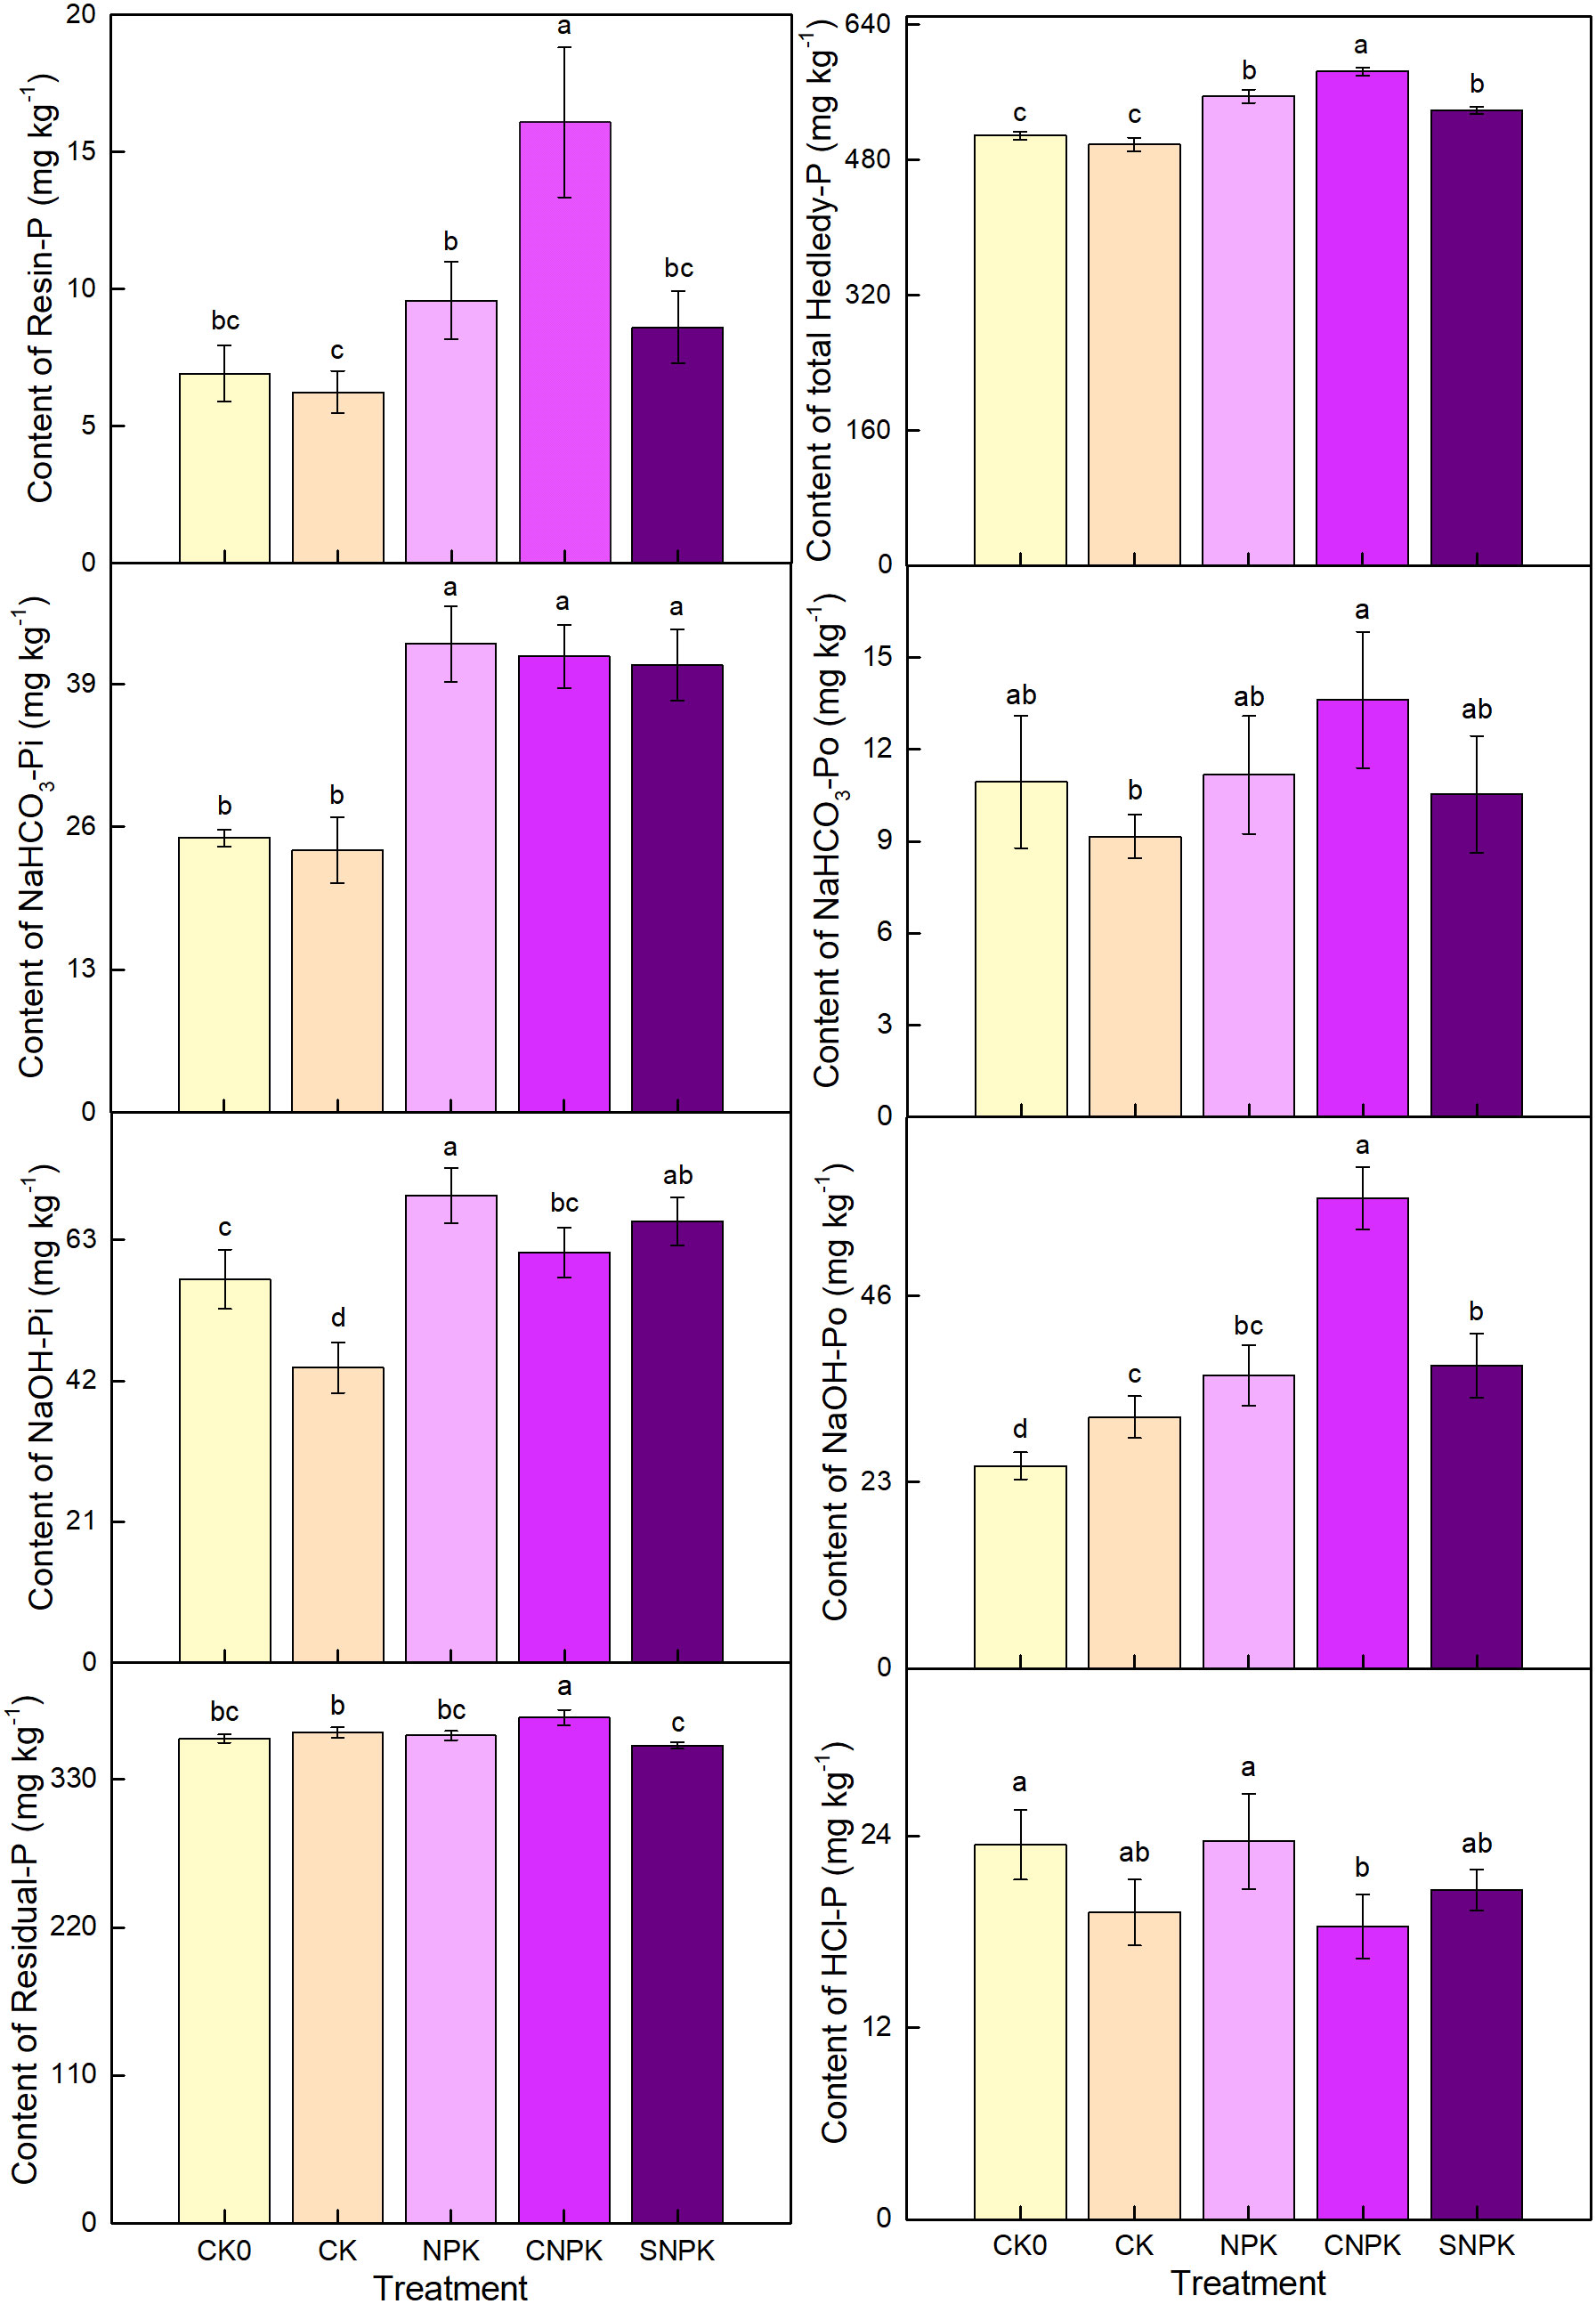
Figure 3 Effects of the different treatments on soil P fractions in the Hedley improvement method (1993). Error bars represent standard deviation, n = 3. Different letters in a column indicate significant differences at the 0.05 level. Resin-P: resin exchanged P; NaHCO3-Pi and NaHCO3-Po: NaHCO3 extracted state inorganic P and organic P; NaOH-Pi and NaOH-Po: NaOH extracted state inorganic P and organic P; HCl-P: 1 mol L dilute hydrochloric acid to extract P; and Residual-P: residual P. CK0: initial soil; CK: non-fertilizer; NPK: NPK fertilizer; CNPK: biochar + NPK fertilizer; SNPK: corn stover + NPK fertilizer.
The solution 31P-NMR of NaOH-EDTA soil extracts collected from all treatments is depicted in Figure 4. Adenosine monophosphate (AMP) and inositol hexakisphosphate were identified as the orthophosphate monoester peaks (IHP; Figure 5). Neo-IHP and D-chiro-IHP were found in the initial soil; additionally, neo-IHP was found in the combination of corn stover and chemical fertilizers soils, and D-chiro-IHP was found in the combination of biochar and chemical fertilizers soils. This could be related to their origins, as D-chiro-IHP can be derived from plants and microbes, whereas neo-IHP can be derived from microbes (24, 51).
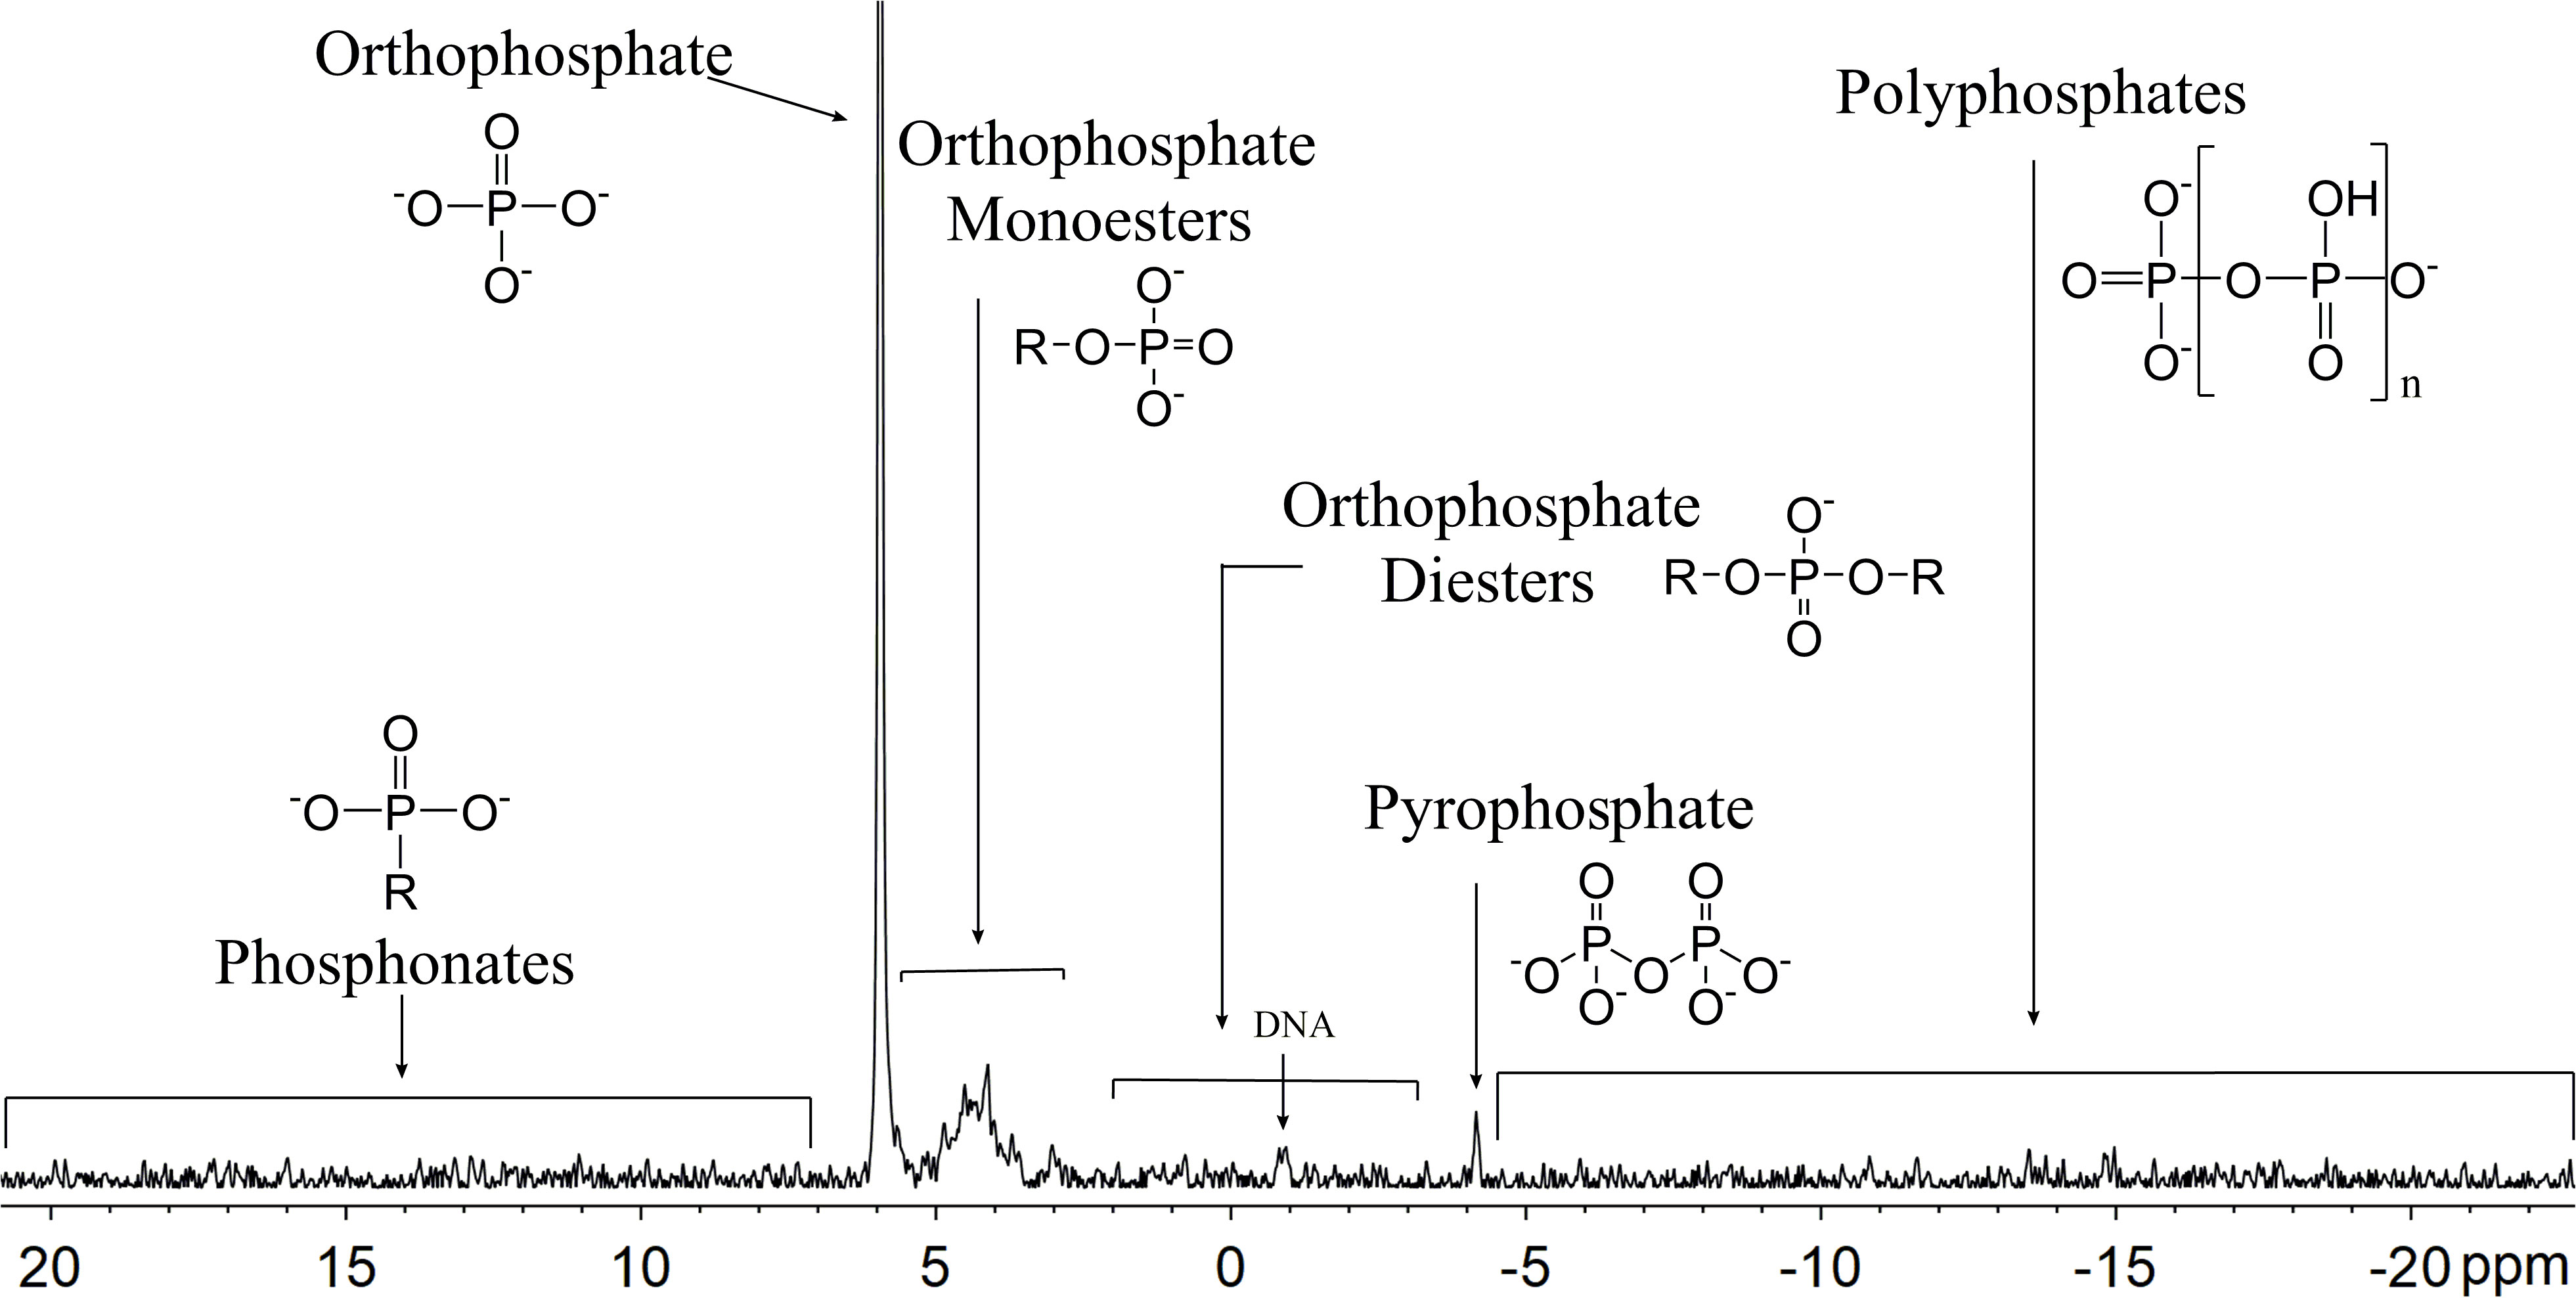
Figure 4 Examples of solution 31P nuclear magnetic resonance spectra for all treatments.
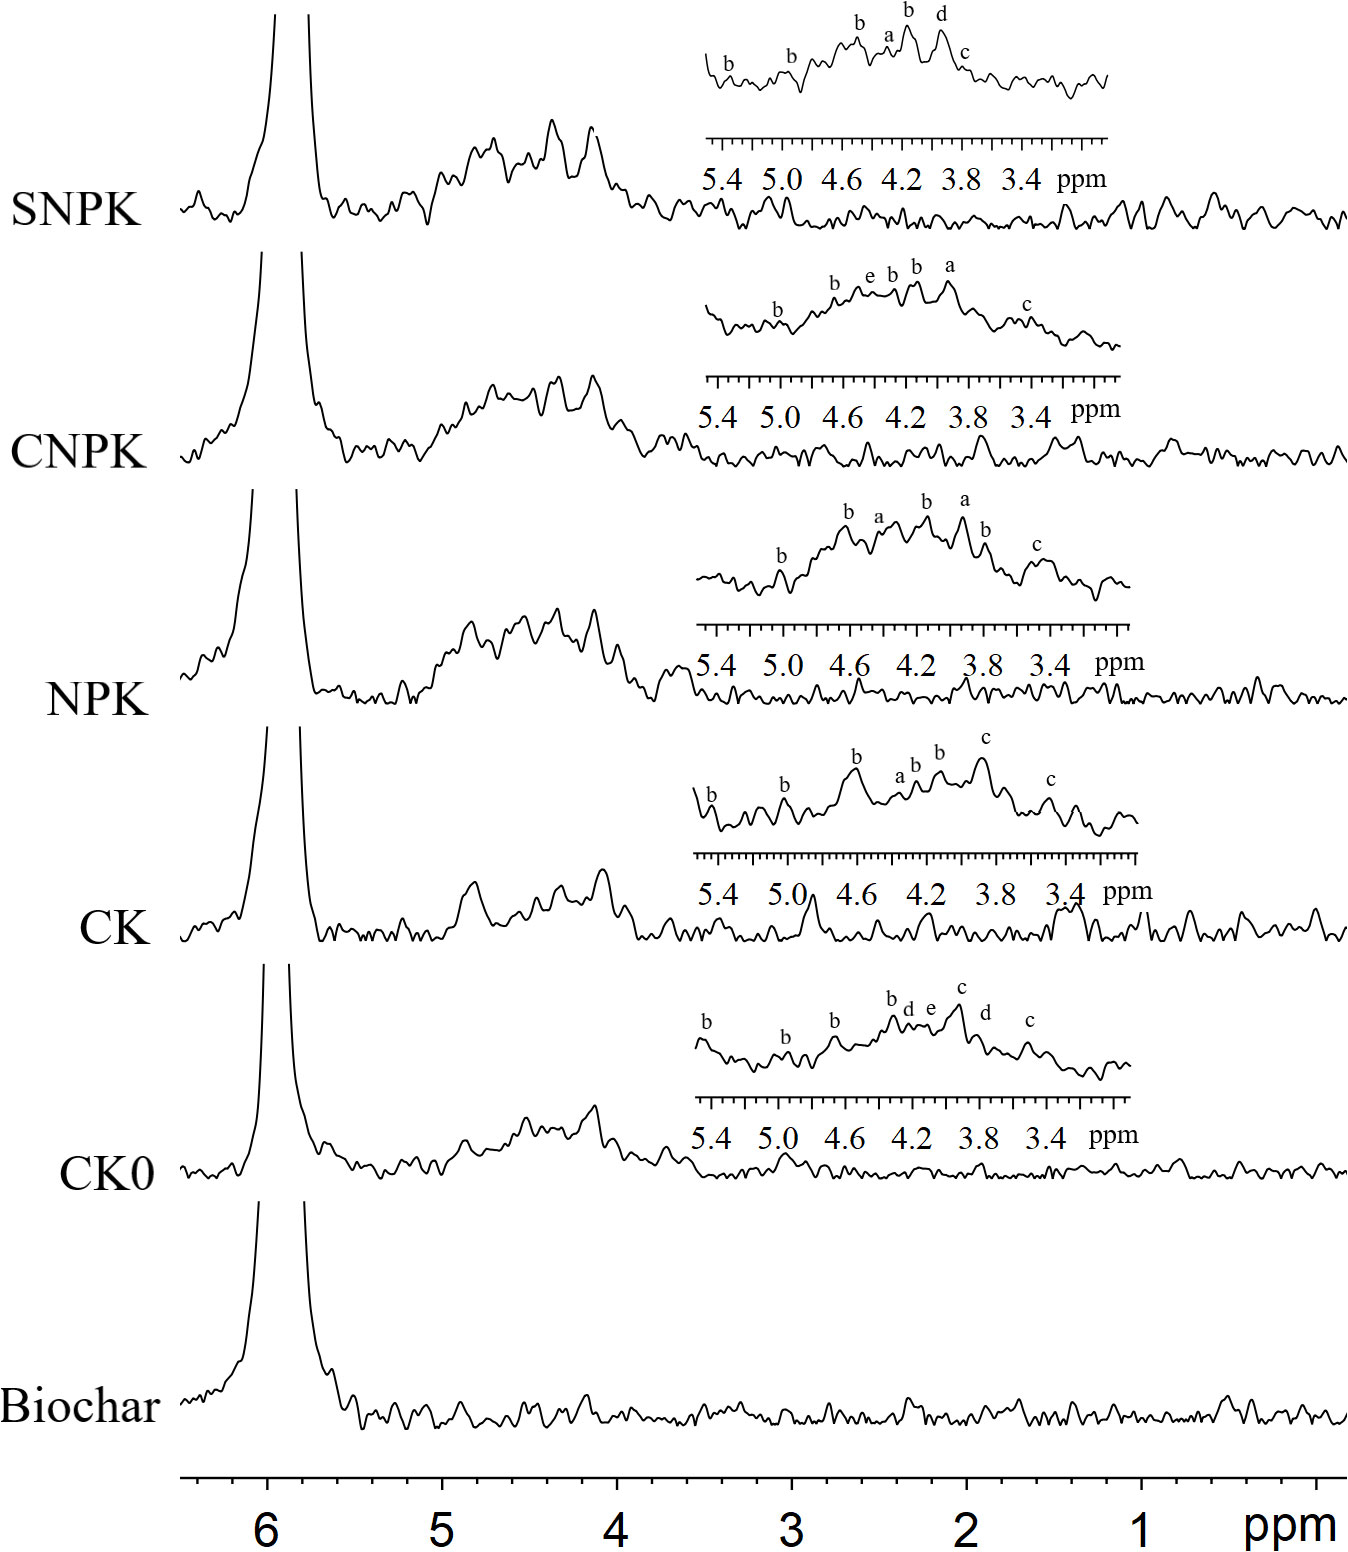
Figure 5 The solution 31-phosphorus nuclear magnetic resonance spectra of the biochar-treated sample and the orthophosphate and monoester under different treatments in detail (5.4 to 3.0 ppm). a: adenosine monophosphate; b: myo-Inositol hexakisphosphate; c: scyllo-Inositol hexakisphosphate; d: neo-Inositol hexakisphosphate; and e: D-chiro-Inositol hexakisphosphate. CK0: initial soil; CK: non-fertilizer; NPK: NPK fertilizer; CNPK: biochar + NPK fertilizer; SNPK: corn stover + NPK fertilizer.
Based on 31P-NMR, the combination of biochar and chemical fertilizer application significantly increased the contents of total inorganic P and orthophosphate compared to the other treatments (Figure 6). This could be related to soil pH, organic matter, and total P. Furthermore, when compared to control soils, the use of chemical fertilizers significantly increased orthophosphate content. Our data showed that orthophosphate had a different trend than Olsen-P, which could be attributed to differences in soil properties. On the other hand, pyrophosphate exhibited the opposite trend as orthophosphate, with pyrophosphate in biochar soils being the lowest of all treatments. Pyrophosphate is produced by microbial activity in soils (52).
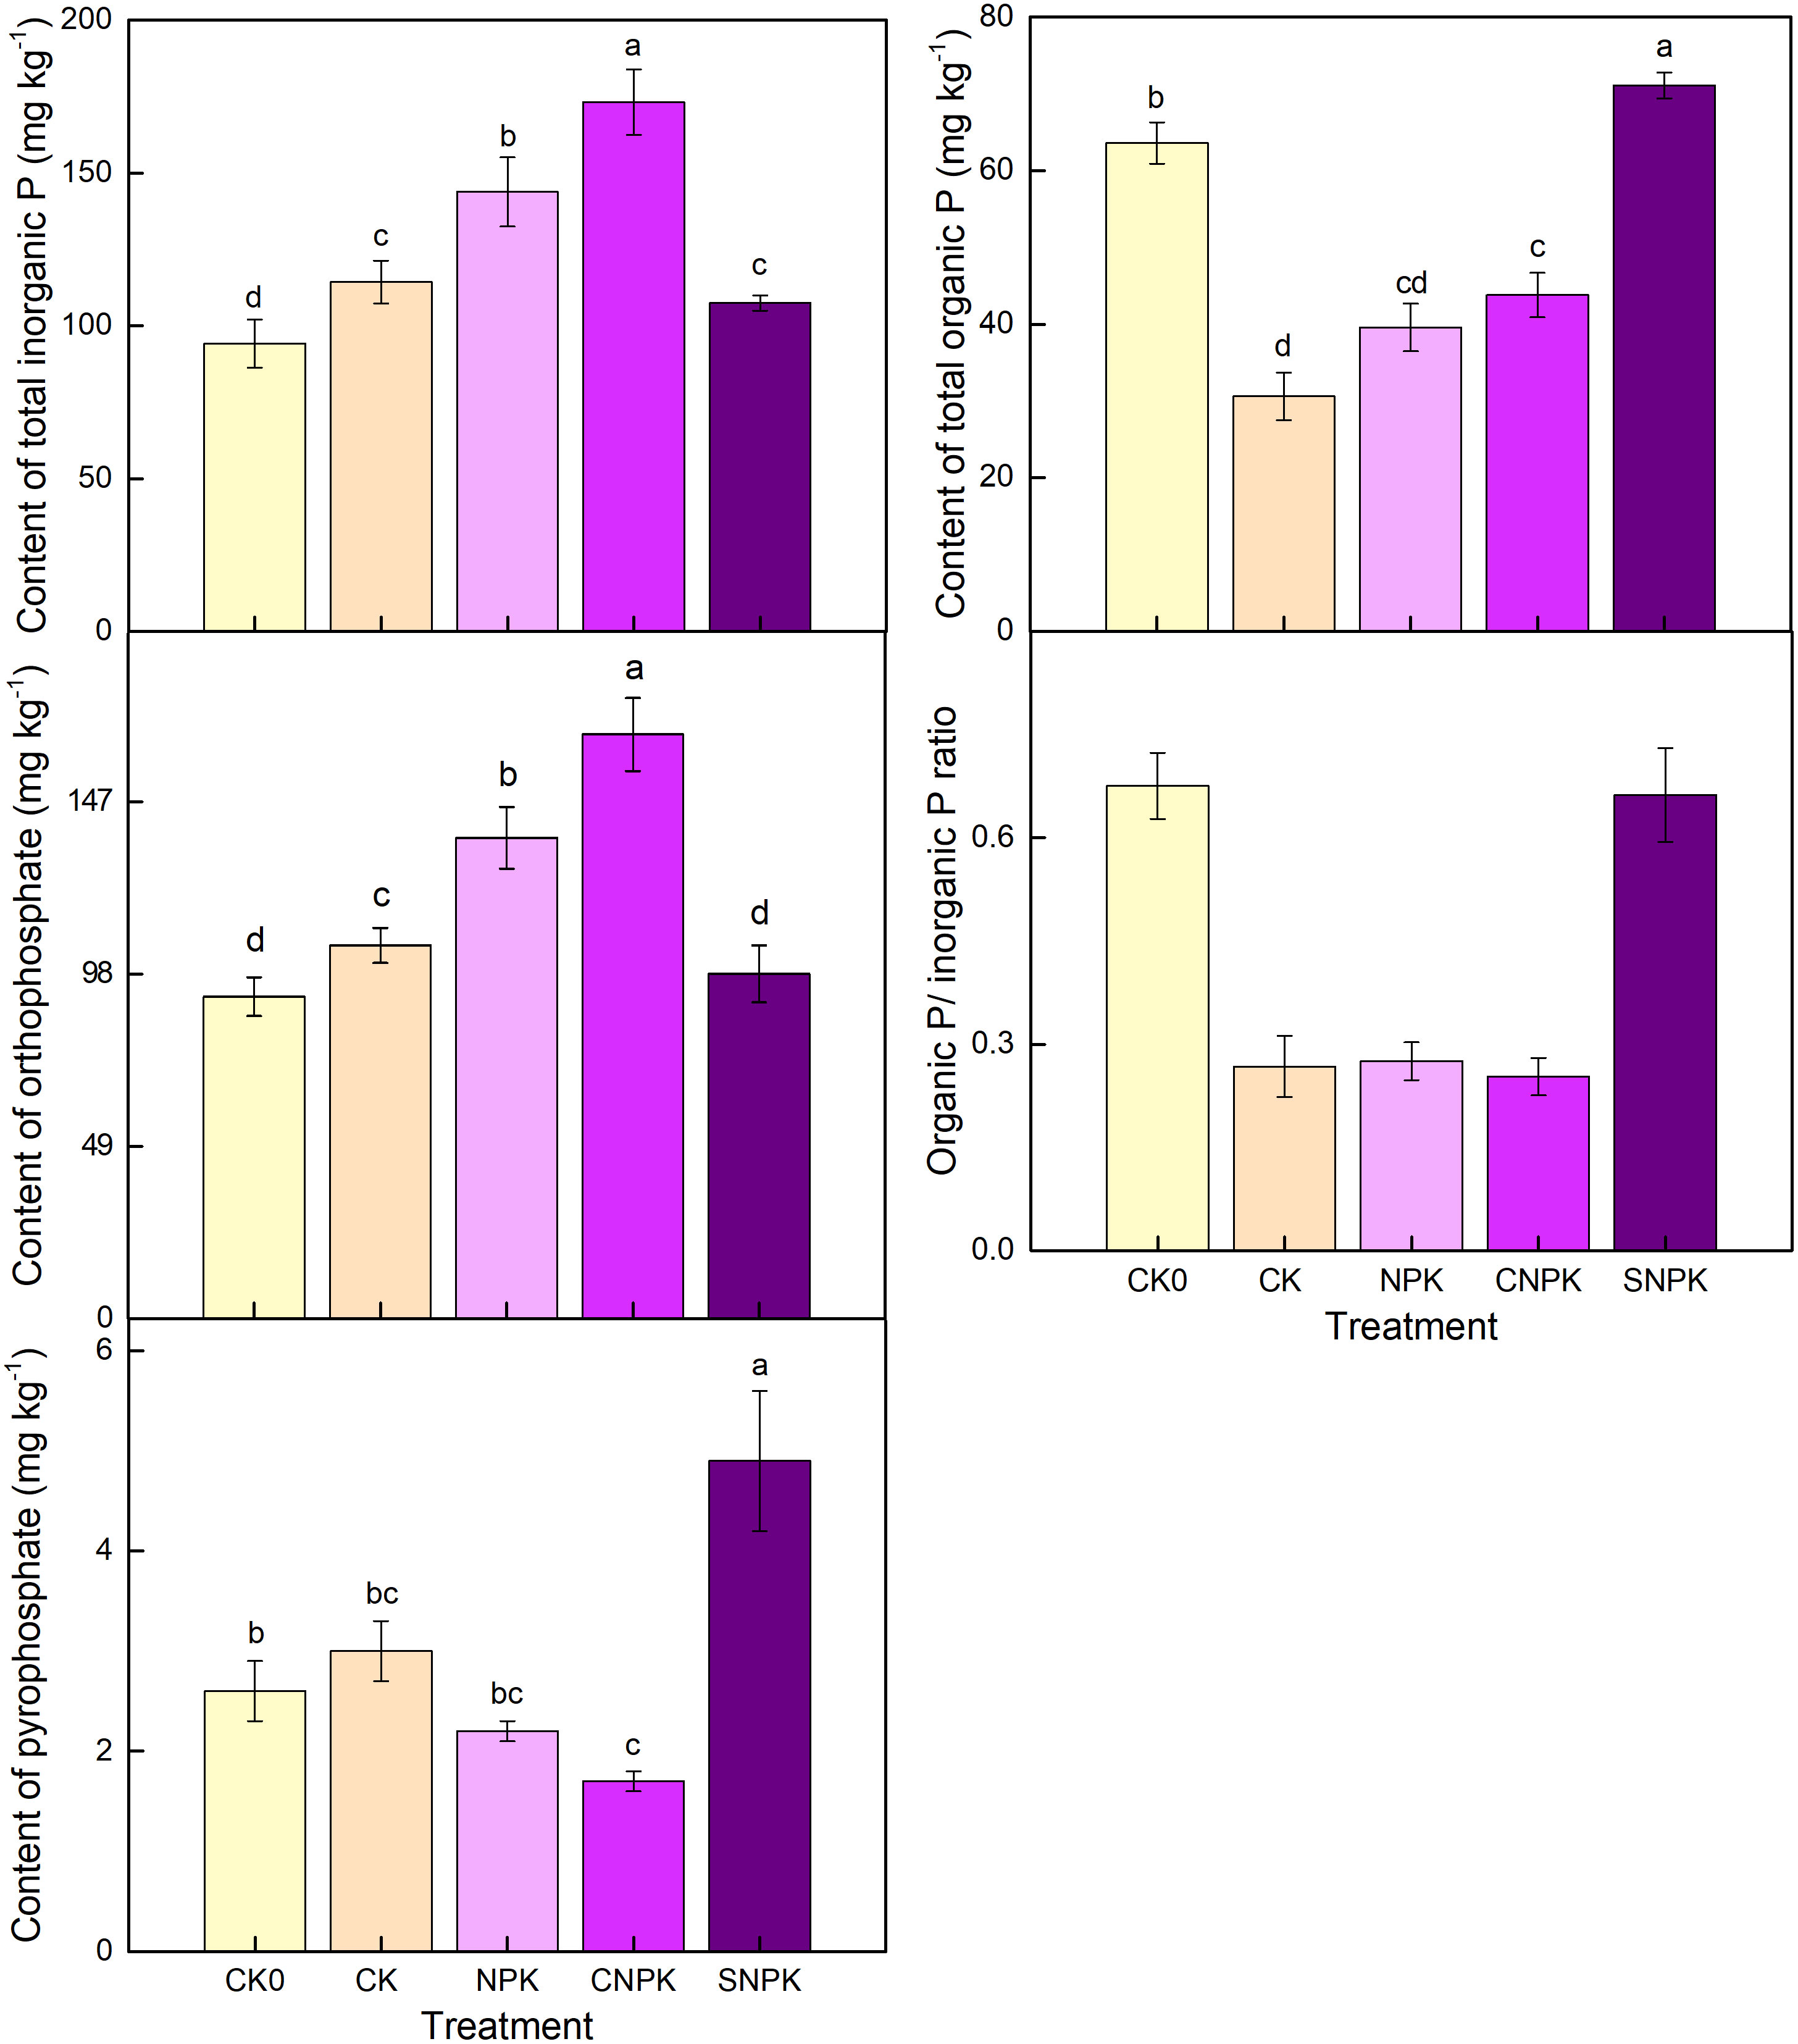
Figure 6 Effects of different treatments on total inorganic P, total organic P, orthophosphate, pyrophosphate, and organic P/inorganic P ratio by solution 31-phosphorus nuclear magnetic resonance spectra. Error bars represent standard deviation, n = 3. Different letters in a column indicate significant differences at the 0.05 level. CK0: initial soil; CK: non-fertilizer; NPK: NPK fertilizer; CNPK: biochar + NPK fertilizer; SNPK: corn stover + NPK fertilizer.
Total organic P based on 31P-NMR was higher in the SNPK and CNPK treatments than in the CK treatment (Figure 6), indicating that the use of a combination of corn stover (and its biochar) and chemical fertilizers improved soil P retention when compared to the CK and NPK treatments. This increase in orthophosphate diester and total IHP corresponds to an increase in the Po/Pi ratio in the combination of corn stover and chemical fertilizer soils (Figures 6, 7). Organic P levels were highest in soils containing a combination of corn stover and chemical fertilizers; this component of IHP may be derived from plants (53). This indicated that organic P in soils containing corn stover and chemical fertilizers was mostly composed of orthophosphate diester and IHP. The majority of organic P was orthophosphate monoester (after diester degradation correction, the monoesters and diesters were corrected by using -glycerophosphate and -glycerophosphate as the diesters, as shown below; Figure 7). Furthermore, orthophosphate monoester and total IHP followed a similar pattern, with orthophosphate monoester being highest in soils containing corn stover (and biochar) and chemical fertilizers and lowest in control soils. Organic P increases due to the application of chemical fertilizers, and corn stover (and its biochar) are primarily composed of P microbial products such as the easily mineralizable orthophosphate monoester form AMP, stable total IHP (24) and orthophosphate diester (34, 54). The combination of corn stover (and its biochar) and chemical fertilizers, as well as the porous structure of the combination of corn stover (and its biochar), provided a habitable environment for soil microorganisms, particularly biochar. After applying the combination of corn stover (and its biochar) and chemical fertilizers, the initial soil had the highest value of orthophosphate diester (after diester degradation correction), followed by the combination of corn stover (and its biochar) and chemical fertilizers. Similarly, the highest level of DNA was found in the initial soil, followed by the combination of corn stover (and its biochar) and chemical fertilizers soils, but not in the control soil. This is because high orthophosphate diester or DNA levels indicate high microbial biomass, whereas control soils had the lowest soil organic C levels (Figure 1).
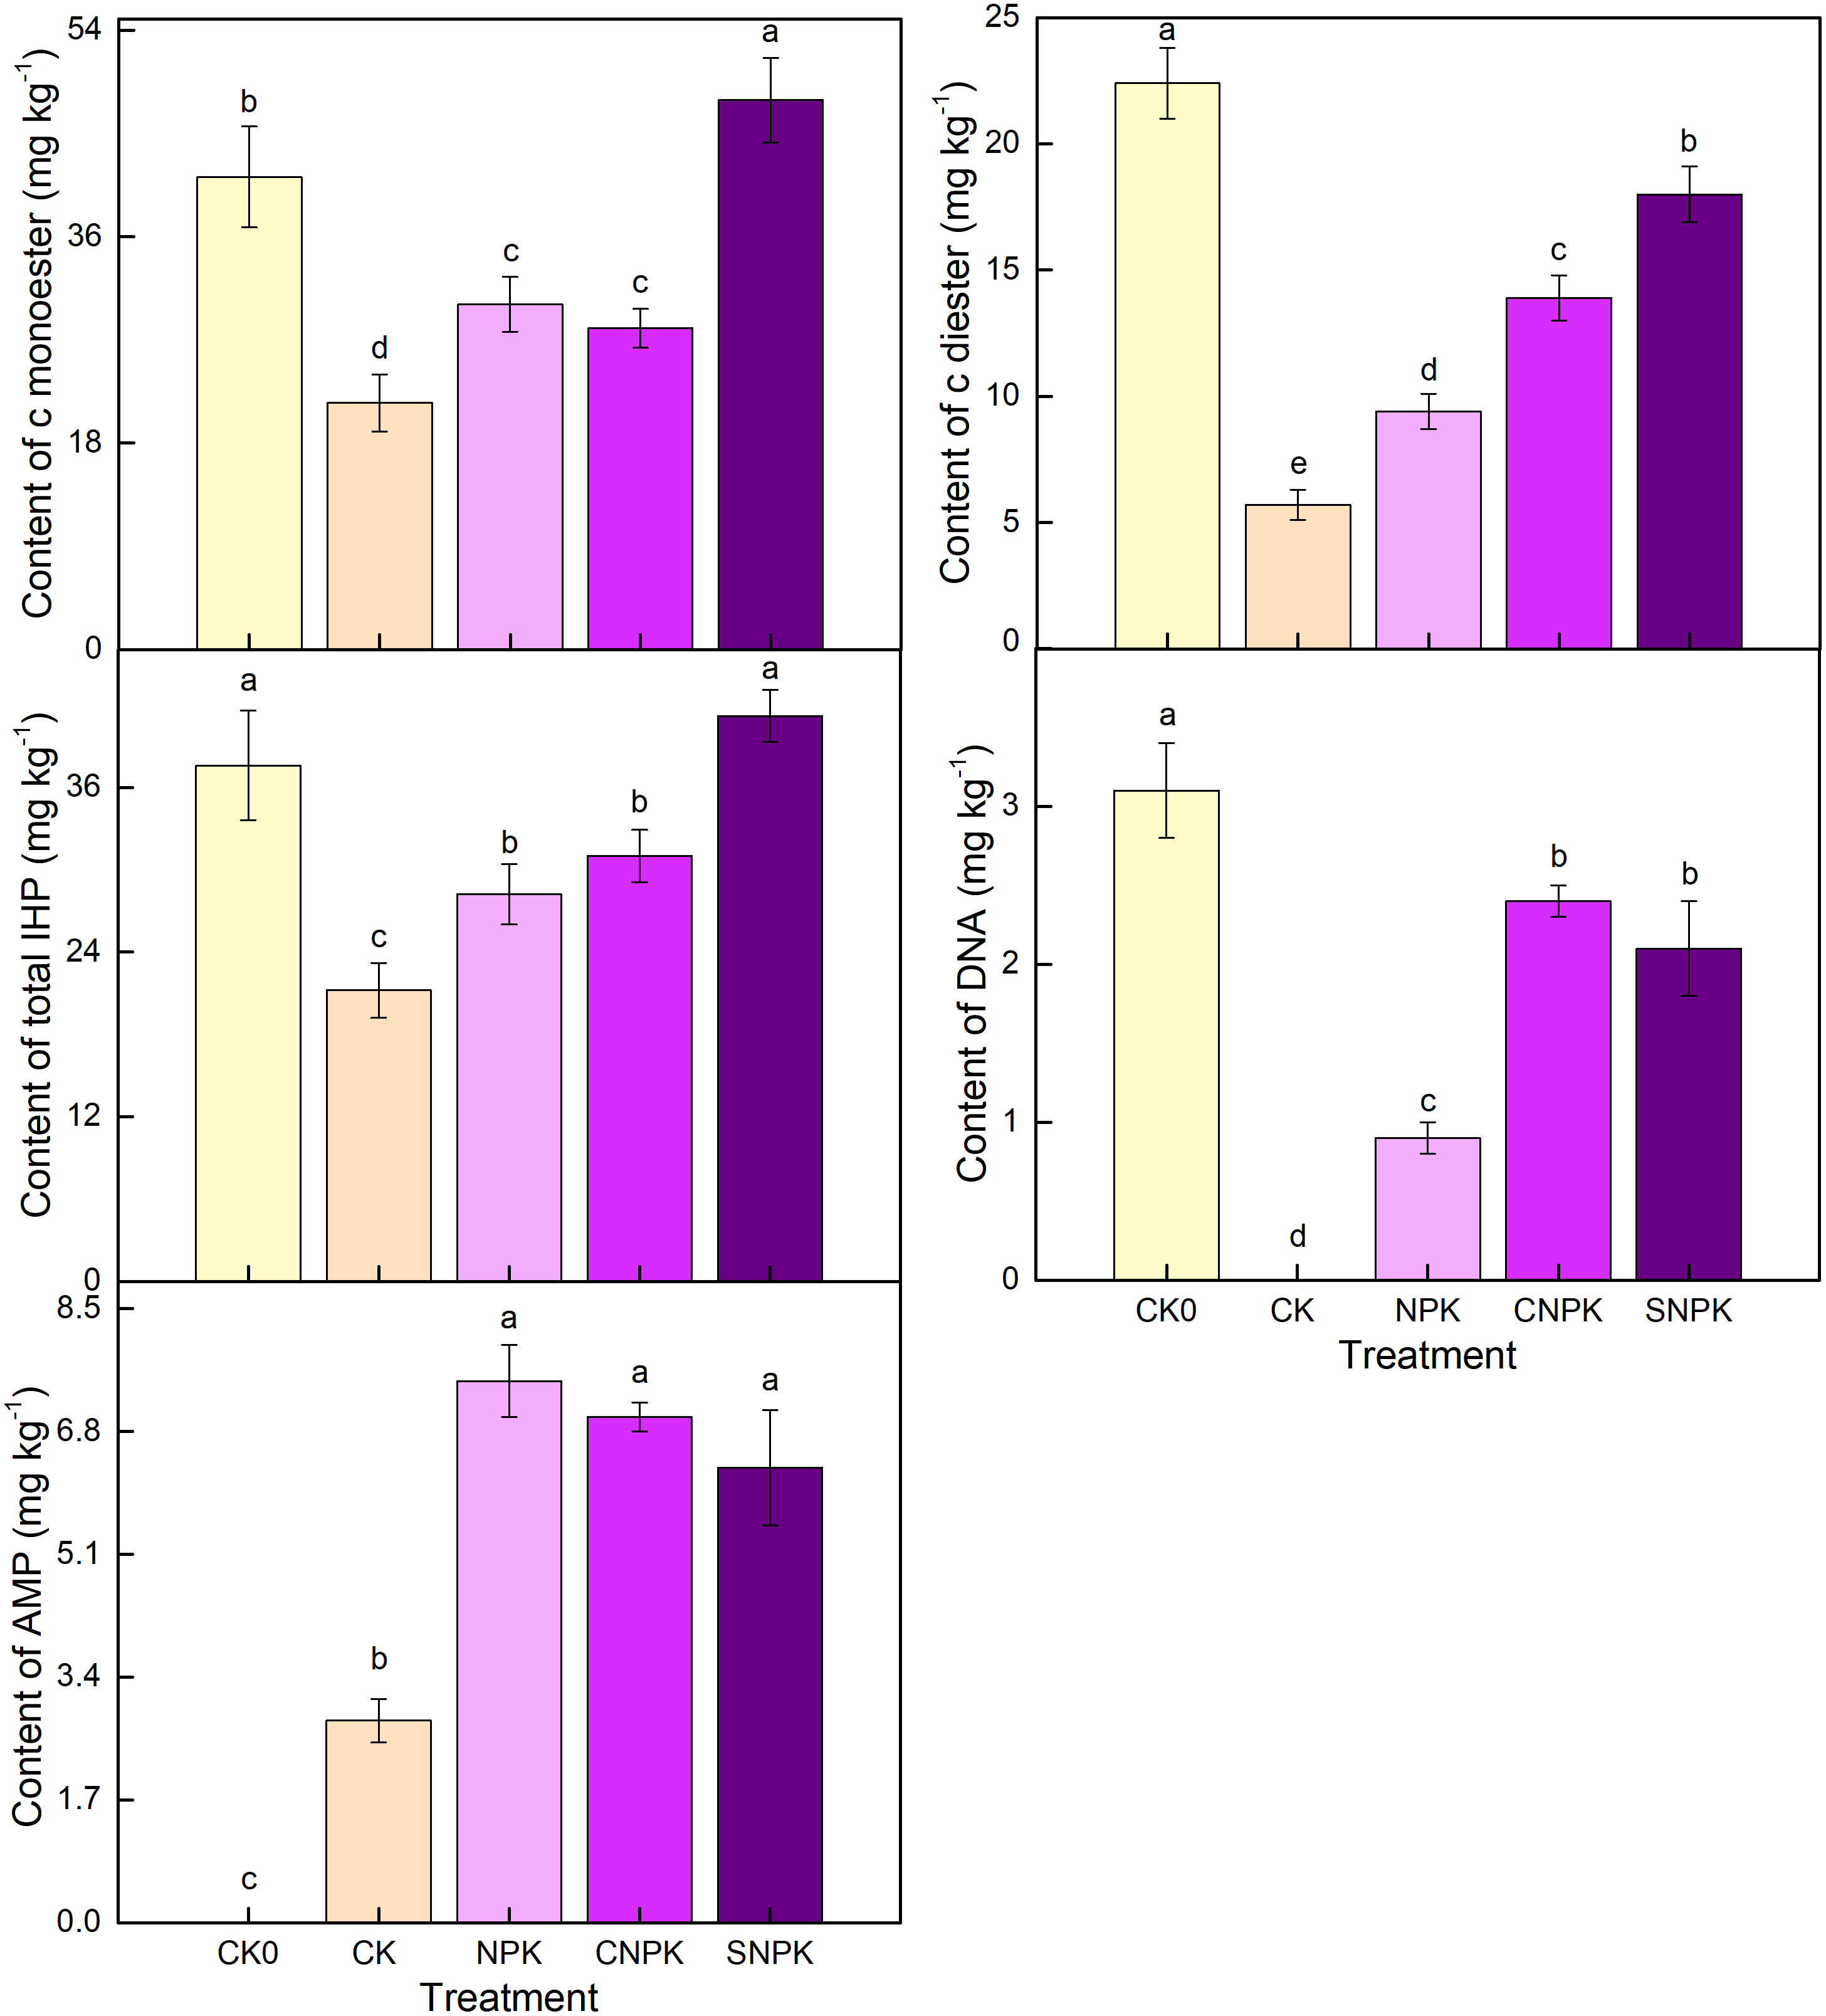
Figure 7 Effects of different treatments on c monoester, c diester, total inositol hexakisphosphate, adenosine monophosphate (AMP), and deoxyribonucleic acid (DNA) by solution 31-phosphorus nuclear magnetic resonance spectra. Error bars represent standard deviation, n = 3. Different letters in a column indicate significant differences at the 0.05 level. c: denotes the correction for degradation products. CK0: initial soil; CK: non-fertilizer; NPK: NPK fertilizer; CNPK: biochar + NPK fertilizer; SNPK: corn stover + NPK fertilizer.
Orthophosphate was the inorganic P fraction most positively correlated with Resin-P and P uptake by corn (P <0.05, Table 1). This could be due to the fact that orthophosphate and Resin-P were available P that plants could absorb in the soil (55, 56). The majority of the Hedley-P fractions (Resin-P, NaHCO3-Pi, NaHCO3-Po, NaOH-Po, and Residual-P) and corn P uptake were inversely related to pyrophosphate. Only AMP showed significantly positive correlations with NaHCO3-Pi, NaOH-Pi, and P uptake by corn in all organic P forms (P <0.01). Resin-P, NaHCO3-Pi, and NaOH-Pi were positively related to orthophosphate and AMP. In this study, P uptake by corn was found to be strongly related to AMP, NaHCO3-Pi, and NaOH-Pi. This result suggested that AMP, NaHCO3-Pi, and NaOH-Pi could be long-term P sources.
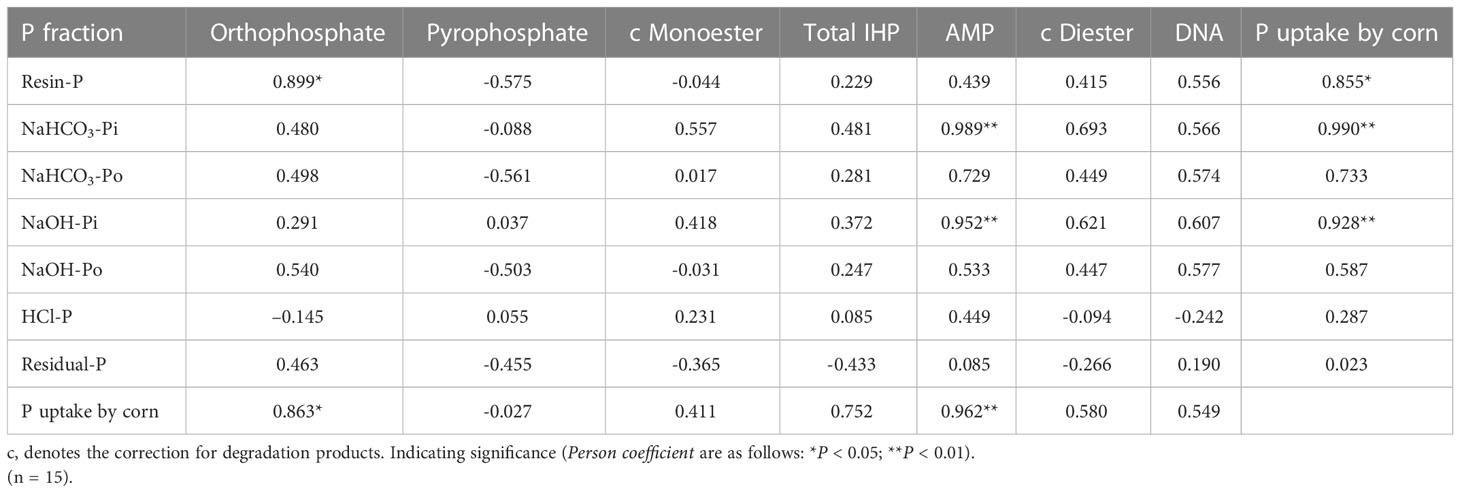
Table 1 Correlation coefficients among P forms, Hedley-P fractions, and P uptake by corn.
The application of corn stover (and its biochar) in combination with chemical fertilizers significantly increased soil pH, Olsen-P, alkaline hydrolysis N, organic C, P uptake, and yield. The application of corn stover in combination with chemical fertilizers increased the levels of total organic P-NMR, organic P/inorganic P ratio, pyrophosphate, orthophosphate monoester, IHP, orthophosphate diester, and DNA. Biochar application increased Hedley-P fractions, total inorganic P-NMR, orthophosphate, and DNA in the soil. Fertilization can increase AMP regardless of the fertilizer source (chemical fertilizer, corn stover, or biochar). The combination of corn stover (and its biochar) and chemical fertilizer application in soils resulted in increased AMP and IHP, as well as inorganic P, particularly in biochar. Orthophosphate was found to have a strong positive relationship with NaHCO3-Pi and NaOH-Pi, both of which showed significant positive correlations with P uptake by corn. In the long run, AMP, NaHCO3-Pi, and NaOH-Pi, which were potential P sources in soils, may be available to plants. Using biochar in combination with chemical fertilizers appears to be the most effective strategy for increasing P forms content, corn yield and P uptake.
The original contributions presented in the study are included in the article/Supplementary Material. Further inquiries can be directed to the corresponding authors.
XL, NL, and X-RH conceptualized this study. J-FY, Y-SX, and XW collected the soil and plant samples. XL collected and analyzed the NMR analyzed soil samples. All authors contributed to the article and approved the submitted version.
This work was supported by the Scientific Research Fund Project of Education Department of Liaoning Province (LJKMZ20220992), the National Natural Science Foundation of China (No. 31972511), the National Key Research and Development Program of China (No. 2017YFD0300700) and China Scholarship Council (CSC) under Grant (202008210403).
The authors declare that the research was conducted in the absence of any commercial or financial relationships that could be construed as a potential conflict of interest.
All claims expressed in this article are solely those of the authors and do not necessarily represent those of their affiliated organizations, or those of the publisher, the editors and the reviewers. Any product that may be evaluated in this article, or claim that may be made by its manufacturer, is not guaranteed or endorsed by the publisher.
The Supplementary Material for this article can be found online at: https://www.frontiersin.org/articles/10.3389/fsoil.2023.1010677/full#supplementary-material
1. George TS, Giles CD, Menezes-Blackburn D, Condron LM, Gama-Rodrigues AC, Jaisi D, et al. Organic phosphorus in the terrestrial environment: A perspective on the state of the art and future priorities. Plant Soil (2017) 427:191-208. doi: 10.1007/s11104–017–3391-x
2. Zicker T, Tucher SV, Kavka M, Eichler-Löbermann B. Soil test phosphorus as affected by phosphorus budgets in two long-term field experiments in Germany. Field Crop Res (2018) 218:158–70. doi: 10.1016/j.fcr.2018.01.008
3. Siddique MT, Robinson JS. Phosphorus sorption and availability in soils amended with animal manures and sewage sludge. J Environ Qual. (2003) 32:1114–21. doi: 10.2134/jeq2003.1114
4. Haygarth PM, Harrison A, Turner B. On the history and future of soil organic phosphorus research: a critique across three generations. Eur J Soil Sci (2018) 69:86–94. doi: 10.1111/ejss.12517
5. Slazak A, Freese D, da Silva Matos E, Hüttl RF. Soil organic phosphorus fraction in pine-oak forest stands in northeastern Germany. Geoderma (2010) 158:156–62. doi: 10.1016/j.geoderma.2010.04.023
6. Cade-Menun BJ, Liu CW. Solution phosphorus-31 nuclear magnetic resonance spectroscopy of soils from 2005 to 2013: A review of sample preparation and experimental parameters. Soil Sci Soc Am J (2014) 78:19–37. doi: 10.2136/sssaj2013.05.0187dgs
7. Hedley M, Stewart J. Method to measure microbial phosphate in soils. Soil Biol Biochem (1982) 14:377–85. doi: 10.1016/0038–0717(82)90009–8
8. Zamuner E, Picone L, Echeverria H. Organic and inorganic phosphorus in mollisol soil under different tillage practices. Soil Till. Res (2008) 99:131–8. doi: 10.1016/j.still.2007.12.006
9. IBI. Standardized product definition and product testing guidelines for biochar that is used in soil. international biochar initiative (2012) (International Biochar Initiative) 5:1. http://www.biochar-international.org/characterizationstandard
10. Chen WF, Zhang WM, Meng J. Advances and prospects in research of biochar utilization in agriculture. Scientia Agricultura Sin (2013) 46:3324–33. doi: 10.3864/j.issn.0578–1752.2013.16.003
11. Wang T, Tian Z, Tunlid A, Persson P. Nitrogen acquisition from mineral-associated proteins by an ectomycorrhizal fungus. New Phytol (2020) 228:697–711. doi: 10.1111/nph.16596
12. Liang F, Gui-Tong LI, Lin QM, Zhao XR, Resourcesenvironment, C. O, University, C. A. Crop yield and soil properties in the first 3 years after biochar application to a calcareous soil. J Integr Agr. (2014) 13:525–32. doi: 10.1016/S2095-3119(13)60708-X
13. Li X, Romanyà J, Li N, Xiang Y, Yang J, Han X. Biochar fertilization effects on soil bacterial community and soil phosphorus forms depends on the application rate. Sci Total Environ (2022) 13(843):157022. doi: 10.1016/j.scitotenv.2022.157022
14. Lin J, Meng J, He Y, Xu J, Chen Z, Brookes PC. The effects of different types of crop straw on the transformation of pentachlorophenol in flooded paddy soil. Environ pollut (2018) 233:745–54. doi: 10.1016/j.envpol.2017.10.114
15. Cao DY, Lan Y, Sun Q, Yang X, Chen WF, Meng J, et al. Maize stover and its biochar affect phosphorus distribution in soil aggregates and are beneficial for improving phosphorus availability along the soil profile. Eur J Soil Sci (2021) 72:2165–79. doi: 10.1111/ejss.13095
16. Lehmann J, da Silva JP, Steiner C, Nehls T, Zech W, Glaser B. Nutrient availability and leaching in an archaeological anthrosol and a ferralsol of the central Amazon basin: fertilizer, manure and charcoal amendments. Plant Soil (2003) 249:343–57. doi: 10.1023/A:1022833116184
17. Karami A, Homaee M, Afzalinia S, Ruhipour H, Basirat S. Organic resource management: impacts on soil aggregate stability and other soil physico-chemical properties. AGE. Ecosyst Environ (2012) 148:22–8. doi: 10.1016/j.agee.2011.10.021
18. Niu LA, Hao JM, Zhang BZ, Niu XS. Influences of long-term fertilizer and tillage management on soil fertility of the north China plain. Pedosphere (2011) 21:813–20. doi: 10.1016/S1002–0160(11)60185–9
19. Zhu Q, Zhu A, Zhang J, Zhang H, Yang S, Wang ,Y. Relation of agricultural soil fauna and soil fertility under conservation tillage systems. Transa. Chin So. Ag. Eng. (2010) 26:70–6. doi: 10.3969/j.issn.1002–6819.2010.02.013
20. Zheng BX, Ding K, Yang XR, Wadaan MA, Hozzein WN, Peñuelas J. Straw biochar increases the abundance of inorganic phosphate solubilizing bacterial community for better rape (Brassica napus) growth and phosphate uptake. Sci Total Environ (2019) 647:1113–20. doi: 10.1016/j.scitotenv.2018.07.454
21. Li F, Liang X, Zhang H, Tian G. The influence of no-till coupled with straw return on soil phosphorus speciation in a two-year rice-fallow practice. Soil Till. Res (2019) 195:104389. doi: 10.1016/j.still.2019.104389
22. Deiss L, de Moraes A, Dieckow J, Franzluebbers AJ, Gatiboni LC, lanzi Sassaki G. Soil phosphorus compounds in integrated crop-livestock systems of subtropical Brazil. Geoderma (2016) 274:88–96. doi: 10.1016/j.geoderma.2016.03.028
24. Li X, Wen QX, Zhang SY, Li N, Yang JF, Romanyà J, et al. Long-term changes in organic and inorganic phosphorus compounds as affected by long-term synthetic fertilisers and pig manure in arable soils. Plant Soil (2022) 472:239–55. doi: 10.1007/s11104–021–05225-z
25. Xiong Y, Xia H, Cai XA, Fu S. Impacts of litter and understory removal on soil properties in a subtropical acacia mangium plantation in China. Plant Soil (2008) 304:179–88. doi: 10.1007/s11104–007–9536–6
26. Olsen SR, Watanabe FS, Cosper HR, Larson W, Nelson L. Residual phosphorus availability in long-time rotations on calcareous soils. Soil Sci (1954) 78:141–52. doi: 10.1097/00010694–195408000–00008
27. Carson P. Recommended potassium test. In: Dahnke W, editor. Recommended chemical soil test procedures for the north central region, bulletin 499. Fargo: North Dakota Agricultural Experiment Station (1980). https://agris.fao.org/agris-search/search.do?recordID=US201302746748
28. Lu RK, Liu HX, Wen DZ, Qin SW, Zheng JY, Wang ZQ. Nutrient cycling and balance of agricultural ecosystem in different typical regions of china. II parameters of nutrient input to farm land. Chin. J. Soil Sci (1996) 27, 151–154. doi: CNKI:SUN:TRTB.0.1996-04-001
29. Tiessen H, Moir J. Characterization of available p by sequential extraction. soil sampling and methods of analysis. MR Carter. P, editor (1993), pp. 75–86. doi: 10.1201/9781420005271.ch25
30. Abdi D, Cade-Menun BJ, Ziadi N, Parent LÉ. Long-term impact of tillage practices and phosphorus fertilization on soil phosphorus forms as determined by 31P nuclear magnetic resonance spectroscopy. J Environ Qual. (2014) 43:1431–41. doi: 10.2134/jeq2013.10.0424
31. Li X, Wen QX, Zhang SY, Li N, Yang JF, Han X. Long-term rotation fertilisation has differential effects on soil phosphorus. Plant Soil Environ (2020) 66:543–51. doi: 10.17221/263/2020-PSE
32. Cade-Menun BJ, He Z, Zhang H, Endale DM, Schomberg HH, Liu CW. Stratification of phosphorus forms from long-term conservation tillage and poultry litter application. Soil Sci Soc Am J (2015) 79:504–16. doi: 10.2136/sssaj2014.08.0310
33. Vincent AG, Vestergren J, Grobner G, Persson P, Schleucher J, Giesler R. Soil organic phosphorus transformations in a boreal forest chronosequence. Plant Soil (2013) 367:149–62. doi: 10.1007/s11104-013-1731-z
34. Cade-Menun BJ. Improved peak identification in p-31-NMR spectra of environ-mental samples with a standardized method and peak library. Geoderma (2015) 257:102–14. doi: 10.1016/j.geoderma.2014.12.016
35. Gul S, Whalen JK, Thomas BW, Sachdeva V, Deng H. Physico-chemical properties and microbial responses in biochar-amended soils: mechanisms and future directions. Agric Ecosyst Environ (2015) 206:46–59. doi: 10.1016/j.agee.2015.03.015
36. Sigua GC, Novak JM, Watts DW, Johnson MG, Spokas K. Efficacies of designer biochars in improving biomass and nutrient uptake of winter wheat grown in a hard setting subsoil layer. Chemosphere (2016) 142:176–83. doi: 10.1016/j.chemosphere.2015.06.015
37. Hu YJ, Sun BH, Wu SF, Feng H, Gao MX, Zhang BB, et al. After-effects of straw and straw-derived biochar application on crop growth, yield, and soil properties in wheat (Triticum aestivum l.)-maize (Zea mays l.) rotations: A four-year field experiment. Sic. Total Environ (2021) 780:13. doi: 10.1016/j.scitotenv.2021.146560
38. Han LF, Sun K, Yang Y, Xia X, Li F, Yang Z, et al. Biochar’s stability and effect on the content, composition and turnover of soil organic carbon. Geoderma (2020) 364, 114184. doi: 10.1016/j.geoderma.2020.114184
39. Fiorentino N, Sánchez-Monedero MA, Lehmann J, Enders A, Fagnano M, Cayuela ML. Interactive priming of soil n transformations from combining biochar and urea inputs: a 15N isotope tracer study. Soil Biol Biochem (2019) 131:166–75. doi: 10.1016/j.soilbio
40. Lehman J, Rondom M. Biochar soil management on highly weathered soils in the humid tropics. In: Biological Approaches to Sustainable Soil Systems. (eds Upohff N, Ball AS, Palm C, Fernandes E, Pretty J, Herren H, et al). (2006) 517–30. doi: 10.1201/9781420017113.ch36
41. Kookana RS, Sarmah AK, Zwieten LV, Krull E, Singh B. Biochar application to soil: agronomic and environmental benefits and unintended consequences. Adv Agron (2011) 112:103–42. doi: 10.1016/B978–0–12–385538–1.00003–2
42. Jindo K, Martim SA, Navarro EC, Pérez-Alfocea F, Hernandez T, Garcia C, et al. Root growth promotion by humic acids from composted and non-composted urban organic wastes. Plant Soil (2014) 353:209–20. doi: 10.1007/s11104–011–1024–3
43. Avila-Segura M, Barak P, Hedtcke JL, Posner JL. Nutrient and alkalinity removal by corn grain, stover and cob harvest in upper Midwest USA. Biom. Bioen (2011) 35:1190–5. doi: 10.1016/j.biombioe.2010.12.010
44. Zhao XJ, Li ZH, Liu L, Cui TT. Effects of maize straw returning on soil phosphorus availibility and organic phosphorus forms under the mode of planting and returning. J Soil Water Cons. (2017) 31:243–7. doi: 10.13870/j.cnki.stbcxb.2017.01.040
45. Wang DZ, Guo XS. Effects of long-term fertilization on organic phosphorus fractions and availability in shajiang black soil. Soils (2009) 41:79–83. doi: 10.3321/j.issn:0253–9829.2009.01.014
46. Hua K, Zhang W, Guo Z, Wang D, Oenema O (2016). Evaluating crop response and environmental impact of the accumulation of phosphorus due to long-term manuring of vertisol soil in northern china. Agric. Ecosys. Environ. doi: 10.1016/j.agee.2015.12.008
47. Liang B, Lehmann J, Solomon D. Black carbon increases cation exchange capacity in soils. Soil Sci Soc Am J (2006) 70:1719–30. doi: 10.2136/sssaj2005.0383
48. Barrow NJ, Debnath A, Sen A. Measurement of the effects of pH on phosphate availability. Plant Soil (2020) 454:1–2. doi: 10.1007/s11104–020–04647–5
49. Atkinson CJ, Fitzgerald JD, Hipps NA. Potential mechanisms for achieving agricultural benefits from biochar application to temperate soils: a review. Plant Soil (2010) 337:1–18. doi: 10.1007/s11104–010–0464–5
50. Maranguit D, Guillaume T, Kuzyakov Y. Land-use change aff ects phosphorus fractions in highly weathered tropical soils. CATENA (2017) 149:385–93. doi: 10.1016/j.catena.2016.10.010
51. Giles C, Cade-Menun B, Hill J. The inositol phosphates in soils and manures: abundance, cycling, and measurement. Can J Soil Sci (2011) 91:397–416. doi: 10.4141/CJSS09090
52. Ghonsikar CP, Miller RH. Soil inorganic polyphosphates of microbial origin. Plant Soil (1973) 38:651–5. doi: 10.1007/BF00010703
53. Noack SR, McLaughlin MJ, Smernik RJ, McBeath TM, Armstrong RD. Phos- phorus speciation in mature wheat and canola plants as affected by phosphorus sup- ply. Plant Soil (2015) 378:125–37. doi: 10.1007/s11104-013-2015-3
54. Schneider KD, Cade-Menun BJ, Lynch DH, Voroney RP. Soil phosphorus formsfrom organic and conventional forage fields. Soil Sci Soc Am J (2016) 80:328–40. doi: 10.2136/SSSAJ2015.09.0340
55. Ahlgren J, Djodjic F, Borjesson G, Mattsson L. Identification and quantification of organic phosphorus forms in soils from fertility experiments. Soil Use Manage (2013) 29:24–35. doi: 10.1111/sum.12014
Keywords: biochar, P forms, P fractions, arable soil, 31P-NMR, stover
Citation: Li X, Li N, Yang J-F, Xiang Y-S, Wang X and Han X-R (2023) Changes in P forms and fractions due to the addition of stover and biochar to growing crops in soils amended with stover and its biochar. Front. Soil Sci. 3:1010677. doi: 10.3389/fsoil.2023.1010677
Received: 04 August 2022; Accepted: 16 January 2023;
Published: 02 February 2023.
Edited by:
Michaela Anna Dippold, University of Tübingen, GermanyReviewed by:
Yi Peng, China Agricultural University, ChinaCopyright © 2023 Li, Li, Yang, Xiang, Wang and Han. This is an open-access article distributed under the terms of the Creative Commons Attribution License (CC BY). The use, distribution or reproduction in other forums is permitted, provided the original author(s) and the copyright owner(s) are credited and that the original publication in this journal is cited, in accordance with accepted academic practice. No use, distribution or reproduction is permitted which does not comply with these terms.
*Correspondence: Na Li, bG54bGluYUAxNjMuY29t; Xiao-Ri Han, aGFueHJAc3lhdS5lZHUuY24=
Disclaimer: All claims expressed in this article are solely those of the authors and do not necessarily represent those of their affiliated organizations, or those of the publisher, the editors and the reviewers. Any product that may be evaluated in this article or claim that may be made by its manufacturer is not guaranteed or endorsed by the publisher.
Research integrity at Frontiers
Learn more about the work of our research integrity team to safeguard the quality of each article we publish.