- 1Oak Ridge Institute for Science and Education, Oak Ridge, TN, United States
- 2Crop Production System Research Unit, United States Department of Agriculture-Agricultural Research Service (USDA-ARS), Stoneville, MS, United States
- 3Sustainable Water Management Research Unit, United States Department of Agriculture-Agricultural Research Service (USDA-ARS), Stoneville, MS, United States
Planting winter cover crops (CC) in soybean cropping systems is expected to offer various environmental benefits including soil health and fertility besides enhanced cash crop productivity. In a three-year study (2018–2021) conducted on a Dundee silt loam, we assessed the impact of introducing rye (Secale cereale L.) CC during the winter fallow period on soil organic carbon (SOC), soil organic matter (SOM), soil total nitrogen (STN), bulk density (BD), saturated hydraulic conductivity (Kfs), soil penetration resistance (SPR), and water-stable aggregates (WSA). Three treatments evaluated were: i) no cover crop (NC), ii) winter rye as CC rolled when green and desiccated after soybean planting (GR), and iii) winter rye CC desiccated and rolled before planting soybean (BR) in a randomized complete block design with six replications. The depth of the soil sampling in 2019 was 0-15 and 15-30 cm while 0-10, 10-20 and 20-30 cm depth soil sampling was done in 2020 and 2021. Effects of BR and GR on soybean root growth characteristics (number of roots, root length and root angle) were measured using a CID 600 root scanner. The results showed that CC (both BR and GR) improved SOC by 7 to 12.5%, soil organic matter by 9 to 15%, STN by 13 to 29%, WSA by 26 to 68%, Kfs by 5 to 9% and reduced BD by 8% and SPR by 14 to 18% compared to NC (P<0.05). However, there were no differences between BR and GR treatments. Root characteristics of soybean in the NC, BR and GR treatments were similar. Rye CC fits into the existing soybean production system in the Lower Mississippi Delta with a potential to augment soil-physico chemical properties, thus offering agro-ecosystem services which may not necessarily lead to an impact on soybean root growth traits.
Introduction
In Mississippi, USA, soybean is the most widely grown crop. The adoption of winter CC in the region is low leaving the soil exposed to erosive heavy rains in the winter and spring seasons, which leads to heavy nutrient loss by surface runoff and deep drainage beyond crop root zones. Most of the growers are of the opinion that the winter CC can interfere with farm operations and result in delayed planting of summer cash crop, particularly corn, as it is generally being planted early in the season (from mid-March), when the over-winter CC is fast gaining biomass growth. The additional input costs, and lack of attractive and measurable short-term economic benefits of growing CC could also be the reasons for their non-adoption (1, 2).
Growing cover crops (CC) on fallow soil during the winter season before summer cash crops are planted was recommended to avail enhanced environmental benefits such as improved weed control, reduced soil erosion, reduced nitrate and phosphorus leaching, enhanced nutrient scavenging, improved soil health, and promoting habitat for beneficial insects (3–6). Cover crop biomass incorporation into the soil demonstrated the build-up of soil organic matter (SOM) and soil organic carbon (SOC) (5, 7–9). However, other researchers have documented no such benefits with CC in cropping systems (10–12). A three-year study on Goldsboro fine sandy loam soil on the North Carolina coast with wheat (Triticum aestivum L.)and hairy vetch (Vicia villosa Roth.) as CC in no-till corn revealed no influence on soil parameters such as bulk density, soil porosity, and hydraulic conductivity (12). In enhancing the sustainability of production agriculture, no-till or reduced tillage along with CC cultivation was expected to potentially reduce labor costs, lower external inputs, and enhance soil quality (13). A quantitative research synthesis establishing the relationship between CC and the soil microbiome revealed that CC increased soil microbial diversity, abundance, and activity but is dependent on CC termination timing, edaphic factors, and climate (14).
Generally, the ecological benefits of CC can be achieved when grown for long enough periods in the winter to accumulate higher biomass resulting in the accumulation of large amounts of residues on the soil surface before the summer cash crop is planted. However, in water-scarce regions (arid to semiarid), the CC can compete for nutrients and water with subsequent cash crops and reduce cash crop yield (15). In case of the U.S. Midwest, the impacts of CC on the productivity of the maize-soybean [Zea mays L. - Glycine max (L.) Merr.] rotation system still have large uncertainties as results obtained from field experiments, specifically across different soils, climate conditions, and land management practices, appear contradictory (5). It has been demonstrated that CC like ryegrass (Lolium), rye (Secale cereale L.) and oats (Avena sativa) possessing fibrous root systems have a high potential to control soil erosion, while CC with thick roots such as white mustard and fodder radish were less effective (16). Rachman et al. (2003) reported a 23 to 40% increase in aggregate stability in a Mexico silt loam soil (fine, smectitic, mesic, Aeric Vertic Epiaqualfs) when continuous maize rotations were modified to include a winter CC in the historic 100-yr rotation study on the Sanborn Field at the University of Missouri. While, in a vegetable crop rotation on silt loam soil (Argixerolls), Mendes et al. (17) found no significant difference in aggregate-size distribution with CC. However, long-term incorporation of vetch under no-till condition in Lexington silt loam, significantly improved the field-saturated hydraulic conductivity and increased the mean weight diameter of aggregates as well as wet aggregate stability by 13% at 0-15 cm depth (18). Saturated hydraulic conductivity (Kfs) is a soil physical property which affects water movement in the soil, drainage and runoff, and movement of solutes in soils (19). The reports on the effect of CC on Kfs are inconsistent: a long term study on Mexico silt loam soil showed no impact (20), but on Waldron silt loam soil the parameter was enhanced by 48.5% (21).
Cereal rye (Secale cereale L.), is the most winter-hardy of all the small grains (22). It is the most widely-used cover crop due to its potential for high biomass accumulation, ease of establishment and suppression of winter weeds. An 8-year study in southwest Michigan examined winter rye-corn rotation and found it had minimal impact on soil C but was an effective N management tool with no corn yield penalty (23). Prior works on CC research in Mississippi reported beneficial effects such as weed suppression and increased microbial population and enzyme activities associated with nutrient cycling (24, 25). However, the information on the effects of rye residues on soil organic matter, total nitrogen, pH and other soil physical health parameters like bulk density, compaction (penetration resistance) and aggregate stability is lacking. Although many studies focused on cover crop root architecture, CC impact on cash crop root characteristics is scarce (26, 27). Availability of such information can supplement the available information of CC impacts on soil health properties for recommending management practices for sustainable agricultural production. Hence, a three-year field trial was conducted to evaluate winter cereal rye CC residue effects on soil physico-chemical parameters (SOC, SOM, soil total nitrogen (STN), bulk density (BD), Kfs, soil penetration resistance (SPR), water-stable aggregates (WSA) in a soybean crop production system, in the Mississippi Delta (MD). Further we hypothesized if planting soybean after or before rolling the rye CC and desiccation will have any effect on soil physico-chemical properties, saturated hydraulic conductivity and soybean root density against no CC in the humid climate of the MD. One system utilizes soybeans planted into a rolled, fall-seeded rye cover crop, which is later desiccated after soybean emergence (GR), while the second system involves rolling and desiccation of rye crop followed by soybean planting (BR). The GR system is expected to offer a thick mat of CC residue for a longer period of time which may probably help to conserve soil moisture and suppress weeds growth for a longer time than the BR system (authors observation in growers fields).
Materials and methods
Study location and experimental design
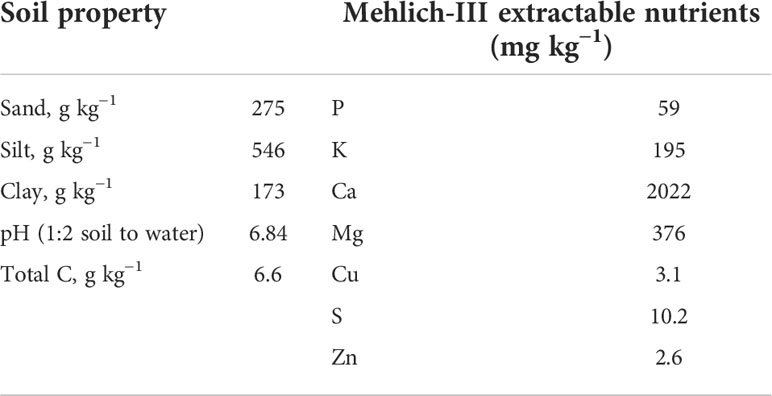
A three-year field study was conducted from winter 2018 to fall 2021 in a Dundee silt loam (fine silty, mixed, active, thermic Aeric Ochraqualf) soil managed under no-tillage, at the USDA-ARS, Crop Production Systems Research Unit’s farm located in Stoneville, Mississippi, USA (33° 42′ N, 90° 55′ W). The soil (top 30 cm) in the experimental field was sampled and characterized (Table 1). The experiment was conducted in a randomized complete block design with six replications. The three treatments were: i) no cover crop (NC), ii) rye rolled green and desiccated after soybean planting (RG), and iii) rye desiccated initially and rolled before soybean planting (BR). Each plot was 24.4 m long and 16.3 m wide (16 rows for soybean and 86 rows for rye).
Trial management
Rye cover crop was planted on October 17, 2018, November 06, 2019 and October 27, 2020 with a seed rate of 112 kg ha-1 using a John Deere 750 seed drill at 2 cm depth in rows spaced 19 cm apart. The herbicide paraquat dichloride (1,1’-dimethyl-4,4’- bipyridinium dichloride) at 1.12 kg ai ha–1 was applied using a tractor-mounted sprayer on NC and BR plots one week before soybean planting while the green rolled rye (GR) plots were applied on the day of soybean planting. Soybean seeds were planted using a Almaco cone plot planter (Allen Machine Company, Nevada, IA) to achieve overall plant population density of approximately 336,000 plants ha-1. Plots were maintained weed-free using both postemergence herbicide programs and mechanical removal of escaped weeds with hoeing later in the crop season (28). Soybean was planted on May 8, 2019, May 11, 2020, and May 14, 2021. AquaSpy soil moisture probes having 12 sensors spaced at 10 cm intervals across 120 cm in length for monitoring soil water content (AquaSpy Inc, San Diego, CA) were installed in representative plots at 120 cm depth. The probes were set up to record their sensor readings every 15 min. The CC (GR and BR) and NC plots 30 days after soybean emergence are shown in Figure 1. Irrigations were scheduled based on a soil matrix potential of about -90 kPa at 45 cm soil depths, according to Plumblee et al. (29). The irrigation water applied in each plot was measured using a flow meter. In 2019, a total of 53 mm of irrigation was applied on August 1 and August 21, 60 mm in two irrigations on July 21, and August 11 in 2020, and 59 mm of water in two irrigations on July 14, and August 17 in 2021. Irrigation was stopped at R6 growth stage (pod development) in all the years (28). Weather data were collected from the Stoneville Automatic Weather Monitoring station (latitude:33.43, longitude: -90.91), Delta Research and Extension Center, Stoneville, Mississippi, located within a kilometer from the experimental plots. The grain yields were determined by harvesting the center six rows of each plot with a Massey 8XP 2 row plot combine with Harvest Master weighing system and grain moisture analyzer on September 26, October 2 and September 27 in 2019, 2020 and 2021, respectively, and adjusted for moisture content at 13%. The growing degree days (GDD) were calculated using a base temperature (T base) of 10 °C, as detailed in (30).

Figure 1 Soybean established in three treatments at 30 days after planting: (A) no cover crop, (B) cover crop burndown and rolled, and (A) cover crop rolled green and burndown.
Soil sampling
A hydraulic Giddings machine (Giddings Machine Company, Windsor, CO) with a 50 mm diameter soil probe was used for soil sampling to a depth of 30 cm in increments of 10 cm to determine if C stratification and redistribution occurred in CC treatment under no-till soil management in 2020 and 2021 at four random locations in the plot avoiding ends and peripheral rows. However, samples from only two depths 0-15 and 15-30 cm were collected in 2019 and rest of the years three sampling depths of 0-10, 10-20 and 20-30 cm were used to extract more information. Bulk density was determined as oven dried soil weight per unit volume as described by Miller and Donahue (31).
Soil analyses
Soil nutrients were extracted and analyzed using a Spectroblue ICP spectrophotometer (SPECTRO Analytical Instruments GmbH & Co. KG, Germany) as documented in Soil test methods from the southeastern United States (32). Soil total N and organic C tests were run on air-dried pulverized soil with a mortar and pestle to a fine powder, following the dry combustion method with a Vario MAX cube high temperature combustion (HTC) analyzer (Elementar Americas, Inc., Mt. Laurel, NJ, USA) in Mississippi State University’s soil testing service lab, Starkville, MS. Organic matter was estimated by multiplying organic C by 1.78 conversion factor (33). Soil pH was measured using a pH meter in a soil/water ratio of 1:2 after shaking for 15 minutes (34).
Wet sieving apparatus made by Eijkelkamp Equipment Company was used to measure wet stable aggregates for the 0-10, 10-20 and 20-30 cm depths as per the protocol described by Feng et al. (35). Briefly, air dried soil for each treatment and every depth was gently crushed and sieved through a 2 mm sieve to determine water stable aggregates >0.25 mm. Four grams of soil put in 0.25 mm cups were raised and lowered in distilled water in metal cans for 3 min at 36 strokes per minute collecting water unstable aggregates in the process. The metal cans were switched with a set filled with 2 g L-1 NaOH dispersing solution, which collected water stable aggregates. The collected soil was oven dried at 105 °C for 24 hours. The water stable aggregate fraction (WSAF) was computed as shown below.
Where WSAF, is water stable aggregate fraction. WSA, water stable aggregates and WUA, water unstable aggregates.
Soil compaction and saturated hydraulic conductivity
Soil compaction (penetration resistance) was measured using a Field Scout SC900 digital soil compaction meter (Spectrum Technologies, Inc., Plainfield, IL). Five penetration resistance readings from the surface to a depth of 30 cm every 2.5 cm were taken from each plot when soil moisture was near field capacity in fall 2020 and 2021. Associated soil samples to 30 cm depth were grabbed in each plot for gravimetric soil moisture content determination. Five readings for each depth where averaged and reported as penetration resistance for the depth level. The field saturated hydraulic conductivity was measured using a dual-head automated single-ring Saturo infiltrometer (METER Group, Inc. Pullman, WA, USA) using a 5 cm low and 20 cm high-pressure head, 20 min of soak time and two cycles of 20 min time for each pressure head with an insertion depth of 10 cm measured at three random spots in each plot and mean data was used for analysis.
Root imaging
The CI-600 minirhizotron system with transparent 105 cm long acrylic root access tubes (inner diameter of 65 mm) and a 360-degree rotating root imaging unit (CID Bio-Science, Camas, WA) was used for root imaging. The acrylic tubes were installed in circular holes dug using an auger at an angle of 45° off the vertical axis in each plot to minimize soil compaction at tube soil line and to create maximum soil to tube contact seven days after soybean planting. The end to be inserted into the ground was sealed with liquid tape to prevent water infiltration into the tube. The CI-600 in situ root imager was inserted down the tubes to capture color images of live roots in contact with the tubes under the soil at three depth ranges (0-20, 20-40 and 40-60 cm) at 600 dpi resolution. The rhizotrons were imaged at sixth leaf (V6) and beginning seed (R5) soybean growth stages. After visual observations of images for quality, they were analyzed quantitatively using “Root- Snap” version 1.3.2.25 software (CID Bio-Science, Camas, WA) to generate root count, root length, average root diameter and root angle and subjected to statistical analyses for treatment effects.
Statistical analysis
The analysis of variance (ANOVA) for soil parameters and root growth components were performed using JMP Pro v. 15.1.0 software (SAS Institute, Cary, NC) following the PROC MIXED model. Year, CC treatments, soil depth and interactions were considered fixed effects, and replicates within a year were considered as random effects. Fisher’s Protected LSD test was used for mean comparisons at P≤ 0.05.
Results and discussion
Weather
Considerable differences in weather during the three cropping seasons in 2019-2021 were noticed (Figures 2–4). The precipitation during the vegetative phase (May-June) was 417, 163 and 189 mm while during the reproductive phase (July-September) was 196, 240, and 314 mm in 2019, 2020 and 2021 respectively. The precipitation pattern appears to be skewed in 2019 and 2020 compared to 2021 season (Figure 2). The average temperatures were 27.78, 27.47 and 26.94°C in 2019, 2020, and 2021 respectively (Figure 3). The mean solar radiation during reproductive phase were 21.74, 21.14 and 20.75 MJ m-2 day-1 (Figure 4). The computed GDD during reproductive growth and pod development periods were 1173, 1219 and 1258 degree days in 2019, 2020 and 2021, respectively (Figure 4). The weather parameters impacted the CC and soybean growth.
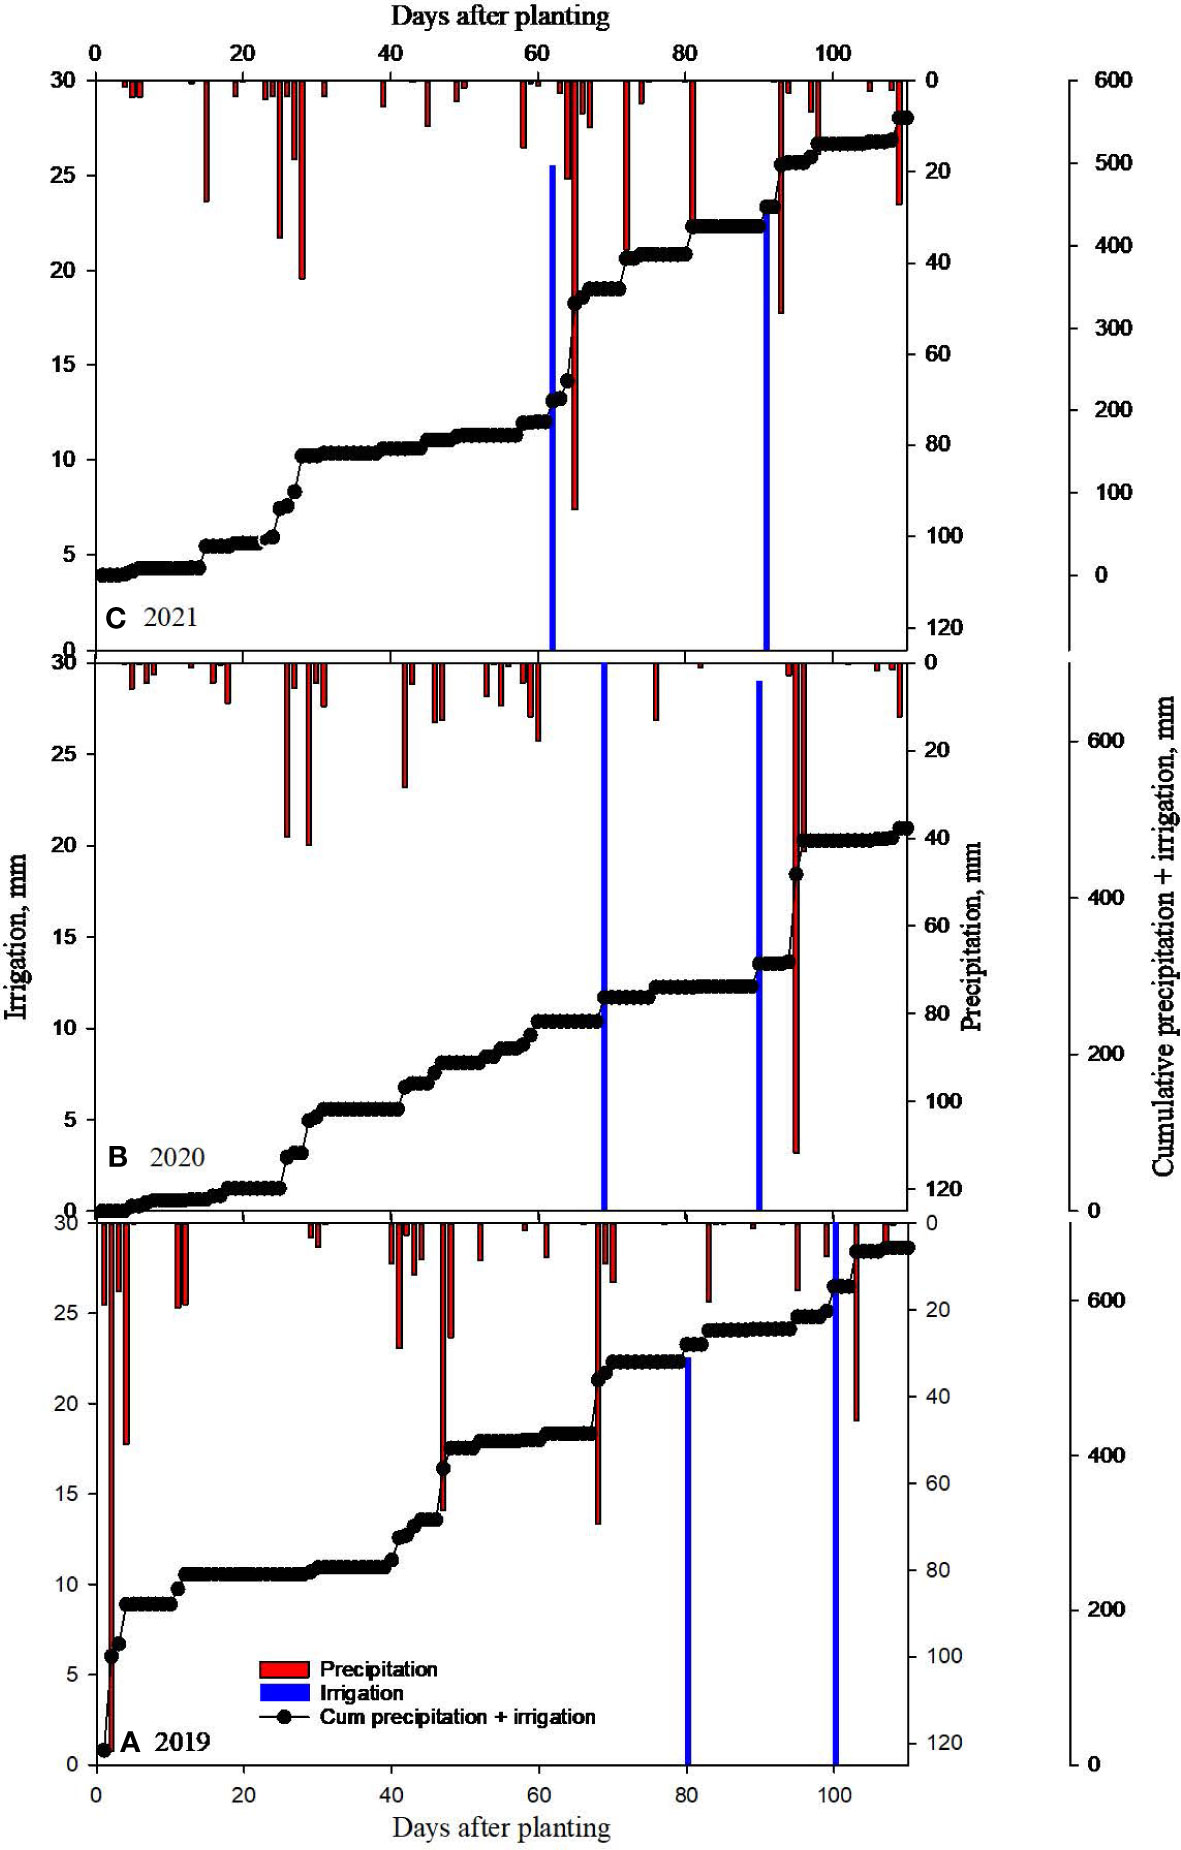
Figure 2 Measured daily precipitation, irrigation and cumulative precipitation + irrigation for (A) 2019, (B) 2020 and (C) 2021 soybean growing seasons at Stoneville, MS, USA.
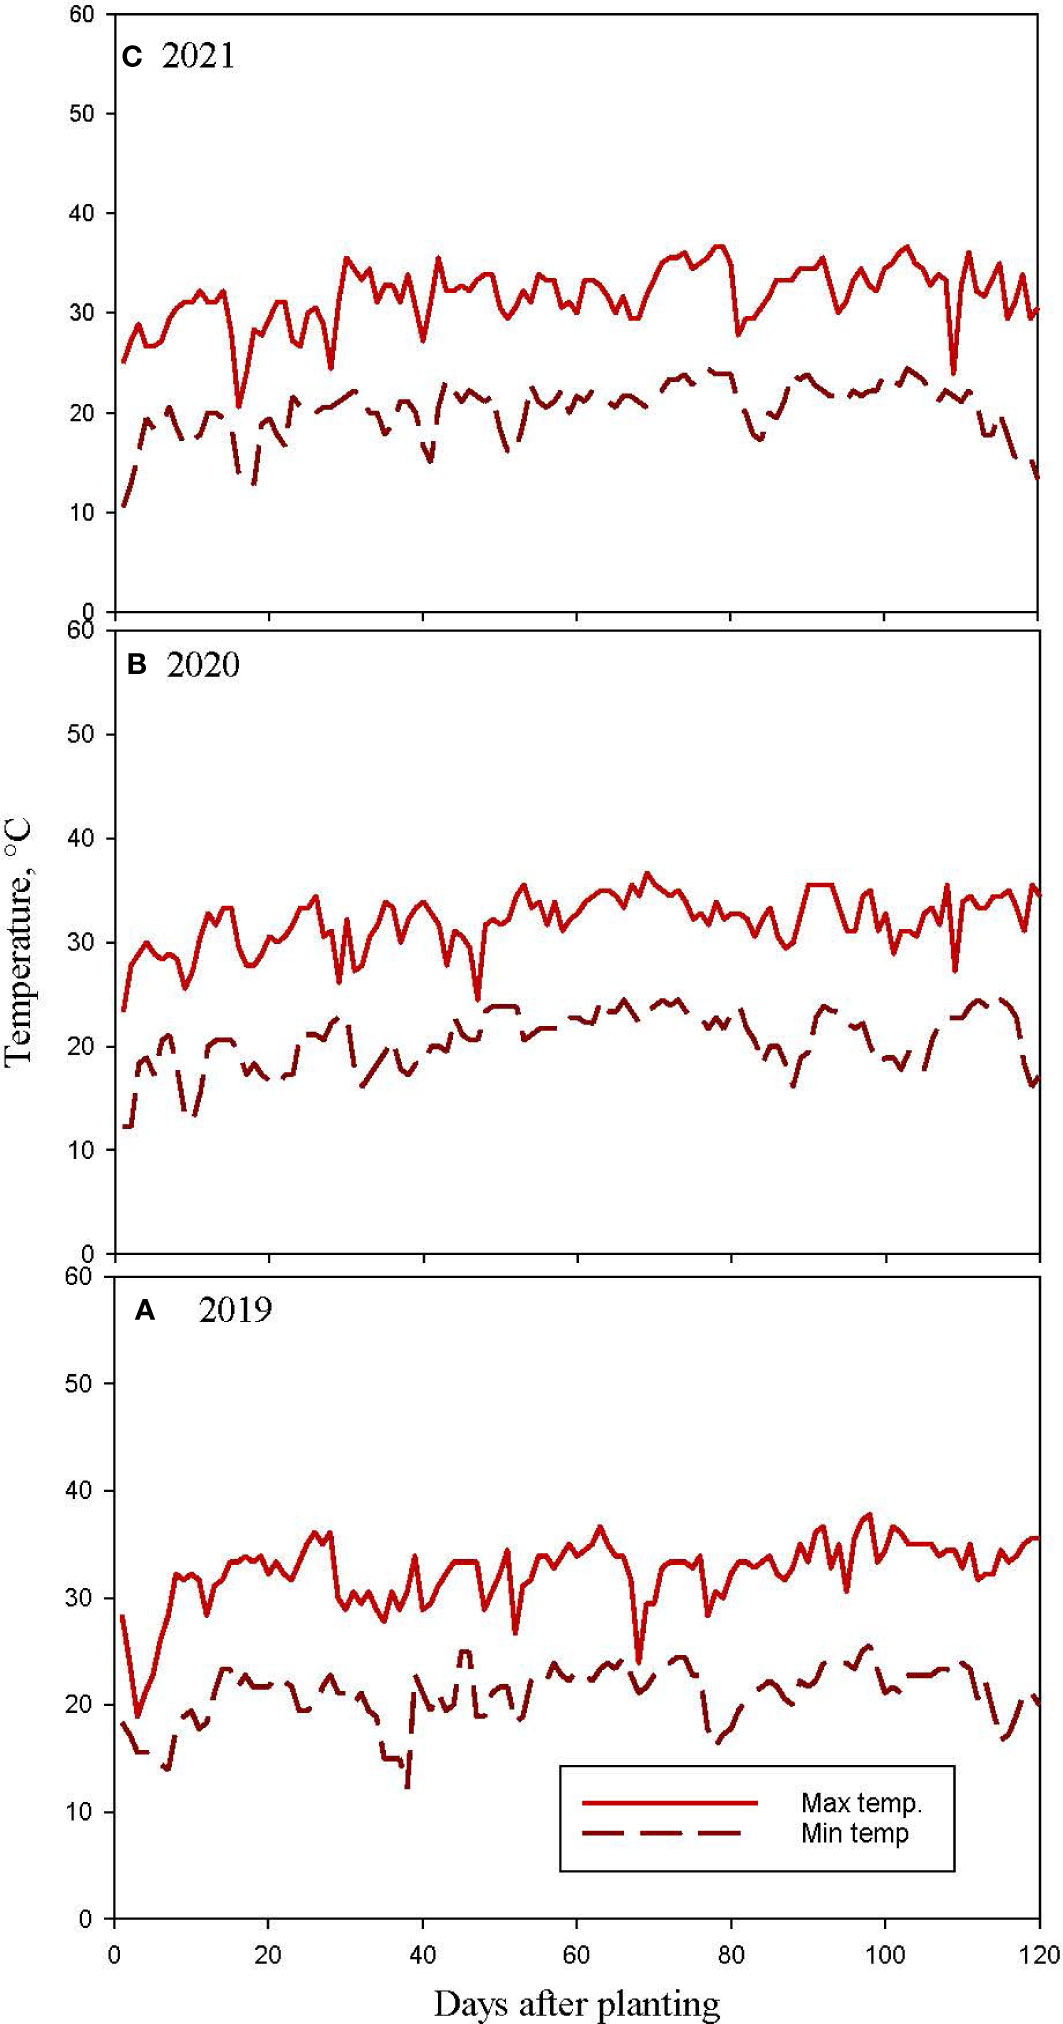
Figure 3 Measured daily solar maximum (Max) and minimum (Min) air temperatures (temp.) in (A) 2019, (B) 2020 and (C) 2021 soybean growing seasons at Stoneville, MS, USA.
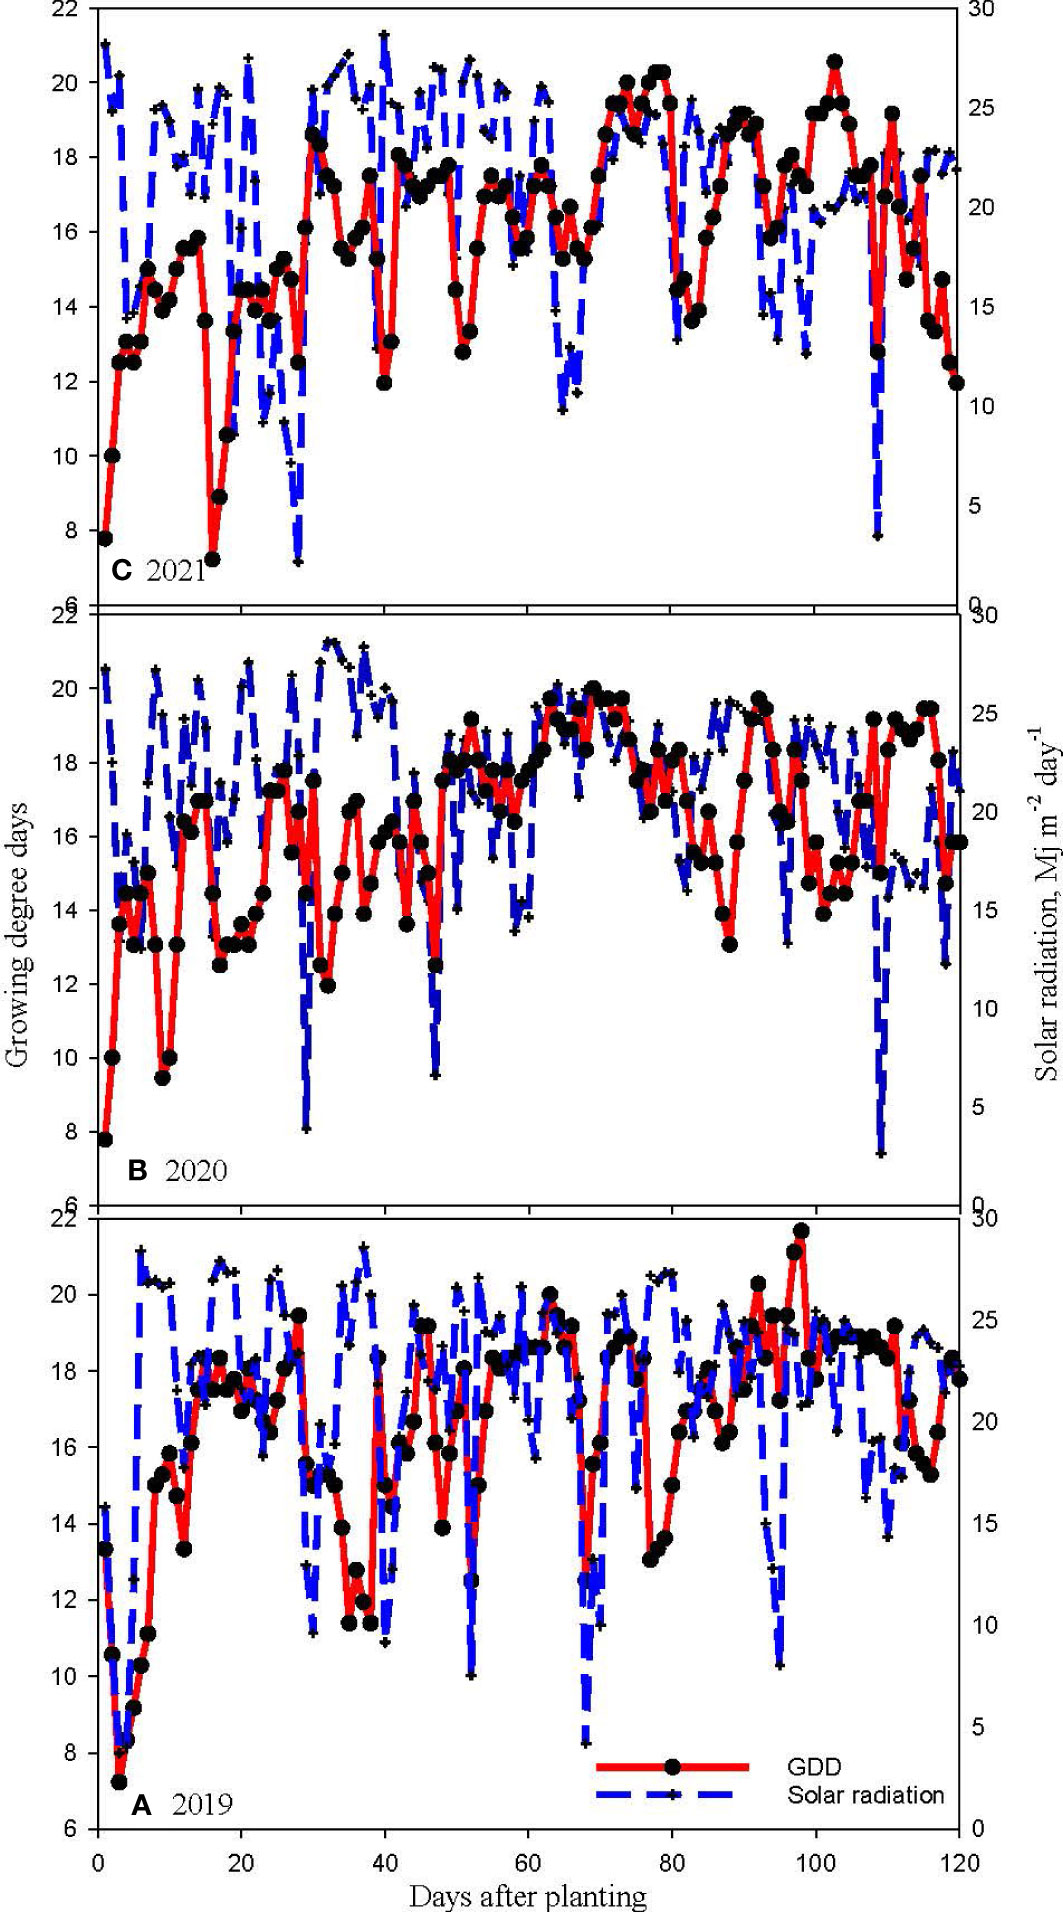
Figure 4 Daily growing degree days (GDD) and solar radiation for (A) 2019, (B) 2020 and (C) 2021 soybean growing seasons at Stoneville, MS, USA.
Soil pH
The pH ranged between 6.54 and 6.71 in 2019 in the top 15 cm soil, while the range was between 6.46 and 6.66 in 2021 after soybean harvest at 0-10 cm depth (Table 2). Although no statistically significant differences in pH were observed among NC, BR and GR treatments, numerical values tended to be lower for CC (BR and GR) treatments in 2021, but the differences were statistically significant in 2020 at 0 to10 cm depth, but insignificant at 10-20 cm and 20-30 cm soil depths. The pH was 3% higher in NC compared to CC treatments in 0-10 cm soil, while 2% lower pH was recorded in CC plots compared to 10-20 cm soil, while there were no differences at 20-30 cm soil among the three CC treatments. Similar results of reduced pH in the presence of rye in continuous soybean was reported based on a three year study in Missouri on a Waldron silt loam (21), while on a Canfield silt loam soil with rye CC-soybean rotation study in Ohio soil pH was unaffected by the presence or decomposition of rye (11) and the same study reported increased pH in a rye-corn rotation due to application of N fertilizer. In this experiment, no N fertilizer was applied probably explains the current result. Similar results were reported recently from a study on crop rotation and cover cropping from Wisconsin (36). Soil pH plays a fundamental role in soil biogeochemical processes important for plant growth and sustainable productivity (37).
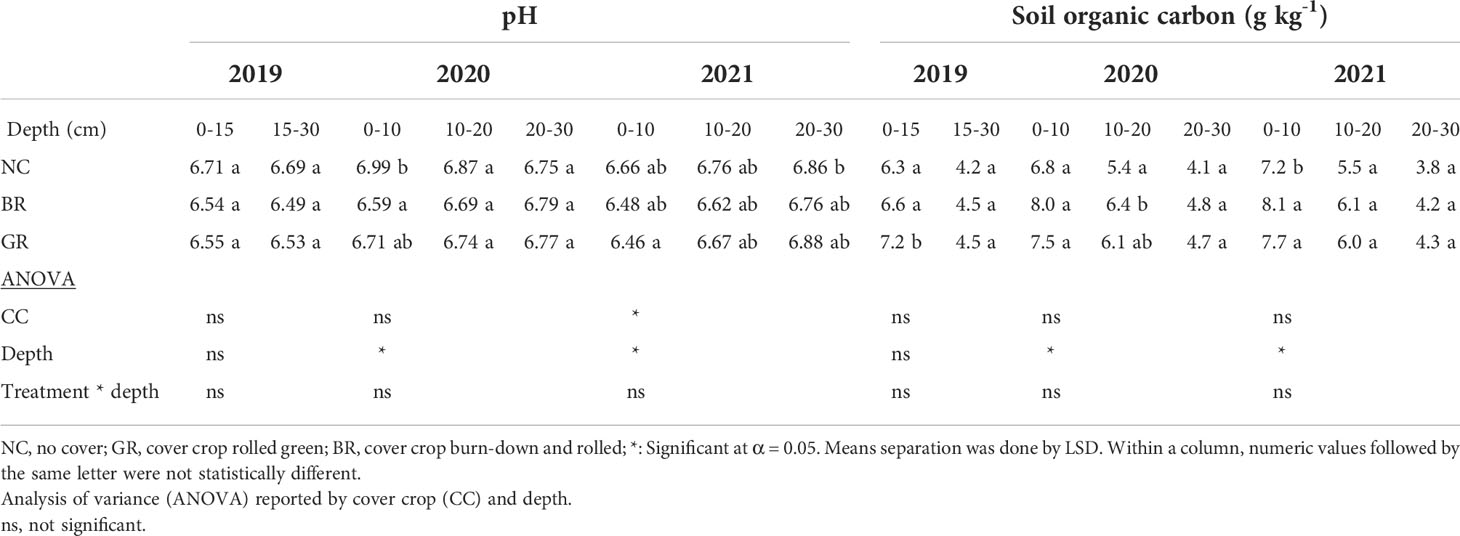
Table 2 Mean soil pH and organic carbon at different depths in a 3- year soybean-rye rotation field experiment sampled in spring 2019, fall 2020 and 2021 at Stoneville, MS, USA.
Soil organic carbon
Agricultural soils are depleted in SOC as compared to soils under natural vegetation cover as crop cultivation often leads to SOC losses of 30 to 40% in comparison to natural vegetation (38). The SOC ranged from 6.3-7.2 g kg-1 and 4.2-4.5 g kg-1 at 0-15 cm and 15-30 cm depths in 2019, respectively (Table 2). However, the range increased to 7.2-8.1 g kg-1 at 0-10 cm depth by 2021 and CC plots (BR and GR) were significantly higher than NC while the differences were insignificant in 2020, which recorded a range of 6.8-8.0 g kg-1. The BR plots recorded 12.5% higher SOC while GR plots recorded 7% higher SOC over NC plots at the end of the three year study in 2021 at 10 cm depth. There were no significant differences between BR and GR cover crop treatments. Contrary to our findings in a related soybean-rye cover rotation, rye cover treatment didn’t increase SOC compared to no CC treatment, probably due to lack of sufficient residue production (39, 40). Recently a global meta-analysis of over 581 experiments conducted during 1991-2018 on soil carbon changes due to cover cropping revealed an overall mean increase of SOC by 15.5% (41). There is no dearth of instances of significant increase of SOC due to cover cropping in the literature (5, 7, 8, 14, 18).
Soil organic matter
Soil organic matter (SOM) is an important soil quality indicator and its increase leads to improved nutrient cycling, cation exchange capacity, buffering capacity, and crop yield (42). The average SOM (derived by multiplying SOC by 1.78) at the beginning of the study was 11.5 g kg-1 and addition of rye residue increased it to 13.2 g kg-1 in 2020, an increase of 15% and by the end of the study it reached 13.6 g kg-1, which translated to 18% due to addition of about 15 Mg ha-1 yr-1of rye biomass over the period of three years besides soybean residue in this study at 0-10 cm depth (Table 3). This is in accordance with the observations of Haruna et al. (2018), who reported 8% increase in SOM in a three year study in Missouri. However, at 10-20 and 20-30 cm depth there were no significant differences for SOM across the treatments and years (range: 6.8-11.3 g kg-1) as most of the added rye residue (about 6 Mg ha-1 yr-1) was allowed to decompose on the soil surface due to adoption of no-till practice in this study. SOM was significantly greater in the top 10 cm of the soil and lowest in the 20–30 cm depth of sampling in 2021. Most studies across different climatic conditions have found that CCs significantly increased SOM compared to plots without CC as the CC add leaf and stem biomass above and root biomass below the ground (4, 18, 21, 43).
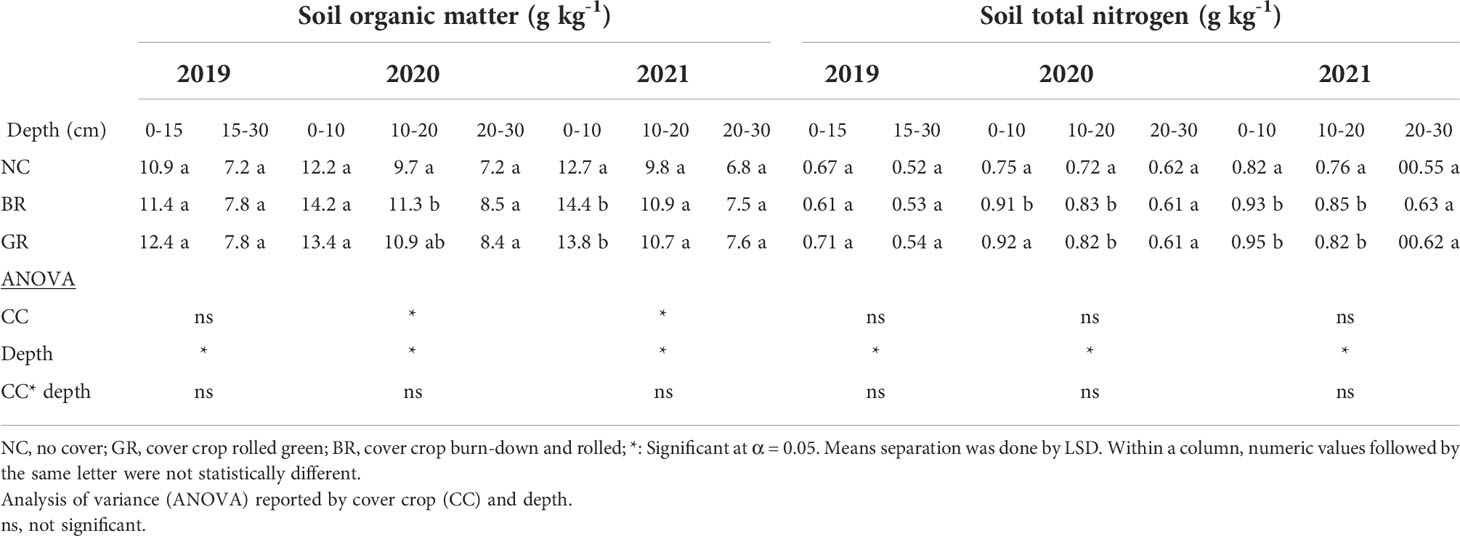
Table 3 Mean soil organic matter and total nitrogen at different depths in a 3- year soybean-rye rotation field experiment sampled in spring 2019, fall 2020 and 2021 at Stoneville, MS, USA.
Soil total nitrogen
Soil total nitrogen (STN) ranged from 0.61-0.71 g kg-1 at 0-15 cm depth in 2019, 0.75-0.92 g kg-1 in 2020 and 0.82-0.95 g kg-1 in 2021 at 0-10 cm soil depth across treatments. The CC plots (BR and GR) recorded a 13-29% increase in TN in the top 20 cm layers which was significantly different from the NC plots subsequent years 2020 and 2021 (P<0.05, Table 3). This is a result of rye residue addition above and below ground during the three seasons of CC growth. It can be noted here that the C/N ratio of CC biomass residue is a determining factor for soil N dynamics of a soil. Rye CC residue C/N ratio greater than 35 may favor N immobilization over N mineralization by soil microorganisms (44). Similar results of enhanced N were reported earlier when rye was used as CC (6, 15, 45). Grass CC like rye, wheat and oats have been reported to increase STN compared to legume CC (46). Grass CC conserve soil nitrogen which may potentially be lost through runoff and/or leaching into the ground.
Bulk density
The BD at the beginning of the experiment in 2019 recorded no significant differences among all treatments at all depths levels (Table 4). However succeeding years 2020 and 2021 saw significant decreases in BD by BR and GR treatments of 8% compared to NC (P<0.05). The cover crop treatments BR and GR did not show any differences in BD throughout the study. There were no significant differences in BD for the 10-20 and 20-30 cm lower depths amongst all treatments. Some previous studies showed CC residue significantly reducing BD concur with our findings (6, 14, 18, 39), while others reported no influence of CC on BD (11, 12).
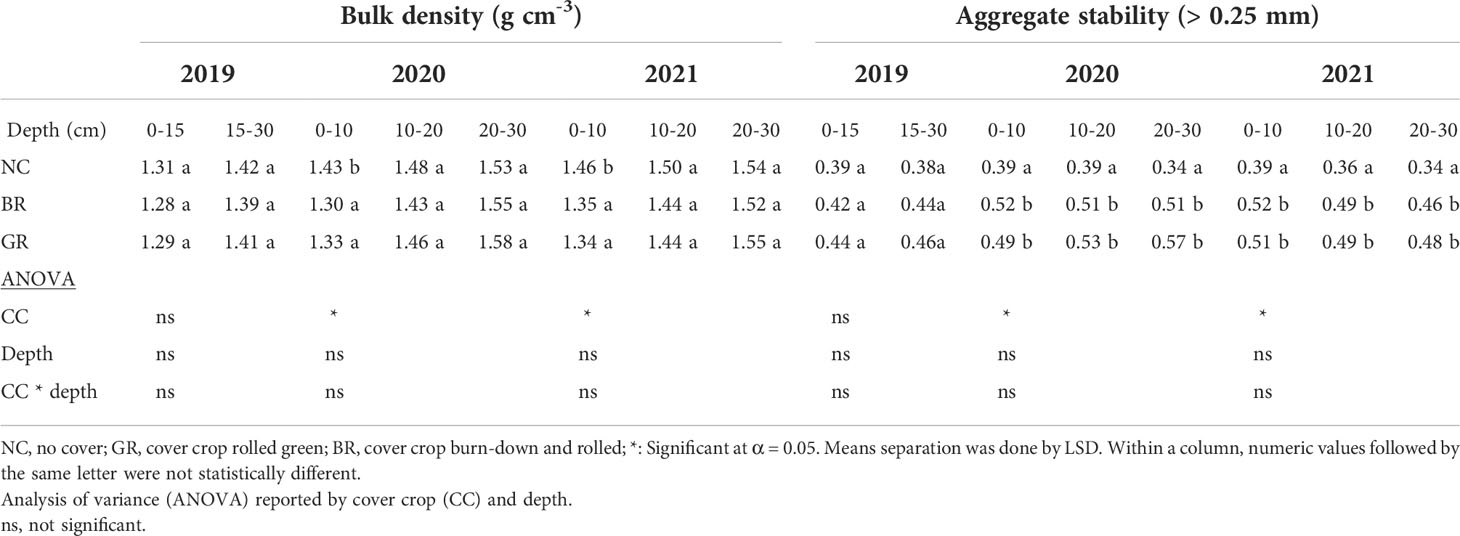
Table 4 Mean soil bulk density and aggregate stability at different depths in a 3- year soybean-rye rotation field experiment sampled in spring 2019, fall 2020 and 2021 at Stoneville, MS, USA.
Aggregate stability
Incorporation of rye CC in no-till continuous soybean increased the water stable aggregate (WSA) fraction for BR and GR by 26-33% (0-10cm), 35-68% (10-20cm) and 31-41% (20-30cm) for the 2020 and 2021 years compared to NC treatment (P<0.05, Table 4). The WSA didn’t change in NC plots over the course of the study at all the depths. The year 2019 did not show any significant differences in WSA amongst all treatments. A multi-year multi-location trial on Matapeake silt loam soil with rye CC demonstrated 35-43% increase in WSA (6). The increase of WSA in that study was attributed to an increased fungal secretion of enzyme, glomalin, associated with CC rotation and is believed to act as an aggregate binding agent (17). Rye CC had been shown to rapidly increase WSA in soil compared to other physical and chemical properties (40).
Field saturated hydraulic conductivity (Kfs)
The presence of decomposing organic matter in the soil can influence its soil hydraulic properties, like water holding capacities, pore size distribution, and hydraulic conductivity. The saturated hydraulic conductivities in the soil ranged between 36.9 and 37.8 mm h-1 in 2019, 38.6 and 40.9 mm h-1 in 2020, and 37.4 to 41.8 mm h-1 in 2021 (Figure 5). There were no significant differences in Kfs between NC and CC plots (BR and GR) in the first year of the study (2019); however, the CC plots recorded significantly higher Kfs (5%) in year two (2020), and 9% in year three (2021), probably due to the impact of CC residue decomposition and natural movement into the no-till soil with time. There were no significant differences between CC treatments BR and GR. Similar results of enhanced saturated hydraulic conductivity due to CC residue incorporation were reported earlier (4–6, 21). The enhanced soil saturated hydraulic conductivity particularly in high rainfall areas has multiple benefits including reducing surface-run off there by lessening nitrate leaching and improving soil water infiltration and deep percolation into the soil, which help in conserving more water in the soil for crop use, relieving some pressure on depleting aquifers for crop irrigation water supplies.
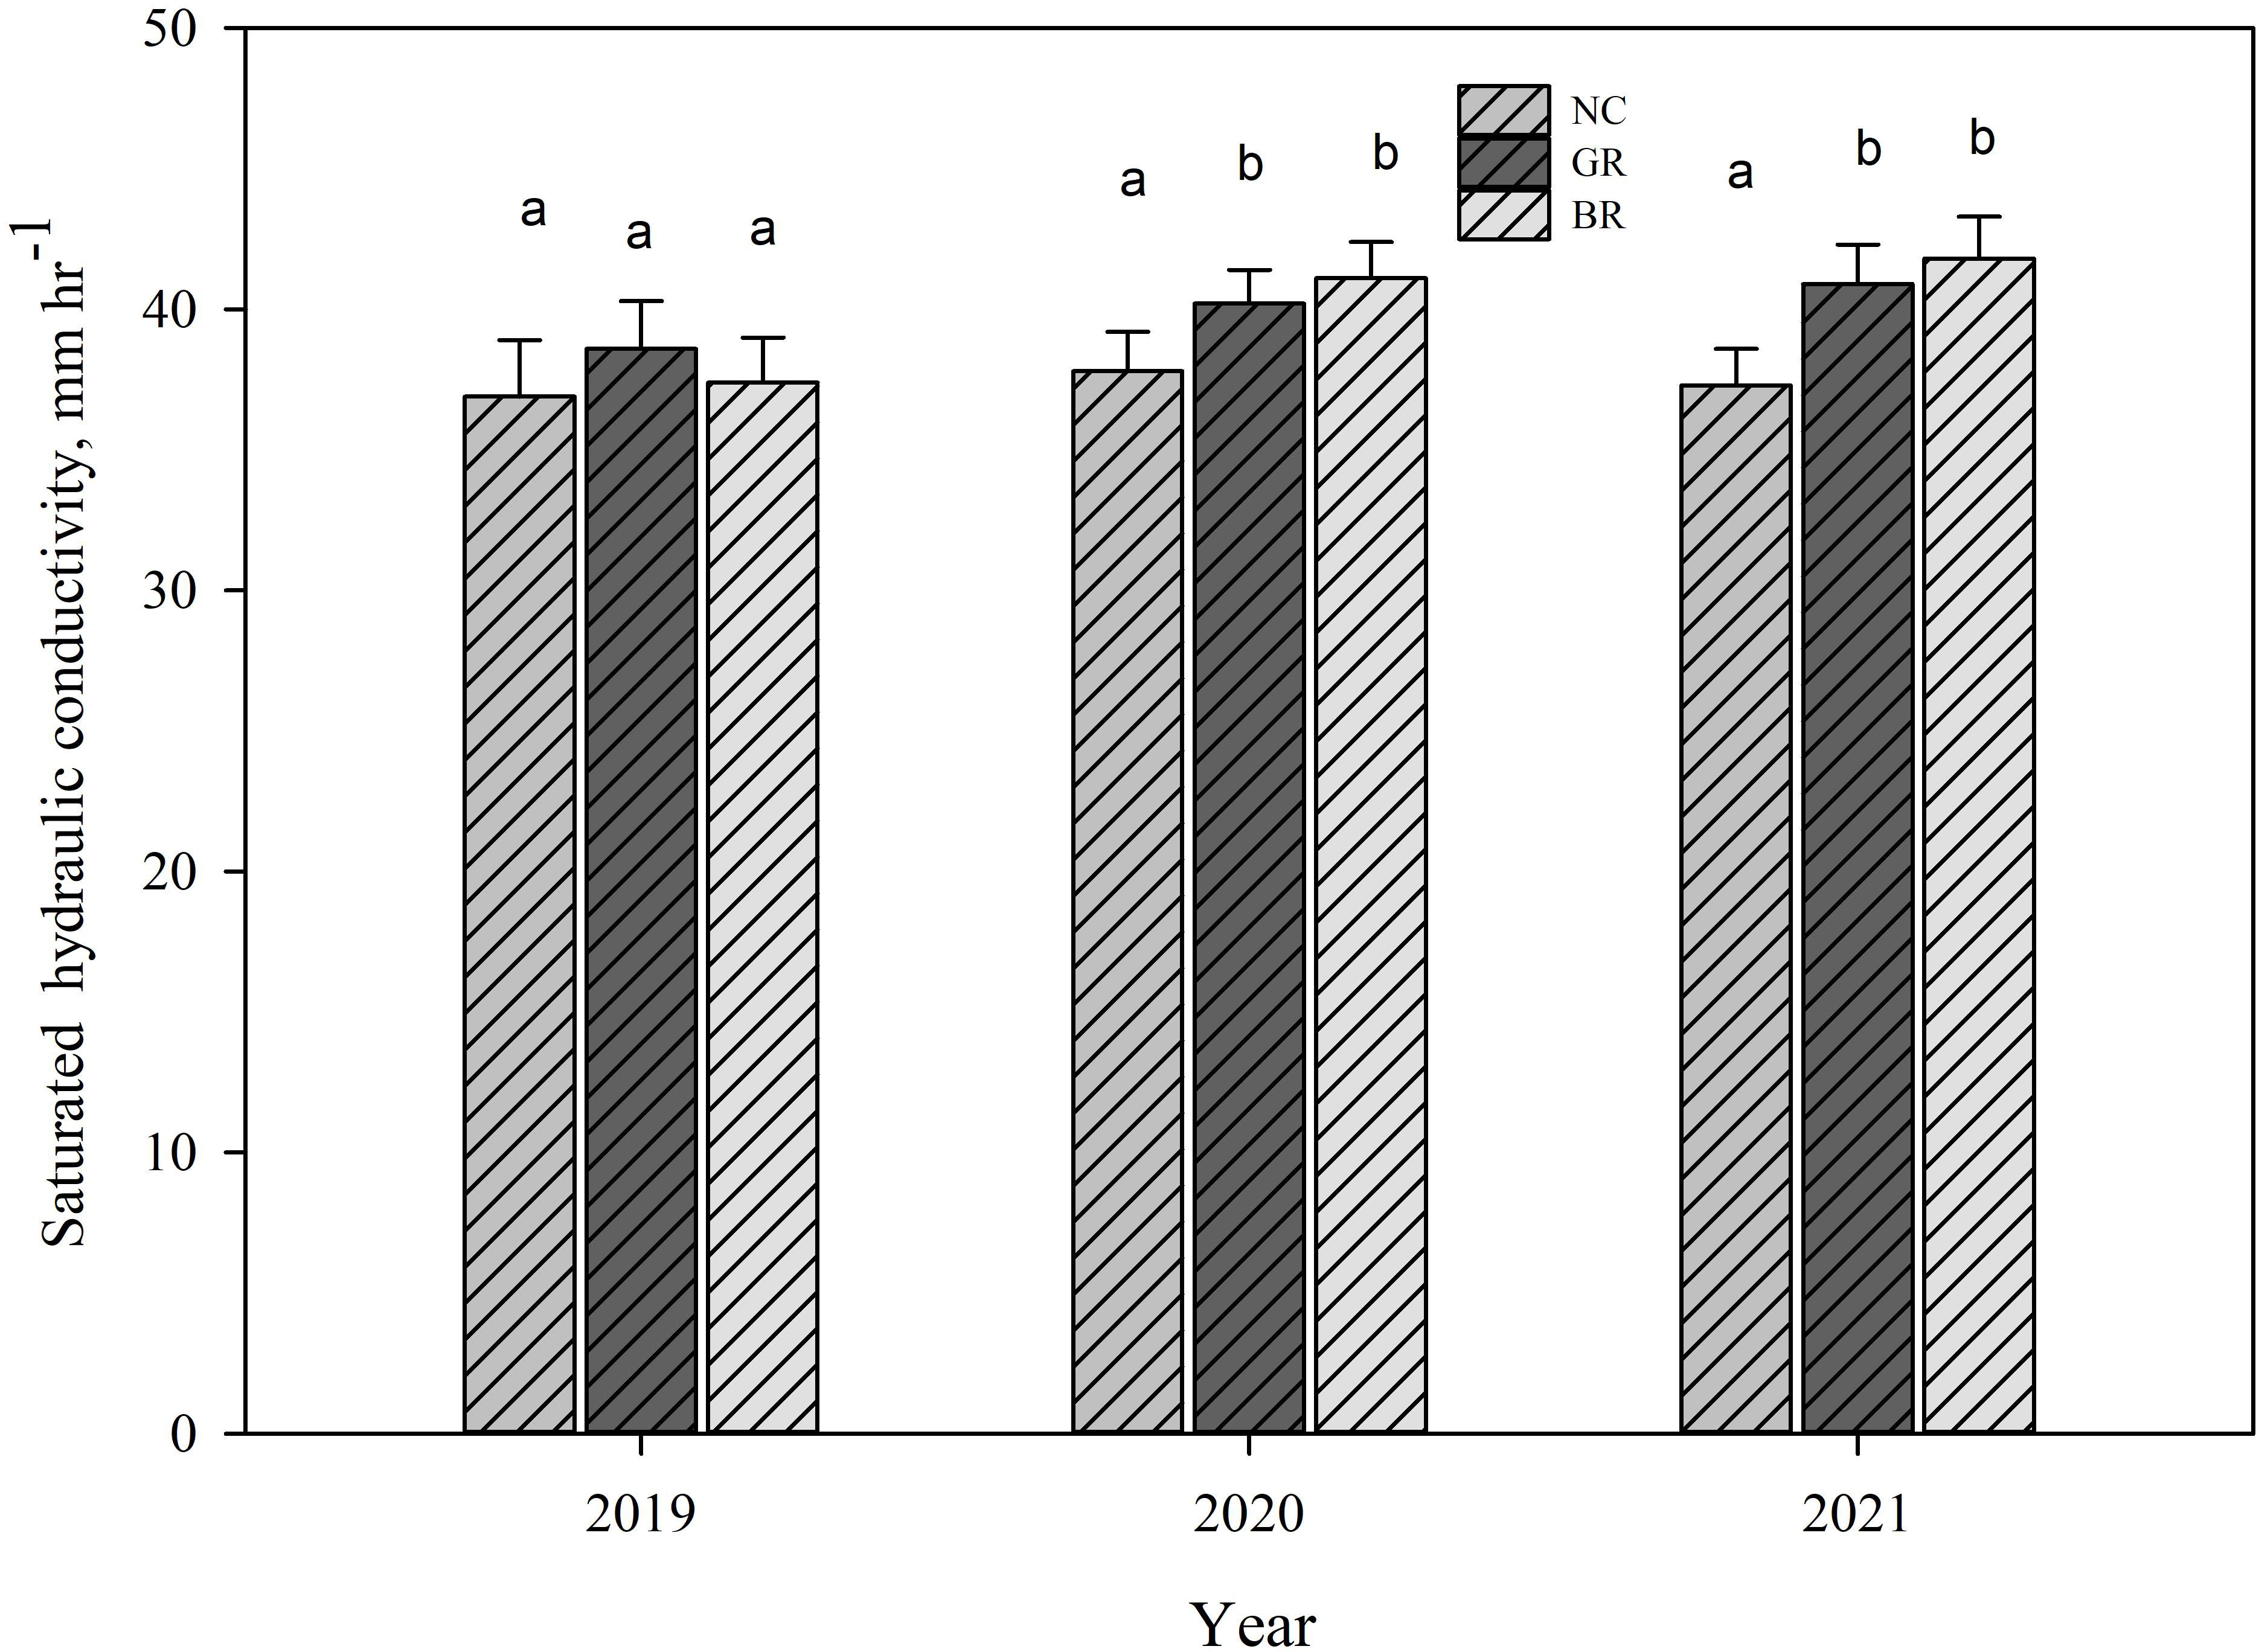
Figure 5 Saturated hydraulic conductivity measured in spring 2019, fall 2020 and fall 2021 in rye soybean rotation study at Stoneville, MS, USA in no cover crop (NC), green rolled rye followed by desiccation (GR) and desiccation of rye crop followed by soybean planting (BR) plots. Means separation was done by LSD and different letters indicate significant differences among treatments.
Soil penetration resistance
Soil penetration resistance (SPR) graphs showing every 2.5 cm to 30 cm depth for 2020 and 2021 years are shown in Figure 6. The measured SPR in 2021 were generally 2 to 4 times higher than those measured in 2020. This was attributed to the 5% more soil moisture content in 2020 when the measurements were taken compared to other years. A representation of SPR averaged every 10 cm depth increments showed GR and BR lowered SPR by 14 to 18% compared to the NC (P<0.05, Figure 6) plots in the upper 10 cm soil layer. No significant differences were observed among treatments for the lower depths. The detected lower SPR in the top 10 cm soil was substantiated by the correlating bulk densities that were observed (P<0.05, Table 4). The relatively higher GR and BR root yields that were exhibited through about 8% higher root count in comparison to NC possibly alleviated soil compaction though not significant (Table 5). Contrary to our findings, rye CC has been reported to have no effect on SPR on surface (0-20 cm) depth, but increased SPR below 20 cm depth under drier semi-arid regions compared to other CC species (47, 48).
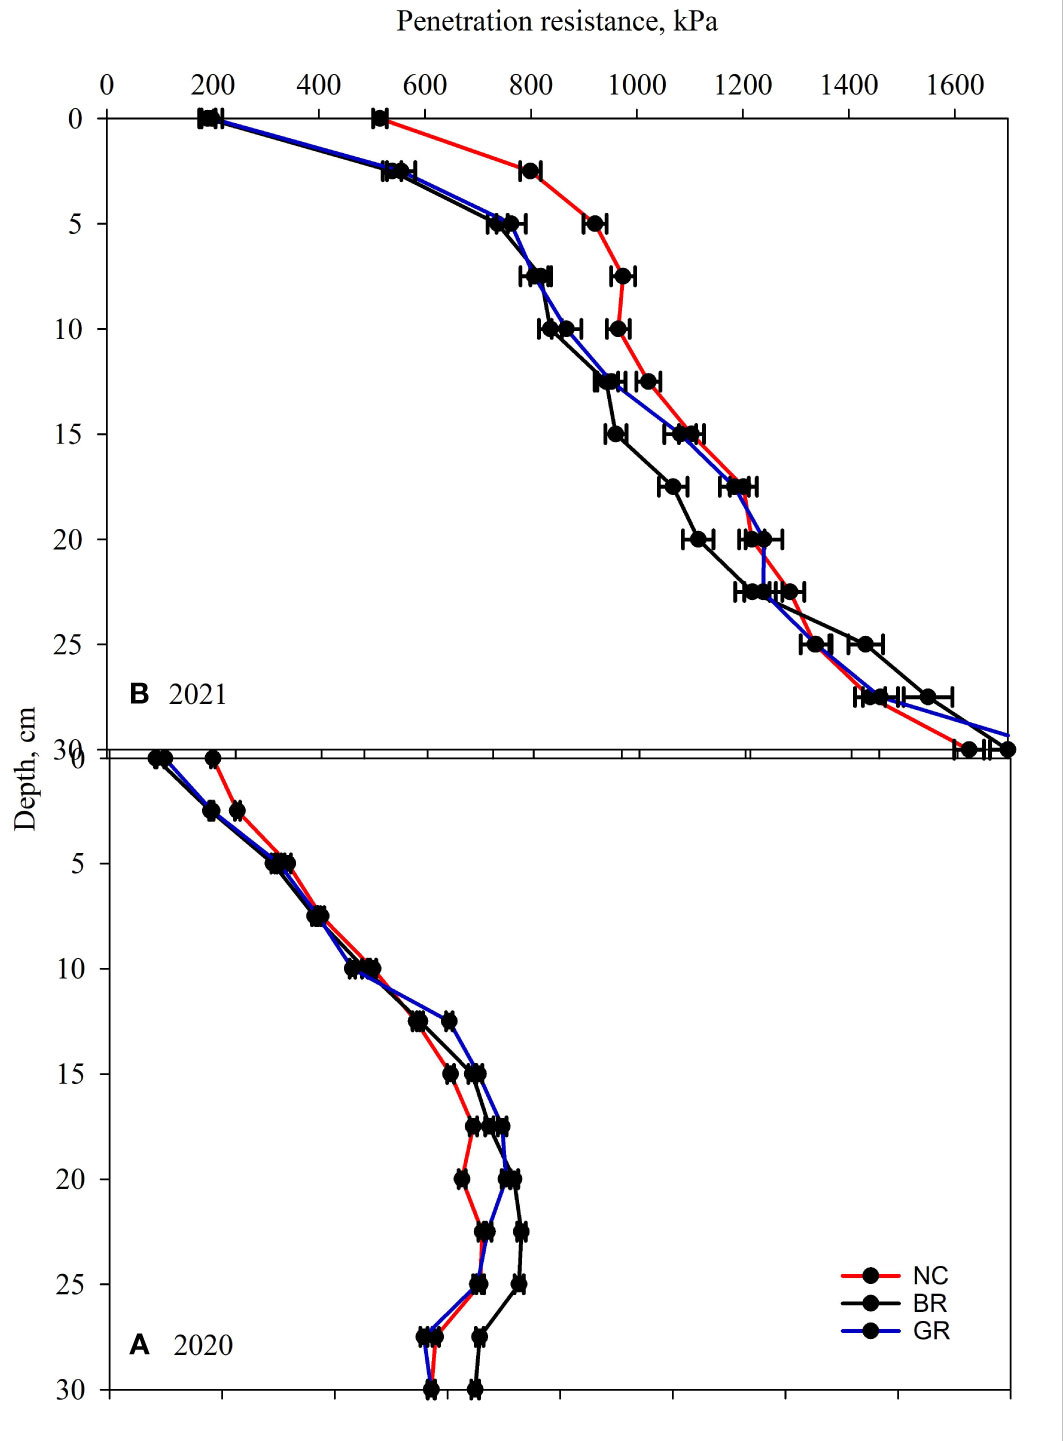
Figure 6 Soil penetration resistance measured in Fall (A) 2020 and (B) 2021 in rye soybean rotation study at Stoneville, in no cover crop (NC), green rolled rye followed by desiccation (GR) and desiccation of rye crop followed by soybean planting (BR) plots.
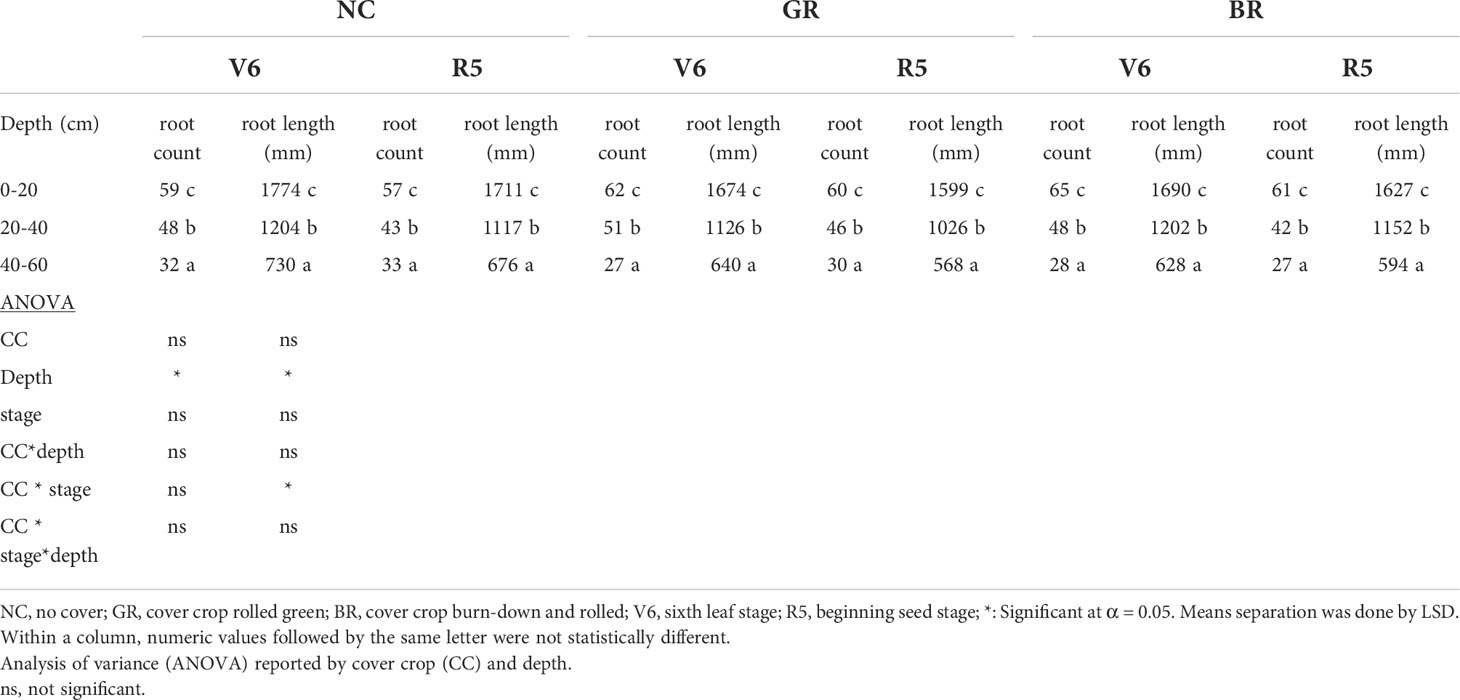
Table 5 Effect of cover crop (CC) treatments on soybean root count and root length at different depths in soybean-rye rotation study at Stoneville, MS.
Root characteristics
The CC impact on soil physical and chemical properties is well established in multiple studies across the globe under diverse agro-ecosystems. However, little is known on the impact of changes in soil properties due to CCs on the summer cash crop root growth. The ANOVA revealed no significant difference for the three treatments for both vegetative and reproductive stages, while root count and root length were significantly different for 0-20, 20-40 and 40-60 cm depths at treatment level (Table 5). The root counts at V6 stage (0-20 cm depth) were 59, 62 and 65 for NC, GR and BR treatments, respectively; a reduction in root count was observed at 20-40 and 40-60 cm depths. At R5 stage, critical for pod development and resultant grain yield, the root count was 57, 60 and 61 for NC, GR and BR treatments, respectively. The root length ranged from 16.8 to 17.8 cm at V6 and 16 to 17.1 cm at R5. The differences amongst the treatments were not statistically significant although soybean in NC plots recorded consistently higher root length at 0-20 cm depth. Similar trend was observed for 20-40 and 40-60 cm depth ranges. The root diameter ranged from 0.05 to 2.15 mm and root angle ranged from 4.5 to 86.9 mm (data not shown). For both traits, the differences among the treatments were insignificant. Similar to the results of this study Carter (49) reported reduced root count and length at deeper soil layers in eight different soybean cultivars under five irrigation treatments and found no significant differences among treatments and root development. It appears minirhizotron field research is limited in that data can only be collected from the area surrounding the minirhizotron tube. These results highlight the shallow root system of the soybean cultivar “Asgrow AG45X8 Xtend” used in the study. The grain yield harvested ranged between 3306 and 3925, 3677 and 4161 and 3596 and 3993 kg ha-1 in 2019, 2020 and 2021, respectively. The soybean grown in NC plots yielded 13% higher grains over GR and 15.8% higher over BR in 2019 season. However in 2020 and 2021 seasons, the BR and GR plots recorded 10.1% to 13.2% higher grain yield over the NC plots.
Adoption and integration of no-tillage system and CC management efforts to achieve agricultural productivity and sustainability had synergistic impacts that improved soil ecosystem function and services that was reflected in 2020 and 2021 seasons. Further, long term studies involving no-tillage and diverse CC impacts on soil and water quality besides water conservation will help to understand better the plant-soil interactions leading to system level sustainability.
Conclusions
The winter rye CC-summer soybean rotation system in the Mississippi Delta, examined in this study, improved physico-chemical properties of Dundee silt loam soil in a 3-year period. Rye CC reduced soil compaction as reflected in reduced BD and PR. It also improved Kfs, SOM, SOC and STN in the upper depths. The CC also improved WSA up to 30 cm depth. The present study demonstrated that neither CC, above ground residue, nor root biomass had an effect on the following main crop measured root characteristics in the silt loam soil and climate of the location. Moisture is not limiting in the Mississippi Delta due to frequent precipitation events during non-crop season hence there is a great potential for CC biomass production that is complemented by equally high amounts of surface residue from main crop, possibly explaining the relatively short turnaround time that was witnessed in this investigation. As for winter rye CC management, which grows very tall, rolling it green (GR) prior to desiccation or vice-versa (BR) had no impact on measured parameters. Cover crops have the potential to improve production efficiency and sustainability through soil C and N sequestration in the Mississippi Delta region.
Data availability statement
The original contributions presented in the study are included in the article/supplementary material. Further inquiries can be directed to the corresponding author.
Author contributions
SP: Data collection- analysis, writing - original draft - review & editing. PM: Data collection, writing - review & editing. SA: Writing - review & editing. KR: Resources, writing - review & editing. All authors contributed to the article and approved the submitted version.
Acknowledgments
The authors appreciate the technical assistance provided by Mr. Russell Coleman, Biological Technician, Crop Production Systems Research Unit and help in statistical analysis by Dr. Quentein Read, Area Statistician, Southeast area and does not imply recommendation or endorsement by the U.S. Department of Agriculture.
Conflict of interest
The authors declare that the research was conducted in the absence of any commercial or financial relationships that could be construed as a potential conflict of interest.
Publisher’s note
All claims expressed in this article are solely those of the authors and do not necessarily represent those of their affiliated organizations, or those of the publisher, the editors and the reviewers. Any product that may be evaluated in this article, or claim that may be made by its manufacturer, is not guaranteed or endorsed by the publisher.
Author disclaimer
Mention of trade names or commercial products in this article is solely for the purpose of providing specific information.
References
1. Myers R, Watts C. Progress and perspectives with cover crops: Interpreting three years of farmer surveys on cover crops. J Soil Water Conserv (2015) 70:125A–9A. doi: 10.2489/jswc.70.6.125A
2. Basche AD, Roesch-McNally GE. Research topics to scale up cover crop use: Reflections from innovative Iowa farmers. J Soil Water Conserv (2017) 72:59A–63A. doi: 10.2489/jswc.72.3.59A
3. Ryan MR, Curran WS, Grantham AM, Hunsberger LK, Mirsky SB, Mortensen DA, et al. Effects of seeding rate and poultry litter on weed suppression from a rolled cereal rye cover crop. Weed Sci (2011) 59:438–44. doi: 10.1614/WS-D-10-00180.1
4. Reberg-Horton SC, Grossman JM, Kornecki TS, Meijer AD, Price AJ, Place GT, et al. Utilizing cover crop mulches to reduce tillage in organic systems in the southeastern USA. Renewable Agric Food Syst (2012) 27:41–8. doi: 10.1017/S1742170511000469
5. Qin Z, Guan K, Zhou W, Peng B, Villamil MB, Jin Z, et al. Assessing the impacts of cover crops on maize and soybean yield in the US Midwestern agroecosystems. Field Crops Res (2021) 273:108264. doi: 10.1016/j.fcr.2021.108264
6. Steele MK, Coale FJ, Hill RL. Winter annual cover crop impacts on no-till soil physical properties and organic matter. Soil Sci Soc Am J (2012) 76:2164–73. doi: 10.2136/sssaj2012.0008
7. Lal R. Soil carbon sequestration and aggregation by cover cropping. J Soil Water Conserv (2015) 70:329–39. doi: 10.2489/jswc.70.6.329
8. Abdalla M, Hastings A, Cheng K, Yue Q, Chadwick D, Espenberg M, et al. A critical review of the impacts of cover crops on nitrogen leaching, net greenhouse gas balance and crop productivity. Global Change Biol (2019) 25:2530–43. doi: 10.1111/gcb.14644
9. Li Y, Li Z, Cui S, Jagadamma S, Zhang Q. Residue retention and minimum tillage improve physical environment of the soil in croplands: A global meta-analysis. Soil Tillage Res (2019) 194:104292. doi: 10.1016/j.still.2019.06.009
10. Jokela WE, Grabber JH, Karlen DL, Balser TC, Palmquist DE. Cover crop and liquid manure effects on soil quality indicators in a corn silage system. Agron J (2009) 101:727–37. doi: 10.2134/agronj2008.0191
11. Eckert DJ. Chemical attributes of soils subjected to no-till cropping with rye cover crops. Soil Sci Soc Am J (1991) 55:405–9. doi: 10.2136/sssaj1991.03615995005500020019x
12. Wagger MG, Denton HP. Influence of cover crop and wheel traffic on soil physical properties in continuous no-till corn. Soil Sci Soc Am J (1989) 53:1206–10. doi: 10.2136/sssaj1989.03615995005300040036x
13. Leuthold SJ, Quinn D, Miguez F, Wendroth O, Salmeron M, Poffenbarger H. Topographic effects on soil microclimate and surface cover crop residue decomposition in rolling cropland. Agric Ecosyst Environ (2021) 320:107609. doi: 10.1016/j.agee.2021.107609
14. Kim N, Zabaloy MC, Guan K, Villamil MB. Do cover crops benefit soil microbiome? a meta-analysis of current research. Soil Biol Biochem (2020) 142:107701. doi: 10.1016/j.soilbio.2019.107701
15. Noland RL, Wells MS, Sheaffer CC, Baker JM, Martinson KL, Coulter JA. Establishment and function of cover crops interseeded into corn. Crop Sci (2018) 58:863–73. doi: 10.2135/cropsci2017.06.0375
16. De Baets S, Poesen J, Meersmans J, Serlet L. Cover crops and their erosion-reducing effects during concentrated flow erosion. Catena (2011) 85:237–44. doi: 10.1016/j.catena.2011.01.009
17. Mendes IC, Bandick AK, Dick RP, Bottomley PJ. Microbial biomass and activities in soil aggregates affected by winter cover crops. Soil Sci Soc Am J (1999) 63:873–81. doi: 10.2136/sssaj1999.634873x
18. Nouri A, Lee J, Yin X, Tyler DD, Saxton AM. Thirty-four years of no-tillage and cover crops improve soil quality and increase cotton yield in alfisols, southeastern USA. Geoderma (2019) 337:998–1008. doi: 10.1016/j.geoderma.2018.10.016
19. Çerçioğlu M, Anderson SH, Udawatta RP, Alagele S. Effect of cover crop management on soil hydraulic properties. Geoderma (2019) 343:247–53. doi: 10.1016/J.GEODERMA.2019.02.027
20. Rachman A, Anderson SH, Gantzer CJ, Thompson AL. Influence of long-term cropping systems on soil physical properties related to soil erodibility. Soil Sci Soc Am J (2003) 67:637–44. doi: 10.2136/sssaj2003.6370
21. Haruna SI, Anderson SH, Nkongold NV, Zaibon S. Soil hydraulic properties: Influence of tillage and cover crops. Pedosphere (2018) 28:430–42. doi: 10.1016/S1002-0160(17)60387-4
23. Snapp S, Surapur S. Rye cover crop retains nitrogen and doesn’t reduce corn yields. Soil Tillage Res (2018) 180:107–15. doi: 10.1016/J.STILL.2018.02.018
24. Reddy KN. Effects of cereal and legume cover crop residues on weeds, yield, and net return in soybean (Glycine max). Weed Technol (2001) 15:660–8. doi: 10.1614/0890-037X(2001)015[0660:EOCALC]2.0.CO;2
25. Tyler HL. Winter cover crops and no till management enhance enzyme activities in soybean field soils. Pedobiologia (2020) 81–82:150666. doi: 10.1016/J.PEDOBI.2020.150666
26. Saleem M, Pervaiz ZH, Contreras J, Lindenberger JH, Hupp BM, Chen D, et al. Cover crop diversity improves multiple soil properties via altering root architectural traits. Rhizosphere (2020) 16:100248. doi: 10.1016/j.rhisph.2020.100248
27. Amsili JP, Kaye JP. Root traits of cover crops and carbon inputs in an organic grain rotation. Renewable Agric Food Syst (2021) 36:182–91. doi: 10.1017/S1742170520000216
28. Pinnamaneni SR, Anapalli SS, Reddy KN, Fisher DK, Quintana-Ashwell NE. Assessing irrigation water use efficiency and economy of twin-row soybean in the Mississippi delta. Agron J (2020) 112:4219–31. doi: 10.1002/agj2.20321
29. Plumblee MT, Dodds DM, Krutz LJ, Catchot ALJr., Irby JT, Jenkins JN. Determining the optimum irrigation schedule in furrow irrigated cotton using soil moisture sensors. Crop Forage Turfgrass Manage (2019) 5:1–6. doi: 10.2134/cftm2018.06.0047
30. Desclaux D, Roumet P. Impact of drought stress on the phenology of two soybean (Glycine max l. merr) cultivars. Field Crops Res (1996) 46:61–70. doi: 10.1016/0378-4290(95)00086-0
31. Miller RW, Donahue RL. Soils. an introduction to soils and plant growth. New Jersey: Prentince Hall (1990).
32. Sikora FJ, Moore KP. Soil test methods from the southeastern united states. South Coop Ser Bull (2014) 419:54–8.
33. Nelson DW, Sommers L. Total carbon, organic carbon, and organic matter. Methods Soil Analysis: Part 2 Chem Microbiol Properties (1983) 9:539–79. doi: 10.2134/agronmonogr9.2.2ed.c29
34. Schofield RK, Taylor AW. The measurement of soil pH. Soil Sci Soc America J (1955) 19:164–7. doi: 10.2136/sssaj1955.03615995001900020013x
35. Feng G, Tewolde H, Zhang B, Buehring N, Adeli A. Soil physical and hydrological properties as affected by a five-year history of poultry litter applied to a cotton–corn–soybean rotation system. Soil Sci Soc America J (2021) 85:800–13. doi: 10.1002/saj2.20224
36. Chamberlain LA, Bolton ML, Cox MS, Suen G, Conley SP, Ané JM. Crop rotation, but not cover crops, influenced soil bacterial community composition in a corn-soybean system in southern Wisconsin. Appl Soil Ecol (2020) 154:103603. doi: 10.1016/J.APSOIL.2020.103603
37. Neina D. The role of soil pH in plant nutrition and soil remediation. Appl Environ Soil Sci (2019) 2019). doi: 10.1155/2019/5794869
38. Don A, Schumacher J, Freibauer A. Impact of tropical land-use change on soil organic carbon stocks–a meta-analysis. Global Change Biol (2011) 17:1658–70. doi: 10.1111/j.1365-2486.2010.02336.x
39. Moore EB, Wiedenhoeft MH, Kaspar TC, Cambardella CA. Rye cover crop effects on soil quality in no-till corn silage–soybean cropping systems. Soil Sci Soc America J (2014) 78:968–76. doi: 10.2136/sssaj2013.09.0401
40. Rorick JD, Kladivko EJ. Cereal rye cover crop effects on soil carbon and physical properties in southeastern Indiana. J Soil Water Conserv (2017) 72:260–5. doi: 10.2489/jswc.72.3.260
41. Jian J, Du X, Reiter MS, Stewart RD. A meta-analysis of global cropland soil carbon changes due to cover cropping. Soil Biol Biochem (2020) 143:107735. doi: 10.1016/J.SOILBIO.2020.107735
42. Lehman RM, Cambardella CA, Stott DE, Acosta-Martinez V, Manter DK, Buyer JS, et al. Understanding and enhancing soil biological health: the solution for reversing soil degradation. Sustainability (2015) 7:988–1027. doi: 10.3390/su7010988
43. Blanco-Canqui H, Shaver TM, Lindquist JL, Shapiro CA, Elmore RW, Francis CA, et al. Cover crops and ecosystem services: Insights from studies in temperate soils. Agron J (2015) 107:2449–74. doi: 10.2134/agronj15.0086
44. Sainju UM, Whitehead WF, Singh BP. Biculture legume-cereal cover crops for enhanced biomass yield and carbon and nitrogen. Agron J (2005) 97:1403–12. doi: 10.2134/agronj2004.0274
45. Irmak S, Sharma V, Mohammed AT, Djaman K. Impacts of cover crops on soil physical properties: Field capacity, permanent wilting point, soil-water holding capacity, bulk density, hydraulic conductivity, and infiltration. Trans ASABE (2018) 61:1307–21. doi: 10.13031/trans.12700
46. Blanco-Canqui H, Jasa PJ. Do grass and legume cover crops improve soil properties in the long term? Soil Sci Soc Am J (2019) 83:1181–7. doi: 10.2136/sssaj2019.02.0055
47. Rosa AT, Creech CF, Elmore RW, Rudnick DR, Lindquist JL, Butts L, et al. Contributions of individual cover crop species to rainfed maize production in semi-arid cropping systems. Field Crops Res (2021) 271:108245. doi: 10.1016/j.fcr.2021.108245
48. Samuelson MB, Reid EV, Drijber R, Jeske E, Blanco-Canqui H, Mamo M, et al. Effects of compost, cover crops, and local conditions on degradation of two agricultural mulches in soil. Renewable Agric Food Syst (2022) 37:128–41. doi: 10.1017/S1742170521000405
Keywords: aggregate stability, bulk density, saturated hydraulic conductivity, soil organic carbon, root development
Citation: Pinnamaneni SR, Mubvumba P, Anapalli SS and Reddy KN (2022) Cereal rye (Secale cereale L.) cover crop improves soil physico-chemical properties with no influence on soybean (Glycine max L.) root growth parameters. Front. Soil Sci. 2:970380. doi: 10.3389/fsoil.2022.970380
Received: 15 June 2022; Accepted: 19 July 2022;
Published: 10 August 2022.
Edited by:
Ram Swaroop Meena, Banaras Hindu University, IndiaCopyright © 2022 Pinnamaneni, Mubvumba, Anapalli and Reddy. This is an open-access article distributed under the terms of the Creative Commons Attribution License (CC BY). The use, distribution or reproduction in other forums is permitted, provided the original author(s) and the copyright owner(s) are credited and that the original publication in this journal is cited, in accordance with accepted academic practice. No use, distribution or reproduction is permitted which does not comply with these terms.
*Correspondence: Srinivasa R. Pinnamaneni, c3JpLnBpbm5hbWFuZW5pQHVzZGEuZ292; orcid.org/0000-0001-7983-4662
 Srinivasa R. Pinnamaneni
 Partson Mubvumba2
 Saseendran S. Anapalli