 Thomas Jeanne
 Joël D’Astous-Pagé
 Richard Hogue
- Microbial ecology laboratory, Institut de Recherche et de Développement en Agroenvironnement (IRDA), Québec, QC, Canada
Several studies have shown that Illumina MiSeq high-throughput sequencing can be used to measure the diversity of prokaryotes and fungal communities that provide ecosystem functions in agricultural soils. Pedoclimatic properties of soils, together with cropping systems and agricultural management practices, are major drivers of soil microbiome diversity. Their effects must be quantified and compared to technical variability to improve the relevance of observed effects and the indicators that may result from them. This study was conducted: 1) To assess the effects of three sources of technical variability on the soil prokaryotes and fungal diversity; 2) To identify a source of technical variability that can be used as a threshold to better assess crop management effects; 3) To evaluate the effects of spatial and temporal variability compare to a technical threshold in three crop management contexts, potato, corn/soybean and grassland. Technical variability was evaluated in a basis of sampling, soil DNA extraction and amplicon sequencing source of variability. Spatial variability was evaluated using composite bulk soil cores at four sampling points covering 2500 m² per field. Geolocated soils were also collected on three sampling dates during the growing season to evaluate temporal variability. A technical variability threshold was determined for the soil DNA extraction variability with a delta of Shannon index of 0.142 and 0.390 and a weighted UniFrac distance of 0.081 and 0.364 for prokaryotes and fungi, respectively. We observed that technical variability was consistently similar or lower than the spatial and temporal variabilities in each of the microbial communities. Observed variability was greater for the diversity of fungi and the crop system has a strong effect on temporal and spatial variability.
Introduction
Soil microbial communities are very diverse (1), yet many soil microorganisms remain unknown (2). The inherent structure of soils and their physical-chemical properties influence the diversity of ecosystems and that of communities of viruses, archaea, bacteria, fungi, and other eukaryotes (3). The botanical diversity of plants that cover the soil, and which are anchored in the rooting substrate, adds to the complexity of soil-plant-microorganism interactions within soil ecosystems. Root system architecture (hierarchical structure and topology) and root deployment in the soil (vertical depth, horizontal extent, density), the diversity of exudates that are released by roots (quality and quantity), and ongoing climate change can alter soil properties, affect these interactions, together with the spatial and temporal variability of ecosystems. The study of soil biology makes it possible to assess and monitor the effects of climate change, cropping systems, and the management of agricultural practices on soil properties and ecosystems (4).
Microbial indicators must be selected that would complement conventional physical, chemical and biological indicators, which are used to assess the state of soil health (5, 6). The advent of high-throughput sequencing has greatly increased the volume of data from agricultural soil health studies that incorporate microbial ecology analyses (7–9). Variation in soil microbial community diversity provides opportunities to select microbial indicators of these effects (10, 11) and to assess the magnitude of disturbance to an ecosystem (12).
Technical variability of microbial diversity assessments must be considered before comparing effects of agricultural management treatments or defining predictive models. Soil sampling is a known source of variability and most often associated with spatial and temporal variation in physical-chemical characteristics that is routinely observed (13, 14). To limit this variability, it is recommended that soils be randomly sampled and composited into a single bulk sample for analysis (15, 16). The area that is covered when collecting these samples may vary and will depend upon the objectives of the studies. For the development of predictive models and associated data requirements, this coverage can be reduced if all other parameters are measured at the same scale (11).
Nucleic acid extraction methods can be thoroughly mastered. Indeed, the availability of commercial extraction kits has facilitated the standardization of this essential step in soil microbial ecology research (17). Yet, commercial kits have significant limitations for studies combining data that have been obtained using different products (14). These limitations may differ, depending upon the microbial group that is being assessed.
Most microbial ecology studies that integrate high-throughput sequencing, and which deal with the effects of cropping systems and the management of agricultural practices on the physical, chemical and biological properties of the soil, provide few details regarding the estimation of technical variability. Technical variability refers to the variation that arises when combining (pooling) samples, which have been collected, processed and analyzed at different times and in different settings (18). More routinely, especially in biochemistry and biology, technical replicates are replicates that assay the same sample (cf. biologically distinct samples) multiple times to reveal variation within a given protocol and assess its reproducibility (19). Yet, possible bias effects that are related to the experimental design are widely documented (13). Furthermore, technical replication cannot determine how representative the samples are with respect to the environments from which they are drawn (20). Sources of biological and technical variability can be accounted for using nested and hierarchical models (18). Yet, trade-offs between sampling extent (level of replication or lack thereof) and analytical depth (molecular techniques, especially) could help offset these biases and prove to be more informative if more robust statistical approaches and training in their application were to be implemented (21, 22). New statistical models have been proposed to incorporate technical variability into a more global variance (23).
Many ecological indices can be calculated to assess alpha diversity of soil microorganisms (http://scikit-bio.org/, 2022). These indices can be more or less sensitive to technical variability or temporal and spatial variability (24). The Shannon index is widely used and has the advantage of not being too sensitive to sequencing depth variability (24). Other indices, such as Chao1, are used to better interpret the richness of low-abundance microorganisms (25). Beta diversity is most often compared among samples by calculating Bray-Curtis dissimilarity (26, 27) and visualizing the treatment effects through principal coordinates analysis (PCoA, i.e., metric multidimensional scaling) or non-metric multidimensional scaling (NMDS). More recently, the use of other distances, such as Aitchison or Unifrac metrics (28, 29), has been proposed to limit the effects of normalization or to take phylogeny into consideration when comparing microbial compositions.
Lauber et al. (26) reported that alpha diversity is more variable over time than is microbial composition. The authors noted that this temporal variability is greater in agricultural soils and strongly influenced by moisture and temperature. While these findings are expected, it is still difficult to properly measure and contrast them with treatment effects such as crop rotations, types of organic fertilization or crop residue management. Temporal variability can alter not only the diversity, but also the dispersion and heterogeneity of microorganisms in field soils (30).
Observed effects of temporal variability are not the same for all microbial groups. Some microbial groups experience changes over time, while the abundance and composition of others may be more stable (27). These observations are common not only within a given microbial kingdom, but also among these kingdoms.
In a large-scale study, Plassart et al. (31) reported that spatial variability of bacterial diversity was mainly related to physical-chemical variability of the soils. Furthermore, the authors could identify microbial groups that were indicative of groupings of sites under similar pedoclimatic conditions and according to land use. The spatial variability of soil microbial diversity also has been related to both physical-chemical parameters and agronomic variables (32). This complexity requires appropriate assessments and comparison methods.
Nevertheless, several limitations have been highlighted regarding the interpretation of all sources of variability of microbial community diversity and the effects that are attributed to the agri-environmental factors mentioned above (6). Thus, substantial efforts should be made (33) to increase our knowledge in this area and to validate the robustness of interpretations. Therefore, we undertook this study to determine a technical variability threshold for soil microbial diversity and assess the effects of spatial and temporal variability. The objective is to improve the evaluation of the effects of crop management on soil microbial diversity.
Material and methods
Experimental setup
This study was carried out on privately owned agricultural fields. The landowners are collaborators in this research project, who gave us permission to conduct these studies on their respective properties. In 2018, soils were collected at four sampling plots in 11 fields (Table 1), which included potato (POT), maize/soybean systems (MS) and grassland (GRA). These sites are located in the Province of Quebec (Canada) in 2 pedo-climatic regions (see map in Supplementary Material). Precipitation varied from 707 mm to 975 mm depending on the sites over the season. Soil profiles and physical properties were determined as part of a provincial soil health survey (34). The soil series and taxonomic subgroup were determined, together with texture by particle size analysis and according to a previously described study (35, 36).
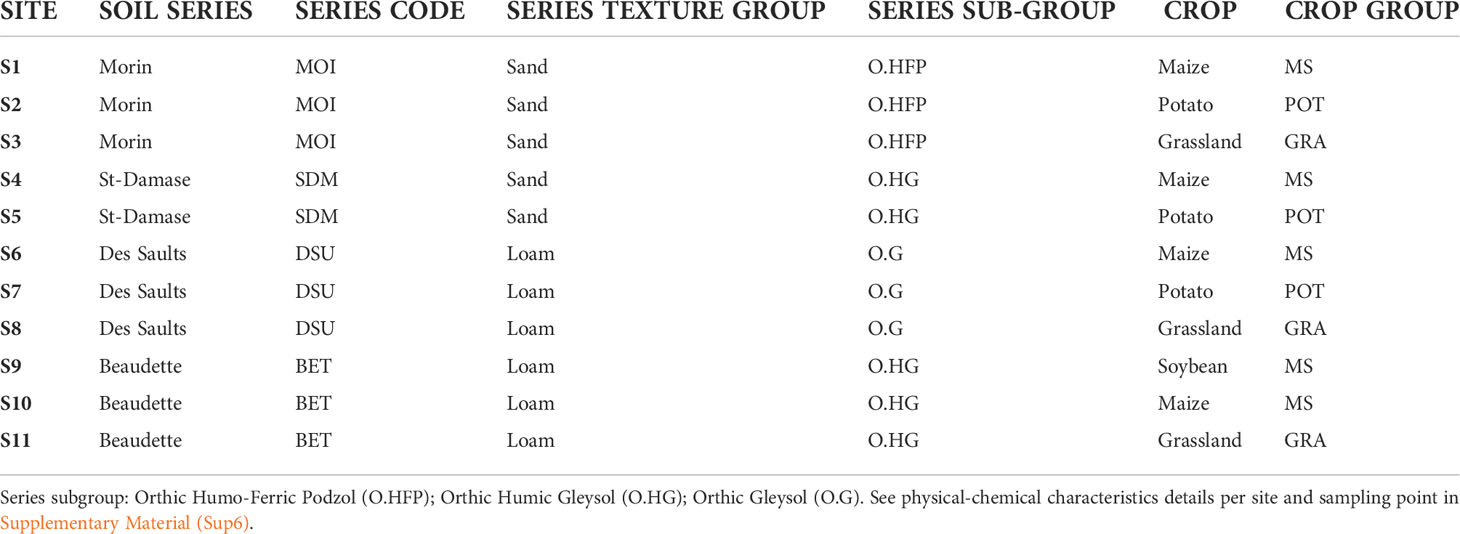
Table 1 Description of the 11 agricultural sites that were used in this study.
Collections and explanations of variation sources
Soil samples from sites S2 (sandy) and S9 (loam) were analyzed to assess more specifically technical variability (Table 1). Three sources of variability were evaluated to assess technical variability. The first source of variability is linked to the sampling of soil cores or the composited bulk sample and was estimated by comparing the variability in microbial diversity of the composited four soil cores to those of each individual soil core that were collected from all sampling points. The second source of variability is related to DNA extraction efficacy and reproducibility, while the third source of variability is related to amplicon sequence library preparation and high-throughput sequencing on a MiSeq instrument. Extraction and sequencing variability were evaluated in triplicate and sampling in quadruplicate on samples of the two sites.
For spatial variability, composite soil cores were collected at each corner of an experimental plot covering 2500 m2 in each field for a total of four composite soil samples per field. For this source of variability, the soils from all sites were used, but only for the summer period.
For temporal variability, all sampling points were geo-referenced to allow sampling at the same points at three periods during the growing season. The first period was at the beginning of the season (mid-May to mid-June), the second period was in August, and the third period was in October. Soil samples were collected in 9 of 11 sites, given that soil could not be sampled in autumn on two sites (S1, S10) because these fields had been harvested when agricultural operations were underway by the producer.
Sampling and DNA extraction
Each soil sample consisted of four soil cores (6 cm diameter x 20 cm depth) that were taken with soil sample drill at a corner of a 1-m2 quadrat. The four soil cores of each sample were manually homogenized, placed in sealed bags, and kept on ice before being quickly stored at -80°C prior to DNA extraction. Molecular analyses were performed according to Jeanne et al. (11) and (9). In summary, a 200 g aliquot of each soil sample was manually homogenized and sieved to 6 mm. Next, the 0.5 g sub-samples of 6 mm sieved soil were added to 2 mL tubes containing 1.4 g of matrix E beads and 1 mL of lysis buffer that were supplied with the FastDNA™ SPIN Kit for Soil (MP Biomedicals, Solon, OH, USA). The homogenization step was done using a FastPrep-24™ instrument (MP Biomedicals, Solon, OH, USA). DNA extraction was performed according to the manufacturer’s instructions. Quality and quantity of DNA extracts were evaluated by spectrophotometry (Biophotometer, Eppendorf, Mississauga, ON, Canada) with a G1.0 microcuvette (μCuvette, Eppendorf) with absorbance readings at 260, 280, 230, and 320 nm.
Library preparation and sequencing
Prokaryote and fungal community diversities were assessed. Prokaryote rRNA 16S (V4 region) gene was amplified using 515FB and 806RB primers (37, 38) and fungal rRNA Internal Transcribed Spacer 1 (ITS1) gene was amplified using BITS-ITS1 and B58S3 primers (39). We used a two-step dual-indexed PCR approach that was specifically designed for Illumina instruments by the Plateforme d’analyses génomiques (IBIS, Université Laval, Quebec City, QC, Canada). The gene-specific sequence was fused to the Illumina TruSeq sequencing primers and PCR was conducted in a total volume of 25 μL, which contained 1X Q5 buffer (NEB, Whitby, ON), 0.25 μM of each primer, 200 μM of each dNTP, 0.5 U of Q5 High-Fidelity DNA polymerase (NEB, Whitby, ON), and 5 μL of template DNA. PCR began with an initial denaturation step at 98°C for 30 s followed by 35 cycles of denaturation at 98°C for 10 s, of annealing at 55°C for prokaryotes and 50°C for fungi for 10 s, and of extension at 72°C for 30 s with a final extension at 72°C for 2 min. The PCR reaction was purified using the Axygen PCR cleanup kit (Fisher Scientific, Nepean, ON). The quality and the quantity of the purified PCR products were checked by using an Epoch microplate reader (Agilent, Santa Clara, CA) with a detection spectrum including UV (A260/A280). Fifty- to one-hundred-fold serial dilutions of this purified product were used as templates for a second PCR step, with the goal of adding barcodes (dual-indexed) and missing sequences that are required for Illumina sequencing. The cycling parameters for the second PCR were identical to the first, but only 12 cycles were completed. PCR products were purified as above, checked for quality on a DNA7500 Bioanalyzer chip (Agilent, Santa Clara, CA), and then quantified spectrophotometrically using the Biophotometer with a G1.0 μCuvette. Barcoded amplicons were pooled in equimolar concentrations for sequencing on the Illumina MiSeq platform using a 2 X 300 bp sequencing kit.
Quantitative PCR of bacterial and fungal DNA
Total bacteria and fungi were quantified according to the approach that was described by Overbeeck et al. (9). For prokaryotes, EUB338/EUB518 primers were used (40) and for fungi, FF390/FR1 primers were used (41). Amplifications were performed on a CFX96 instrument (Biorad, Hercules, CA) using SYBR green qPCR mix (Qiagen, Toronto, ON) with the PCR conditions set as follows: initial activation step 15 min at 95°C, 40 cycles of 95°C for 1 min, 30 s at the annealing temperature (53°C for bacteria; 51°C for fungi) and 72°C for 1 min. Standard curves were generated from a known quantity of amplified DNA fragments, diluted over a 4-log range (efficiency of 89.1% and r2 = 0.99 for bacteria; efficiency of 91.7% and r2 = 1 for fungi).
Bioinformatic analysis and statistics
Sequence processing was performed under QIIME2 (42) using the DADA2 plugin (43) filtration approach for determining Amplicon Sequence Variants (ASV). For sequences of the ITS region that were used for fungi diversity, the primers were previously removed with the Cutadapt tool (44). Differences of the structures among prokaryotes and fungi were assessed by calculating phylogenetic distance for each variability group according to weighted UniFrac (29). PCoA was performed from the UniFrac distance matrix using the vegan package in R (45). One-way PERMANOVA of UniFrac responses was used to determine pseudo-F statistical tests (999 permutations) under QIIME2 and with the beta-group-significance function (42, 46). Pairwise tests between all pairs of groups also were performed and filtered to determine intragroups between the sources of variability. Non-parametric Kruskal Wallis tests that were used to compare independent groups of variability were performed in R version 4.1.1 (47) using stat_compare_means function of the ggpubr package version 0.4.0. Pairwise comparisons between groups were done using Wilcoxon tests.
Three diversity indices assessed microbial alpha diversity, i.e., Shannon, Chao1 and Simpson indices (48, 49). The results of the Chao1 and Simpson indices are presented in supplementary material. Deltas of the Shannon index and quantification of prokaryotes and fungi were calculated to limit the influence of the site on the expression of the results. We wanted to be able to group together sites from the same cropping system without being influenced by its absolute value. These deltas were calculated as the differences between all the combinations for the same sampling point in the case of the sources of technical and temporal variability and for the same site in the case of the source of spatial variability.
Results
Figures 1–3 present evaluations of the technical variability effect on the microbial parameters. We observe in Figure 1 that the delta of Shannon diversity index (H’) is lower for prokaryota compared to fungi. The variability related to library preparation and sequencing (hereafter, referred to as variability related to sequencing) is significatively higher for prokaryotes, with lower variability for fungi (0.202 and 0.230, respectively). The sampling and extraction variabilities are not significantly different for prokaryotes as well as for fungi between the groups (H’ = 0.52 for prokaryota and 0.39 for fungi). Figure 2 shows the effects of the source of technical variability on the molecular quantification of bacteria and fungi in soils. The deltas of bacteria and fungi quantifications are the lowest for the source of variability related to sequencing (1.2E+09 and 5.7E+06, respectively). Figure 3 presents the technical variability effect on microbial composition. For prokaryotes, the effects of the sources of variability are similar (P=0.54) with distances between 0.077 and 0.084. For the composition of fungi, there is an effect of sources of variability, where sequencing has the lowest variability (0.206) and that of sampling is the highest (0.484). Sampling-related variability is globally the most important source of technical variability. This variability is reduced when soil samples are pooled together. The technical variability related to extraction was subsequently used to express the effects of spatial and temporal variability.
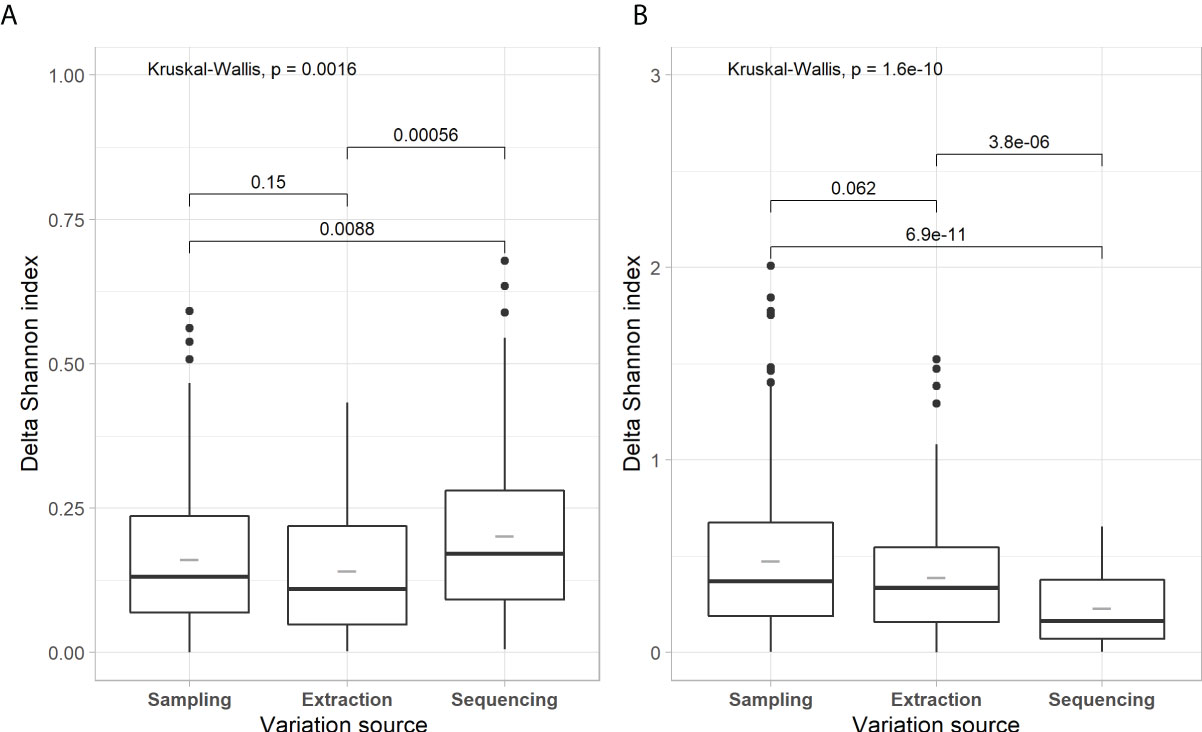
Figure 1 Box-and-whisker plots of Shannon diversity for each component of technical variability for prokaryotic (A) and fungal (B) communities. Lower and upper edges of the boxes delimit the 25th and 75th percentiles, while the horizontal bar is the median value (50th percentile) for that variable. The lower and upper whiskers delimit the 10th and 90th percentiles, respectively; the filled circles are outliers beyond 1.5 x Interquartile Distance (25th to 75th percentiles) from the lower and upper edges of the boxes. Kruskal-Wallis rank-based ANOVA compares the sources of variation for each microbial group; pairwise post-hoc comparisons with Wilcoxon-tests indicate which treatment mean ranks differ from one another within microbial group.
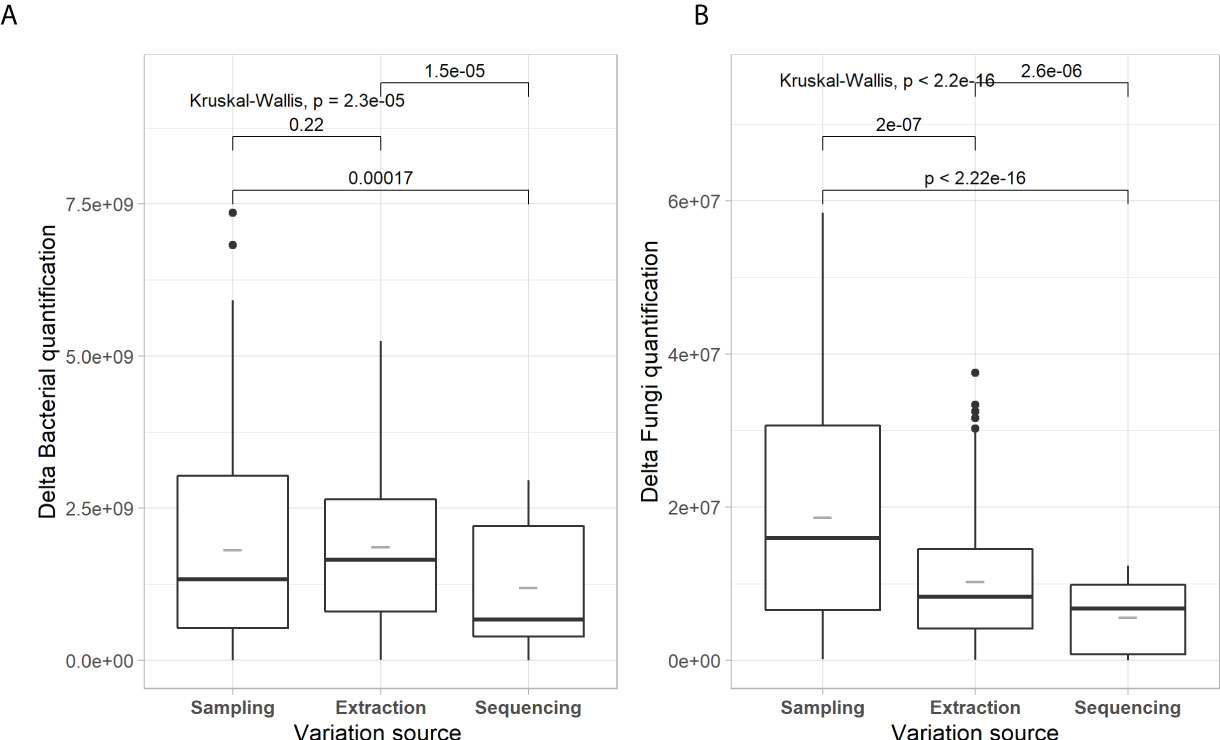
Figure 2 Box-and-whisker plots of microbial quantification for each component of technical variability for prokaryotic (A) and fungal (B) communities. Boxplots are the same format as those described in Figure 1. Kruskal-Wallis tests with post hoc pairwise Wilcoxon-test comparisons follow a similar format to Figure 1.
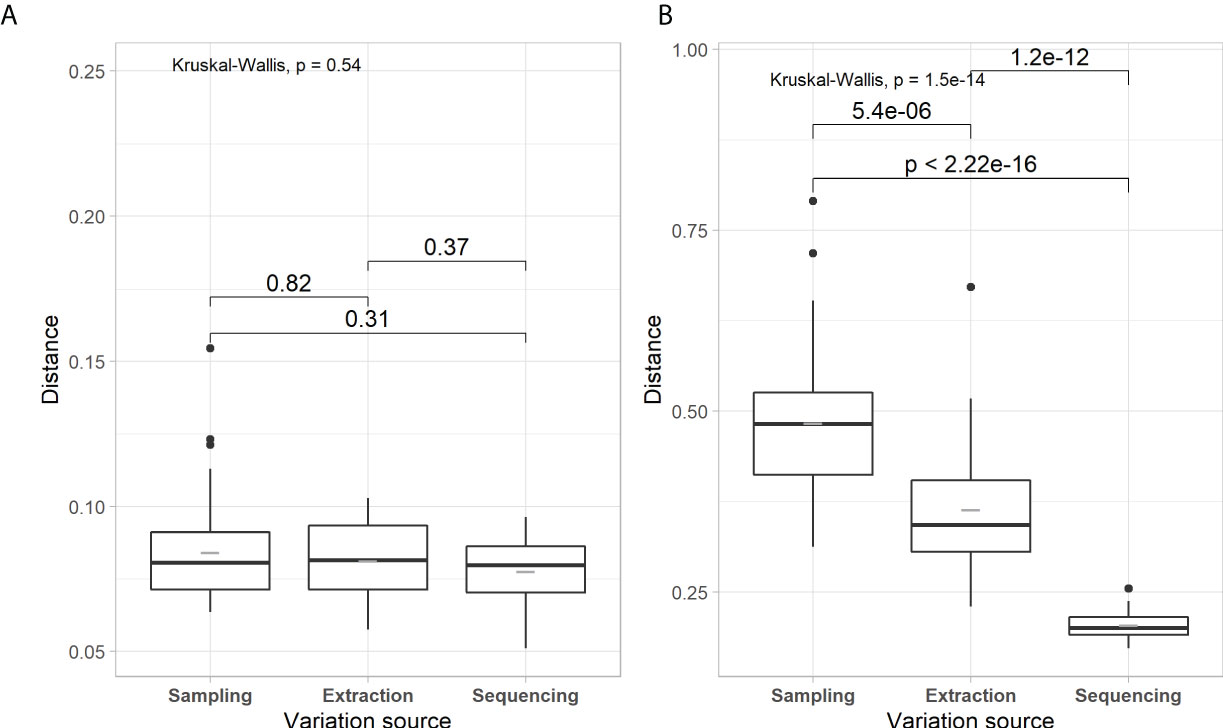
Figure 3 Box-and-whisker plots of weighted UniFrac distance for each component of the technical variability for prokaryotic (A) and fungal (B) communities. Boxplots are in the same format as those described in Figure 1. Kruskal-Wallis tests and post hoc pairwise Wilcoxon-test comparisons follow a similar format to Figure 1.
To assess the overall composition and visually represent the microbial diversity of the 11 study sites, PCoA ordination was carried out on UNIFRAC distances (Figure 4). A fairly marked biological signature can be observed for each site. We also observe that the distribution of points according to spatial and temporal variability is less clumped than the biological variability between sites. These observations are not intended to explain the variability of microbial diversity between sites but to complete the descriptions of the sites in Table 1. Our site selection was established as part of a larger study on similar soils and of crop management, mainly that of potatoes and field crops. Table 2 compares the strength of centroid differences among the groups according to the cropping system, the sites, and the soil characteristics of the sites. For prokaryotes, the effects of the cropping system (pseudo-F = 10.61; df = 2, 113) are less important than those associated with the sites or soil characteristics. For fungal composition, the opposite trend is observed with a dominant effect of the cropping system (pseudo-F = 17.40; df = 2, 113) and a decreasing effect of site down to the soil series subgroup (Pseudo-F-statistics: 13.58 to 4.78). Figure 5 present the effects of sources of variability on the delta of Shannon index. Sites were grouped by cropping system to describe spatial and temporal variability in potato, field crop (corn, soybean) or grassland contexts. For prokaryotes, we observe that there is an increase in temporal variability compared to the technical variability threshold for the potato and field crop sites (0.241, P=1.5E-6 and 0.253, P=1.6E-9, respectively). There is also an effect at the spatial level for the potato sites (0.270, P=0.0022). For fungi, we observe an increase in the delta of the Shannon index for the grassland sites (0.559, P=0.037 and 0.579, P=0.0021) at the spatial and temporal level and at the temporal level for the potato sites (0.538, P=0.0132). Figure 6 presents the bacterial and fungal quantifications according to the source of variability. It is observed that the sites in grassland present greater delta quantification of bacteria and fungi for both spatial and temporal variability (5.2E+09, P=2.7E-5 and 4.6E+09, P=4,1E-16 for bacteria and 3.2E+07, P=1.6E-16 and 4.4E+07, P<2E-16 for fungi, respectively). There is also a lower effect in the case of fungi for the sites of other cropping systems.
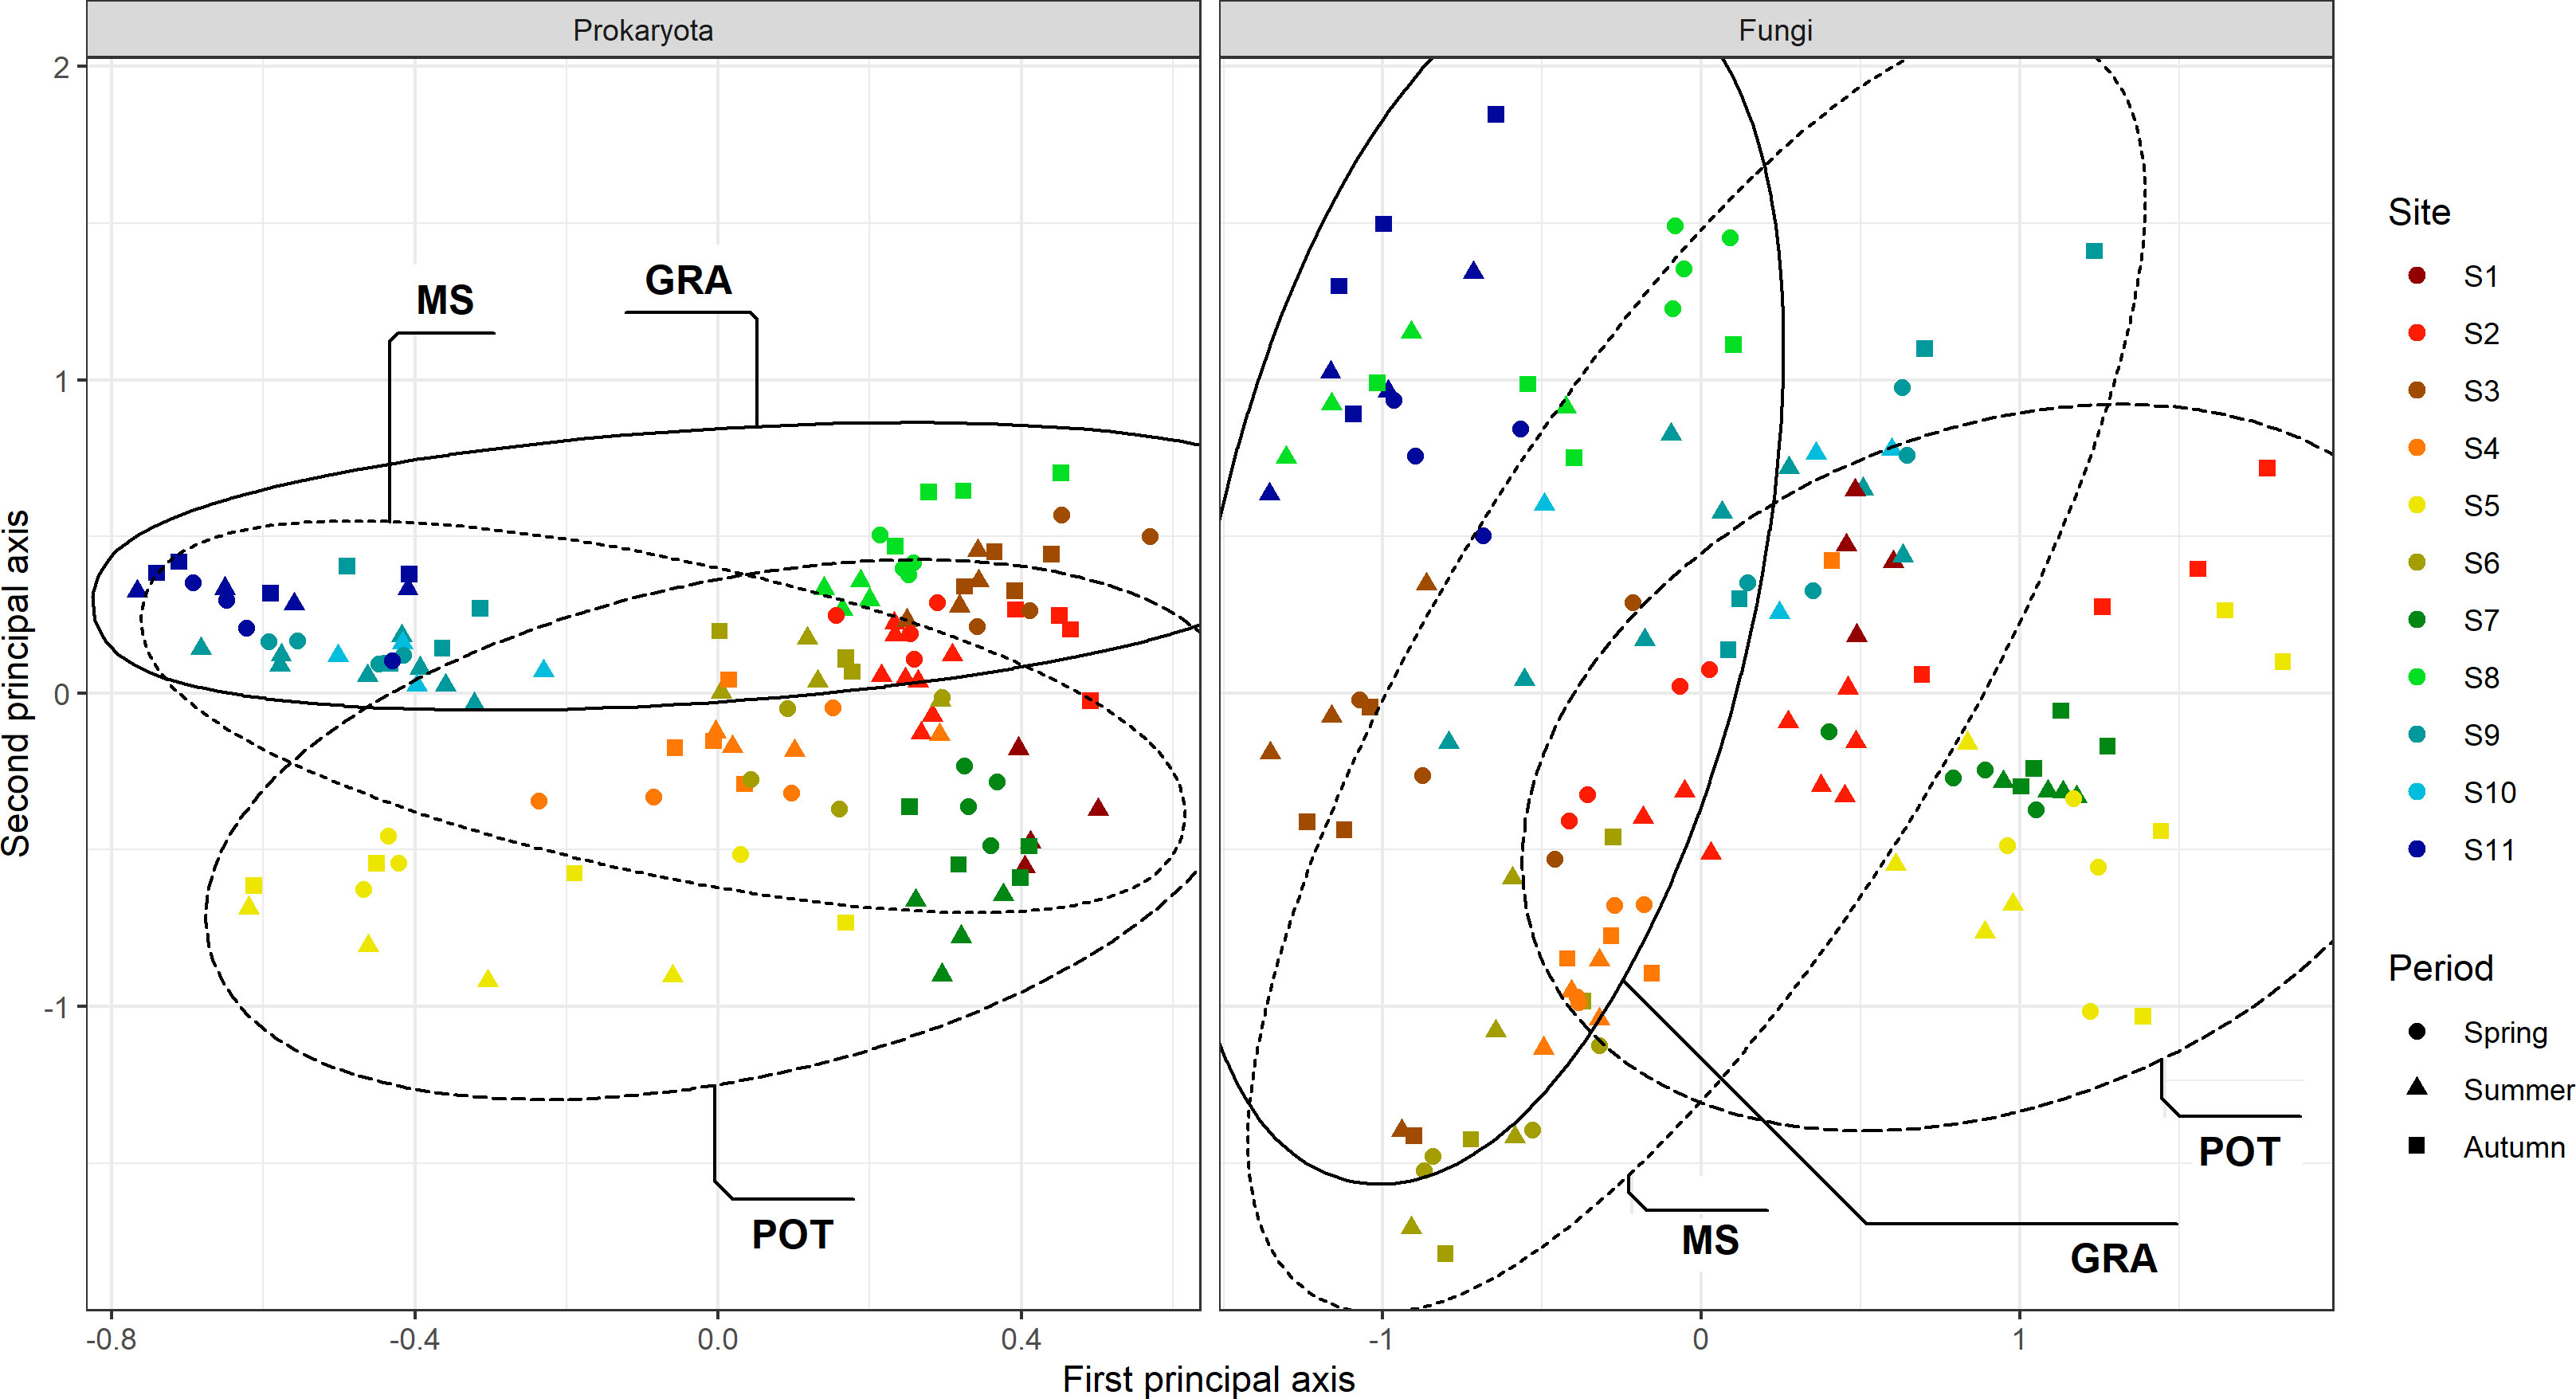
Figure 4 Principal Coordinates Analysis (PCoA) of prokaryotic (A) and fungal (B) community composition in bulk soil sampled at each site. PCoA were based on weighted UniFrac distance metric. Crop management codes: (MS: Maize/Soybean; POT: Potato; GRA: Grassland). Colours that are associated with Sites 1 to 11 are allocated according to a soil texture gradient, from the most sandy to the fine silt soils (Table 1 and Supplementary Material).
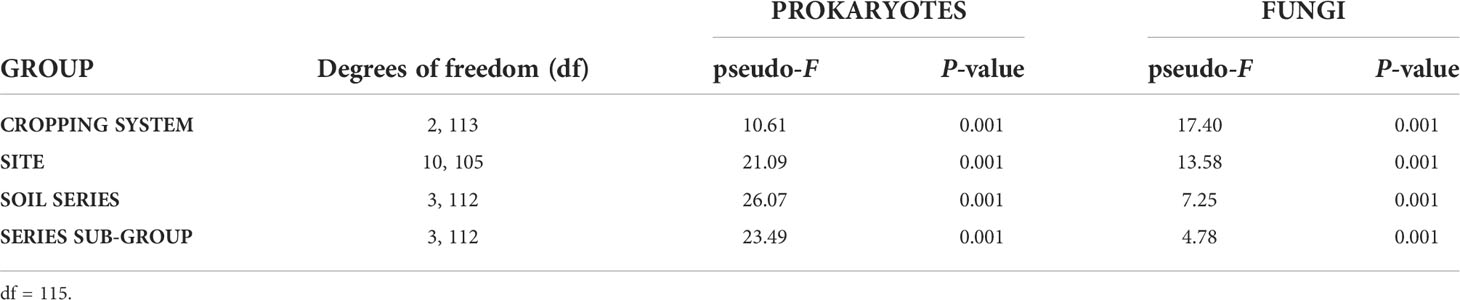
Table 2 One-way PERMANOVA of UNIFRAC responses according to the cropping system and soil classifications of the sites.
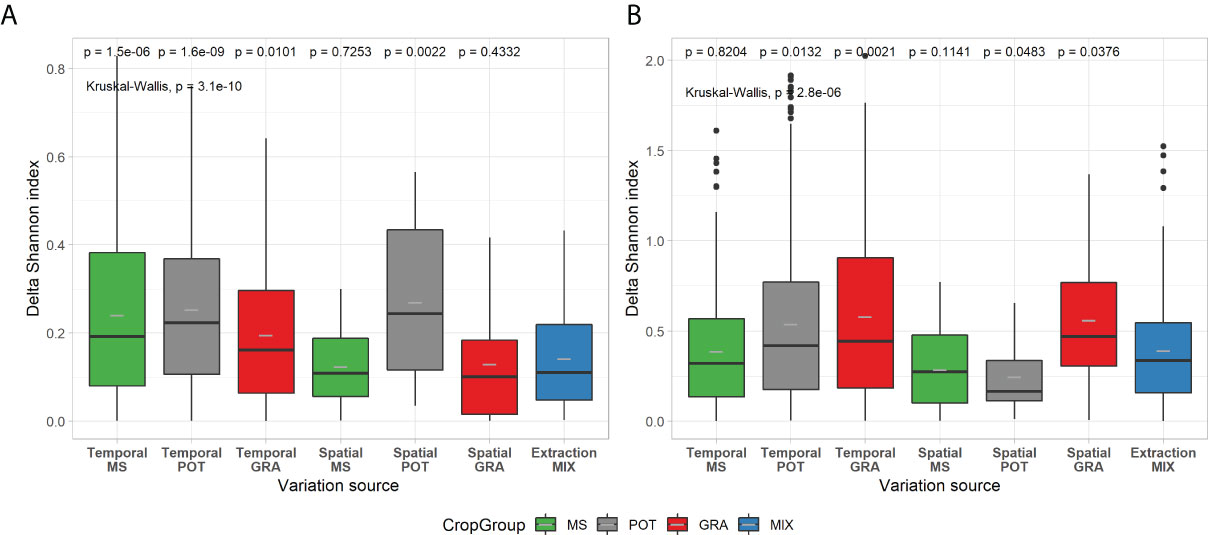
Figure 5 Box-and-whisker plots of Shannon diversity for spatial, temporal and technical variability of prokaryotic (A) and fungal (B) communities. Crop management codes: (MS, Maize/Soybean; POT, Potato; GRA, Grassland; MIX (Maize/Soybean and Potato). Boxplots are in the same format as those described in Figure 1. Kruskal-Wallis tests and post hoc pairwise Wilcoxon-test comparisons follow a similar format to Figure 1.
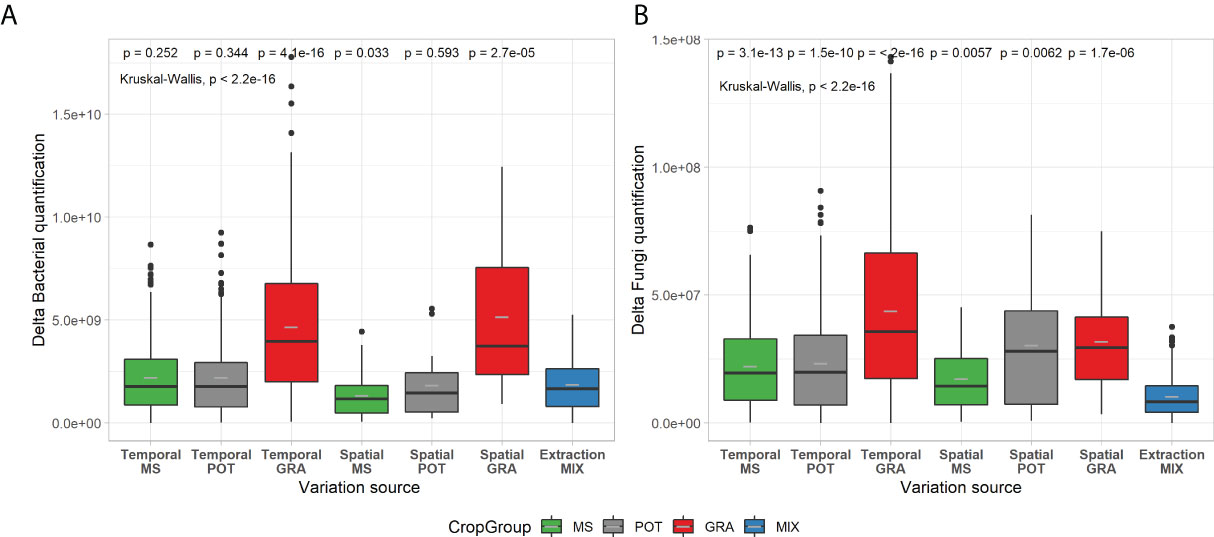
Figure 6 Box-and-whisker plots of microbial quantification for spatial, temporal and technical variability of prokaryotic (A) and fungal (B) communities. Boxplots are in the same format as those described in Figure 1. Crop management codes and significance codes are the same as for Figure 5.
Figure 7 presents the weighted Unifrac distances according to the sources of variability. For prokaryotes, we observe a relatively similar effect of variability (P=1.8E-07) between crop systems for spatial (0.092 and 0.114) and temporal (0.110 and 0.118) variability. For fungi, there is also an effect of the type of variability (P<2.2E-16), which is similar between temporal and spatial variability. In contrast, a more marked effect is observed depending on the type of crop. There is a marked effect for sites in grassland (0.775, P=6.7E-14 and 0.748, P=1.5E-9) and to a lesser extent for sites with large crops. There is less of an effect or none observed for potato sites.
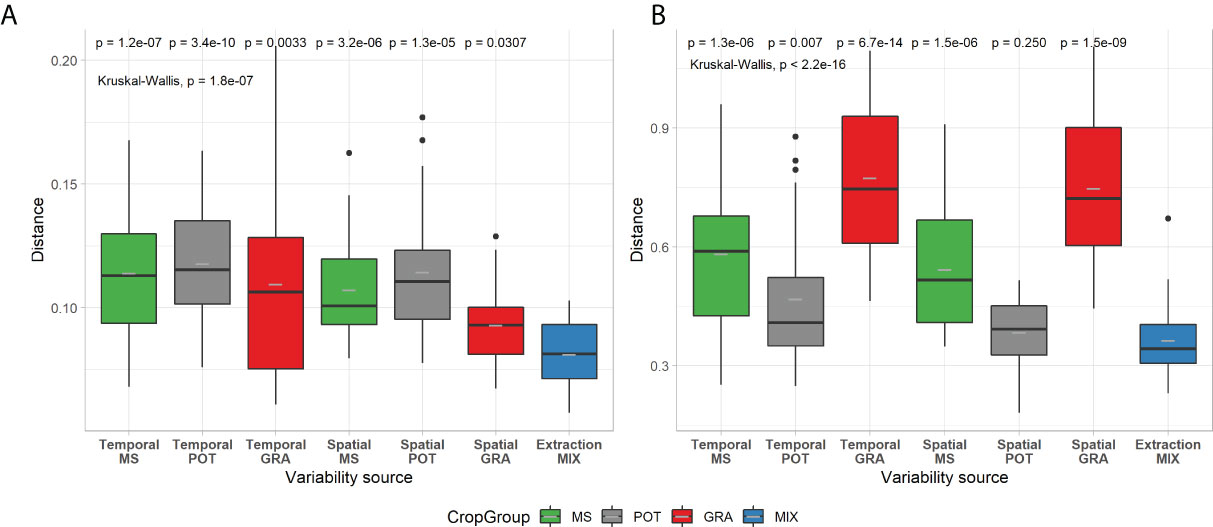
Figure 7 Box-and-whisker plots of weighted UniFrac distance for spatial, temporal and technical variability of prokaryotic (A) and fungal (B) communities. Boxplots are in the same format as those described in Figure 1. Kruskal-Wallis tests and post hoc pairwise Wilcoxon-test comparisons follow a similar format to Figure 1. Crop management codes and significance codes are the same as for Figure 5.
Discussion
The results on the technical variability are in line with the observations made previously (13–16). The source of variability related to the sampling is globally the most important and this confirms the need to take several soil cores for one composite sampling point and to homogenize well the soil sample. Variability that is related to extraction could be understood in the same way by grouping several DNA extractions for the same soil (50) or by using replicates for library preparation (51), but there may be economic limitations because this step is expensive. We therefore propose to use technical variability as a reference threshold to express the treatment effects. More broadly and including the effects of extraction methods, this source of variability has already been mentioned as critical for assessing technical variability (52).
Our results also indicate that the effects are different depending on the microbial communities. Technical variability is greater for fungi than for prokaryotes. These observations are in line with the statements made by Carini et al. (27). The wider range of morphological characteristics and of life cycle schemes among the species of the fungal community, when compared to those of prokaryotes, may explain why soil sampling more strongly influences that source of variability. The integration of technical variability that is associated with the preparation of the libraries and with sequencing makes it possible to contrast the observed effects. This makes it easier to compare the differences in effects between prokaryotes and fungi. This threshold is similar when we used amplicons that had been already tagged to evaluate sequencing-related variability between MiSeq runs (Data not shown).
In order to be able to evaluate the effects of treatments on the soil in an agricultural context, it was important to highlight the technical variability with the spatial and temporal variability. Even if we have observed an effect of time on alpha diversity at the level of prokaryotes, as it was the case for the study of Lauber et al. (26), we find more marked effects of the type of crop culture management on all microbial parameters, particularly for the diversity of fungi. These results are particularly interesting in relation to our objective of specifying the effects of treatments in different agricultural contexts. Specific studies in grassland may require more sampling in time and space than would studies on potato or maize/soybeans.
These observations are noteworthy, since they show that effects of crop management can act differently, depending upon the microbial group. For the maize/soybean and potato systems, spatial and temporal variability was of the same order. These observations concur with those made in other studies (26, 27).
These cropping system effects are in line with current research on plant-soil feedbacks (53). There is a direct link between temporal variability and plant diversity and land cover. The mobilization of soil microorganisms by plants at the root level would lead to greater changes compared to poorer crop management with reduced land use and plant diversity, such as in potato or corn cropping systems. Current research in sustainable agriculture is increasingly turning to complex cropping systems (54) by combining different plant species through the establishment of combined cropping (55) and maximizing land use with the establishment of cover crops. Our results show that in this context it becomes essential to adapt the controls that are used to express the treatment effects. They also show that the number of biological replicates must be adjusted according to the study context. It would be important to increase the number of replicates for research on complex crop management systems. These conclusions will also help to better design future microbiome research to help develop sustainable agriculture. This agrees with other studies that support these research effects (56). Finally, even if we observe a temporal variability on the microbial diversity of the soil, we note that this variability is relatively stable. The fact that the variability is greater depending on the crop management confirms that soil microbiome-based data could be used as soil health indicators. This is in line with previous studies (6).
Conclusion
Our results confirm that the technical variability of microbial diversity is not a limitation for comparisons of effects of temporal and spatial variability that are related to crop management systems. To our knowledge, this study is the first to estimate three sources of technical variability to define a technical variability threshold. This study is also the first to use technical variability to assess and compare the effects of temporal variability in a growing season, together with spatial variability in the field for several soil series under three cropping systems. These results would serve to promote the development of comprehensive assessment studies of soil health by integrating indicators that are derived from the microbial diversity of soils. The potential of indicators that are based on microbial composition can extend to all additional bioinformatics processing such as predictive functions or microbial network analyses. It is now undeniable that soil microbial ecology should have a significant effect on the development of better management practices that would promote sustainable agriculture.
Our main conclusions are:
● Confirmation that the most important source of technical variability was related to sampling and that it was recommended to use composites of soil cores at any given sampling point.
● The variability associated with the extraction phase can be used as a threshold to express treatment effects on agricultural soils.
● Variability of technical, spatial and temporal sources impacted more the diversity of fungi than of prokaryotes.
● The spatial and temporal sources of variability are influenced by the type of crop management.
● A better understanding of the impact of sources of variability in the diversity of microbial communities could make it possible to add microbial-based indicators to the list of soil health indicators.
Data availability statement
The data presented in the study are deposited via Mendeley data in the DOI: 10.17632/4td7fr39fr.1 repository, http://dx.doi.org/10.17632/4td7fr39fr.1. Any queries should be directed to the corresponding author.
Author contributions
TJ, RH, and JD’A-P contributed to conception and design of the study. TJ and JD’A-P organized the database. TJ performed the bioinformatic and statistical analysis. TJ wrote the first draft of the manuscript. All authors contributed to manuscript revision, read, and approved.
Funding
This project was made possible in part thanks to funding from the Quebec Agricultural Ministry (MAPAQ, ministère de l’Agriculture, des Pêcheries et de l’ Alimentation du Québec). The funders had no role in study design, data collection and analysis, decision to publish, or preparation of the manuscript.
Acknowledgments
We would like to thank Marc-Olivier Gasser and Catherine Bossé from IRDA for their contribution to sampling and soil characterization of the 11 fields and Mick Wu for his advice on statistical analysis. W.F.J. Parsons checked the English.
Conflict of interest
The authors declare that the research was conducted in the absence of any commercial or financial relationships that could be construed as a potential conflict of interest.
Publisher’s note
All claims expressed in this article are solely those of the authors and do not necessarily represent those of their affiliated organizations, or those of the publisher, the editors and the reviewers. Any product that may be evaluated in this article, or claim that may be made by its manufacturer, is not guaranteed or endorsed by the publisher.
Supplementary material
The Supplementary Material for this article can be found online at: https://www.frontiersin.org/articles/10.3389/fsoil.2022.945888/full#supplementary-material
References
1. Delgado-Baquerizo M, Oliverio AM, Brewer TE, Benavent-González A, Eldridge DJ, Bardgett RD, et al. A global atlas of the dominant bacteria found in soil. Science1979(20181979) 359:320–5. doi: 10.1126/science.aap9516
2. Orgiazzi A, Bardgett RD, Barrios E, Behan-Pelletier V, Briones MJI, Chotte JL, et al. Global Soil Biodiversity Atlas. European Commission. Publications of the European Union, Luxembourg (2016).
3. Xue PP, Carrillo Y, Pino V, Minasny B, McBratney AB. Soil properties drive microbial community structure in a Large scale transect in south Eastern Australia. Sci Rep (2018) 8(1):1–11. doi: 10.1038/s41598-018-30005-8
4. Bach EM, Williams RJ, Hargreaves SK, Yang F, Hofmockel KS. Greatest soil microbial diversity found in micro-habitats. Soil Biol Biochem (2018) 118:217–26. doi: 10.1016/j.soilbio.2017.12.018
5. Moebius-Clune BN, Moebius-Clune DJ, Gugino BK, Idowu OJ, Schindelbeck RR, Abawi GS. Comprehensive assessment of soil health – the Cornell framework. Edition 3.2. Geneva, NY: Cornell University (2016).
6. Fierer N, Wood SA, Bueno de Mesquita CP. How microbes can, and cannot, be used to assess soil health. Soil Biol Biochem (2021) 153:108111. doi: 10.1016/j.soilbio.2020.108111
7. Dunfield K, Hanner R, Newmaster S. Developing genomics tools as indicators of soil health and sustainable productive agriculture (2018). Available at: http://gfo.ca/research-projects/c2015ag07/.
8. Schmidt R, Gravuer K, Bossange A, Mitchell J, Scow K. Long-term use of cover crops and no-till shift soil microbial community life strategies in agricultural soil. PloS One (2018) 13(2):e0192953. doi: 10.1371/journal.pone.0192953
9. Overbeek W, Jeanne T, Hogue R, Smith DL. Effects of microbial consortia, applied as fertilizer coating, on soil and rhizosphere microbial communities and potato yield. Front Agron (2021) 3:714700. doi: 10.3389/fagro.2021.714700
10. Hermans SM, Buckley HL, Case BS, Curran-Cournane F, Taylor M, Lear G. Bacteria as emerging indicators of soil condition. Appl Environ Microbiol (2017) 83:e02826–16. doi: 10.1128/AEM.02826-16 http://scikit-bio.org/ (2022
11. Jeanne T, Parent S-E, Hogue R. Using a soil bacterial species balance index to estimate potato crop productivity. PloS One (2019) 14(3):e0214089. doi: 10.1371/journal.pone.0214089
12. Pennekamp F, Pontarp M, Tabi A, Altermatt F, Alther R, Choffat Y, et al. Biodiversity increases and decreases ecosystem stability. Nature (2018) 563:109–12. doi: 10.1038/s41586-018-0627-8
13. Lombard N, Prestat E, van Elsas JD, Simonet P. Soil-specific limitations for access and analysis of soil microbial communities by metagenomics. FEMS Microbiol Ecol (2011) 78:31–49. doi: 10.1111/j.1574-6941.2011.01140.x
14. Changey F, Blaud A, Pando A, Herrmann AM, Lerch TZ. Monitoring soil microbial communities using molecular tools: DNA extraction methods may offset long-term management effects. Eur J Soil Sci (2021) 72:1026–41. doi: 10.1111/ejss.13026
15. Baker KL, Langenheder S, Nicol GW, Ricketts D, Killham K, Campbell CD, et al. Environmental and spatial characterisation of bacterial community composition in soil to inform sampling strategies. Soil Biol Biochem (2009) 41:2292–8. doi: 10.1016/j.soilbio.2009.08.010
16. Prosser JI. Replicate or lie. Environ Microbiol (2010) 12:1806–10. doi: 10.1111/j.1462-2920.2010.02201.x
17. Yeates C, Gillings MR, Davison AD, Altavilla N, Veal DA. Methods for microbial DNA extraction from soil for PCR amplification. Biol Procedures. Online May. 1998-April 1999. (1998) 1:40–7. doi: 10.1251/bpo6
18. Lee AJ, Park Y, Doing G, Hogan DA, Greene CS. Correcting for experiment-specific variability in expression compendia can remove underlying signals. GigaScience (2020) 9(11):giaa117. doi: 10.1093/gigascience/giaa117
19. Blainey P, Krzywinski M, Altman N. Replication. Nat Methods (2014) 11:879–80. doi: 10.1038/nmeth.3091
20. Cui C, Singh SP, Staicu A, Reich BJ. Bayesian Variable selection for high-dimensional rank data. Environmetrics (2021) 32:e2682. doi: 10.1002/env.2682
21. Lennon JT. Replication, lies and lesser‐known truths regarding experimental design in environmental microbiology. Environmental Microbiology (2011) 13(6):1383–6.
22. Pollard TJ, Chen I, Wiens J, Horng S, Wong D, Ghassemi M, et al. Turning the crank for machine learning: ease, at what expense? The Lancet Digital Health (2019) 1(5):e198–9.
23. Ji BW, Sheth RU, Dixit PD, Huang Y, Kaufman A, Wang HH, et al. Quantifying spatiotemporal variability and noise in absolute microbiota abundances using replicate sampling. Nat Methods (2019) 16:731–6. doi: 10.1038/s41592-019-0467-y
24. Ramirez KS, Knight CG, de Hollander M, Brearly FQ, Constantinides B, Cotton A, et al. Detecting macroecological patterns in bacterial communities across independent studies of global soils. Nat Microbiol (2017) 3:189–96. doi: 10.1038/s41564-017-0062-x
25. Gotelli NJ, Chao A. Measuring and estimating species richness, species diversity, and biotic similarity from sampling data. Encyclopedia. Biodiversity. (2013), 195–211. doi: 10.1016/B978-0-12-384719-5.00424-X
26. Lauber CL, Ramirez KS, Aanderud Z, Lennon J, Fierer N. Temporal variability in soil microbial communities across land-use types. ISME. J (2013) 7:1641–50. doi: 10.1038/ismej.2013.50
27. Carini P, Delgado-Baquerizo M, Hinckley E-LS, Hollandmoritz H, Brewer TE, Rue G, et al. Effects of spatial variability and relic DNA removal on the detection of temporal dynamics in soil microbial communities. mBio (2020) 11:e02776–19. doi: 10.1128/mBio.02776-19
28. Aitchison J, Barceló-Vidal C, Martín-Fernández JA, Pawlowsky-Glahn V. Logratio analysis and compositional distance. Math Geology. (2000) 32:271–5. doi: 10.1023/A:1007529726302
29. Lozupone C, Knight R. UniFrac: a new phylogenetic method for comparing microbial communities UniFrac: a new phylogenetic method for comparing microbial communities. Appl Environ Microbiol (2005) 71:8228–35. doi: 10.1128/AEM.71.12.8228
30. Albright MBN, Martiny JBH. Dispersal alters bacterial diversity and composition in a natural community. ISME. J (2018) 12:296–9. doi: 10.1038/ismej.2017.161
31. Plassart P, Prévost-Bouré NC, Uroz S, Dequiedt S, Stone D, Creamer R, et al. Soil parameters, land use, and geographical distance drive soil bacterial communities along a European transect. Sci Rep (2019) 9:605. doi: 10.1038/s41598-018-36867-2
32. Maestrini B, Basso B. Drivers of within-field spatial and temporal variability of crop yield across the US Midwest. Sci Rep (2018) 8(1):1–9. doi: 10.1038/s41598-018-32779-3
33. Norris CE, Bean G, Cappellazzi SB, Cope M, Greub KLH, Liptzin D, et al. Introducing the north American project to evaluate soilhealth measurements. Agron J (2020) 112:3195–215. doi: 10.1002/agj2.20234
34. IRDA, MAPAQ. Étude sur l’état de santé des sols agricoles du québec [A study on the health of agricultural soils in Quebec] (2019). Available at: https://www.irda.qc.ca/en/research-projets/soil-health-study/.
35. Lamontagne L, Nolin MC. Dossier des noms de sols du québec 1997. In: SISCan. système d’information des sols au Canada. Sainte-Foy (Qc), Canada: Agriculture et Agroalimentaire Canada (1997). Équipe pédologique du Québec, Centre de recherches et de développement sur les sols et les grandes culturesDirection générale de la recherche.
36. Canadian Agricultural Services Coordinating Committee, Soil Classification Working Group, National Research Council Canada, Canada, Agriculture, & Agri-Food Canada. Research Branch. (1998). The Canadian system of soil classification (No. 1646). NRC Research Press.
37. Apprill A, McNally S, Parsons R, Weber L. Minor revision to V4 region SSU rRNA 806R gene primer greatly increases detection of SAR11 bacterioplankton. Aquat Microbial. Ecol (2015) 75:129–37. doi: 10.3354/ame01753
38. Parada AE, Needham DM, Fuhrman JA. Every base matters: assessing small subunit rRNA primers for marine microbiomes with mock communities, time series and global field samples. Environ Microbiol (2016) 18:1403–14. doi: 10.1111/1462-2920.13023
39. Bokulich NA, Mills DA. Improved selection of internal transcribed spacer-specific primers enables quantitative, ultra-high-throughput profiling of fungal communities. Appl Environ Microbiol (2013) 79:2519–26. doi: 10.1128/AEM.03870-12
40. Fierer N, Jackson JA, Vilgalys R, Jackson B, Jackson RB. Assessment of soil microbial community structure by use of taxon-specific quantitative PCR assays. Appl Environ Microbiol (2005) 71:4117–20. doi: 10.1128/AEM.71.7.4117
41. Emerson JB, Keady PB, Brewer TE, Clements N, Morgan EE, Awerbuch J, et al. Impacts of flood damage on airborne bacteria and fungi in homes after the 2013 Colorado front range flood. Environ Sci Technol (2015) 49:2675–84. doi: 10.1021/es503845j
42. Bolyen E, Rideout JR, Dillon MR, Bokulich NA, Abnet C, Al-Ghalith GA, et al. Reproducible, interactive, scalable, and extensible microbiome data science using QIIME2. Nat Biotechnol (2019) 37:852–7. doi: 10.1038/s41587-019-0209-9
43. Callahan BJ, McMurdie PJ, Rosen MJ, Han AW, Johnson AJA, Holmes SP. DADA2: High-resolution sample inference from illumina amplicon data. Nat Methods (2016) 13:581–3. doi: 10.1038/nmeth.3869
44. Martin M. Cutadapt removes adapter sequences from high-throughput sequencing reads. EMBnet. J (2011) 17:10–2. doi: 10.14806/ej.17.1.200
45. Oksanen J, Blanchet FG, Kindt R, Legendre P, Minchin PR, O’hara RB, et al. Package ‘vegan’. Community ecology package (2013) 2(9):1–295.
46. Anderson MJ. A new method for non-parametric multivariate analysis of variance. Austral Ecol (2001) 26:32–46. doi: 10.1111/j.1442-9993.2001.01070.pp.x
48. Shannon CE. A mathematical theory of communication. Bell. System. Tech J (1948) 27:379–423. doi: 10.1002/j.1538-7305.1948.tb01338.x
49. Chao A, Shen T-J. Nonparametric estimation of shannon’s index of diversity when there are unseen species in sample. Environ Ecol Stat (2003) 10:429–43. doi: 10.1023/A:1026096204727
50. Lanzén A, Lekang K, Jonassen I, Thompson EM, Troedsson C. DNA Extraction replicates improve diversity and compositional dissimilarity in metabarcoding of eukaryotes in marine sediments. PloS One (2017) 12(6):e0179443. doi: 10.1371/journal.pone.0179443
51. Dopheide A, Xie D, Buckley TR, Drummond AJ, Newcomb RD. Impacts of DNA extraction and PCR on DNA metabarcoding estimates of soil biodiversity. Methods Ecol Evol (2019) 10(1):120–33. doi: 10.1111/2041-210X.13086
52. Brooks JP, Edwards DJ, Harwich MD, Rivera MC, Fettweis JM, Serrano MG, et al. The truth about metagenomics: quantifying and counteracting bias in 16S rRNA studies. BMC Microbiol (2015) 15(1):1–14. doi: 10.1186/s12866-015-0351-6
53. Thakur MP, van der Putten WH, Wilschut RA, Veen GC, Kardol P, van Ruijven J, et al. Plant–soil feedbacks and temporal dynamics of plant diversity–productivity relationships. Trends Ecol Evol (2021) 36(7):651–61. doi: 10.1016/j.tree.2021.03.011
54. Daryanto S, Fu B, Wang L, Jacinthe PA, Zhao W. Quantitative synthesis on the ecosystem services of cover crops. Earth-Science. Rev (2018) 185:357–73. doi: 10.1016/j.earscirev.2018.06.013
55. Vukicevich E, Lowery T, Bowen P, Úrbez-Torres JR, Hart M. Cover crops to increase soil microbial diversity and mitigate decline in perennial agriculture. a review. Agron Sustain Dev (2016) 36(3):1–14. doi: 10.1007/s13593-016-0385-7
Keywords: MiSeq amplicon sequencing, soil microbiome, crop management, soil health and quality, technical variability
Citation: Jeanne T, D’Astous-Pagé J and Hogue R (2022) Spatial, temporal and technical variability in the diversity of prokaryotes and fungi in agricultural soils. Front. Soil Sci. 2:945888. doi: 10.3389/fsoil.2022.945888
Received: 17 May 2022; Accepted: 14 July 2022;
Published: 04 August 2022.
Edited by:
Thiago Gumiere, Laval University, CanadaReviewed by:
Dennis Goss-Souza, Federal Institute of Education, Science and Technology of Paraná, BrazilArthur Prudêncio De Araujo Pereira, Federal University of Ceara, Brazil
Diogo Paes da Costa, Federal University of Agreste of Pernambuco (UFAPE), Brazil
Copyright © 2022 Jeanne, D’Astous-Pagé and Hogue. This is an open-access article distributed under the terms of the Creative Commons Attribution License (CC BY). The use, distribution or reproduction in other forums is permitted, provided the original author(s) and the copyright owner(s) are credited and that the original publication in this journal is cited, in accordance with accepted academic practice. No use, distribution or reproduction is permitted which does not comply with these terms.
*Correspondence: Thomas Jeanne, dGhvbWFzLmplYW5uZUBpcmRhLnFjLmNh