 Alice May Orme1,2Markus Lange1Simon Andreas Schroeter1Marcus Wicke3Olaf Kolle1Georg Pohnert2Gerd Gleixner1*
- 1Molecular Biogeochemistry, Max Planck Institute for Biogeochemistry, Jena, Germany
- 2Bioorganic Analytics, Institute for Inorganic and Analytical Chemistry, Friedrich Schiller University, Jena, Germany
- 3Zwillenberg-Tietz Foundation, Linde Research Station, Märkisch Luch, State of Brandenburg, Germany
Future climate scenarios indicate increasing drought intensity that threatens ecosystem functioning. However, the behavior of ecosystems during intense drought, such as the 2018 drought in Northern Europe, and their respective response following rewetting is not fully understood. We investigated the effect of drought on four different vegetation types in a temperate climate by analyzing dissolved organic matter (DOM) concentration and composition present in soil leachate, and compared it to two accompanying years. DOM is known to play an important role in ecosystem recovery and holds information on matter flows between plants, soil microorganisms and soil organic matter. Knowledge about DOM opens the possibility to better disentangle the role of plants and microorganisms in ecosystem recovery. We found that the average annual DOM concentration significantly decreased during the 2018 drought year compared to the normal year. This suggests a stimulation of DOM release under normal conditions, which include a summer drought followed by a rewetting period. The rewetting period, which holds high DOM concentrations, was suppressed under more intense drought. Our detailed molecular analysis of DOM using ultrahigh resolution mass spectrometry showed that DOM present at the beginning of the rewetting period resembles plant matter, whereas in later phases the DOM molecular composition was modified by microorganisms. We observed this pattern in all four vegetation types analyzed, although vegetation types differed in DOM concentration and composition. Our results suggest that plant matter drives ecosystem recovery and that increasing drought intensity may lower the potential for ecosystem recovery.
Introduction
Drought puts great pressure on ecosystems and can have devastating ecological and economic effects by, for example, accelerating tree mortality and decreasing agricultural yields (1). To predict the effects of future droughts, we need to understand the respective response of ecosystems (2). The extreme drought in 2018, which broke both meteorological and hydrological records, affected much of Northern Europe. As a result, there was an increase in tree mortality in affected regions (3). However, this extreme event provided a rare opportunity to study environments that are not normally exposed to such severe conditions. Monitoring the effects of drought on plant-soil-microorganism interactions may give some insight into the effect of drought on ecosystems (4, 5). Terrestrial ecosystem functioning depends in part on the organic matter released by plants, which serves as an energy source for the soil community, and the respective plant available nutrients that the soil community can provide by decomposing soil organic matter (6). The majority of these interactions occur in the dissolved phase (7). However, the effect of drought on the concentration and composition of molecules in the dissolved phase has received little attention.
Dissolved organic matter (DOM) gives insights into plant-soil-microorganism interactions. DOM is a dissolved, mobile pool of organic compounds that allows easy nutrient shuttling between plants, soil and microorganisms. DOM is important in the carbon cycle (8) and differs in concentration and composition between ecosystems and seasons (9, 10) due to different inputs, and biotic and abiotic transformations (11). Thus, due to the rapidly changing nature of DOM, it reflects the ecosystem processes occurring and can be used to understand ecosystem responses to external factors such as drought.
In temperate regions such as Central Europe, soils are usually drier in summer than in other seasons, which is followed by a wetter season during the late autumn and winter (12). The DOM concentration and composition reflect the ecosystem response to the normal summer drought. It is well-recorded that there is a peak in DOM concentration following rewetting of dried surface soils (13, 14), which is reflected in the seasonal pattern of DOM concentration (10). The magnitude of this DOM rewetting peak is increased upon increasing drought duration and intensity (15) (16), however, release of plant matter is variable at high drought intensity (17). This suggests a variable response of ecosystems to increased drought intensities with respect to the DOM concentration where plants play a key role, which is not yet fully understood.
The plant-related response may be reflected in the DOM composition. Under normal, non-drought, non-rewetting conditions, the main contribution to DOM comes from soil organic matter (SOM) (18). However, plants continue to release organic matter during drought, which accumulates in soil during the dry period due to lack of transport and low microbial activity. This results in a flush of plant organic matter following rewetting (18–20). Upon rewetting, the plant matter can then be used by microorganisms as an energy source, kick-starting the interaction between microorganisms and plants, which can aid in plant recovery from drought (5, 19). Release of plant organic matter via DOM is an important ecosystem response during rewetting following normal summer drought conditions and increasing likelihood of extreme droughts highlights the importance of studying the ecological response following more intense drought (17). DOM molecular composition and therefore the interaction of the different DOM sources can be analyzed using high resolution mass spectrometry (HR-MS). This technique has been used successfully in the past to characterize DOM in a variety of different ecosystems (11, 21) (22). HR-MS allows the prediction of molecular formulae, which give an overview of the molecular composition. Given the different organic matter sources and abiotic conditions, the molecular compositions vary between ecosystems, which can be observed using HR-MS (23). This can lead to a better understanding of the sources of DOM and transformations occurring as this is reflected in the molecular composition (21).
We monitored DOM concentration and composition present in soil leachate of four different vegetation types of one ecosystem over a wet year, a normal year, and a drought year (24). We therefore investigated the effect of drought on DOM concentration to obtain information regarding how this ecosystem responds to drought. We tested the hypothesis that more intense drought would decrease the DOM concentration present due to a reduced contribution of plant matter to the DOM pool triggered by drought conditions. We further hypothesized a large contribution of plant matter to the DOM pool following rewetting, which decreases with time after rewetting while the contribution of microbially processed compounds increase. This would further indicate that plant matter is being released and that it re-engages the plant-soil-microorganism interactions. We tested this hypothesis by analyzing the DOM molecular composition during the rewetting period after the extreme 2018 drought using HR-MS.
Material and Methods
Study Site
The study site is run by the Zwillenberg-Tietz Foundation in Northeast Germany (Linde, Brandenburg 52°32’41” N 12°40’4” E, altitude 52 m). At this site, there are four vegetation types: grassland, oak (Quercus robur), beech (Fagus sylvatica), and pine (Pinus sylvestris) woodland (Figure S2). The soils at the site have developed on aeolian sands and have characteristics of podzols and arenosols (25) (World Reference Base for Soil Resources), and the surface soils have a pH between 4.1 and 4.8 (26). Each vegetation type has three sites equipped with sintered glass suction plates (pore size 1−1.6 µm, 1 cm thickness, 12 cm in diameter; UMS, Germany) at 5 and 10 cm depth. Each suction plate is connected with a Teflon tube to a glass sampling bottle. The pressure in the sampling bottles was reduced to 50 mbar below the soil water tension so that the freely draining soil leachate was collected (27). Soil leachate samples are collected every two weeks. Litter layer depth was measured directly above each site. A nearby weather station (52°32’43” N 12°39’34” E, altitude 38 m) records precipitation (heated rain gauge, Thies, Germany), air temperature, air humidity (Temperature-humidity-sensor IAK, Mela, Germany) and soil moisture at 10 cm depth (Soil Moisture Probe ML3, ThetaProbe, Delta-T, United Kingdom) every ten minutes. Periods of dry, rewetting and moist conditions were determined using soil moisture data. The onset of dry periods was defined as when the soil moisture began to fall below average soil moisture. The point of rewetting was defined by the point at which the soil moisture reached a level above average soil moisture and the rewetting period was defined as the two months after this due to variations in the exact point of rewetting between sites. Moist periods were defined as the time after the rewetting period where soil moisture was above average soil moisture. The dry period of 2017 was not particularly dry so soil moisture often exceeded average soil moisture. In this case, the rewetting period was attributed to that occurring during the winter as this was comparable to the other, drier years and all measurements taken during the summer were considered to be taken during the dry period. For the subset for DOM composition analysis, sample collection began following the point of rewetting in December 2018 and samples were collected fortnightly until March 2019. Collected samples were stored at -20°C until analysis. For the purpose of investigating the effect of drought on ecosystems, we classed a year as beginning with a dry period, followed by a rewetting and then moist period. The potential evapotranspiration (PET) and precipitation (PPT) volume were used to determine the weather conditions of each year relative to average for the region (24). PET was calculated from water vapor deficit at 14.00 daily using the Haude equation (28):
where f is the Haude factor and es – ea is the water vapor deficit (mm).
DOM Concentration
Dissolved organic carbon (DOC) concentration was used as a proxy for DOM concentration. Samples were filtered to < 0.3 µm using pre-combusted (500°C for 5 hours) glass-fibre filters (Sterlitech, USA). Prior to measurement of the original samples, 200 μL hydrochloric acid (10%, Sigma-Aldrich) was added to 10 mL of each sample. DOC concentration was measured using a TOC analyzer (vario TOC cube, Elementar, Germany). For DOC concentration measurement of solid phase extracted DOM, which were dissolved in methanol (see below), 1 mL of extract was placed in a pre-combusted (500°C for 5 hours) glass vial and left to evaporate. 10 mL purified water (Milli-Q Advantage A10) and 200 μL hydrochloric acid (10%, Sigma-Aldrich) were added to the evaporated samples and the samples analyzed as described above.
DOM Extraction and Mass Spectrometric Analysis
DOM extraction was performed using PPL cartridges (styrene-divinylbenzene polymer, Agilent, Germany) according to well-established protocols (29). Prior to analysis, an aliquot of each sample was diluted to give a final solvent composition of 50% methanol (HiPerSolv CHROMANORM, VWR, Germany)/50% purified water (Milli-Q Advantage A10) with a final DOM concentration of 20 mg C/L. 100 µL of each sample was injected into an Orbitrap Elite (Thermo Scientific) for mass spectrometric analysis using an ultra-high performance liquid chromatography system (Dionex Unltimate 3000) with a flow of 20 µL/min of 50% methanol (HiPerSolv CHROMANORM, VWR)/50% purified water (Milli-Q Advantage A10). No separation column was used. Spectra were acquired in negative mode at an ESI needle voltage of 3 kV. An average of 130 scans of m/z 100 - 1000 were acquired per sample, these scans were then combined into one averaged mass spectrum using Thermo Xcalibur (Version 3.0.63). Only m/z signals with intensities above a signal to noise ratio of 5 were treated as true signals.
Data Processing
An internal recalibration and sum formula assignment was performed on the averaged mass spectra post-measurement using an internal MATLAB script (9.7.0.1190202 (R2019b)) originally developed for another study (30). Only m/z values between 100 – 750 were used as there were very few signals above m/z 750. Sum formula assignment was performed with the following conditions: C ≤ 50, H ≤ 100, O ≤ 40, N ≤ 3, S ≤ 1. From this, hydrogen to carbon ratio (H/C), oxygen to carbon ratio (O/C), carbon to nitrogen ratio (C/N), modified Aromaticity Index (AI(mod)) (31), nominal oxidation state of carbon (NOSC) (32) and the difference between double bond equivalency and number of oxygen atoms (DBE-O) (33) could be calculated. Molecular formulae were only considered if present in > 10% of the samples from all sites. Sum formulae were considered implausible and were excluded if they exceeded the following thresholds: AI(mod) between 1 and -1, H/C between 0.3 and 2.2, O/C < 1 (34), DBE-O between 10 and -10 (35), and NOSC between 3 and -3.
Data Analysis and Visualisation
All data analyses and visualizations were performed in R 4.0.3 (36) using the packages base 4.0.3 (36), vegan 2.5-7 (37), lme4 (38), emmeans 1.7.0 (39), stats 4.0.3 (36) and ecodist 2.0.7 (40). All graphs were plotted using ggplot2 3.3.5 (41).
Variables considered to affect DOM concentration were explored with linear mixed models (LMM) using the lmer function in package lme4. Flux per square meter were calculated by multiplying DOM concentration, sample volume and area of the suction plate used to collect the samples. Fluxes were also examined using LMM. LMM were created using the step-wise inclusion of fixed effects, beginning with a null model, which included the identity of the sampling site as a random effect to account for repeat measurements from each site. Vegetation type, sampling depth, period (dry, rewetting, moist) and year (wet, normal, drought) were all treated as fixed effects and were added sequentially. The following interaction terms were then sequentially added: vegetation type x period, depth x period, year x period, year x depth and year x type. The maximum likelihood (ML) method was applied and likelihood ratio tests (χ2) were used to indicate the fixed effects that significantly improved each model using the anova function in the stats package. P values also showed fixed effects that significantly improved the model. To identify the specific differences observed, for example, whether beech or oak had the highest DOM concentration, and if this was significant, pairwise comparisons were performed. For the pairwise comparisons, estimated marginal means of the relevant model fitted with restricted maximum likelihood (REML) were used with the emmeans function in the emmeans package. The HSD-Tukey adjustment was used.
Principal coordinate analysis (PCoA) was used to compare the DOM of the subset of samples taken for compositional analysis between December 2018 and March 2019, and look for spatial and temporal trends in the molecular composition. Prior to PCoA of DOM molecular composition, the Hellinger transformation was applied to the mass lists processed as described above to normalize the data and reduce the explanatory power of low intensity peaks (42). The vegdist function in the vegan package was then used to calculate the Bray-Curtis dissimilarity and the eigenvalues calculated using the pco function of the ecodist package. The relative intensity-weighted mean of parameters ((H/C)w, (O/C)w, (C/N)w, (AI(mod))w, and (m/z)w) were then calculated using the function weighted.mean in stats. The relative intensity-weighted means and the number of days following the point of rewetting were then used to calculate environmental factors, which were fitted onto the ordination plot using the envfit function in the vegan package. The resulting projections show the maximum level of correlation with the chemical composition of the samples.
Correlations of molecular formulae over time were used to determine which types of molecules were increasing in abundance and which were decreasing. Pearson correlation of absolute intensity of each sum formula with number of days following rewetting was applied to the refined mass lists using the cor function of base.
Results
DOM concentration varied both within and between years and vegetation types (Figure 1). With respect to average precipitation and potential evapotranspiration in Germany, 2017/2018 was a wet year, 2018/2019 was a dry year, and 2019/2020 was a normal year (24) (Figure S1). For ease of understanding, they are hereafter described as wet year (2017/2018), normal year (2019/2020) and drought year (2018/2019).
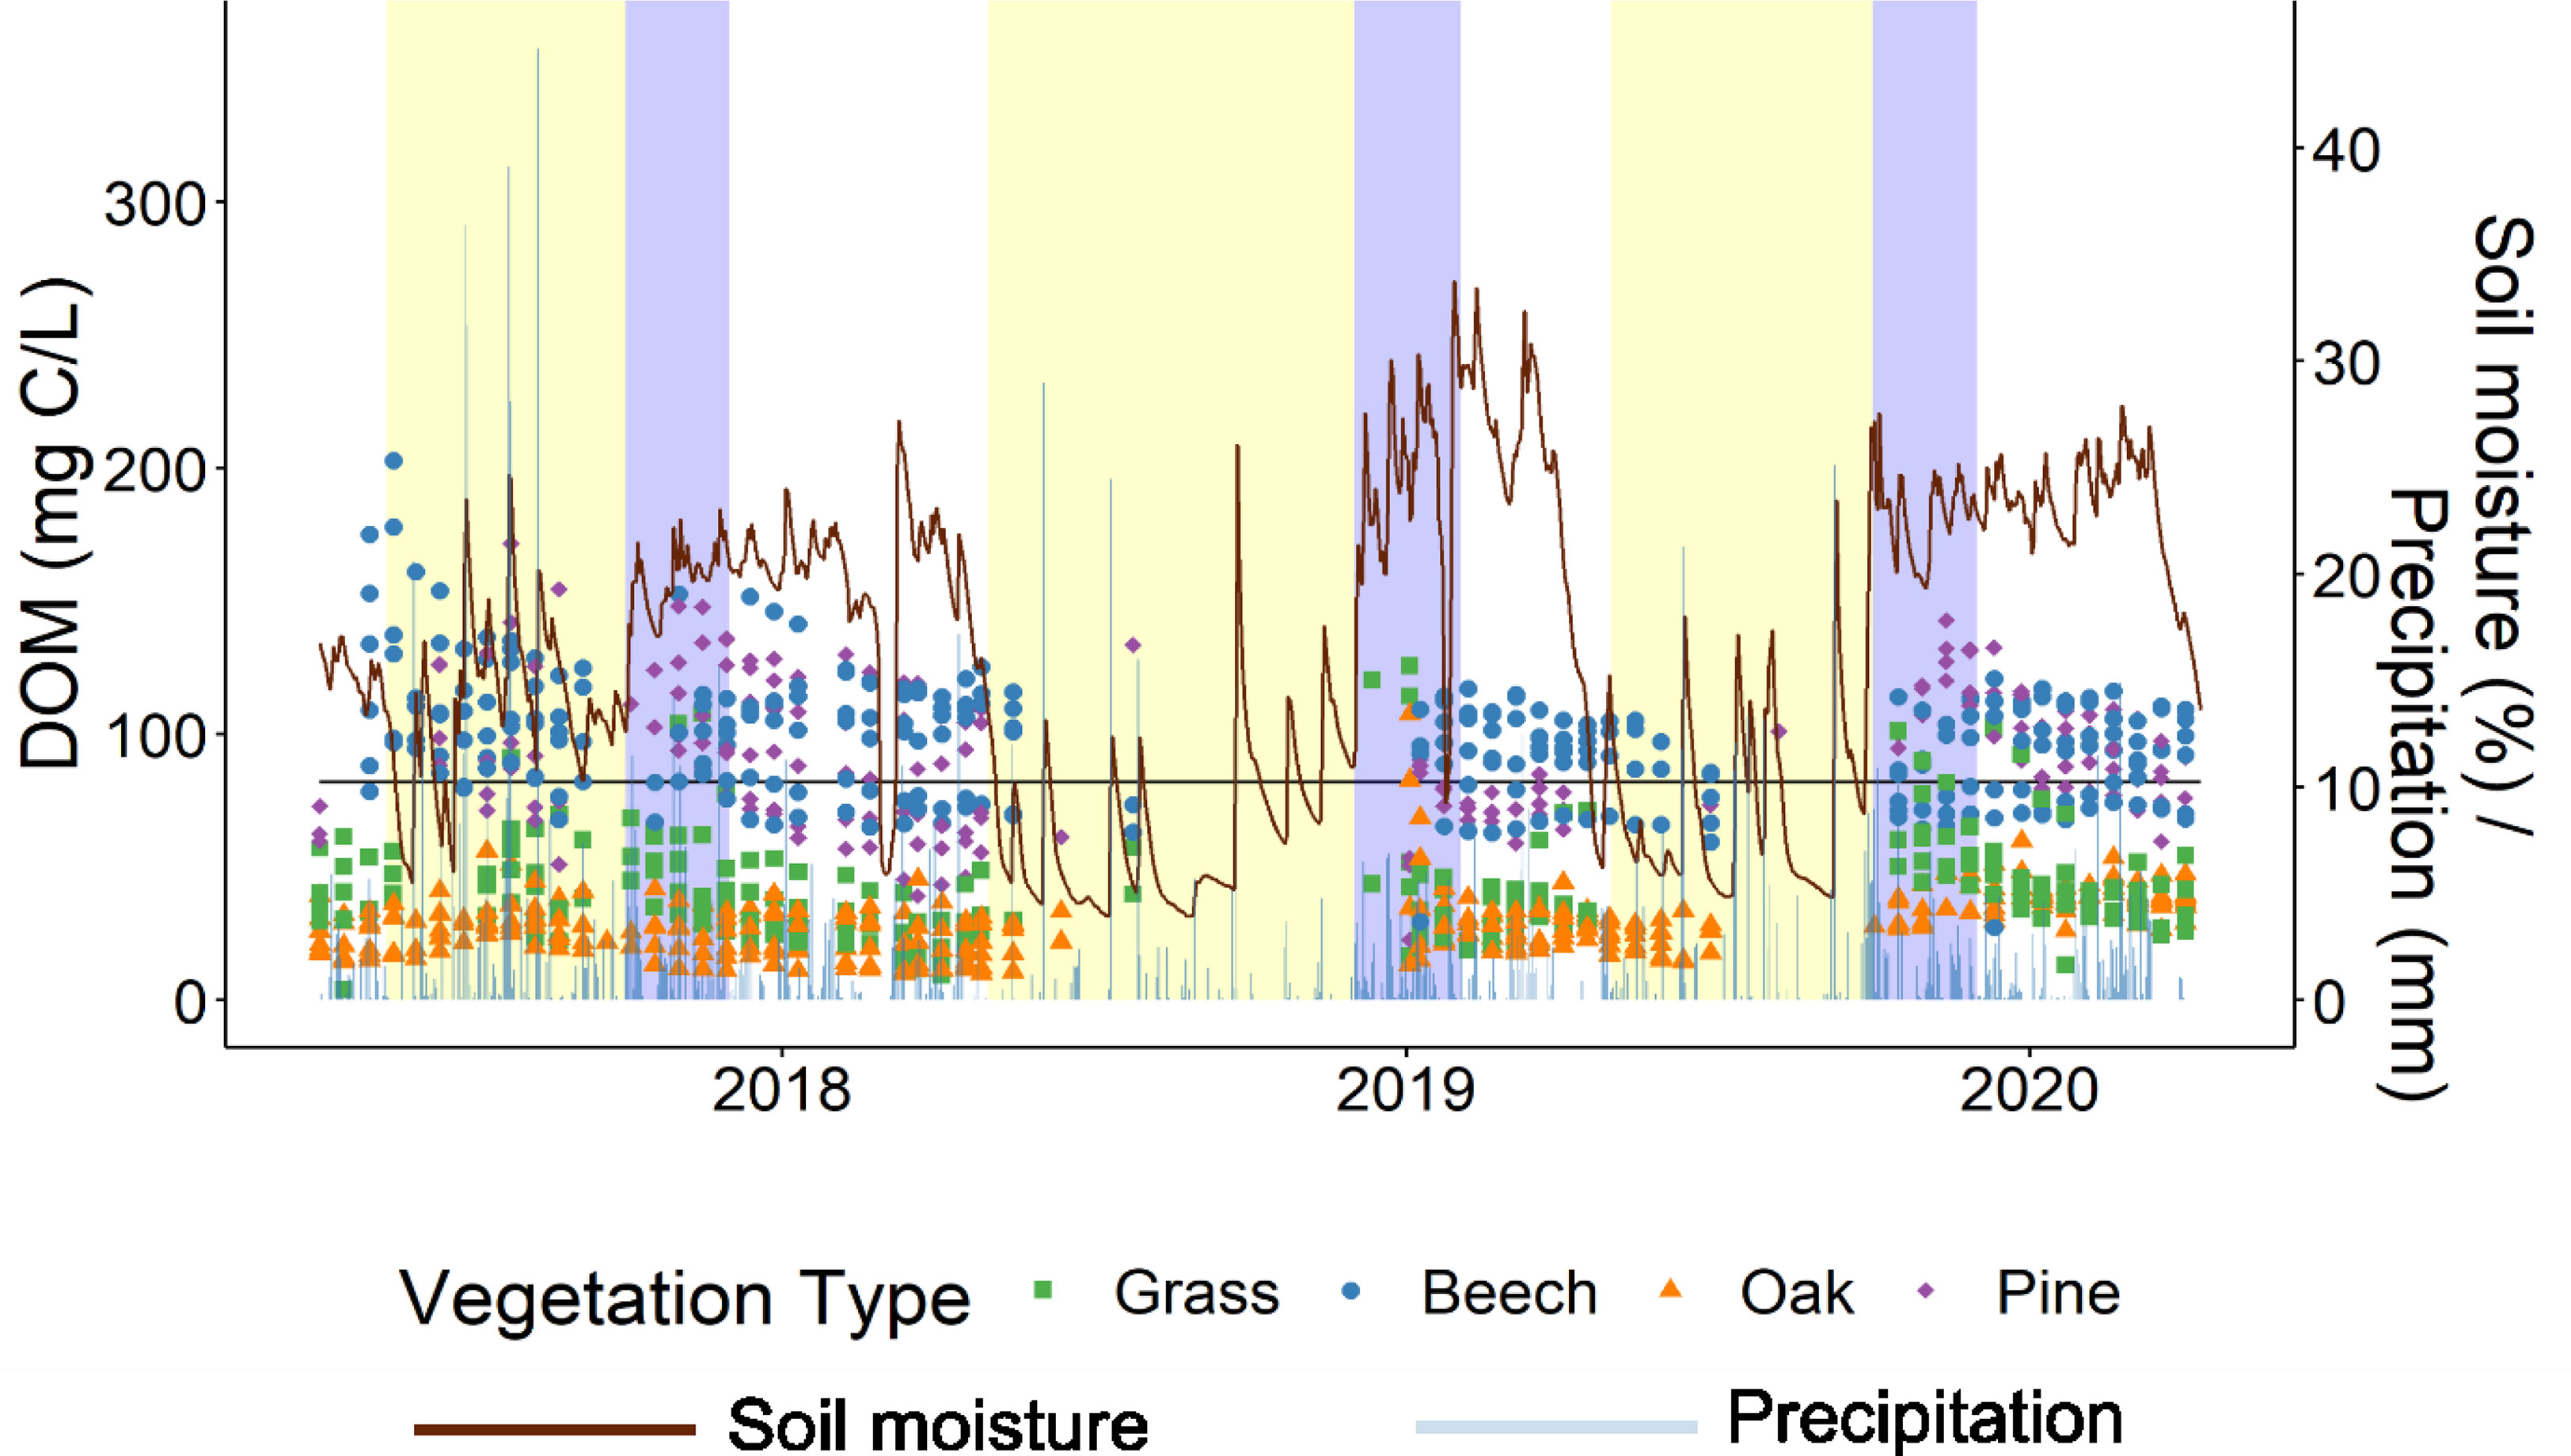
Figure 1 DOM concentration per vegetation type between 2017 and 2021. Soil moisture (red) and precipitation (light blue) data are also plotted. Yellow periods indicate dry conditions, blue indicates rewetting conditions and white indicates moist conditions. Dry conditions and the point of rewetting were determined relative to the average soil moisture marked here as a black horizontal line. Rewetting conditions were determined as occurring for two months after the point of rewetting due to variation in the actual point of rewetting between different ecosystems.
The LMM showed that vegetation type, period, and year all have a significant effect on DOM concentration (Table 1). DOM concentration during different periods of the year varied depending on vegetation type and year but was not influenced by sampling depth (Table 1). As indicated by the significant interaction terms in the LMM, DOM concentration during different years depends on vegetation type, but not on sampling depth (Table 1). The DOM flux LMM showed similar results as the DOM concentration LMM with the exception of depth and the interaction term between depth and period, which were only significant in the DOM flux LMM (Table 1). The sample volume LMM showed similar results to the DOM flux with the exception of the interaction term between vegetation type and period (Table 1).
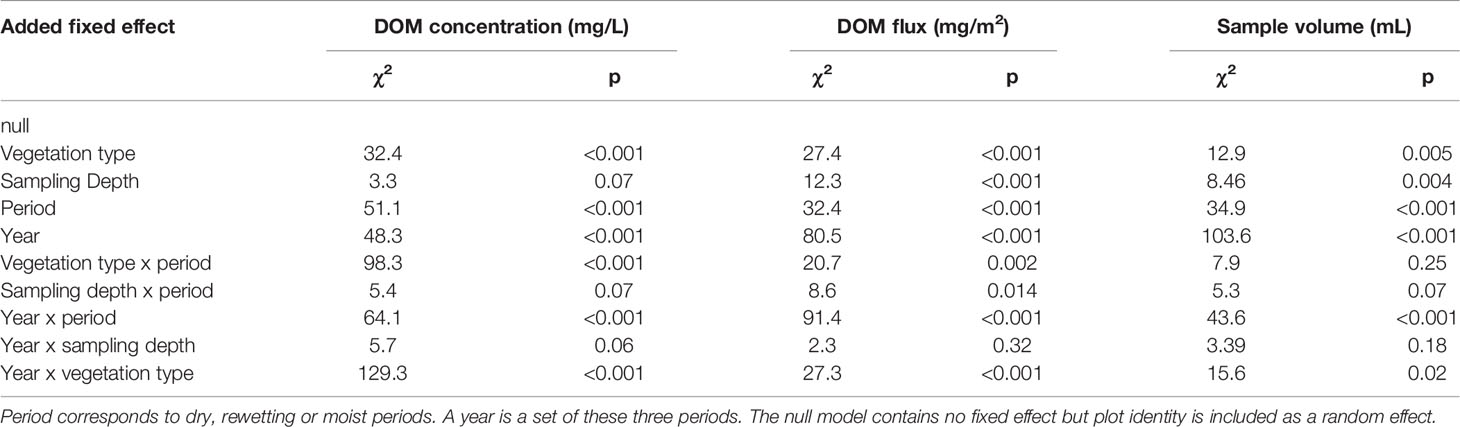
Table 1 Summary of the linear mixed models testing for factors significantly influencing DOM concentration, DOM flux and sample volume.
During the normal year, the DOM concentration was significantly higher than during the wet and drought years, which had similar DOM concentrations (Figure 2). However, the DOM flux during the wet year was greatest, followed by the normal year, then the drought year; all differences were significant (Table S1). The average sample volume collected was greatest during the wet year, and similar during the normal and drought years (Table S2). Although the results look like the DOM concentration of the wet year is closer to that of the normal year than the drought year, the differences shown were calculated using LMM, which accounts for non-independence of the data due to repeat sampling from the same well.
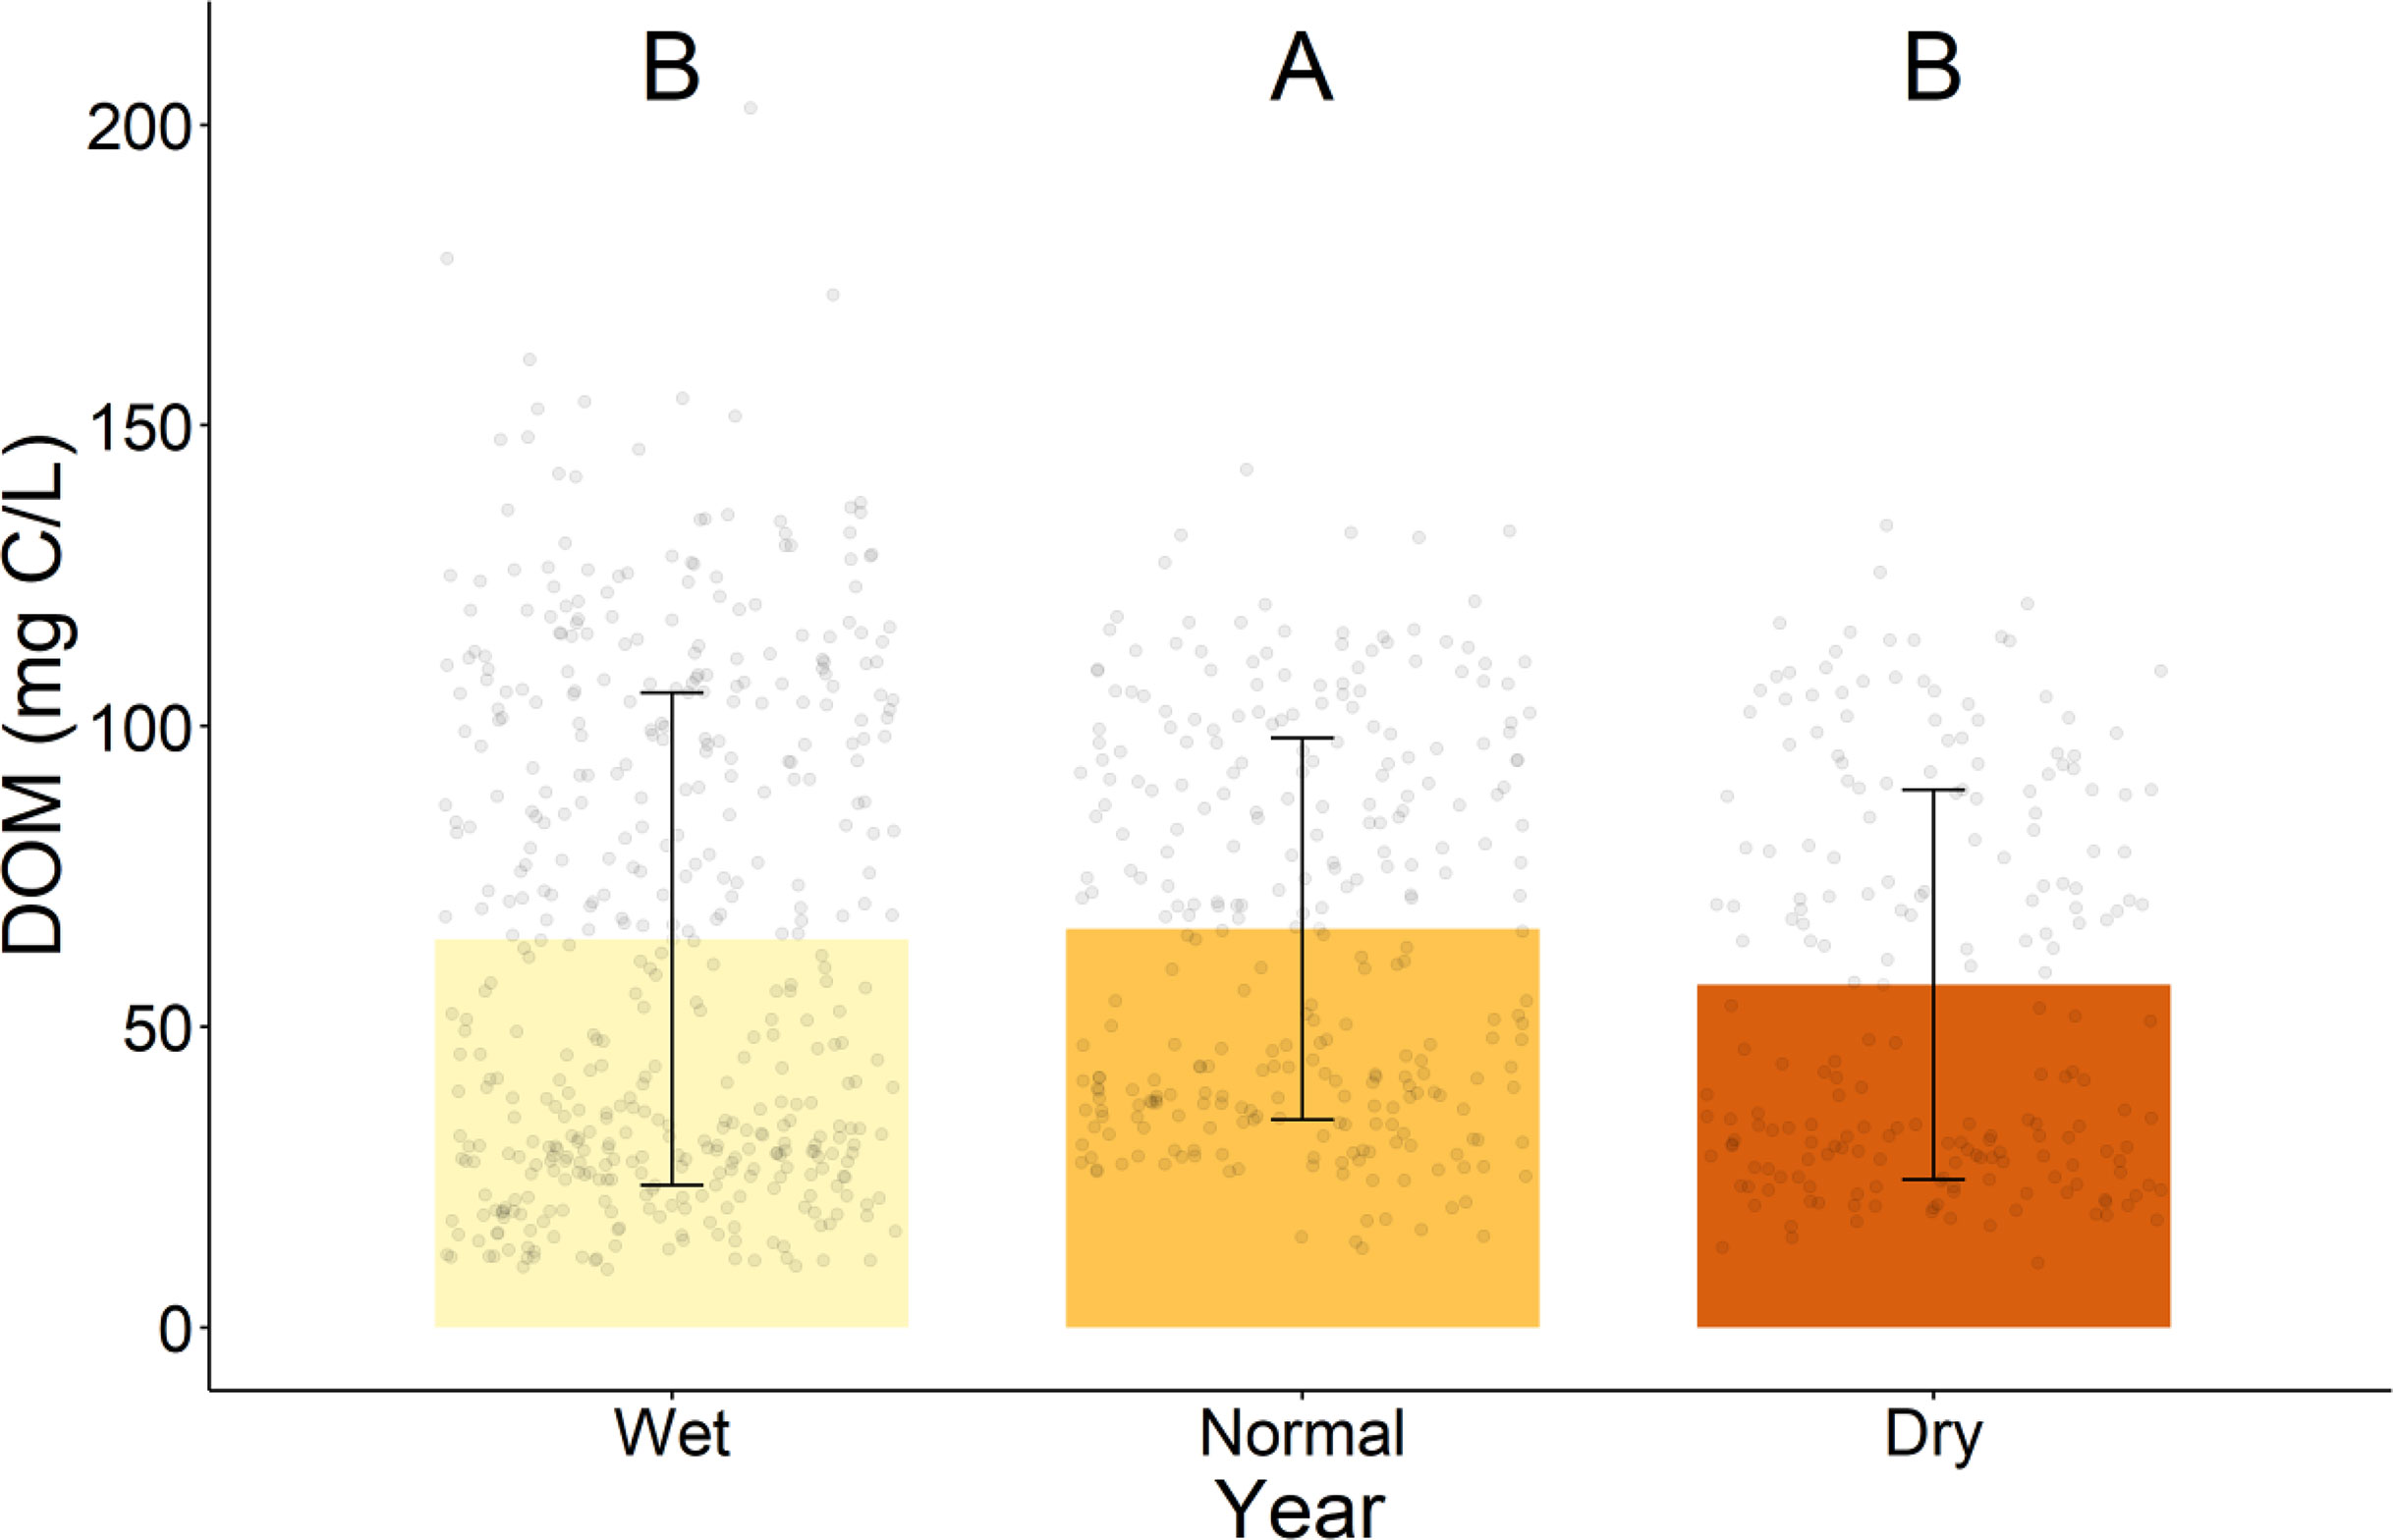
Figure 2 Average and standard deviation of DOM concentration between years. Uppercase letters indicate statistically significant differences between years. Significant differences were determined by linear mixed models and Tukey-adjusted p-values for estimated marginal means (p < 0.05). Outlier calculation was not performed as there is temporal and spatial variation within each group which could be wrongly interpreted as outliers.
There was a rewetting peak during the normal year, evident through a significant increase in the DOM concentration between the dry and rewetting periods, and a slight decrease during the moist period (Figure 3). We did not observe a rewetting peak during the wet year; the DOM concentration during the dry period was similarly high to that of the rewetting period, although the moist period contained significantly lower DOM concentrations. There was also no rewetting peak during the drought year, as there was little change in the average DOM concentration between the different periods of the year.
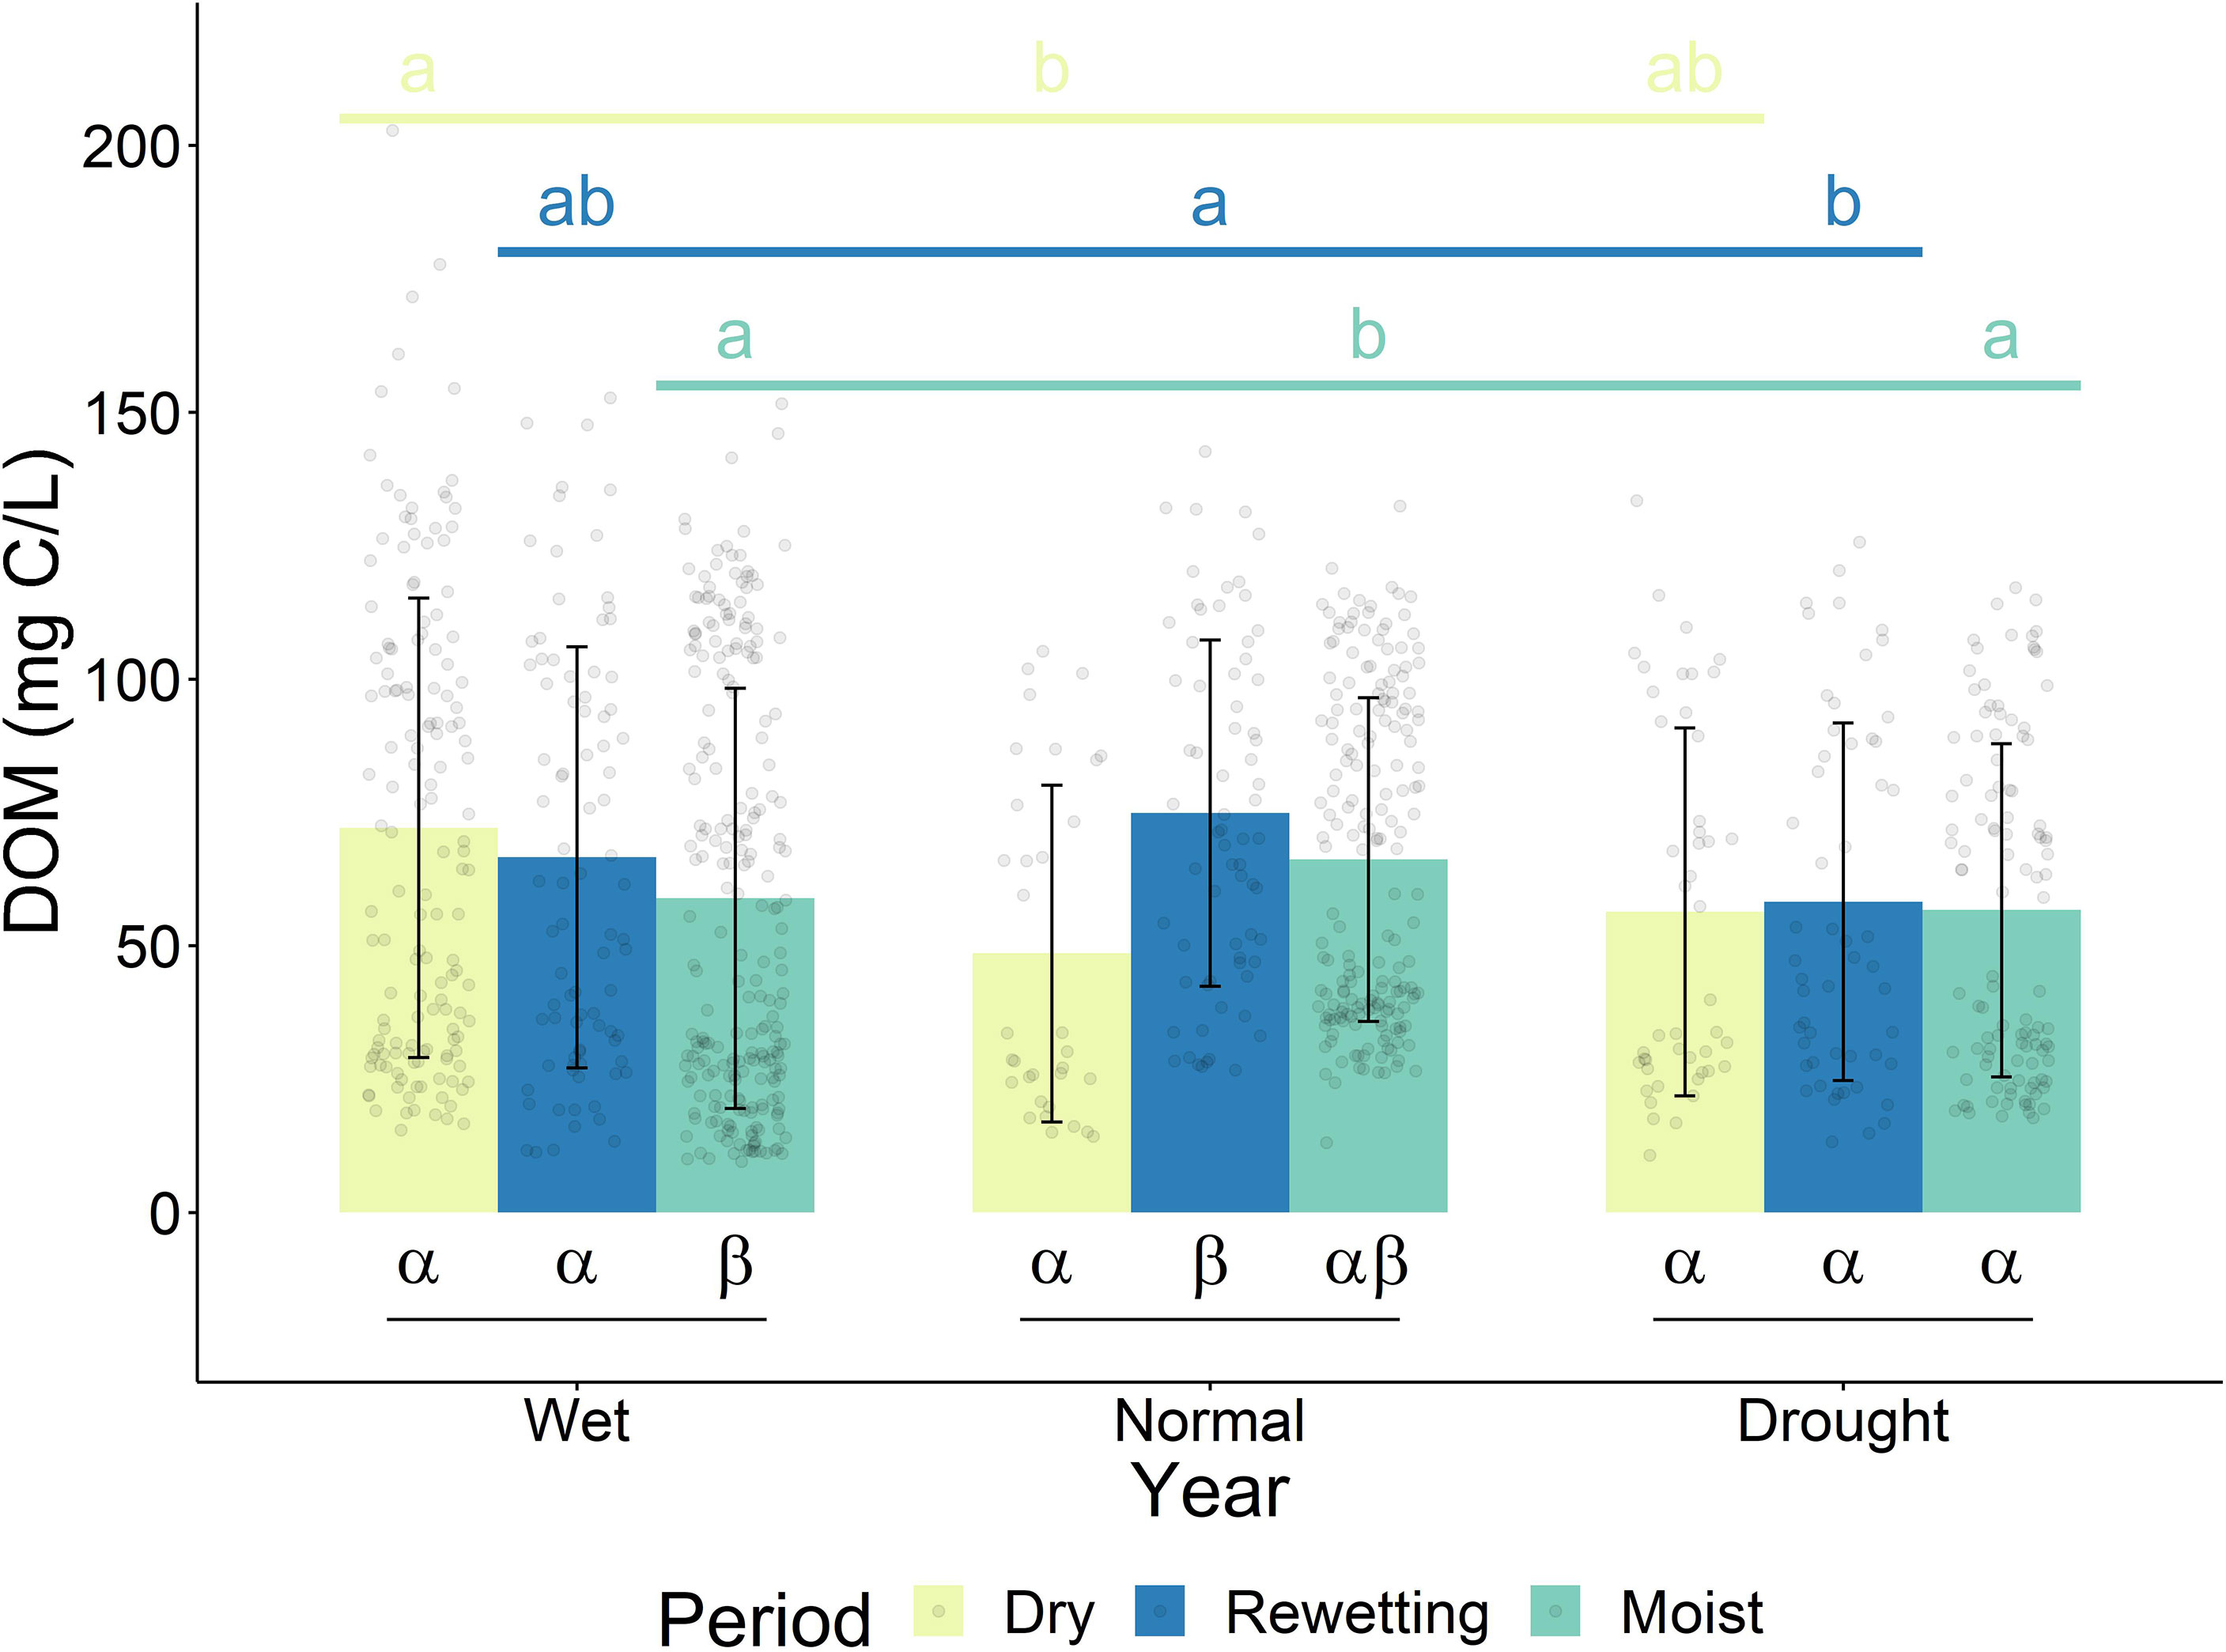
Figure 3 Average and standard deviation of DOM concentration in different years at 5 and 10 cm depth. Greek letters show statistically significant differences in DOM concentration within years. Lowercase letters indicate statistically significant differences between the same period of different years. Periods indicate different periods of the year. Significant differences were determined by linear mixed models and Tukey-adjusted p-values for estimated marginal means (p < 0.05). Outlier calculation was not performed as there is temporal and spatial variation within each group which could be wrongly interpreted as outliers.
The overall lower DOM concentration during the wet year relative to the normal year (Figure 2) was caused by a significantly lower DOM concentration during the moist period and slightly lower DOM concentration during the rewetting period (Figure 3). The significantly higher DOM concentration during the dry period of the wet year compared to the normal year was not enough to compensate for the lower DOM concentrations during the other periods of the year (Figure 3). We observed a different trend during the drought year. The overall decrease in DOM concentration of the drought year relative to the normal year was caused by a significant decrease during the rewetting and moist periods (Figure 3), whereas DOM concentrations in the dry period were similar in drought and normal years. The different seasonal trends in the wet and drought years that caused similar average DOM concentrations are also evident in DOM fluxes. The overall flux was highest in the wet year and lowest in the drought year (Table S1), however, this effect was mainly driven by the availability and volume of the collected water (Table S2).
The overall large variability of DOM concentrations within and between the years is mainly caused by the great variation of DOM concentrations between the vegetation types analyzed (Table 1). DOM concentrations were similar in beech and pine woodland (p = 0.98), and in oak woodland and grassland (p = 0.22) but all other combinations of vegetation types were significantly different (p < 0.05; Table S3). The vegetation types with the greatest DOM concentrations – pine and beech – also had greater litter layer thickness and more acidic soils than the vegetation types with lower DOM concentrations – oak and grassland (Table S4).
Despite the difference in DOM concentration, the pattern of DOM concentration between years and periods of the year in pine, oak and grassland was similar to the overall trends we observed. However, the pattern of DOM concentration between years and periods of the year in beech, the site with the highest DOM concentration and greatest litter depth, was different to the overall trends (Figure 4). Relative to the normal year, the wet and drought years caused a decrease in DOM concentration in grassland, oak and pine, in line with the overall trend observed (Figure 2). However, at the beech woodland site, the normal year had the lowest DOM concentration of all years (Figure 4). Vegetation types also responded differently during different periods of the year with respect to DOM concentration. Beech woodland had the lowest DOM concentration during the rewetting period, whereas the DOM concentration was highest during the rewetting period in all other vegetation types, in line with the overall trend (Table S3). DOM concentration alone is not enough to determine the driving factors of the higher DOM concentration during the rewetting period, DOM composition, however, can give further insights.
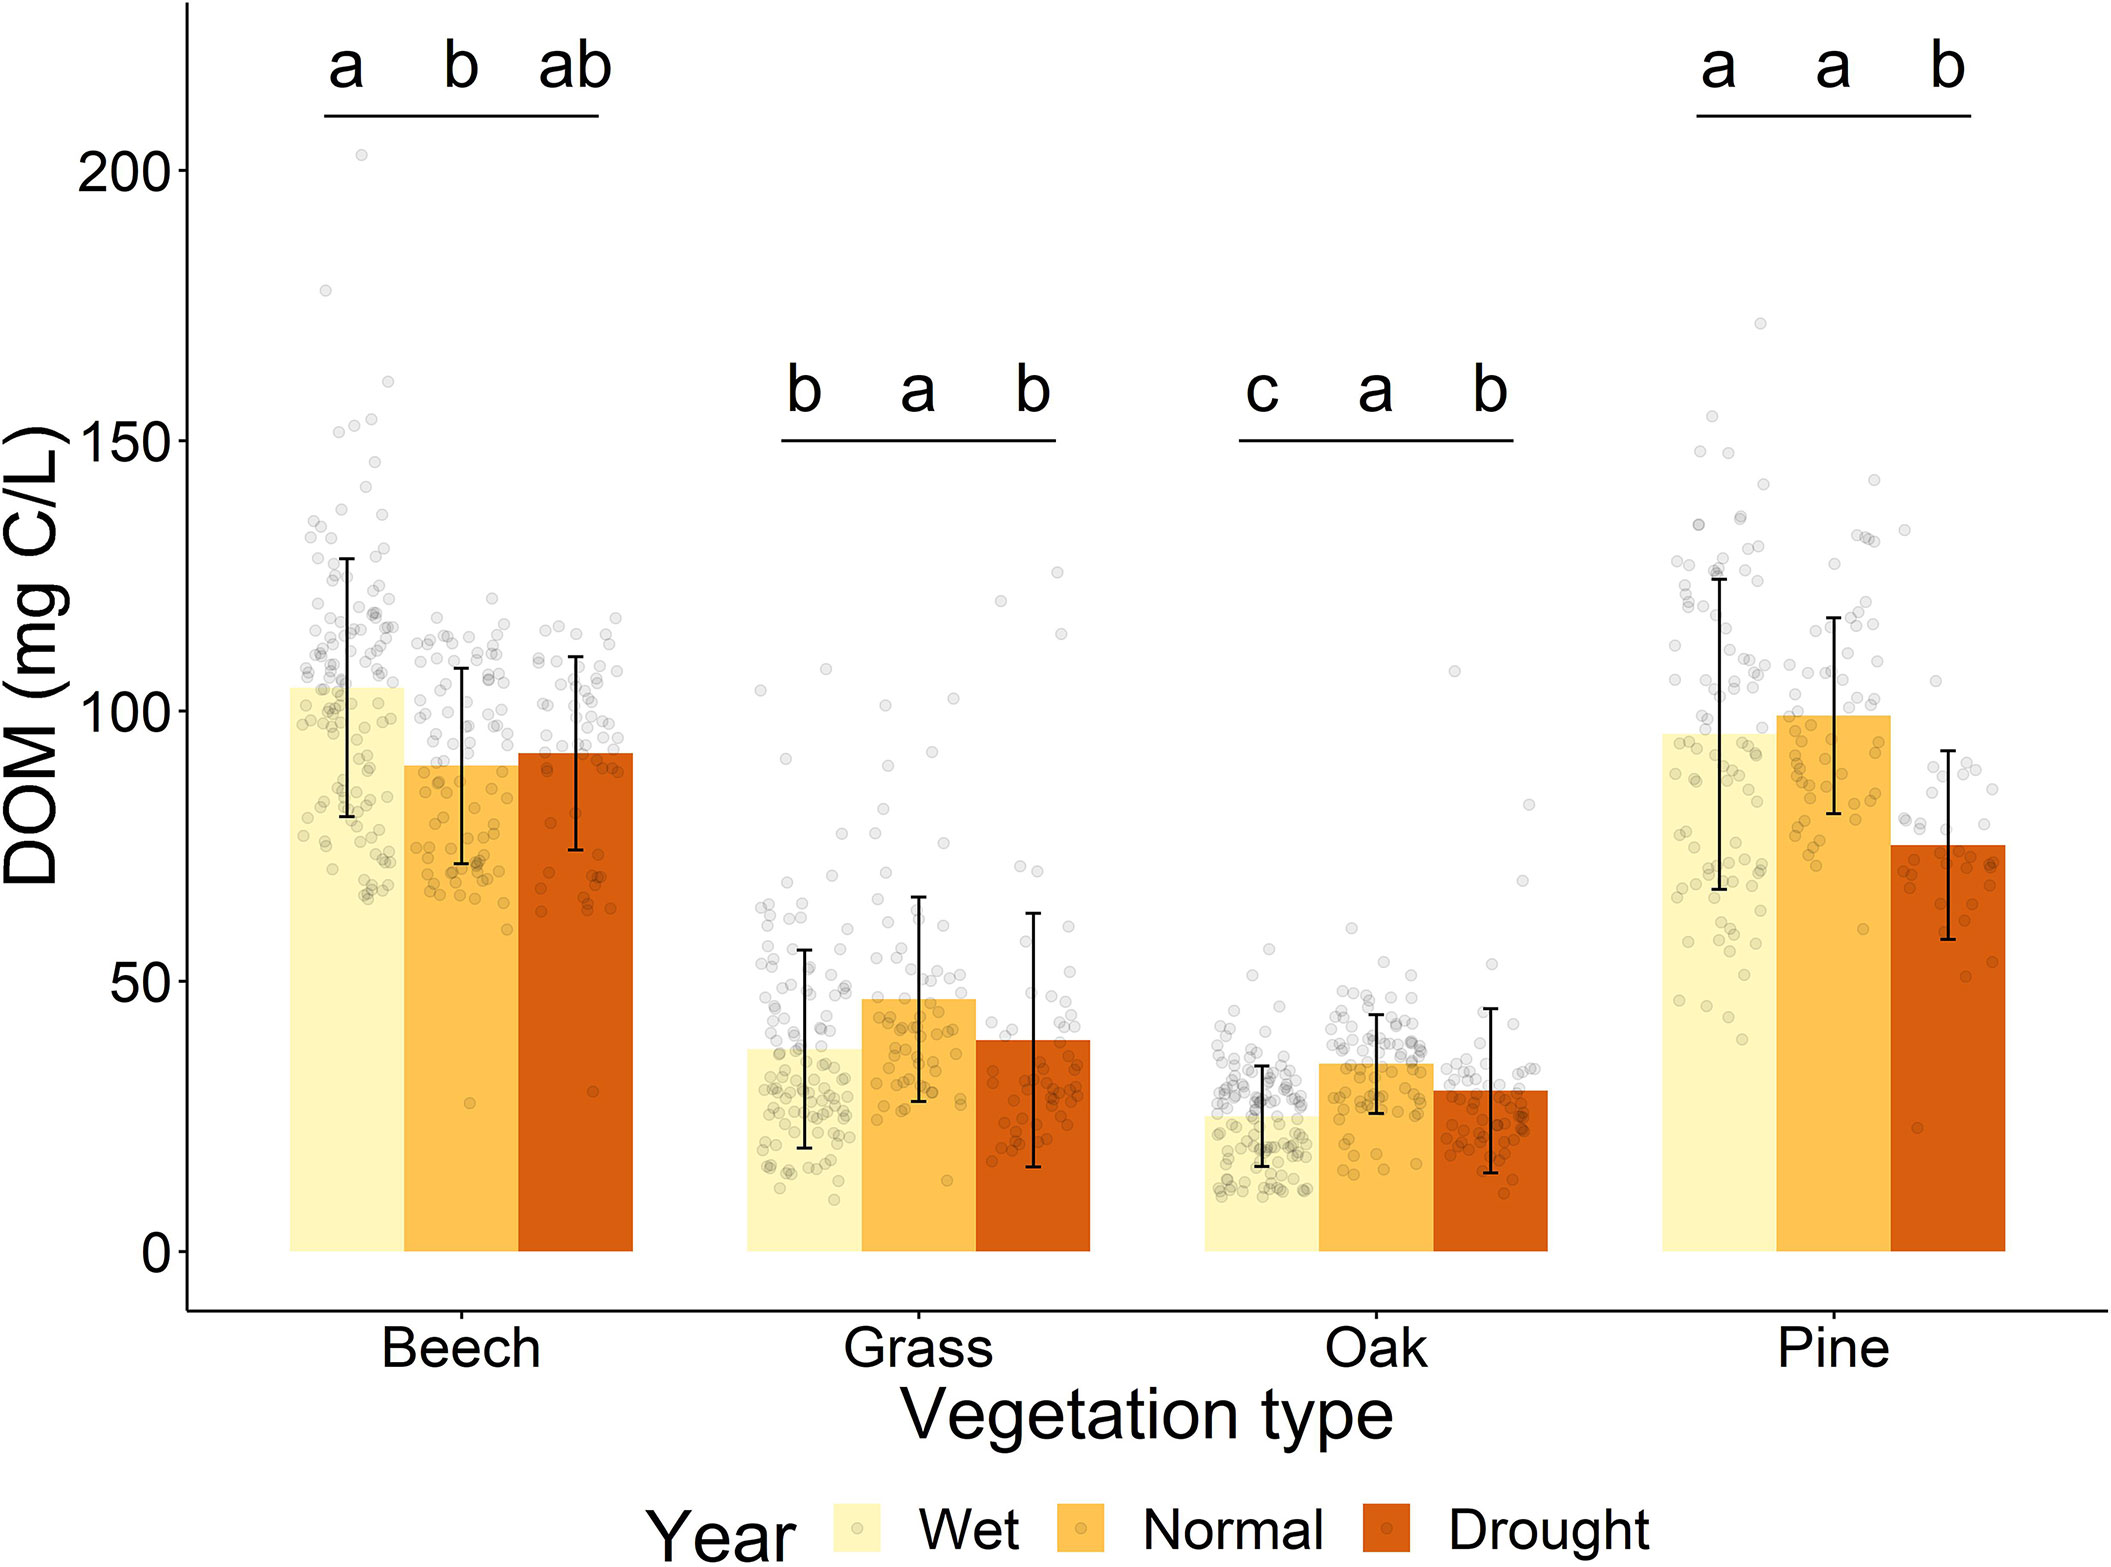
Figure 4 DOM concentration at 5 and 10 cm depth of different vegetation types. Letters show statistically significant differences in DOM concentration within vegetation types. Significant differences were determined by linear mixed models and Tukey-adjusted p-values for estimated marginal means (p < 0.05). Outlier calculation was not performed as there is temporal variation within each group which could be wrongly interpreted as outliers.
The molecular composition of DOM separated the different vegetation types in the principal coordinate analysis well (Figure 5). PC1 explains 32% of variance, separating the different vegetation types, suggesting that the difference in DOM composition between vegetation types is greater than the changes in DOM composition following a rewetting event. The vegetation-related PC1 is best explained by C/N, O/C and m/z. Higher C/N indicates less nitrogen, higher O/C indicates more oxygen in the DOM. Grassland DOM contains more nitrogen, less oxygen and has a smaller molecular size than the woodland sites. Woodland sites are further separated with pine and beech woodlands containing less nitrogen, more oxygen and metabolites with a greater molecular size. As reflected by the DOM concentrations above, pine and beech woodland are separated from oak and grassland by the PC1 axis. However, oak and grassland are separated by the PC1 axis, which was not true for the average DOM concentration, as shown above. Pine and beech, which are not separated by PC1, are well-separated by PC2.
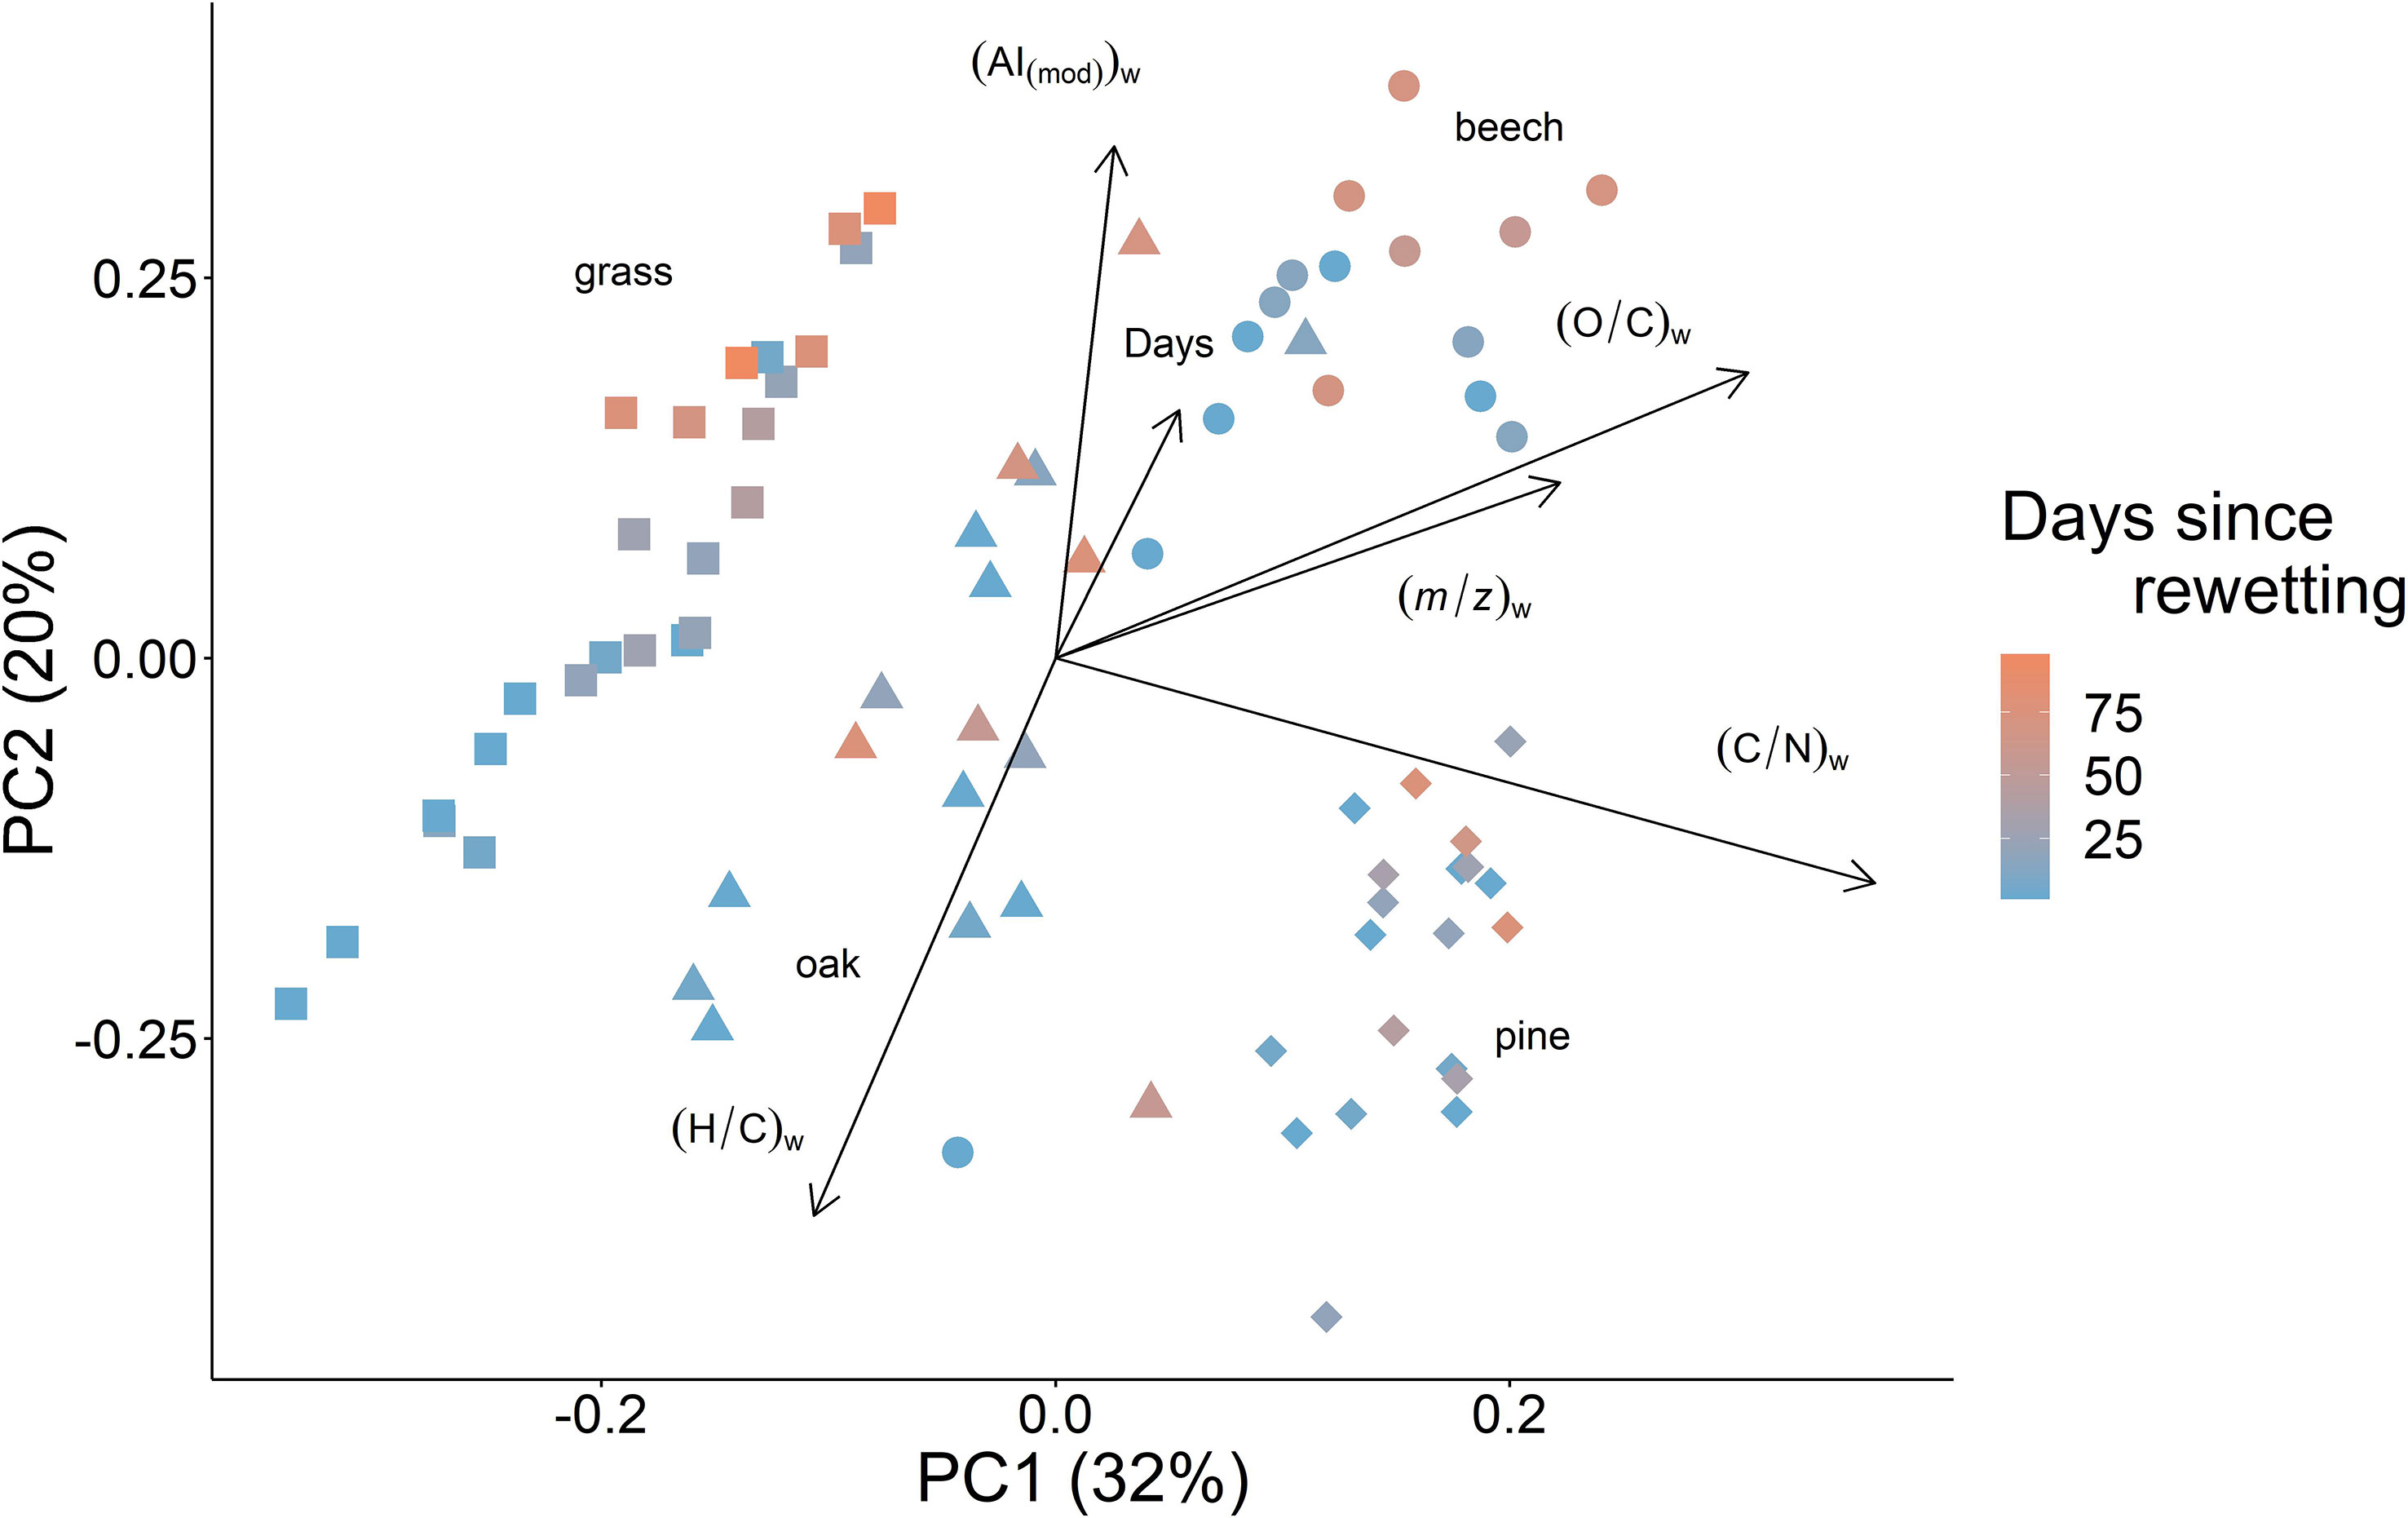
Figure 5 Principal coordinate analysis (PCoA) plot of sum formulae and their relative intensities at 5 and 10 cm depth. Color indicates the number of days following rewetting from 0 to 98 days after the 2018 summer drought. “Days” is also plotted as an environmental variable to better visualize the overall trend. The weighted mean of carbon to nitrogen ratio (C/N)w, mass to charge ratio (m/z)w, oxygen to carbon ratio (O/C)w, hydrogen to carbon ratio (H/C)w and modified aromaticity index (AI(mod))w (31) are also plotted as environmental variables. All plotted environmental variables are significant (p < 0.05) and, with the exception of “Days” were calculated using the weighted mean as described in the “Date Analysis and Visualisation” section of “Materials and Methods”. Weighted average values for each sample are reported in Table S5.
DOM molecular composition varied with the number of days following the rewetting along PC2 (Figure 5). On the time-related PC2, all vegetation types changed similarly over time following rewetting. We observed an increase in AI(mod), and a decrease in H/C, with a small contribution also from O/C and m/z. However, C/N appears to have little to no correlation with the temporal changes observed in DOM following rewetting.
The pattern of increasing and decreasing absolute intensities in the van Krevelen space (H/C vs O/C elemental ratios) reflects the results of the multivariate analysis (Figure 6). The major trend is a decrease in relatively high H/C, low O/C sum formulae. This supports our PCoA above, as this would cause an overall increase in O/C and decrease in H/C (Figure 5). There are more sum formulae decreasing than increasing over time after rewetting. Many of the sum formulae that decrease over time are found in the area of the van Krevelen space that is occupied by common root exudates, implying that there is a release of root exudates upon rewetting, which then decreases over time (43)(Figure 6). However, this is only an indication as many different compound classes of different origins can be found in the same area of the van Krevelen space as common root exudates. Although most of the high H/C sum formulae are decreasing over time following rewetting, there is an increase in high H/C, low O/C sum formulae in the lipidic region of the van Krevelen space. This is also only an indication as many different types of compound classes could be found in the same region of the van Krevelen space (44). Most of the sum formulae increasing in intensity over time are in the low H/C, high O/C area of the van Krevelen space, which is often attributed to lignin and tannin compounds, where there are also some sum formulae decreasing in intensity over time (44). Despite the lack of a rewetting peak in DOM concentration during the drought year, we suggest that the rewetting peak was not completely suppressed and we observed the DOM compositional changes that usually occur following rewetting.
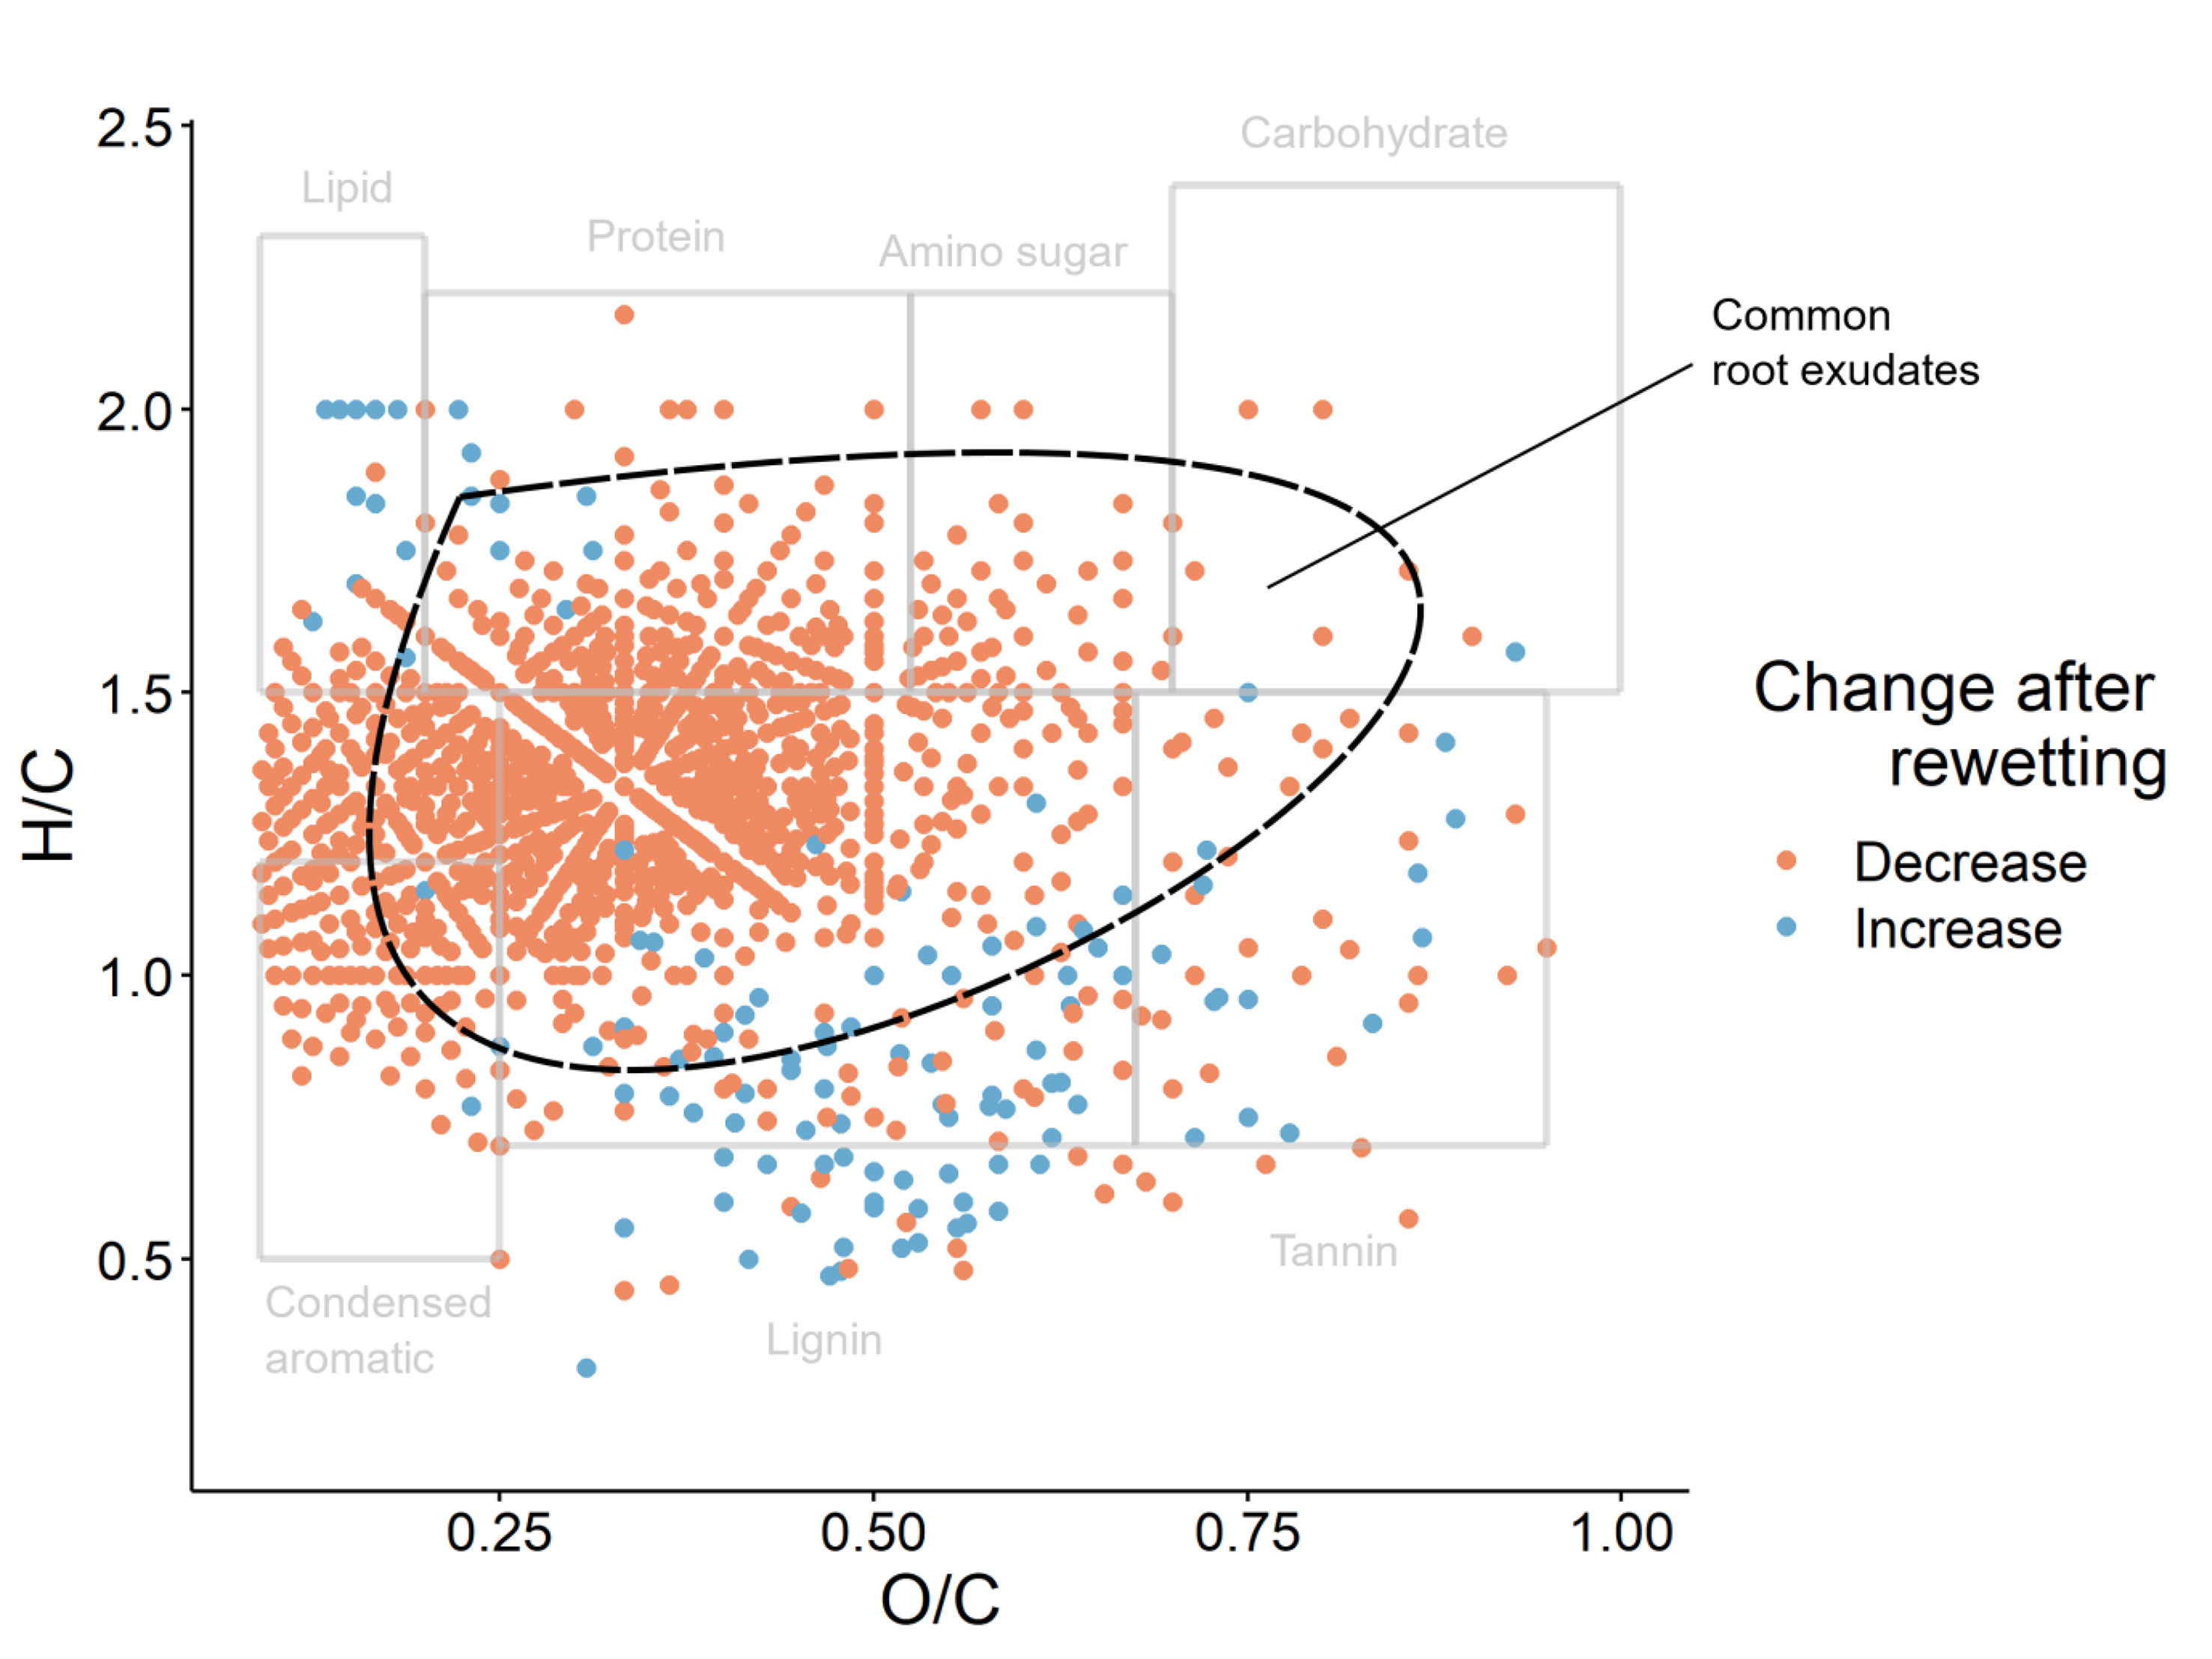
Figure 6 Van Krevelen plot of sum formulae with a significant correlation with time after rewetting (p < 0.05). Grey boxes indicate areas of the van Krevelen plot that are commonly populated by certain compound classes (42). The area where common root exudates are found is marked by a dashed black line (41).
Discussion
We analyzed the DOM concentration during different years, including a drought year, to better understand the response of ecosystems to drought. We expected the DOM concentration to decrease with drought due to reduced plant productivity. As hypothesised, the drought year caused a decrease in DOM concentration. We also analyzed changes in DOM composition during the rewetting period from a grassland and three forest areas following rewetting in the drought year. The changes in DOM composition from the initial point of rewetting onwards indicated that there was a degradation of plant matter. We attributed this to an initial release of non-microbially processed plant matter such as root exudates and soluble lignin breakdown products, which were processed by microorganisms over time.
Wet and drought years caused a similar decrease in DOM concentration compared to the normal year. At first look, this appears unexpected as it suggests a similar response of ecosystems during wet and drought years, relative to normal conditions. The DOM flux gave us more insight into this. The wet year had the greatest DOM flux, indicating that the overall decrease in concentration relative to the normal year is a result of dilution as the collected sample volume was greater in the wet year. Contrastingly, the drought year had the lowest DOM flux, suggesting that the observed decrease in DOM concentration relative to the normal year was a result of decreased absolute quantity of DOM. As plant growth is reduced under drought conditions (45), we attributed the overall decrease in DOM to a reduced input from plants under drought conditions. It could be a direct link; less input of fresh plant matter contributing to the DOM, therefore there is simply less DOM. Or it could be an indirect link due to the creation of fewer “hotspots” of increased microbial activity which would result in a reduction of the priming of the microbial degradation of SOM and therefore a decrease in the DOM concentration (46, 47). With the limits of a correlative study from one site, we found a decrease in DOM concentration with drought, which we attributed to reduced input of plant matter.
The rewetting peak we observed during the normal year was not present during the drought year, and was reduced during the wet year. The DOM rewetting peak of the normal year was evident in the elevated DOM concentration during the rewetting period compared to other periods of the year (10, 13, 14). During the wet year, there was no clear rewetting peak. However, a rewetting peak may be hidden by the high DOM concentrations present during the dry period, which were likely caused by multiple rewetting events elevating the average DOM concentration of the dry period so that there was no relative increase during the rewetting period. The decrease in DOM concentration between the rewetting and moist periods supports the presence of a rewetting peak, as it indicates the release of DOM and its respective degradation. However, the overall magnitude was lower than the normal year, which is in line with previous studies where DOM concentration of the rewetting peak decreased with greater initial soil moisture (15, 16). The decreased magnitude could also be due to multiple rewetting events depleting the available matter to be released as DOM during the rewetting period. This suggests that the rewetting peak following the normal summer drought is an ecosystem response to kick-start the plant-soil-microorganism interaction, which is not triggered to the same extent during a wet year. This should mean that the rewetting period of the drought year has the greatest DOM concentration. However, this contrasts with our findings as we did not observe a rewetting peak during the drought year. We also observed a relative decrease in DOM concentration between the rewetting periods of the normal and drought years. The lack of a rewetting peak during the drought year suggests that the ecosystem response which produces a rewetting peak during the wet and normal years is stunted when there is a drought of similar severity to the extreme 2018 drought. This means that the plant-soil-microorganism interaction, which can aid drought recovery, is weakened (5, 19). The release of SOM increases upon increasing dryness of the soil (15, 16) so the absence of a rewetting peak in the drought year is likely caused by a decreased input from plant matter, which is variable under dry conditions (17). This could be due to more extreme drought conditions reducing the ability of plants to photosynthesise, meaning less plant matter is released upon rewetting. This could then have a knock-on effect on the DOM concentration present during the moist period as fresh, plant matter stimulates microbial activity and primes the degradation of SOM, both of which increase the concentration of DOM (18, 46). Our earlier observation that total DOM concentration is reduced during a drought year supports this. The lack of a rewetting peak and low overall DOM concentration indicates a potential long-lasting effect of drought and reduced ability of plants to recover, influenced by the reduced release of DOM during rewetting.
Sampling depth did not affect DOM concentration. At first glance this is unexpected as DOM concentration tends to decrease with depth (48). However, the sandy soil of the sampling site, which allows for faster percolation than less sandy soils, and the small, 5 cm, difference between sampling depths make this result less surprising. Depth did have an effect on the DOM flux. This is likely a result of the increased sample volume collected at greater depth.
Vegetation type affected DOM concentration, and also reacted differently to varying periods of the year and drought intensity. This makes sense given that these were four different vegetation types, which are likely to differ in the DOM concentration present, and are expected to have varying inputs over the course of a year (9, 49). Beech and pine woodland had similarly high DOM concentrations, whereas oak and grassland had similarly low DOM concentrations. This may be influenced by the pH as more acidic soils are known to be related to higher DOM concentrations (11). However, the sites with the greatest DOM concentrations also had the highest litter layer depth, which could reflect a greater input of plant matter. It could also be due to differences in soil moisture and soil type between sites. The unique behavior of DOM concentration during different periods of the year and during different years in beech woodland may be related to the greater DOM concentrations of this vegetation type. Vegetation that produces more DOM is more tolerant to drought, so we may see a different response in beech, where the DOM concentration was highest, compared to the other vegetation types (50). However, pine woodland also had high DOM concentrations, yet behaved similarly to oak and grassland. The DOM composition also plays an important role, as investing resources into the microbial community can accelerate soil microbial activity, leading to more plant available nutrients, and therefore an increase in plant recovery from drought (5, 19). Although this could indicate a different response to drought between the vegetation types, this may also be caused by site differences. We therefore assume that the dependence of DOM concentrations during different periods of the year and during different years on vegetation type is caused by the different behavior of beech, although this may be influenced by differences between sites, rather than vegetation types.
The DOM composition following rewetting after the 2018 drought was influenced more by vegetation type than by time after rewetting. Aromaticity, C/N, molecular size and O/C varied between vegetation types. Across vegetation types, DOM from grassland had a lower C/N than the woodland areas, which has previously been shown (51). This may be related to the DOM concentration as, when C/N is high, microbially degradation of DOM is limited, resulting in an increase in the DOM concentration (49). Pine and beech woodland tended to have DOM with more oxygen and a greater molecular size than oak woodland and grassland; this has been previously reported to be related to high DOM concentrations and low pH (11, 52). Pine and beech woodland indeed have the highest DOM concentrations and most acidic soils, which may be the cause for the DOM compositional differences. However, beech woodland had a more aromatic DOM composition than pine woodland, likely due to the high lipidic content of pine needles.
The temporal changes in DOM composition support our hypothesis that plant matter is released, then decomposed, following rewetting. We observed an increase in the average molecular size, that likely reflects the microbial decomposition of small molecules, so that they were no longer detected, and the subsequent microbial resynthesis of larger molecules (53). We also observed an increase in aromaticity, a slight increase in O/C, and an increase in lipid-like compounds over time, which is an indication of the degradation of plant matter (21, 54, 55). The degradation of lignin phenols, for example, leads to such changes in DOM composition (56). This suggests that fresh plant matter is being preferentially decomposed following rewetting, increasing the relative abundance of more aromatic, SOM-like compounds (55, 57, 58). Although abiotic processes such as sorption may play a role, aromatic compounds are considered to have greater sorption potential so should decrease over time, whereas we observe an increase in aromaticity following rewetting (59). This suggests that biotic processes cause the temporal changes in DOM during the rewetting period. The temporal changes in DOM composition between vegetation were similar, which suggests that similar transformations of the DOM are occurring in different vegetation types. The increase in lipid-like compounds suggests that there is an increase in microbial activity, which has previously been reported to follow rewetting (14, 60). This supports the DOM compositional changes that indicated a release of plant matter, as “hotspots” of microbial activity can be caused by the release of plant matter (46). Both plant litter and root exudates can create “hotspots” of microbial activity, which may be important in drought tolerance and drought recovery of plants (19, 61). As discussed earlier, locations with thicker plant litter layer tended to have higher DOM concentrations, suggesting a close relationship between plant litter and DOM. However, the compounds that decreased in abundance may be common root exudates (43). Regardless of the source, the breakdown of plant matter and increasing microbial activity during the rewetting period indicates that the release of plant matter kick-starts plant-microorganism interactions, which are reduced during drought (62). As plant-microorganism interactions can aid plant recovery from drought, our results indicate that the release of plant matter is important in drought recovery (5, 19).
As we saw at the beginning, normal conditions, which include a summer drought, cause an increase in the DOM concentration compared to a wet year. Our DOM composition analysis suggests that this is from plant matter kick-starting the plant-microorganism-soil interaction, which then results in higher DOM concentration over a longer period of time. However, in the drought year, this was reduced, likely due to reduced ability of plants to cope with drought conditions, resulting in no DOM rewetting peak and a decrease in DOM concentration. This indicates a role of plant matter during the rewetting period in ecosystem recovery, which is reduced during drought years compared to normal years. The plant matter may boost microbial activity and therefore the plant-microorganism interaction, which should be investigated further.
Data Availability Statement
The datasets used in this study can be found in the MassIVE (https://massive.ucsd.edu/) with the identifier MSV000089504.
Author Contributions
ML and GG conceived and designed the experiment; SS and MW planned and coordinated the sampling campaign; AO performed the HR-MS measurement; AO, ML, OK, and GG analyzed and interpreted the data; AO led the writing of the manuscript; and GG and GP contributed to the writing of the first draft. All authors contributed critically to the drafts and gave final approval for publication.
Funding
AO would like to thank the International Max Planck Research School for Biogeochemical Cycles (IMPRS-gBGC) for funding. ML gratefully acknowledges the funding from the Zwillenberg-Tietz Foundation. SB acknowledges the Deutsche Forschungsgemeinschaft (DFG) for funding as part of Collaborative Research Centre (CRC) 1076 AquaDiva. This study is part of the CRC AquaDiva of the Friedrich Schiller University Jena, funded by the DFG (German Research Foundation) – SFB 1076 – Project Number 218627073.
Conflict of Interest
The authors declare that the research was conducted in the absence of any commercial or financial relationships that could be construed as a potential conflict of interest.
Publisher’s Note
All claims expressed in this article are solely those of the authors and do not necessarily represent those of their affiliated organizations, or those of the publisher, the editors and the reviewers. Any product that may be evaluated in this article, or claim that may be made by its manufacturer, is not guaranteed or endorsed by the publisher.
Acknowledgments
We would like to acknowledge the work of Maria Förster for preparing and extracting samples for DOM extraction. We would also like to acknowledge the routine measurement and analysis group of Ines Hilke for TOC measurements. We would like to thank the Zwillenberg-Tietz Foundation for maintaining the field site and Daniela Wicke for collecting samples. We also acknowledge Jeffrey Hawkes for writing and providing the script used for DOM data processing.
Supplementary Material
The Supplementary Material for this article can be found online at: https://www.frontiersin.org/articles/10.3389/fsoil.2022.904259/full#supplementary-material
Supplementary Table 1 | Effect of added fixed effects on LMM for DOM flux (mg/m2). For pairs that are significantly different (p < 0.05), the greater value is in bold; this is determined by the difference between the estimated marginal means (“estimate” column).
Supplementary Table 2 | Effect of added fixed effects on LMM for sample volume (mL). For pairs that are significantly different (p < 0.05), the greater value is in bold; this is determined by the difference between the estimated marginal means (“estimate” column).
Supplementary Table 3 | Effect of added fixed effects on LMM for DOM concentration (mg/L). For pairs that are significantly different (p < 0.05), the greater value is in bold; this is determined by the difference between the estimated marginal means (“estimate” column).
Supplementary Table 4 | Average and standard deviation of litter layer depth (n=3), grassland had no litter. pH values were taken from a previous study (26) and show the pH between the surface and 28 cm depth.
Supplementary Table 5 | Weighted mean of chemical characteristics of DOM. Days since rewetting refers to the number of days after the point at which samples could be collected for that well. Number of assigned peaks refers to the number of peaks in the mass spectrum that were assigned a sum formula
Supplementary Figure 1 | Cumulative potential evapotranspiration (PET) and precipitation (PPT) over the course of a year. High PET, low PPT reflects a dry year. Low PET, high PPT reflects a wet year. As we consider a year to include a dry, rewetting and moist period, the day index shows the number of days from the beginning of the “year”, not the beginning of the calendar year.
Supplementary Figure 2 | Map of the study site and sampling locations run by the Zwillingberg-Tietz Foundation (Map basis: © GeoBasis-DE/LGB [2020], dl-de/by-2-0).
References
1. Naumann G, Cammalleri C, Mentaschi L, Feyen L. Increased Economic Drought Impacts in Europe With Anthropogenic Warming. Nat Clim Chang (2021) 11:485–91. doi: 10.1038/s41558-021-01044-3
2. de Vries FT, Griffiths RI, Knight CG, Nicolitch O, Williams A. Harnessing Rhizosphere Microbiomes for Drought-Resilient Crop Production. Sci (80-) (2020) 368:270–4. doi: 10.1126/science.aaz5192
3. Schuldt B, Buras A, Arend M, Vitasse Y, Beierkuhnlein C, Damm A, et al. A First Assessment of the Impact of the Extreme 2018 Summer Drought on Central European Forests. Basic Appl Ecol (2020) 45:86–103. doi: 10.1016/j.baae.2020.04.003
4. Karlowsky S, Augusti A, Ingrisch J, Hasibeder R, Lange M, Lavorel S, et al. Land Use in Mountain Grasslands Alters Drought Response and Recovery of Carbon Allocation and Plant-Microbial Interactions. J Ecol (2018) 106:1230–43. doi: 10.1111/1365-2745.12910
5. de Vries FT, Williams A, Stringer F, Willcocks R, McEwing R, Langridge H, et al. Changes in Root-Exudate-Induced Respiration Reveal a Novel Mechanism Through Which Drought Affects Ecosystem Carbon Cycling. New Phytol (2019) 224:132–45. doi: 10.1111/nph.16001
6. Bardgett RD, van der Putten WH. Belowground Biodiversity and Ecosystem Functioning. Nature (2014) 515:505–11. doi: 10.1038/nature13855
7. Schimel JP, Weintraub MN. The Implications of Exoenzyme Activity on Microbial Carbon and Nitrogen Limitation in Soil: A Theoretical Model. Soil Biol Biochem (2003) 35:549–63. doi: 10.1016/S0038-0717(03)00015-4
9. Worrall F, Harriman R, Evans C, Watts D, Adamson J, Neal C, et al. Trends in Dissolved Organic Carbon in UK. Biogeochemistry (2004). doi: 10.1007/s10533-004-8131-7
10. Lange M, Roth VN, Eisenhauer N, Roscher C, Dittmar T, Fischer-Bedtke C, et al. Plant Diversity Enhances Production and Downward Transport of Biodegradable Dissolved Organic Matter. J Ecol (2021) 109:1284–97. doi: 10.1111/1365-2745.13556
11. Roth VN, Dittmar T, Gaupp R, Gleixner G. The Molecular Composition of Dissolved Organic Matter in Forest Soils as a Function of pH and Temperature. PloS One (2015) 10:1–23. doi: 10.1371/journal.pone.0119188
12. Samaniego L, Kumar R, Zink M. Implications of Parameter Uncertainty on Soil Moisture Drought Analysis in Germany. J Hydrometeorol (2013) 14:47–68. doi: 10.1175/JHM-D-12-075.1
13. Lundquist EJ, Jackson LE, Scow KM. Wet-Dry Cycles Affect Dissolved Organic Carbon in Two California Agricultural Soils. Soil Biol Biochem (1999) 31:1031–8. doi: 10.1016/S0038-0717(99)00017-6
14. Slessarev EW. Schimel JP. Partitioning Sources of CO2 Emission After Soil Wetting Using High-Resolution Observations and Minimal Models. Soil Biol Biochem (2020) 143:107753. doi: 10.1016/j.soilbio.2020.107753
15. Sun D, Bi Q, Li K, Zhu J, Zhang Q, Jin C, et al. Effect of Soil Drying Intensity During an Experimental Drying-Rewetting Event on Nutrient Transformation and Microbial Community Composition. Pedosphere (2018) 28:644–55. doi: 10.1016/S1002-0160(17)60450-8
16. Guo X, Drury CF, Yang X, Reynolds WD. Water-Soluble Carbon and the Carbon Dioxide Pulse are Regulated by the Extent of Soil Drying and Rewetting. Soil Sci Soc Am J (2014) 78:1267–78. doi: 10.2136/sssaj2014.02.0059
17. Preece C, Peñuelas J. Rhizodeposition Under Drought and Consequences for Soil Communities and Ecosystem Resilience. Plant Soil (2016) 409:1–17. doi: 10.1007/s11104-016-3090-z
18. Malik A, Gleixner G. Importance of Microbial Soil Organic Matter Processing in Dissolved Organic Carbon Production. FEMS Microbiol Ecol (2013) 86:139–48. doi: 10.1111/1574-6941.12182
19. Karlowsky S, Augusti A, Ingrisch J, Akanda MKU, Bahn M, Gleixner G. Drought-Induced Accumulation of Root Exudates Supports Post-Drought Recovery of Microbes in Mountain Grassland. Front Plant Sci (2018) 9:1593. doi: 10.3389/fpls.2018.01593
20. Miller AE, Schimel JP, Meixner T, Sickman JO, Melack JM. Episodic Rewetting Enhances Carbon and Nitrogen Release From Chaparral Soils. Soil Biol Biochem (2005) 37:2195–204. doi: 10.1016/j.soilbio.2005.03.021
21. Ohno T, He Z, Sleighter RL, Honeycutt CW, Hatcher PG. Ultrahigh Resolution Mass Spectrometry and Indicator Species Analysis to Identify Marker Components of Soil- and Plant Biomass-Derived Organic Matter Fractions. Environ Sci Technol (2010) 44:8594–600. doi: 10.1021/es101089t
22. Hertkorn N, Benner R, Frommberger M, Schmitt-Kopplin P, Witt M, Kaiser K, et al. Characterization of a Major Refractory Component of Marine Dissolved Organic Matter. Geochim Cosmochim Acta (2006) 70:2990–3010. doi: 10.1016/j.gca.2006.03.021
23. Roth VN, Dittmar T, Gaupp R, Gleixner G. Ecosystem-Specific Composition of Dissolved Organic Matter. Vadose Zo J (2014) 13:1–10. doi: 10.2136/vzj2013.09.0162
24. Zink M, Kumar R, Cuntz M, Samaniego L. A High-Resolution Dataset of Water Fluxes and States for Germany Accounting for Parametric Uncertainty. Hydrol Earth Syst Sci (2017) 21:1769–90. doi: 10.5194/hess-21-1769-2017
25. Bauriegel A, Kühn D, Schmidt R, Hering J, Hannemann J. Bodenübersichtskarte Des Landes Brandenburg 1: 300.000. Landesamt für Bergbau Geol und Rohstoffe Brand Kleinmachnow Potsdam (2001).
26. Pampe F, Pampe LF. Chemisch-Physikalische Bodeneigenschaften Und Waldbauliche Perspektiven Für Die Waldflächen Der Zwillenberg-Tietz Stiftung Auf Gut Linde (Brandenburg) [unpublished master's thesis]. Lower Saxony, Germany: University of Goettingen. (2020).
27. Amelung W, Blume HP, Fleige H, Horn R, Kandeler E, Kögel-Knabner I, et al. Scheffer/Schachtschabel Lehrbuch Der Bodenkunde. Spektrum Akademischer Verlag (2018). doi: 10.1007/978-3-662-55871-3
28. Haude W. Verdünstungsmenge Und Evaporationskraft Eines Klimas. Ber Dtsch Wetterd US Zo 4 (1952) 42:225–9.
29. Dittmar T, Koch B, Hertkorn N, Kattner G. A Simple and Efficient Method for the Solid-Phase Extraction of Dissolved Organic Matter (SPE-DOM) From Seawater. Limnol Oceanogr Methods (2008) 6:230–5. doi: 10.4319/lom.2008.6.230
30. Hawkes JA, D’Andrilli J, Agar JN, Barrow MP, Berg SM, Catalán N, et al. An International Laboratory Comparison of Dissolved Organic Matter Composition by High Resolution Mass Spectrometry: Are We Getting the Same Answer? Limnol Oceanogr Methods (2020) 18:235–58. doi: 10.1002/lom3.10364
31. Koch BP, Dittmar T. From Mass to Structure: An Aromaticity Index for High-Resolution Mass Data of Natural Organic Matter. Rapid Commun Mass Spectrom (2006) 20:926–32. doi: 10.1002/rcm.2386
32. Riedel T, Biester H, Dittmar T. Molecular Fractionation of Dissolved Organic Matter With Metal Salts. Environ Sci Technol (2012) 46:4419–26. doi: 10.1021/es203901u
33. Gonsior M, Peake BM, Cooper WT, Podgorski D, D’Andrilli J, Cooper WJ. Photochemically Induced Changes in Dissolved Organic Matter Identified by Ultrahigh Resolution Fourier Transform Ion Cyclotron Resonance Mass Spectrometry. Environ Sci Technol (2009) 43:698–703. doi: 10.1021/es8022804
34. Zark M, Dittmar T. Universal Molecular Structures in Natural Dissolved Organic Matter. Nat Commun (2018) 9:1–8. doi: 10.1038/s41467-018-05665-9
35. Herzsprung P, Hertkorn N, Von Tumpling W, Harir M, Friese K, Schmitt-Kopplin P. Understanding Molecular Formula Assignment of Fourier Transform Ion Cyclotron Resonance Mass Spectrometry Data of Natural Organic Matter From a Chemical Point of View. Anal Bioanal Chem (2014) 406:7977–87. doi: 10.1007/s00216-014-8249-y
36. R Core Team. R: A Language and Environment for Statistical Computing (2020). Available at: https://www.r-project.org/.
37. Oksanen J, Blanchet FG, Friendly M, Kindt R, Legendre P, McGlinn D, et al. Vegan: Community Ecology Package. R Package Version 2.5-7 (2020). Available at: https://cran.r-project.org/package=vegan.
38. Bates D, Mächler M, Bolker B, Walker S. Fitting Linear Mixed-Effects Models Using Lme4. J Stat Softw (2015) 67:1–48. doi: 10.18637/jss.v067.i01
39. Lenth RV. Emmeans: Estimated Marginal Means, Aka Least-Squares Means. R Package version (2021) 1.4:3.01.
40. Goslee SC, Urban DL. The Ecodist Package for Dissimilarity-Based Analysis of Ecological Data. J Stat Softw (2007) 22:1–19. doi: 10.18637/jss.v022.i07
41. Wickham H. Ggplot2: Elegant Graphics for Data Analysis (2016). Available at: https://ggplot2.tidyverse.org.
42. Ramette A. Multivariate Analyses in Microbial Ecology. FEMS Microbiol Ecol (2007) 62:142–60. doi: 10.1111/j.1574-6941.2007.00375.x
43. Miao Y, Lv J, Huang H, Cao D, Zhang S. Molecular Characterization of Root Exudates Using Fourier Transform Ion Cyclotron Resonance Mass Spectrometry. J Environ Sci (China) (2020) 98:22–30. doi: 10.1016/j.jes.2020.05.011
44. Minor EC, Swenson MM, Mattson BM, Oyler AR. Structural Characterization of Dissolved Organic Matter: A Review of Current Techniques for Isolation and Analysis. Environ Sci Process Impacts (2014) 16:2064–79. doi: 10.1039/c4em00062e
45. Farooq M, Wahid A, Kobayashi N, Fujita D, Basra SMA. Plant Drought Stress: Effects, Mechanisms and Management. Agron Sustain Dev (2009) 29:185–212. doi: 10.1051/agro:2008021
46. Kuzyakov Y, Blagodatskaya E. Microbial Hotspots and Hot Moments in Soil: Concept & Review. Soil Biol Biochem (2015) 83:184–99. doi: 10.1016/j.soilbio.2015.01.025
47. Fontaine S, Barot S, Barré P, Bdioui N, Mary B, Rumpel C. Stability of Organic Carbon in Deep Soil Layers Controlled by Fresh Carbon Supply. Nature (2007) 450:277–80. doi: 10.1038/nature06275
48. Pabich WJ, Valiela I, Hemond HF. Relationship Between DOC Concentration and Vadose Zone Thickness and Depth Below Water Pabich. Biogeochemistry (2001) 55:247–68. doi: 10.1023/A:1011842918260
49. van den Berg LJL, Shotbolt L, Ashmore MR. Dissolved Organic Carbon (DOC) Concentrations in UK Soils and the Influence of Soil, Vegetation Type and Seasonality. Sci Total Environ (2012) 427–428:269–76. doi: 10.1016/j.scitotenv.2012.03.069
50. Ritson JP, Brazier RE, Graham NJD, Freeman C, Templeton MR, Clark JM. The Effect of Drought on Dissolved Organic Carbon (DOC) Release From Peatland Soil and Vegetation Sources. Biogeosciences (2017) 14:2891–902. doi: 10.5194/bg-14-2891-2017
51. Christou M, Avramides EJ, Roberts JP, Jones DL. Dissolved Organic Nitrogen in Contrasting Agricultural Ecosystems. Soil Biol Biochem (2005) 37:1560–3. doi: 10.1016/j.soilbio.2005.01.025
52. Raeke J, Lechtenfeld OJ, Tittel J, Oosterwoud MR, Bornmann K, Reemtsma T. Linking the Mobilization of Dissolved Organic Matter in Catchments and Its Removal in Drinking Water Treatment to its Molecular Characteristics. Water Res (2017) 113:149–59. doi: 10.1016/j.watres.2017.01.066
53. Roth VN, Lange M, Simon C, Hertkorn N, Bucher S, Goodall T, et al. Persistence of Dissolved Organic Matter Explained by Molecular Changes During its Passage Through Soil. Nat Geosci (2019) 12:755–61. doi: 10.1038/s41561-019-0417-4
54. Yu Z, Liu X, Chen C, Liao H, Chen Z, Zhou S. Molecular Insights Into the Transformation of Dissolved Organic Matter During Hyperthermophilic Composting Using ESI FT-ICR Ms. Bioresour Technol (2019) 292:122007. doi: 10.1016/j.biortech.2019.122007
55. Kalbitz K, Schwesig D, Schmerwitz J, Kaiser K, Haumaier L, Glaser B, et al. Changes in Properties of Soil-Derived Dissolved Organic Matter Induced by Biodegradation. Soil Biol Biochem (2003) 35:1129–42. doi: 10.1016/S0038-0717(03)00165-2
56. Wang M, Zhang Z, Wang Y, Mo X, Zhang Q, Zhang P, et al. Characteristics of Dissolved Organic Matter and Dissolved Lignin Phenols in Tropical Forest Soil Solutions During Rainy Seasons and Their Responses to Nitrogen Deposition. ACS Earth Sp Chem (2021) 5:3150–8. doi: 10.1021/acsearthspacechem.1c00243
57. Kida M, Kondo M, Tomotsune M, Kinjo K, Ohtsuka T, Fujitake N. Molecular Composition and Decomposition Stages of Organic Matter in a Mangrove Mineral Soil With Time. Estuar Coast Shelf Sci (2019) 231:106478. doi: 10.1016/j.ecss.2019.106478
58. Klotzbücher T, Kalbitz K, Cerli C, Hernes PJ, Kaiser K. Gone or Just Out of Sight? The Apparent Disappearance of Aromatic Litter Components in Soils. Soil (2016) 2:325–35. doi: 10.5194/soil-2-325-2016
59. Keiluweit M, Kleber M. Molecular-Level Interactions in Soils and Sediments: The Role of Aromatic π-Systems. Environ Sci Technol (2009) 43:3421–9. doi: 10.1021/es8033044
60. Meisner A, Bååth E, Rousk J. Microbial Growth Responses Upon Rewetting Soil Dried for Four Days or One Year. Soil Biol Biochem (2013) 66:188–92. doi: 10.1016/j.soilbio.2013.07.014
61. Belimov AA, Dodd IC, Hontzeas N, Theobald JC, Safronova VI, Davies WJ. Rhizosphere Bacteria Containing 1-Aminocyclopropane-1-Carboxylate Deaminase Increase Yield of Plants Grown in Drying Soil via Both Local and Systemic Hormone Signalling. New Phytol (2009) 181:413–23. doi: 10.1111/j.1469-8137.2008.02657.x
Keywords: High resolution mass spectrometry (HR-MS), recovery from drought stress, microbial carbon, Lysimeter, dissolved organic carbon (DOC)
Citation: Orme AM, Lange M, Schroeter SA, Wicke M, Kolle O, Pohnert G and Gleixner G (2022) Drought Reduces Release of Plant Matter Into Dissolved Organic Matter Potentially Restraining Ecosystem Recovery. Front. Soil Sci. 2:904259. doi: 10.3389/fsoil.2022.904259
Received: 25 March 2022; Accepted: 05 May 2022;
Published: 14 June 2022.
Edited by:
Yuntao Hu, Berkeley Lab (DOE), United StatesReviewed by:
Jun-Jian Wang, Southern University of Science and Technology, ChinaJulien Guigue, Technical University of Munich, Germany
Copyright © 2022 Orme, Lange, Schroeter, Wicke, Kolle, Pohnert and Gleixner. This is an open-access article distributed under the terms of the Creative Commons Attribution License (CC BY). The use, distribution or reproduction in other forums is permitted, provided the original author(s) and the copyright owner(s) are credited and that the original publication in this journal is cited, in accordance with accepted academic practice. No use, distribution or reproduction is permitted which does not comply with these terms.
*Correspondence: Gerd Gleixner, gerd.gleixner@bgc-jena.mpg.de