
94% of researchers rate our articles as excellent or good
Learn more about the work of our research integrity team to safeguard the quality of each article we publish.
Find out more
ORIGINAL RESEARCH article
Front. Soil Sci., 29 June 2022
Sec. Plant-Soil Interactions
Volume 2 - 2022 | https://doi.org/10.3389/fsoil.2022.898618
 Jean-Pascal Matteau1*†
 Paul Celicourt2
 Elnaz Shahriarina2
 Philipe Letellier3
 Thiago Gumiere2
 Silvio J. Gumiere2
Soil disturbance resulting from tuber crop harvesting is a major threat to soil health. The depth of soil intervention is a critical factor that further strengthens the effects of such disturbance and makes harvest one of the most harmful cropping operations. In the case of potato, soil moisture is a determining factor for root and stolon development, hence, a deeper soil intervention may be required at harvest. While potato ranks as the fourth most cultivated crop worldwide, the impact of soil moisture on potato tuber vertical and horizontal distribution has received very little attention. The objective of this study was to evaluate the effects of four soil matric potential thresholds (SMPTs; –10, –20, –30, and –45 kPa) on the spatial (vertical and horizontal) distribution of potato tubers grown in plastic containers filled with sandy soil using an X-ray computed tomography scanner. The results of the experiments conducted in a greenhouse environment suggest that the horizontal distribution of the tubers did not differ significantly across the irrigation treatments. However, a linear relationship between SMPT, and therefore irrigation threshold, and potato tuber depth was observed. In addition, the deepest tuber position was observed under the –10 kPa SMPT, while the tubers were closer to the soil surface under the –45 kPa SMPT, which could lead to a greater preponderance of tuber diseases such as late blight or greening. Thus, potato irrigation events implementing a SMPT between –20 and –30 kPa could reduce the harvest depth, hence, decreasing the negative impacts of soil disturbance on soil structural stability and soil organic carbon degradation while mitigating the impacts of disease as well as reducing fuel costs, greenhouse gas emissions, soil loss and erosion.
Potato (Solanum tuberosum) production and associated land area under irrigation have increased over the last few decades, a trend that is likely to continue due to climate change and increasing food demand (1–3). This crop is conventionally cultivated under intensive tillage practices, including planting, diking, hilling, and harvest, that are universally known to influence soil degradation significantly. Among these practices, the harvesting stage significantly disturbs the soil environment, leading to important soil loss and erosion. For example, total soil loss during potato harvest can reach up to 21.4 Mg/ha per harvest (4), which also results in a high rate of nutrient losses (5, 6). Beyond the aforementioned impacts of soil disturbance and its associated soil health degradation effects, the depth of soil intervention is another factor with paramount economic and environmental impacts. In addition to the aforementioned soil and nutrient losses, soil disturbance may increase fuel costs as well as greenhouse gas emissions. Furthermore, a study found a much higher correlation between morphological characteristics of elongated potatoes and sediment exportation than spherical potatoes (7). Therefore, cultivation practices that optimize the spatial evolution of potato tubers could play an important role in fostering the sustainability of potato production systems.
Adequacy in irrigation water management is an important factor in preventing soil erosion and cracking, which provide cavities for tuber infection (8). In this regard, irrigation techniques and cultural practices such as hilling and tuber depth may considerably influence tuber infestation (9). Therefore, the prevalence of certain potato diseases, such as late blight or greening, is strongly dependent on tuber depth in the soil (8, 10–12). Water stress is known to influence the shape of tubers, which may result in longitudinal development along the tuber length and/or lateral development (13). This indicates that irrigation water management or irrigation thresholds may influence tuber depth in the soil. Thus, appropriate water management practices may result in a twofold benefit, i.e., a maximization of potato harvest efficiency and a minimization of soil disturbance.
Similar to studies aimed at evaluating soil loss or sediment adherence to tubers at harvest due to potato tuber morphologies [spherical and elongated (7)], there are few studies on the spatial (horizontal and vertical) distribution of irrigated potato tubers. An in-depth review of the literature did not reveal any prior work that attempted to study the relationship between irrigation thresholds and the horizontal and vertical distribution of potato tubers. However, the following previous work has adjacent objectives. The effect of plant water deficit techniques on harvested tuber weight and dimensions (length and diameter) has previously been investigated (14). Another study also reported that water stress during tuber initiation significantly reduces average tuber size (15). Adequate irrigation management has also favored a larger tuber size distribution (16). The impacts of drought on longitudinal growth of tubers have been investigated and have shown that drought decreased yield by reducing longitudinal growth of tubers (17).
A common ground between the above-cited studies on the horizontal and vertical distribution of potato tubers is that they applied a post-harvest analysis of the tubers. Observation of underground tubers development in their undisturbed natural state within soil, both spatially and temporally, remains a challenging task (18). To overcome these challenges, several non-destructive tuber growth monitoring techniques have been used in agricultural investigations (19). An electromagnetic induction (EMI)-based on-the-go proximal soil sensing apparatus has been used to map out apparent ground electrical conductivity (ECa), which is used to forecast potato tuber yield in four fields across Atlantic Canada (20). However, this technique requires site-specific calibrations. The minirhiozotron root observation method has had been widely accepted for in-situ, non-destructive plant root dynamic studies under a variety of soil and plant types (21). However, it has been reported that installation of the instrument severs roots and disturbs soil (22). The ground penetrating radar (GPR) technique has been suggested as a suitable technique to detect and quantify corn seed planting depth (19). Although GPR allows three-dimensional (3-D) reconstruction of scanned objects, it has been found to underestimate root biomass (23). Altogether, these limitations suggest the need for more precise non-destructive techniques to examine underground potato tubers.
Computed tomography (CT) technology is a promising non-destructive technique that can accurately represent potato tuber spatial distribution, facilitating a more accurate phenotypic description and greater information gathering than other methods. CT has also been used in potato research to measure tuber growth rate (24), and to analyze the 3D microstructure of frozen potatoes (25, 26). CT-scan has been used to monitor potato tuber development from initiation until harvest under heat and drought stresses (27). CT has also been extensively used in soil science to analyze soil biota characteristics, hydrophysical properties, structure, compaction, and mineral and organic matter contents (28, 29). More detailed descriptions of the CT technology, and its applications can be found in literature (28, 29).
The purpose of this study was to evaluate the effect of four soil matric potential thresholds (SMPTs), i.e., –10, –20, –30, and –45 kPa, on the spatial distribution of potato tubers. To this end, potatoes were cultivated in experimental containers filled with sandy soil monitored using a soil matric potential (SMP) sensor network in a greenhouse complex. Then, the experimental units were scanned using an X-ray CT scanner at the end of the growing season. The hypothesis tested was that irrigation directly affects potato tuber depth (vertical) and horizontal distribution. To the best of our knowledge, this is the first study investigating the effects of irrigation water management practices on potato tuber vertical distribution. This study sought to recommend improvements in soil water management practices that may optimize tubers distribution and enhance harvest efficiency while reducing greenhouse gas emissions and soil disturbance in cropping systems.
The experiment was performed at Laval University’s high precision greenhouse complex and consisted in cultivating potatoes in 12 plastic containers (experimental unit; 60*40*40 cm3) with six drainage holes of 1.5 cm covered with geotextile, shown in Figure 1A. The soil used in the experiment was collected from a potato field located in Dolbeau-Mistassini, Quebec, Canada(48°51'31" and 72°11'50"). It was a sandy soil according to the Canadian system of soil classification (Soil Classification Working Group 1998) with the following characteristics: 0% clay, 8.2% silt, 91.8% sand, 3.1% organic C, 48% porosity, and pH = 5.01. The soil was collected from 0-20 cm depth, and the particle size distribution was determined using the sedimentation method (30). The soil samples were then homogenized before being placed into the experimental units where the soil was saturated with water before planting to ensure uniform water availability at the beginning of the experiment.

Figure 1 (A) Scheme of the short side of an experimental unit with one tensiometer equipped with a pressure sensor inserted into the side and connected to a datalogger collecting data every two minutes. (B) CT scanning of an experimental unit. (C) 3D image reconstruction of a scanned experimental unit. (D) Top view of tubers after image processing and tuber identification.
In the plastic container, two tubers were planted in each experimental unit at a depth of 7.5 cm below the soil surface and each at a distance of 15 cm of the center on each side of the experimental unit. The Goldrush potato variety, which produces oblong to long tubers that tend to be horizontally oriented, was used in this study. This variety is the most important variety among potato seed production areas in the province of Québec (31).
Fertilization was first applied at the seeding stage (120 kg ha–1 of NPK and 10 kg ha–1 of Mg), and 55 kg ha–1 of ammonium–N was applied at the post–emergence stage following local recommendations for potato crops (32). The available nutrient concentrations (P, K and Mg) considered to calculate the fertilization needs were extracted with the Mehlich III extraction method (33), and determined at the Research and Development Institute for the Agri–Environment (Institut de Recherche et de Développement en Agroenvironnement, Sainte–Foy, QC, Canada) via inductively coupled plasma optical emission spectrometry (ICP–OES) (model ICAP, PerkinElmer, Boston, MA). Application of APROVIA (benzovindiflupyr) and Senator PSPT (thiophanate–methyl) fungicides to control soil–borne diseases was carried out at planting according to the manufacturer’s recommended rates. Potato hilling was carried out four weeks after planting according to local grower practices.
The experiment took place from 22 July 2019 until 5 November 2019. It consisted of applying a range of irrigation treatments that apply an SMPT of –10, –20, –30, and –45 kPa, respectively. The equivalent soil water and air contents corresponding to each SMPT are shown in Table 1. These values were selected based on prior experimental results, which demonstrated that SMPT values between –10 and –24 kPa were optimal to maximize potato yield while values lower than –7 kPa or higher than –45 kPa both result in significant yield reduction (35). Of the 12 experimental units, only 9 have been used for analysis because two experimental units had missing images in the stack, preventing the analysis. An other one had a malfunctioning of the irrigation system which prevented the SMPT from being maintained under a threshold of –45 kPa. Thus, we classified (a posteriori) the irrigation treatments based on the irrigation threshold under which the experimental unit spent at least 75% of the growing season.

Table 1 Equivalent soil water and air contents (cm3 cm–3) calculated using the van Genuchten equation for each irrigation threshold (34).
To ensure uniform emergence, the irrigation water applied was the same across all thresholds from seeding to emergence. The irrigation treatments began from emergence through their removal from the greenhouse complex for scanning at maturity. The irrigation events duration was adjusted to reach a SMP of between –1 and –5 kPa after each event. Table 2 shows the total irrigation volume (liter), the mean irrigation volume by irrigation (liter), and the irrigation recurrence time (hour) after 70 growing days, one week before senescence. The –10 kPa irrigation treatment received the highest volume of water with 92.2 liters. Water received for the three other treatments –20, –30, –45 kPa was depleted by10%, 20%, and 42%, respectively. The –10 and –45 kPa treatment received, on average, the lowest volume of 2.2 liters of water per irrigation, and the –20 kPa treatment received the most water on an average of 3.6 liters. The mean volume of water per irrigation depended on the irrigation duration, which was adjusted to reach between –1 and –5 kPa after the irrigation. The lowest irrigation recurrence time was observed in the –10 kPa treatment, and the longest was observed in the –20 kPa treatment.
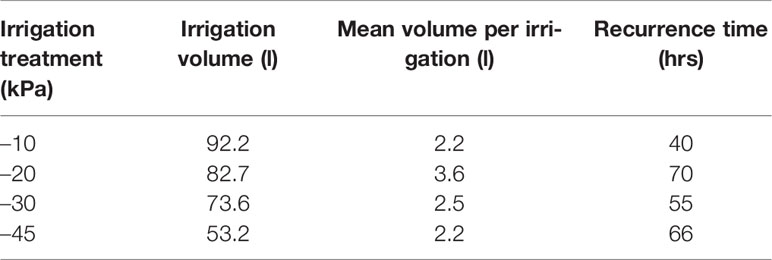
Table 2 Irrigation volume (liter), mean volume of water applied per irrigation (liter), and irrigation time recurrence (hour) for each irrigation treatment.
The experimental units were arranged in a split–plot design with three replicates and each unit had one 2705 pencil tensiometer from Soilmoisture Equipement Corp. (Goleta, CA, USA) installed at a depth of 10 cm below the soil surface to measure SMP and wired to a CR1000 data logger from Campbell Scientific, Inc. (Logan, UT, USA). The latter was programmed and used to control the sensors and gather the measured data at a two–minute time interval. For each experimental unit of every set of replicates, the mean of the measured SMP values was calculated to trigger irrigation that brings the SMP to the corresponding predefined SMPT. The irrigation system consisted of individual irrigation lines made of polyethylene pipe and comprised drip tape with 1.09 L/h emitters from Toro ag (El Cajon, CA,USA) placed atop the soil surface of the experimental units.
During the growing season, the air temperature in the greenhouse varied between 12.4°C and 28.7°C, with a mean of 19.1°C ± 3.02°C. The relative humidity varied between 23.28% and 99.5%, with a mean of 56.51% ± 13.42%.
At the end of the growing season, the experimental units were scanned at the INRS CT Scanning for Civil Engineering and Natural Resources Laboratory1 (Québec, Canada) using a Siemens SOMATOM Definition AS+ 128 CT scanner (Siemens, Germany). Each experimental unit was placed separately on the CT scanner table so that the soil profile was parallel to the CT scanner movement (Figure 1B). The values of the CT scanning configuration parameters were selected as follows: the energy level used was 140 peak kilovoltage (kVp), the exposure was 460 mAs, the field of view had a diameter of 50 cm, and the spatial resolution (voxel size) was 0.9766 X 0.9766 X 1.024 mm3 (x, y, z). A total of 689 cross–sectional CT images were generated for each experimental unit, which allowed a three-dimensional reconstruction of the experimental units, as seen in Figure 1C. Each image represents a map of CT numbers, which are obtained from a linear transformation of the measured attenuation coefficients (by a material, pure water, and air) of an incident energy beam (X–ray) and expressed in Hounsfield units (HU, dimensionless).
Because the majority of the voxels represent a mixture of air, water, and solid particles, the application of filters and pre–processing algorithms to the scanned images is known to posed numerous challenges related to the presence of intact soils (36). Furthermore, the voxels representing the potato tubers were composed of a mixture of water and solid particles.Two methods were used in the Avizo software (FEI, France) to identify the tubers’ barycenter. In some cases, the Hounsfield units (HU) associated with the tubers were more homogeneous than the soil leading to a greater point density inside the tubers for a carefully chosen threshold. In this case, a few morphological operations, notably a series of opening and closing were enough to segment the tubers from the soil as seen in Figure 1D. In other cases, the point density inside the tubers was too similar to the one of the soil, which made it difficult to proceed with morphological operations. In that second case, a region–growing algorithm was used. Seeding points and parameters were manually selected for each tuber and some morphological operations were applied to the result to complete the segmentation. A watershed segmentation was finally applied to both methods to separate the connected tubers and a labeling operation was done to obtain their barycenter.
The distance between each tuber barycenter and the soil surface was computed to evaluate the tuber depth in the soil. The horizontal distribution of the tubers was evaluated by computing the distance between each tuber barycenter and the center of the top of the potato hill on a lateral axis. The Avizo software outputs the data as spreadsheets containing the absolute position of each tuber barycenter (x, y, z) and the three–dimensional volume.
The data exported from the Avizo Software were analyzed using the R software (37). The variance homogeneity and data normality were evaluated using Levene and Shapiro–Wilk tests with the Car package (38). Significant differences were identified with ANOVA followed by the Tukey test using the Agricolae package (39). Differences were considered significant at p < 0.05. Furthermore, a two–dimensional (2D) kernel density estimator was applied to the data using the function geom_density_2d_filled from the MASS package to compute a raster image depicting the tubers probability density distribution (40).
The vertical distribution of the tubers for each category of SMPT is shown in Figure 2A. It indicates that the distance between tuber barycenter and the soil surface decreases with a decrease in SMPT. This result is further clarified in Figure 2B, which shows that the –10 kPa treatment resulted in a significantly higher average tuber depth (approximately 125 mm) compared to the –30 and –45 kPa treatments, with 80 mm and 60 mm, respectively. In the same figure, a linear relationship between tuber depth and SMPT (blue line), with a coefficient of determination (r2) of 0.852, is demonstrated. On the one hand, Figure 2C shows that the proportion of tubers located between 0 and 70 mm from the surface tended to decrease as the SMPT increased. On the other hand, it depicts an increase of the proportion of tubers deeper than 100 mm as the SMPT decreased.
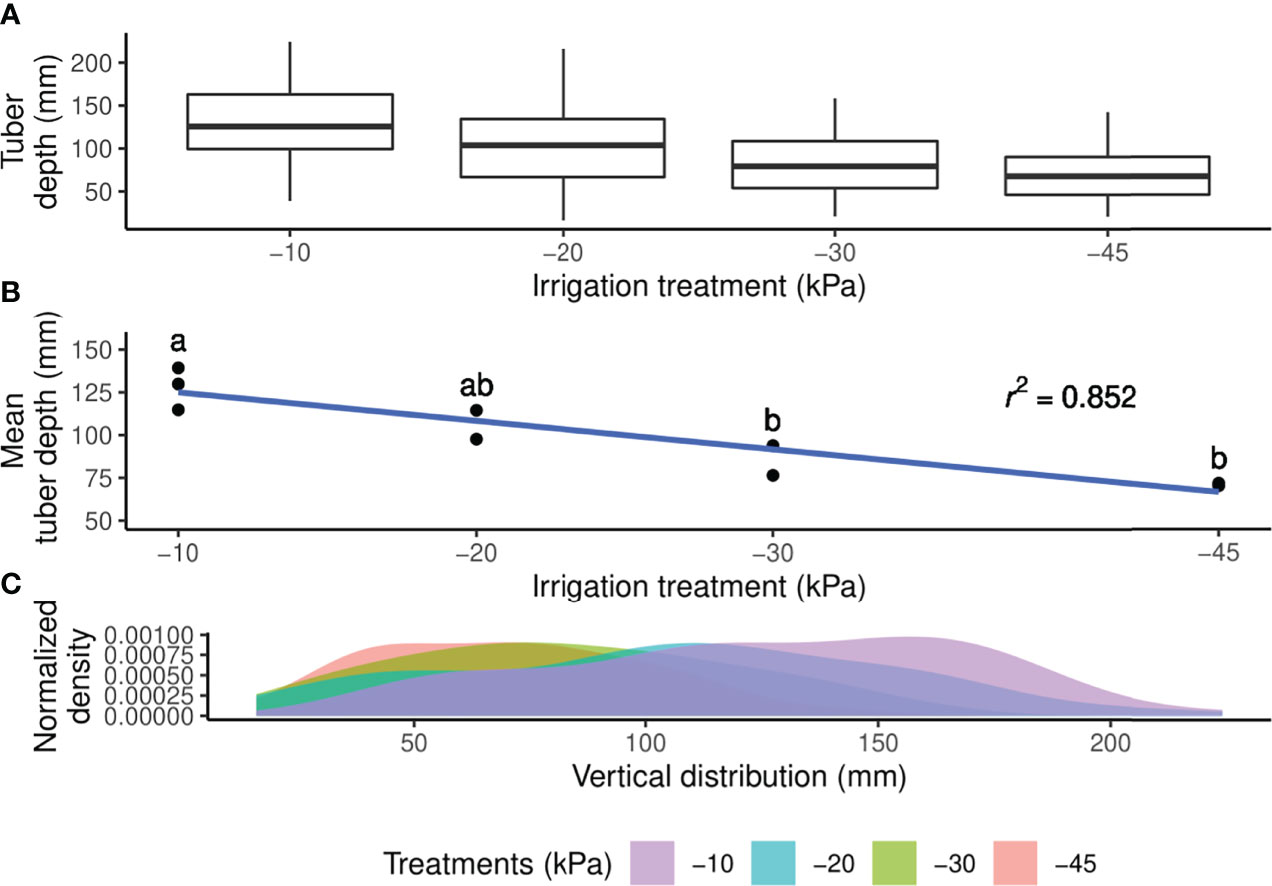
Figure 2 (A) Tuber vertical distribution in mm for each irrigation treatment. (B) Mean tuber depth in each unit (indicated by points) for each irrigation treatment. Values with the different letters are significantly different (p < 0.05) according to the Tukey test. The blue line represents the linear regression across all the treatments. (C) Vertical distribution of tuber density grouped according to irrigation treatment.
Figure 3 further corroborates the findings presented above. It presents the number of tubers per layer of 20 mm of soil for each SMPT starting from the soil surface down to 240 mm. The –45 kPa treatment resulted in the shallowest tubers, with more than 80% of the tubers occurring less than 100 mm below the soil surface. The –10 kPa treatment resulted in the deepest tubers, with 75% of the tubers produced being located deeper than 100 mm. Overall, about 90% of all the tubers produced in this experiment were grown at less than 160 mm below the soil surface.
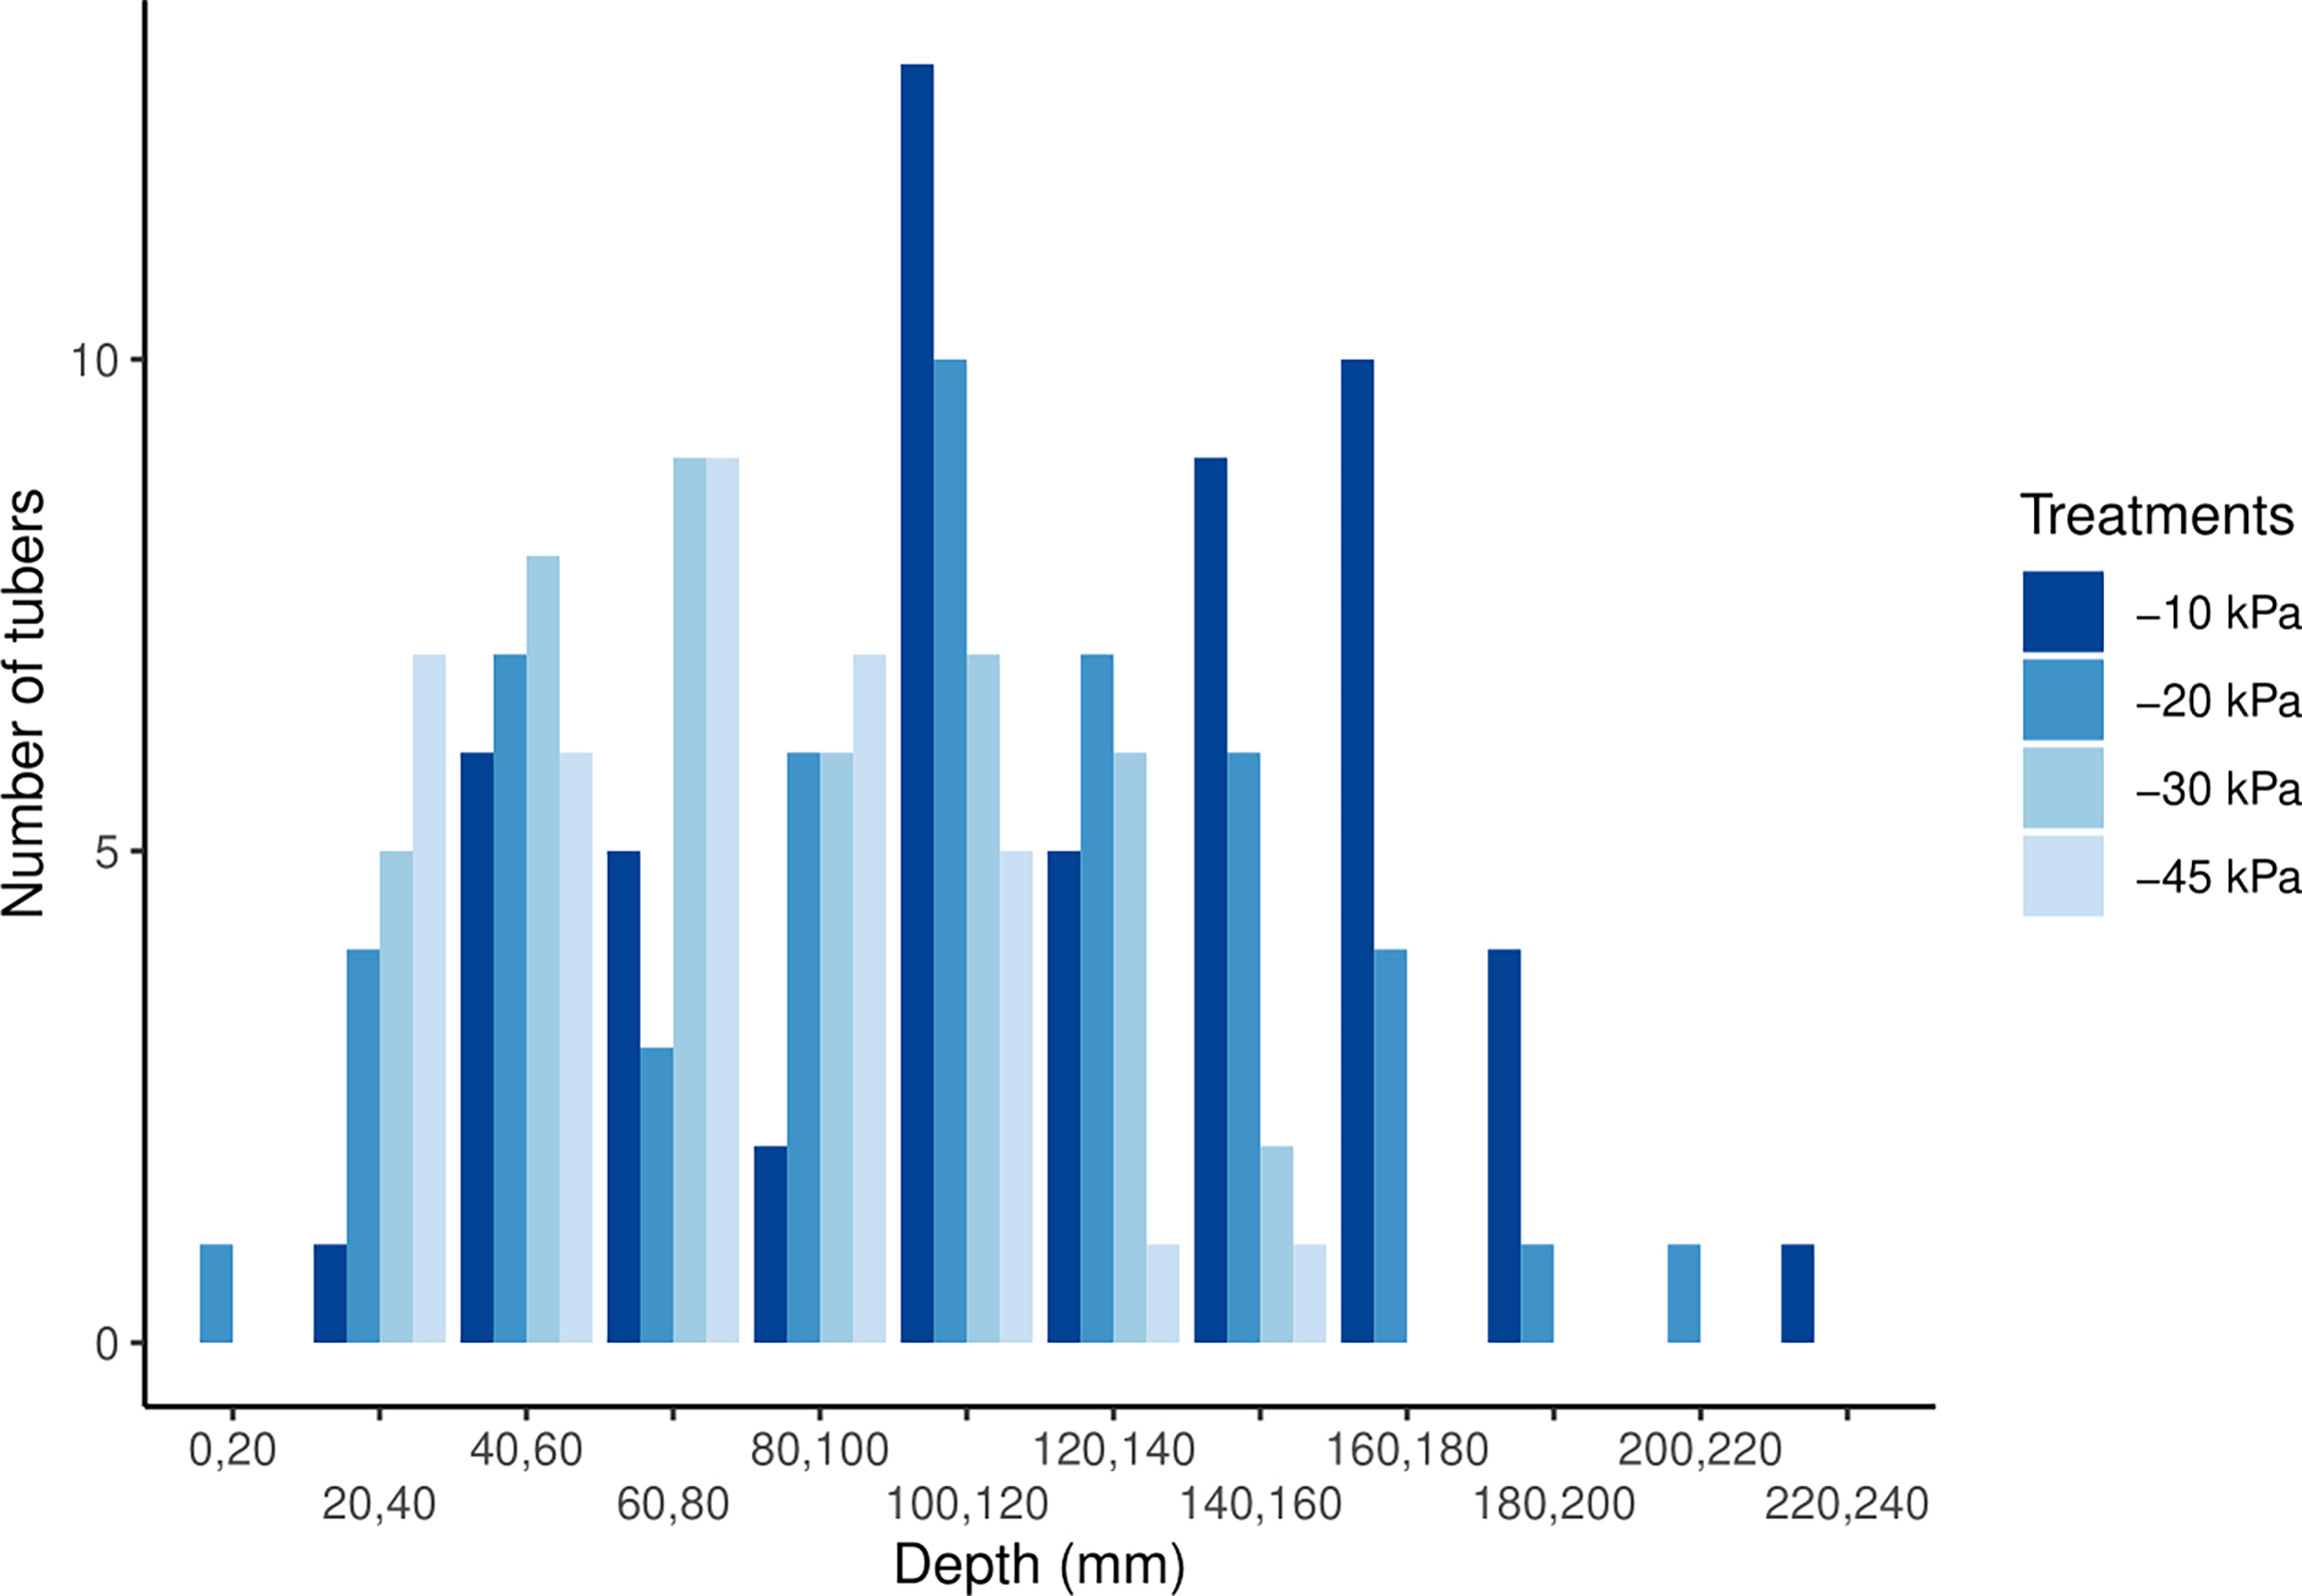
Figure 3 Representation of the number of tubers per 20–mm increment of soil depth for each irrigation treatment. The figure indicates that the highest and lowest SMPT result in the shallowest and deepest tubers, respectively.
The horizontal or lateral distribution of the tubers was also studied and the results are presented in Figure 4A for each treatment. The horizontal distribution of the tubers was not significantly associated with the irrigation treatment, according to the results of the regression analysis depicted in Figure 4B with a coefficient of determination of 0.007. As shown in Figure 4C, most tubers were less than 100 mm from the experimental unit center under all four SMPT.
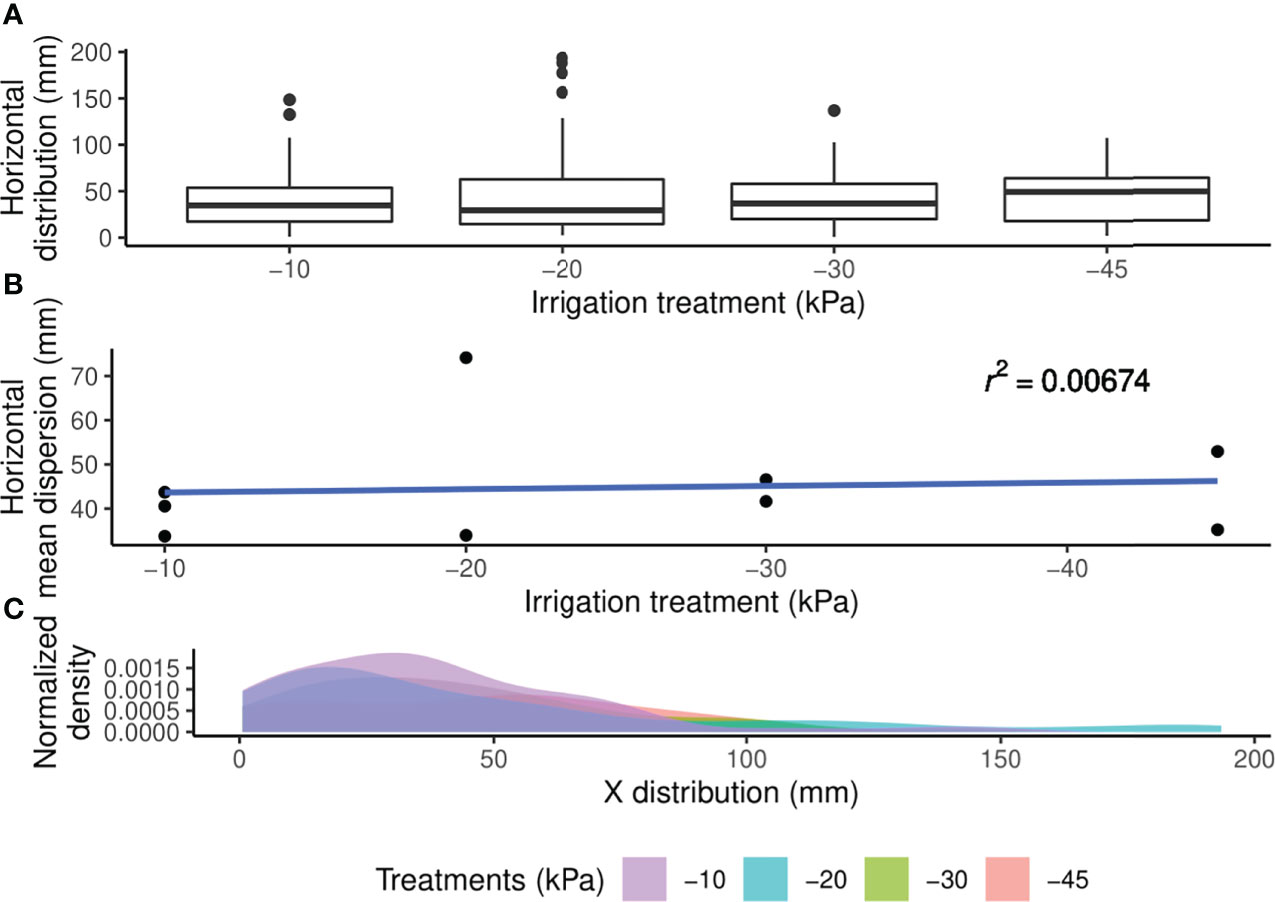
Figure 4 (A) Horizontal distribution of tubers in mm for each irrigation treatment. (B) Mean horizontal distance of the tubers in each unit (indicated by points) from the experimental unit center for each irrigation treatment. The blue line represents the linear regression across all the treatments. (C) Horizontal distribution of tuber density grouped by irrigation treatment.
Figure 5 shows the number of tubers produced under each irrigation treatment for each 20 mm distance interval from the experimental unit center. The –10, –20, –30, and –45 kPa treatments resulted in 71, 66, 65, and 50% of the tubers being produced between 0 and 50 mm from the experimental unit center, respectively. Overall, almost 65% of all the tubers produced in this experiment were located within 50 mm of the seed potato.
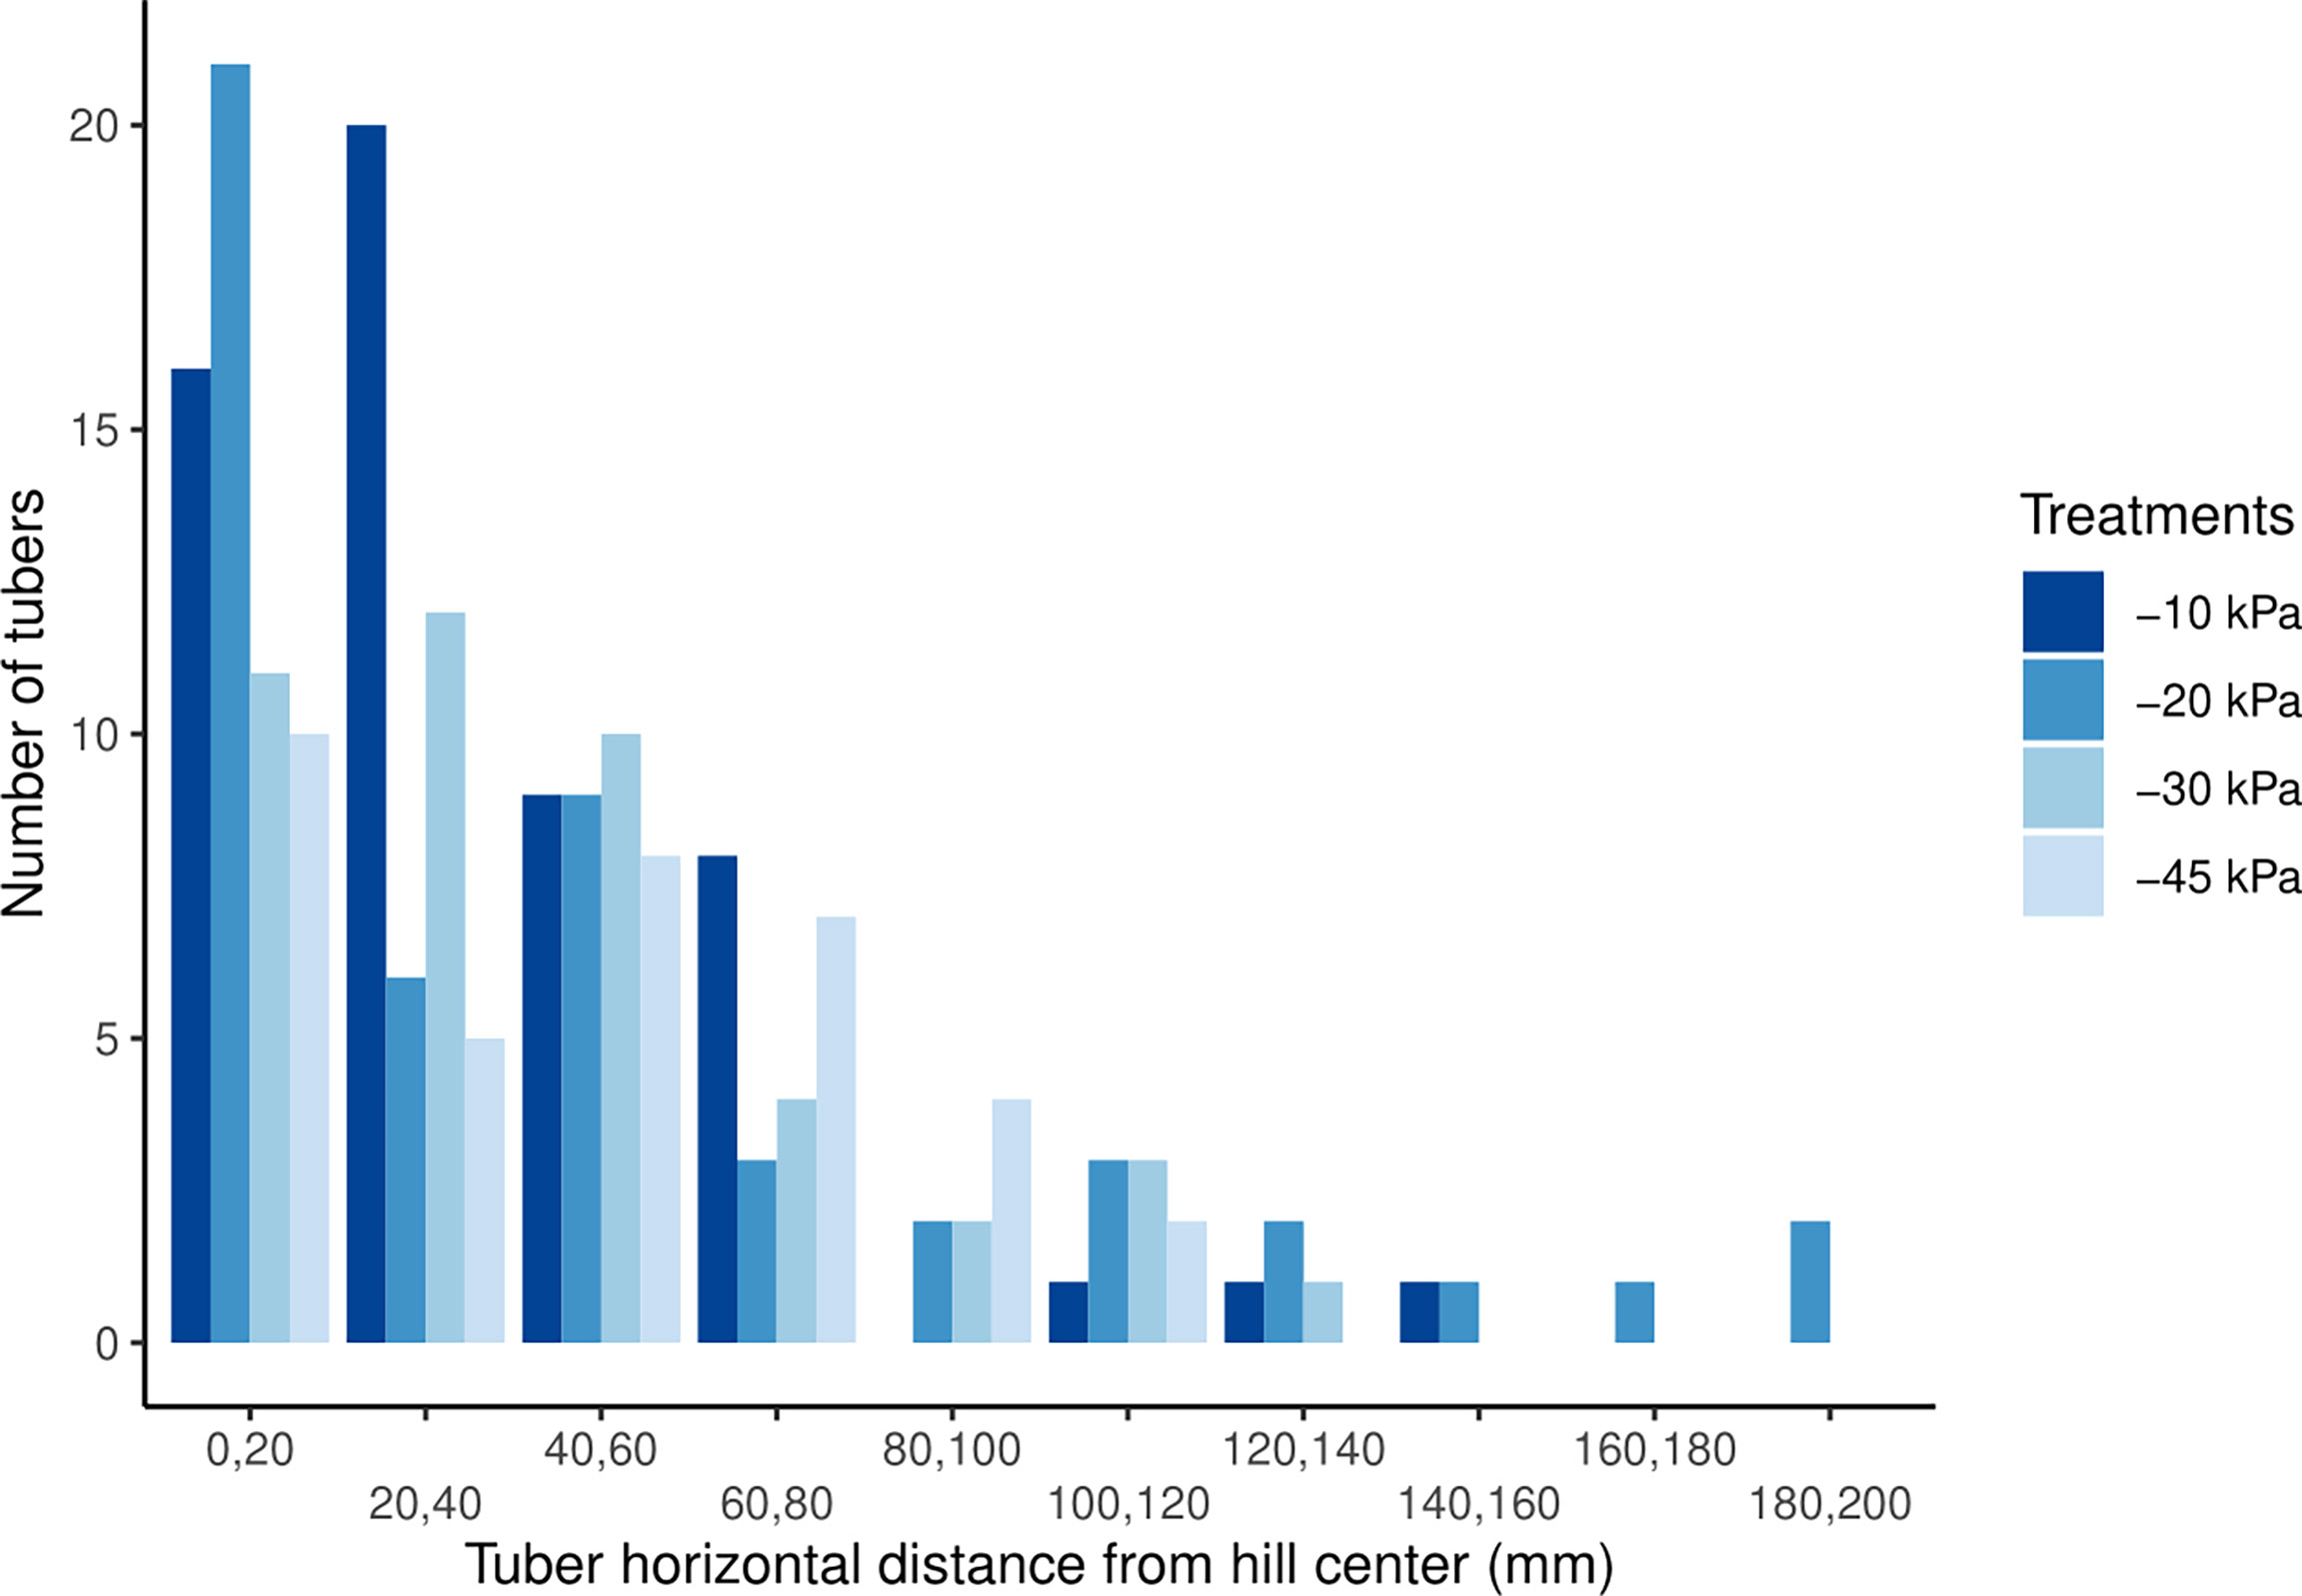
Figure 5 Representation of the number of tubers per 20–mm increment of soil from the center of the top of the potato hill for each irrigation treatment.
The compounded (horizontal and vertical) distribution of the tubers as tubers probability density distribution is shown in Figure 6. It further demonstrates that the irrigation treatments significantly affected the vertical distribution, while the horizontal distribution showed no such effect. It shows that the –10 kPa treatment resulted in tubers located deeper in the soil than in the other treatments, and the –45 kPa treatment resulted in the highest concentration of tubers close to the top of the hill.
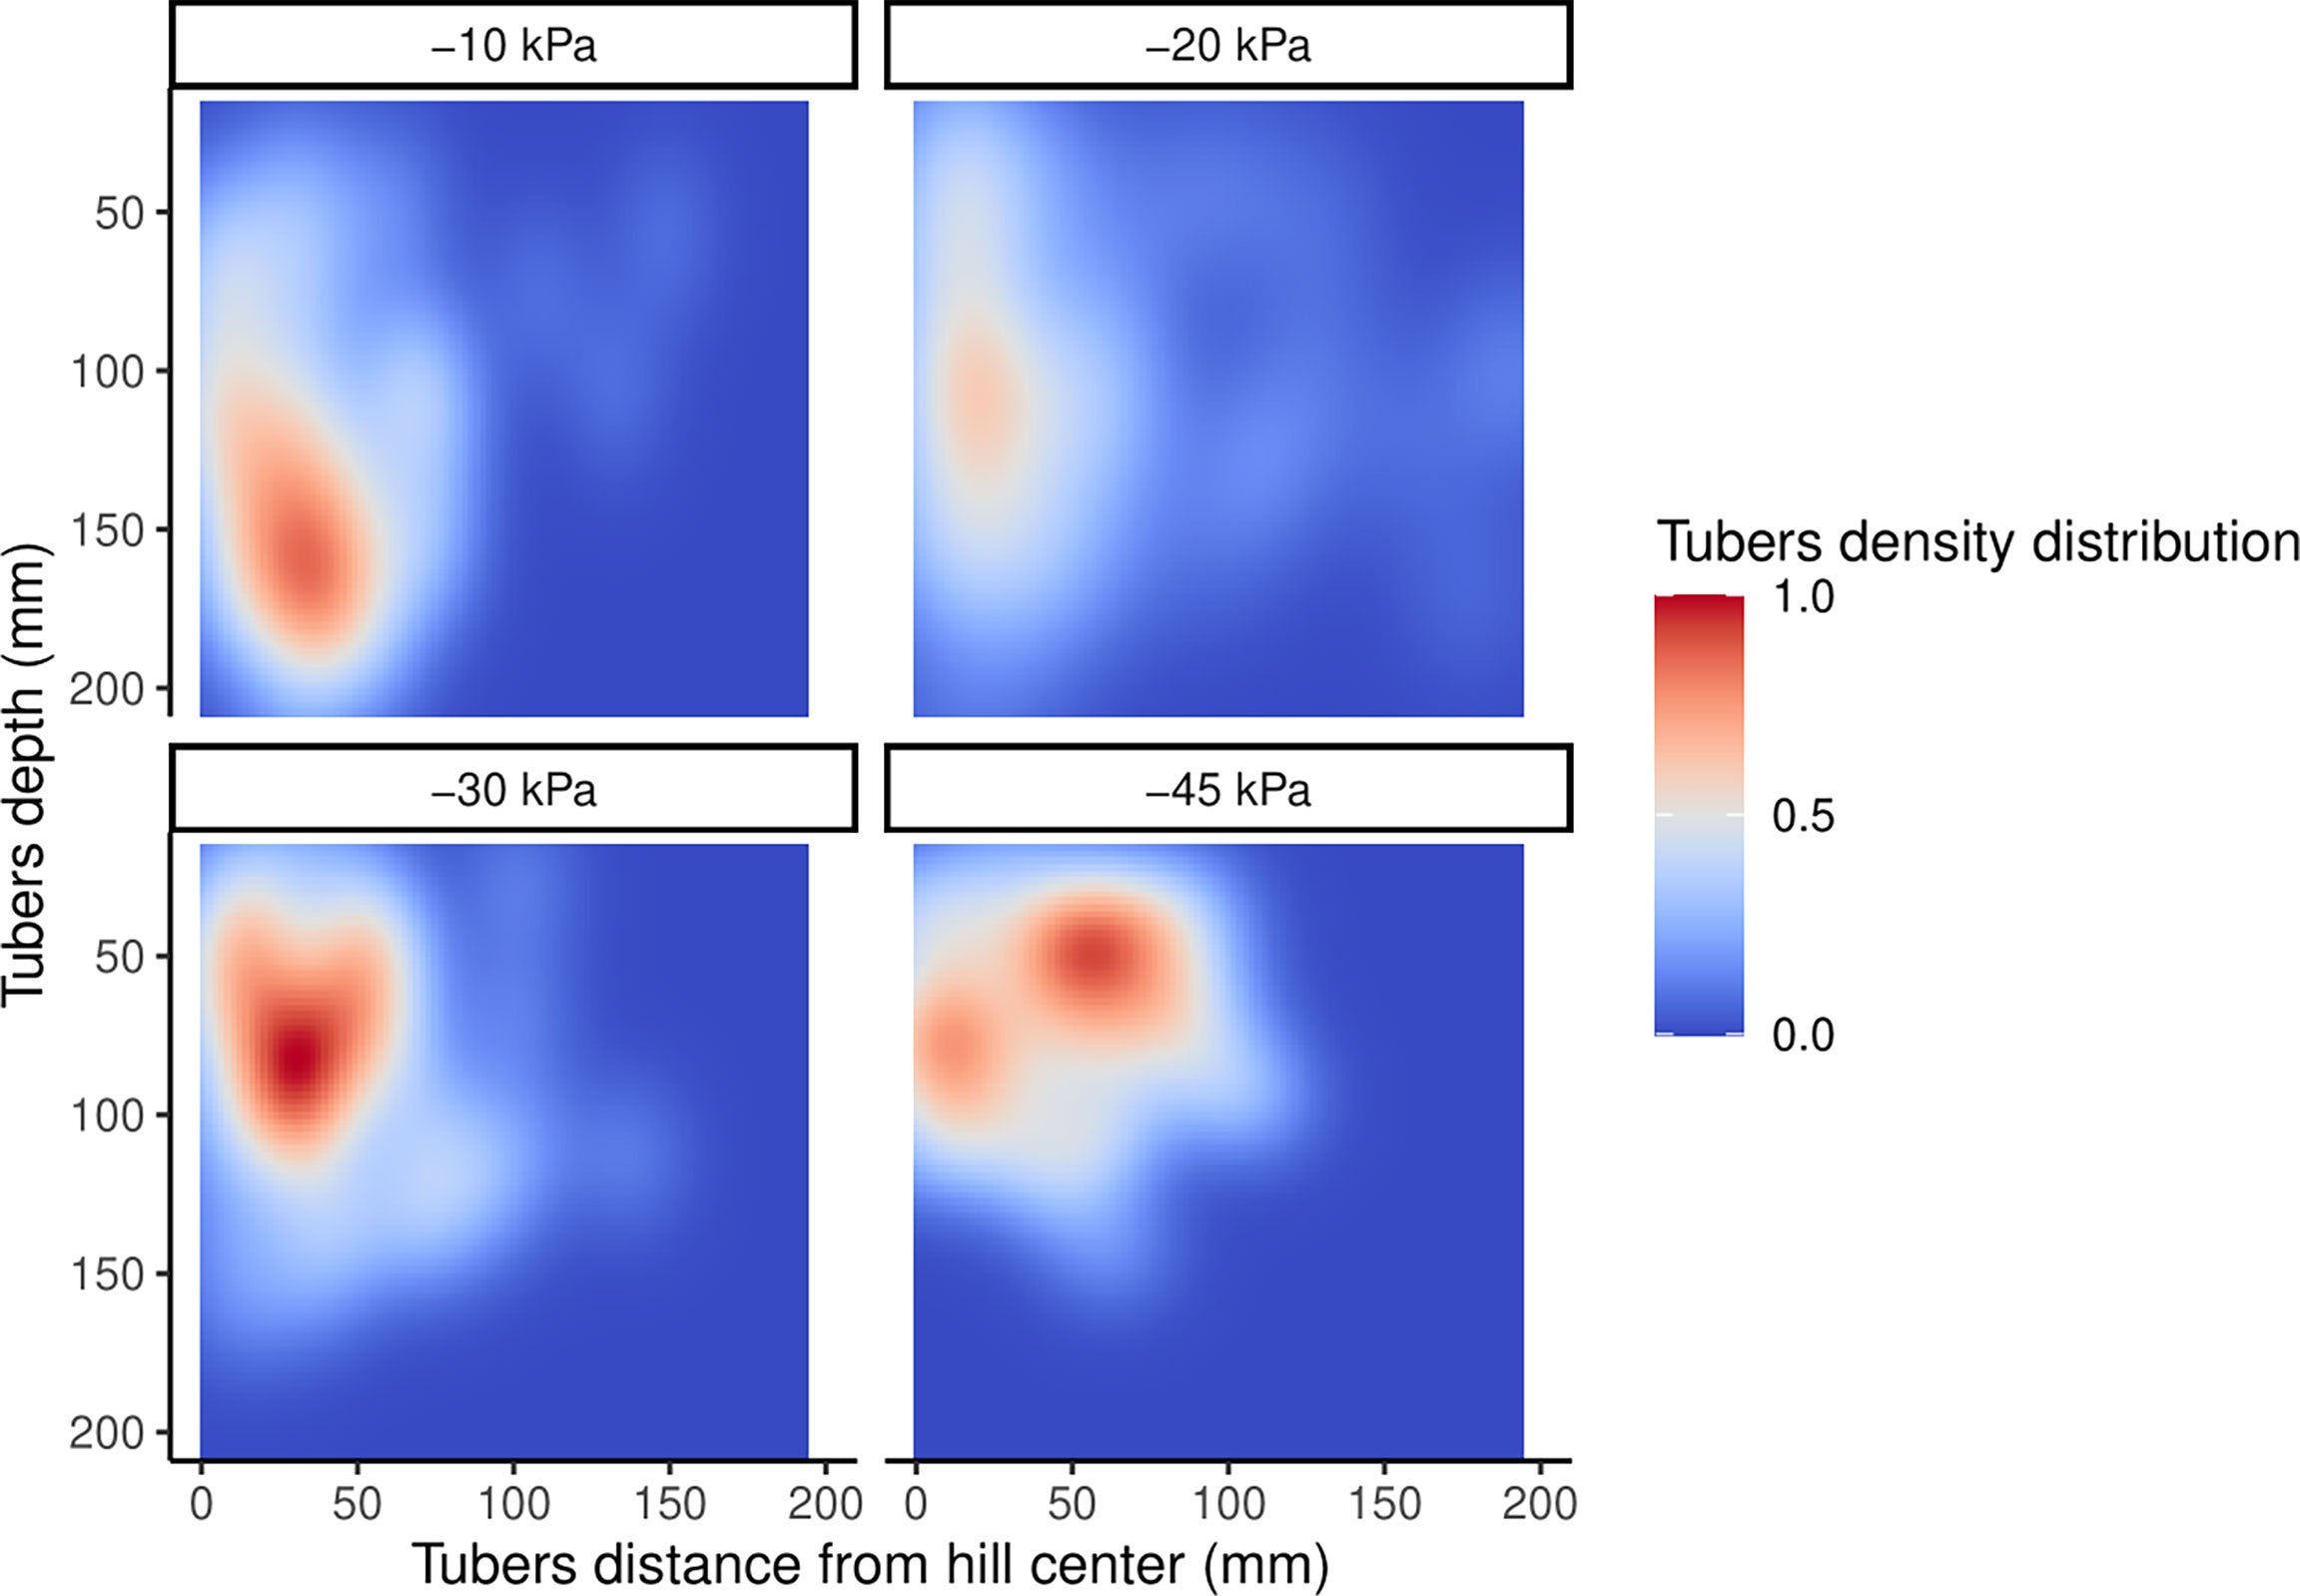
Figure 6 Two–dimensional (2D) kernel depicting the tubers probability density distribution under the four SMPT treatments (−10, −20, −30, and −45 kPa). The Y axis shows the vertical distribution of the tubers and the X axis relates to the tubers distance from the center of the top of the potato hill.
This study demonstrates that water management may influence the spatial distribution of tubers in potato crops. The significant effect of the irrigation treatments on tuber depth indicates that irrigation may enhance the tuber lifting percentage, which is a harvest performance indicator referred to the percentage of potatoes harvested as a share of the total number of potatoes in the field. The results presented in this study suggest that a harvest depth of 20 cm could result in a potato lifting percentage of over 98% regardless of the irrigation treatment.
A reduction in potato harvest depth from 20 cm to 16 cm would reduce the potato lifting percentage from 98% to 73% under the –10 kPa treatment and 98% to 88% under the –20 kPa treatment. However, for the –30 and –45 kPa treatments, a reduction in harvest depth from 20 cm to 16 cm would not cause any reduction in the potato lifting percentage, reaching 100% for both depths. Therefore, a reduction in harvest depth should be combined with appropriate irrigation management to maximize potato lifting efficiency. A similar potato lifting efficiency decrease with a reduction in harvest depth has previously been found, with a potato lifting decline from 93% to 87% with a decrease of 21 cm to 18 cm of harvest depth (41).
Our results also demonstrate the impact of irrigation frequency on tuber spatial distribution. During most of the growing season, the total irrigation volume applied in the –10 and –20 kPa treatments was almost the same. Nevertheless, the irrigation recurrence time for the –20 kPa treatment was 30 hours longer than for the –10 kPa treatment. Even with the same total water volume, a higher wetting frequency creates a deeper and broader wetting front, which allowed a deeper tuber distribution in the –10 kPa treatment. Studies on potato roots found similar results, showing that root length density was lower in the upper soil layer under a higher irrigation frequency (42), and that root masses decreased under drier treatments (43). The effect of irrigation treatment and frequency seems to be linked with the wetting front and the water table depth. Therefore, the tuber distribution could react differently in heavy soil or soil with a shallow water table.
Previous studies have demonstrated that an SMPT between –15 and –25 kPa can sustain optimal water uptake and the highest yield in potato production (44–46). The use of a SMPT of –25 kPa can also lead to a higher potato lifting percentage and reduce the harvest depth without significant economic losses. Such a reduction in harvest depth could reduce fuel costs, greenhouse gas emissions, and soil disturbance, such as soil loss and erosion. Indeed, potato harvesting has been identified as a significant contributor to soil loss and erosion, with a mean annual net loss per harvest ranging between 1.81 Mg/ha and 3.2 Mg/ha-1 (4, 5). Thus, the harvest depth could be reduced by ensuring that potato tubers are produced in the soil’s upper layer with optimal control of the SMP and without any loss in economic profitability.
The results of the present study highlight a significant correlation between SMPT and potato tubers vertical distribution. A precisely timed and applied irrigation has been shown to be essential for the development of a deep, well–ramified root system capable of meeting potato crop water demand under high evapotranspiration conditions (47). The drought conditions caused by the SMPT of –30 kPa and –45 kPa may have prevented an adequate development of the root system, further preventing an optimal tubers development and distribution. Potato yield decreases have already been observed in drought conditions or under excessively dry SMPT (17, 35, 48).
In this study, the different irrigation treatments did not have a significant effect on the horizontal tuber spatial distribution. This result is not surprising, as the root horizontal distribution has been found to be only slightly sensitive to variation in irrigation (42).
The SMP has also been found a suitable method to assess the effect of water and oxygen on tubers depth. A difference of soil volumetric water content between 0.068 and 0.057 cm3/cm3 was sufficient to create a significant difference in tubers depth. These differences are equivalent to the difference between –10 and –30 kPa of SMP for the soil used in this study. Therefore, the mean tuber depth decreases when the soil volumetric water content decreases from 0.068 to 0.057 cm3/cm3. Indicating that even a minimal change in soil moisture can significantly affect the tuber depth and the suitability of using SMP to evaluate the effect of water management on potato crops.
On the other hand, tuber depth should be sufficient to reduce diseases such as late blight caused by Phytophthora infestans. A previous study showed that infection with late blight decreased as tuber depth increased (8). It has also been demonstrated that a deeper planting depth and hilling can significantly decrease tuber greening (10, 12), which is an important cause of quality loss occurring when tubers are exposed to light, leading nonphotosynthetic underground–modified stems to accumulate chlorophyll and potentially toxic glycoalkaloids (12, 49). Therefore, managing irrigation using a SMP of –45 kPa would increase the risk of late blight and tuber greening, as almost 20% of the tubers produced under –45 kPa in this experiment were within 4 cm of the top of the hill and the soil surface.
In this study, a linear relationship between irrigation and tuber depth in the soil was identified in a potato crop. We used a precision irrigation design triggered by a tensiometer sensor network to manage irrigation and obtain an accurate account of SMPT. The deepest tuber distribution was observed under the –10 kPa irrigation treatment, while the shallowest tuber distribution was observed in the –45 kPa irrigation treatment. Therefore, potato irrigation management using a SMPT between –20 and –30 kPa could optimize the harvest depth, which would also decrease the negative impacts of soil disturbance on soil structural stability and soil organic carbon degradation. A reduction in the depth of soil disturbance associated with harvest could improve soil physical and chemical properties, soil biology, and soil microbial communities in potato fields. In addition, CT scanning has been identified as a relevant and suitable approach to analyze the underground spatial distribution of potato tubers. It allowed the precise observation of the tuber distribution without any soil or root disturbance. Therefore, in future work, this method could be used to perform repeated measurements during multiple soil scans to observe tuber initiation and the evolution of the spatial distribution of tubers during the growing season. Future work could also evaluate the variation in tuber depth among potato varieties and under various soil conditions.
The raw data supporting the conclusions of this article will be made available by the authors, without undue reservation.
J–PM, PC, ES, TG and SG conceived the presented idea. J–PM, and SG conceived and designed the experiments. J–PM performed the experiments. PL and the CT scanning for civil engineering and natural resources laboratory took the CT images. J–PM and PL analyzed the data. J–PM took the lead in writing the manuscript. PC aided in interpreting the results and worked on the manuscript. All authors discussed the results and contributed to the final manuscript.
This research was funded by the NSERC (Natural Sciences and Engineering Research Council of Canada) grant number CRDPJ 514551–17.
The authors declare that the research was conducted in the absence of any commercial or financial relationships that could be construed as a potential conflict of interest.
All claims expressed in this article are solely those of the authors and do not necessarily represent those of their affiliated organizations, or those of the publisher, the editors and the reviewers. Any product that may be evaluated in this article, or claim that may be made by its manufacturer, is not guaranteed or endorsed by the publisher.
The authors wish to thank the students and technicians involved in the project for their field and laboratory works. Special thanks are extended to Jonathan Lafond and Virginie Vanlandeghem for their support and comments on the experiments. The authors wish to thank Louis–Frédéric Daigle for his help with the identification of the CT parameters and the CT scanning.
1. Haverkort AJ, Verhagen A. Climate Change and Its Repercussions for the Potato Supply Chain. Potato Res (2008) 5:1 223–37. doi: 10.1007/s11540-008-9107-0
2. Richter GM, Qi A, Semenov MA, Jaggard KW. Modelling the Variability of UK Sugar Beet Yields Under Climate Change and Husbandry Adaptations. Soil Use Manage (2006) 22:39–47. doi: 10.1111/j.1475-2743.2006.00018.x
3. USDA National Agricultural Statistics Service. NASS - Quick Stats. (2020) Available at: https://www.nass.usda.gov/Quick_Stats/.
4. Ruysschaert G, Poesen J, Verstraeten G, Govers G. Soil Losses Due to Mechanized Potato Harvesting. Soil Tillage Res (2006) 86:52–72. doi: 10.1016/j.still.2005.02.016
5. Parlak M, Blanco-Canqui H. Soil Losses Due to Potato Harvesting: A Case Study in Western Turkey. Soil Use Manage (2015) 31:525–7. doi: 10.1111/sum.12225
6. Yu Hq, Li Y, Zhou N, Chappell A, Xy Li, Poesen J. Soil Nutrient Loss Due to Tuber Crop Harvesting and its Environmental Impact in the North China Plain. J Integr Agric (2016) 15:1612–24. doi: 10.1016/S2095-3119(15)61268-0
7. Thomaz EL, Bereze J. Soil Loss Due to Crop Harvest in Southern Brazil: Effect of Potato Morphology. Plant Soil (2021) 468:67–76. doi: 10.1007/s11104-021-05114-5
8. Porter LD, Dasgupta N, Johnson DA. Effects of Tuber Depth and Soil Moisture on Infection of Potato Tubers in Soil by Phytophthora Infestans. Plant Dis (2005) 89:146–52. doi: 10.1094/PD-89-0146
9. Shelton AM, Wyman JA. Potato Tuherworm Damage to Potatoes Under Different Irrigation and Cultural Practices. J Economic Entomology (1979) 72:261–4. doi: 10.1093/jee/72.2.261
10. Bohl WH, Love SL. Effect of Planting Depth and Hilling Practices on Total, U.S. No. 1, and Field Greening Tuber Yields. Am J Potato Res (2005) 82:441–50. doi: 10.1007/BF02872222
11. Pavek MJ, Thornton RE. Planting Depth Influences Potato Plant Morphology and Economic Value. Am J Potato Res (2009) 86:56–67. doi: 10.1007/s12230-008-9062-y
12. Tanios S, Eyles A, Tegg R, Wilson C. Potato Tuber Greening: A Review of Predisposing Factors,Management and Future Challenges. Am J Potato Res (2018) 95:248–57. doi: 10.1007/s12230-018-9648-y
13. Ojala JC. Effect of Water Stress on Potato Growth and Development. In: Proc. Of the University of Idaho Winter Commodity Schools (1987) 19:151–61.
14. Gandar PW, Tanner CB. Leaf Growth, Tuber Growth, and Water Potential in Potatoes 1. Crop Sci (1976) 16:534–8. doi: 10.2135/cropsci1976.0011183X001600040025x
15. Ojala JC, Stark JC, Kleinkopf GE. Influence of Irrigation and Nitrogen Management on Potato Yield and Quality. Am Potato J (1990) 67:29–43. doi: 10.1007/BF02986910
16. Walworth J, Carling D. Tuber Initiation and Development in Irrigated and non-Irrigated Potatoes. Am J Potato Res (2002) 79:1–9. doi: 10.1007/BF02871683
17. Chang DC, Jin YI, Nam JH, Cheon CG, Cho JH, Kim SJ, et al. Early Drought Effect on Canopy Development and Tuber Growth of Potato Cultivars With Different Maturities. Field Crops Res (2018) 215:156–62. doi: 10.1016/j.fcr.2017.10.008
18. Mooney SJ, Pridmore TP, Helliwell J, Bennett MJ. Developing X-Ray Computed Tomography to non Invasively Image 3-D Root Systems Architecture in Soil. Plant Soil (2012) 352:1–22. doi: 10.1007/s11104-011-1039-9
19. Mapoka KOM, Birrell SJ, Tekeste M. A Comprehensive Survey of Nondestructive Sensing Technologiesfor the Detection of Corn Seeds in a Closed Trench and Measuring Planting Depth to Augment the Conventional Method. Comput Electron Agric (2019) 158:249–57. doi: 10.1016/j.compag.2019.02.010
20. Farooque AA, Zare M, Abbas F, Bos M, Esau T, Zaman Q. Forecasting Potato Tuber Yield Using a Soilelectromagnetic Induction Method. Eur J Soil Sci (2020) 71:880–97. doi: 10.1111/ejss.12923
21. Majdi H. Root Sampling Methods - Applications and Limitations of the Minirhizotron Technique. Plant Soil (1996) 185:255–8. doi: 10.1007/BF02257530
22. Joslin JD, Wolfe MH. Disturbances During Minirhizotron Installation Can Affect Root Observation Data. Soil Sci Soc America J (1999) 63:218–21. doi: 10.2136/sssaj1999.03615995006300010031x
23. Hirano Y, Dannoura M, Aono K, Igarashi T, Ishii M, Yamase K, et al. Limiting Factors in the Detection of Tree Roots Using Ground-Penetrating Radar. Plant Soil (2009) 319:15–24. doi: 10.1007/s11104-008-9845-4
24. Ferreira SJ, Senning M, Sonnewald S, Kesling PM, Goldstein R, Sonnewald U. Comparative Transcriptome Analysis Coupled to X-Ray CT Reveals Sucrose Supply and Growth Velocity as Major Determinants of Potato Tuber Starch Biosynthesis. BMC Genomics (2010) 11:1–17. doi: 10.1186/1471-2164-11-93
25. Zhao Y, Takhar PS. Micro X-Ray Computed Tomography and Image Analysis of Frozen Potatoes Subjected to Freeze-Thaw Cycles. LWT - Food Sci Technol (2017) 79:278–86. doi: 10.1016/j.lwt.2017.01.051
26. Mousavi R, Miri T, Cox PW, Fryer PJ. Imaging Food Freezing Using X-Ray Microtomography. Int J Food Sci Technol (2007) 42:714–27. doi: 10.1111/j.1365-2621.2007.01514.x
27. Van Harsselaar JK, Clausen J, Lubeck J, Worlein N, Uhlmann N, Sonnewald U, et al. X-Ray CT Phenotyping Reveals Bi-Phasic Growth Phases of Potato Tubers Exposed to Combined Abiotic Stress. Front Plant Sci (2021) 12:541. doi: 10.3389/fpls.2021.613108
28. Ketcham RA, Carlson WD. Acquisition, Optimization and Interpretation of X-Ray Computed Tomographic Imagery: Applications to the Geosciences. Comput Geosci (2001) 27:381–400. doi: 10.1016/S0098-3004(00)00116-3
29. Taina IA, Heck RJ, Elliot TR. Application of X-Ray Computed Tomography to Soil Science: A Literature Review. Can J Soil Sci (2008) 88:1–20. doi: 10.4141/cjss06027
30. Bouyoucos GJ. Hydrometer Method Improved for Making Particle Size Analyses of Soils. Agron J (1962) 54:464. doi: 10.2134/agronj1962.00021962005400050028x
32. Centre De Référence En Agriculture Et Agroalimentaire Du Québec (CRAAQ). In: Guide De Référence En Fertilisation, 2e Édition (Québec) 473.
33. Mehlich A. Mehlich 3 Soil Test Extractant: A Modification of Mehlich 2 Extractant. Commun Soil Sci Plant Anal (1984) 5:1409–16. doi: 10.1080/00103628409367568
34. van Genuchten MT. A Closed-Form Equation for Predicting the Hydraulic Conductivity of Unsaturated Soils1. (1980) 44(5):892–8. doi: 10.2136/sssaj1980.03615995004400050002x.
35. Matteau JP, Célicourt P, Létourneau G, Gumiere T, Gumiere SJ. Effects of Irrigation Thresholds and Temporal Distribution on Potato Yield and Water Productivity in Sandy Soil. Agric Water Manage (2022) 264:107483. doi: 10.1016/j.agwat.2022.107483
36. Lafond JA, Han L, Allaire SE, Dutilleul P. Multifractal Properties of Porosity as Calculated From Computed Tomography (CT) Images of a Sandy Soil, in Relation to Soil Gas Diffusion and Linked Soil Physical Properties. Eur J Soil Sci (2012) 63:861–73. doi: 10.1111/j.1365-2389.2012.01496.x
40. Venables WN, Ripley BD. Modern Applied Statistics With S-PLUS Vol. OCLC. . New York, NY: Springer (2013). p. 1076236451.
41. Kheiry ANO, Elssir A, Rahma AE, Mohamed MA, Omer EA, Dong HJ, et al. Effect of Operation Variables of Potato Digger With Double Chain Conveyors on Crop Handling and Machine Performance. Int J Environ Agric Res (2018) 4:87–101. doi: 10.5281/zenodo.1302337
42. Wang FX, Kang Y, Liu SP. Effects of Drip Irrigation Frequency on Soil Wetting Pattern and Potato Growth in North China Plain. Agric Water Manage (2006) 79:248–64. doi: 10.1016/j.agwat.2005.02.016
43. Boguszewska-Mańkowska D, Zarzyńska K, Nosalewicz A. Drought Differentially Affects Root System Size and Architecture of Potato Cultivars With Differing Drought Tolerance. Am J Potato Res (2020) 97:54–62. doi: 10.1007/s12230-019-09755-2
44. Gumiere T, Gumiere SJ, Matteau JP, Constant P, Le´tourneau G, Rousseau AN. Soil Bacterial Community Associated With High Potato Production and Minimal Water Use. Front Environ Sci (2019) 6:161. doi: 10.3389/fenvs.2018.00161
45. Matteau JP, Celicourt P, Le´tourneau G, Gumiere T, Gumiere SJ. Potato Varieties Response to Soil Matric Potential Based Irrigation. Agronomy (2021) 11:352. doi: 10.3390/agronomy11020352
46. Wang FX, Kang Y, Liu SP, Hou XY. Effects of Soil Matric Potential on Potato Growth Under Drip Irrigation in the North China Plain. Agric Water Manage (2007) 88:34–42. doi: 10.1016/j.agwat.2006.08.006
47. Stalham M, Allen E. Effect of Variety, Irrigation Regime and Planting Date on Rooting. J Agric Sci (2001) 137:251–70. doi: 10.1017/S0021859601001332
48. Zarzyńska K, Boguszewska-Mańkowska D, Nosalewicz A. Differences in Size and Architecture of the Potato Cultivars Root System and Their Tolerance to Drought Stress. Plant Soil Environ (2017) 63:159–64. doi: 10.17221/4/2017-PSE
Keywords: soil matric potential, tuber spatial distribution, x-ray computed tomography, precision irrigation, water management, sustainable potato production, harvest efficiency, soil conservation
Citation: Matteau J-P, Celicourt P, Shahriarina E, Letellier P, Gumiere T and Gumiere SJ (2022) Relationship Between Irrigation Thresholds and Potato Tuber Depth in Sandy Soil. Front. Soil Sci. 2:898618. doi: 10.3389/fsoil.2022.898618
Received: 17 March 2022; Accepted: 23 May 2022;
Published: 29 June 2022.
Edited by:
Subhash Babu, Indian Agricultural Research Institute (ICAR), IndiaReviewed by:
Henry Oppong Tuffour, Kwame Nkrumah University of Science and Technology, GhanaCopyright © 2022 Matteau, Celicourt, Shahriarina, Letellier, Gumiere and Gumiere. This is an open-access article distributed under the terms of the Creative Commons Attribution License (CC BY). The use, distribution or reproduction in other forums is permitted, provided the original author(s) and the copyright owner(s) are credited and that the original publication in this journal is cited, in accordance with accepted academic practice. No use, distribution or reproduction is permitted which does not comply with these terms.
*Correspondence: Jean-Pascal Matteau, amVhbi1wYXNjYWwubWF0dGVhdUBhZ3IuZ2MuY2E=
†Previous address: Jean-Pascal Matteau, Department of Soils and Agri-food Engineering, Laval University, Quebec, QC, Canada
Disclaimer: All claims expressed in this article are solely those of the authors and do not necessarily represent those of their affiliated organizations, or those of the publisher, the editors and the reviewers. Any product that may be evaluated in this article or claim that may be made by its manufacturer is not guaranteed or endorsed by the publisher.
Research integrity at Frontiers
Learn more about the work of our research integrity team to safeguard the quality of each article we publish.