 Thomas Sibret1,2*
 Marijn Bauters1,2
 Emmanuel Bulonza1,3
 Lodewijk Lefevre1,2,4
 Paolo Omar Cerutti5Michel Lokonda6,7José Mbifo6Baudouin Michel3
 Hans Verbeeck2
 Pascal Boeckx1
- 1Isotope Bioscience Laboratory - ISOFYS, Ghent University, Ghent, Belgium
- 2CAVElab, Computational and Applied Vegetation Ecology, Department of Environment, Ghent University, Ghent, Belgium
- 3Ecole Régionale d’Aménagement et Gestion Intégrés des Forêts et Territoires tropicaux (ERAIFT), Kinshasa, Democratic Republic of Congo
- 4Centre of Excellence Plants and Ecosystems (PLECO), Department of Biology, University of Antwerp, Antwerp, Belgium
- 5Center for International Forestry Research (CIFOR), Nairobi, Kenya
- 6Institut national d’études et Recherche agronomiques (INERA)/Centre de Recherches de Yangambi, Yangambi, Democratic Republic of Congo
- 7Département Sol et Eau, Institut Facultaire des Sciences agronomiques, Institut Facultaire Des Sciences Agronomiques-YANGAMBI, Yangambi, Democratic Republic of Congo
The Congo basin is home to the second-largest tropical forest in the world. Therefore, it plays a crucial role in the regional water cycle, the global carbon cycle and the continental greenhouse gas balance. Yet very few field-based data on related processes exist. In the wake of global change, there is a need for a better understanding of the current and future response of the forest biome in this region. A new long-term effort has been set up to measure the exchange of greenhouse gasses between a humid lowland tropical forest in the Congo basin and the atmosphere via an eddy-covariance (EC) tower. Eddy-covariance research stations have been used for decades already in natural and man-made ecosystems around the globe, but the natural ecosystems of Central Africa remained a blind spot. The so-called “CongoFlux” research site has been installed right in the heart of the Congo Basin, at the Yangambi research center in DR Congo. This introductory paper presents an elaborated description of this new greenhouse gas research infrastructure; the first of its kind in the second-largest tropical forest on Earth.
1 Introduction
With almost 200 Mha of humid forest, the Congo basin is home to the largest tropical rainforest in the world, second to the Amazon basin (550 Mha). Besides being recognized as a biodiversity hotspot (1), and an important resource pool for the livelihood (e.g. food, wood, medicine) of local communities (2), this region plays a crucial role in the regional circulation of water (3, 4), the global carbon cycle (5, 6) and the continental greenhouse gas (GHG) balance (7). The Congo basin strongly regulates regional precipitation patterns and dominates global tropical rainfall distribution during transition seasons, tightly influencing regional and global climate (3, 8). It sequesters approximately 0.59 Mg C ha-1 yr-1 making it the tropical region with the largest carbon uptake per unit of area (6, 9). Moreover, the net full GHG sink in forests of the Congo basin is approximated at 0.61 Gt CO2equivalent yr-1, which is six times stronger than the Amazon basin, although its surface is smaller in extent (7).
Despite its global and regional importance, the Congo basin has among the least environmental observations worldwide (10). The under-representation of the studies conducted in the Congo basin limits our understanding of the contribution of this part of the world to water, carbon and GHG cycles (8, 11–13). A better understanding of this ecosystem and the processes that drive the exchange of water, carbon and GHG fluxes is essential if we want to quantify its role in global change and its response to a changing environment (14). Moreover, such data are also needed to quantify national carbon inventories from deforestation and forest degradation (15, 16). With both the IPCC reports (17, 18) and Paris Agreement (19) recognizing that climate change mitigation goals cannot be achieved without a substantial contribution from forests, it is clear that the above-described data, on the world’s second-largest forest extend, is essential to support the implementation of climate mitigation policies (7).
Baldocchi (20) advocated how a global network of long‐term eddy-covariance (EC) flux measurements can help towards a better understanding of terrestrial ecosystems and the processes that drive GHG and energy exchange rates. Over the last decades, the EC technique (21) has been increasingly used to measure land-atmosphere exchanges of GHGs and energy at sites around the world (22, 23). This non-destructive measurement technique, based on high frequency (10–20 Hz) measurements of vertical wind velocity and a scalar (e.g. gas concentrations, temperature, etc.) allows quantification of GHG and energy fluxes at a high temporal resolution at ecosystem scale, making it a unique tool presenting a number of advantages over other techniques (24). Consequently, by analyzing long-term EC-measurements, one can study the spatio-temporal variability of ecosystems’ metabolism (20). Furthermore, this technique can be used to study the response of ecosystems’ metabolism to varying biophysical factors such as climate, phenology, plant functional and structural properties (25–29). As fluxes need to be measured within the boundary layer above the ecosystem of interest, it is essential that the required equipment is installed on a physical structure reaching the correct measurement height (e.g., in a forest stand), so-called “flux towers”.
In 2019, a total of 1421 known active EC sites existed (22). Fluxnet’s FLUXNET2015 dataset provides ecosystem-scale EC data from 212 of these sites (23). Despite these high numbers and the need for a pan-African network of EC flux towers (12, 30), only a total of 11 active EC stations are recording flux data across the entire African continent (13), with no single data reported for the second-largest tropical rainforest extend in the world.
Here we present a new EC research site, situated in Yangambi in the Democratic Republic of the Congo (DR Congo). Yangambi is situated in the heart of the Congo basin and was independently identified as an ideal region to prioritize long-term tropical forest monitoring (31) and the installation of a GHG monitoring station in Africa (32). The specific scientific objectives of this EC station are to 1) measure inter- and intra-annual CO2 and H2O exchange allowing to quantify the net ecosystem exchange (NEE) and water use efficiency (WUE), 2) measure N2O and CH4 fluxes for full GHG balance quantification and 3) determine the impact of atmospheric pollution including N deposition, tropospheric ozone (O3) and black carbon (BC) on the NEE.
2 Materials and Equipment
2.1 Site Description
2.1.1 Yangambi – a Rich History as Research Site
The CongoFlux research site is situated at the “Institut National pour l’Etude et la Recherche Agronomique” (INERA), Research Centre of Yangambi (“Centre de Recherche de Yangambi” - CRY) in the very heart of the Congo basin. The site is located on the right bank of the Congo river, ca. 100 km northwest of Kisangani, the major city of the Tshopo Province (33) (Figure 1A). The Research Centre has played a historical leading role as a centre of expertise for tropical forestry and agricultural research (soil survey and fertility, phytopathology, plant breeding and botany of perennial and annual crops, etc) in the DR Congo.
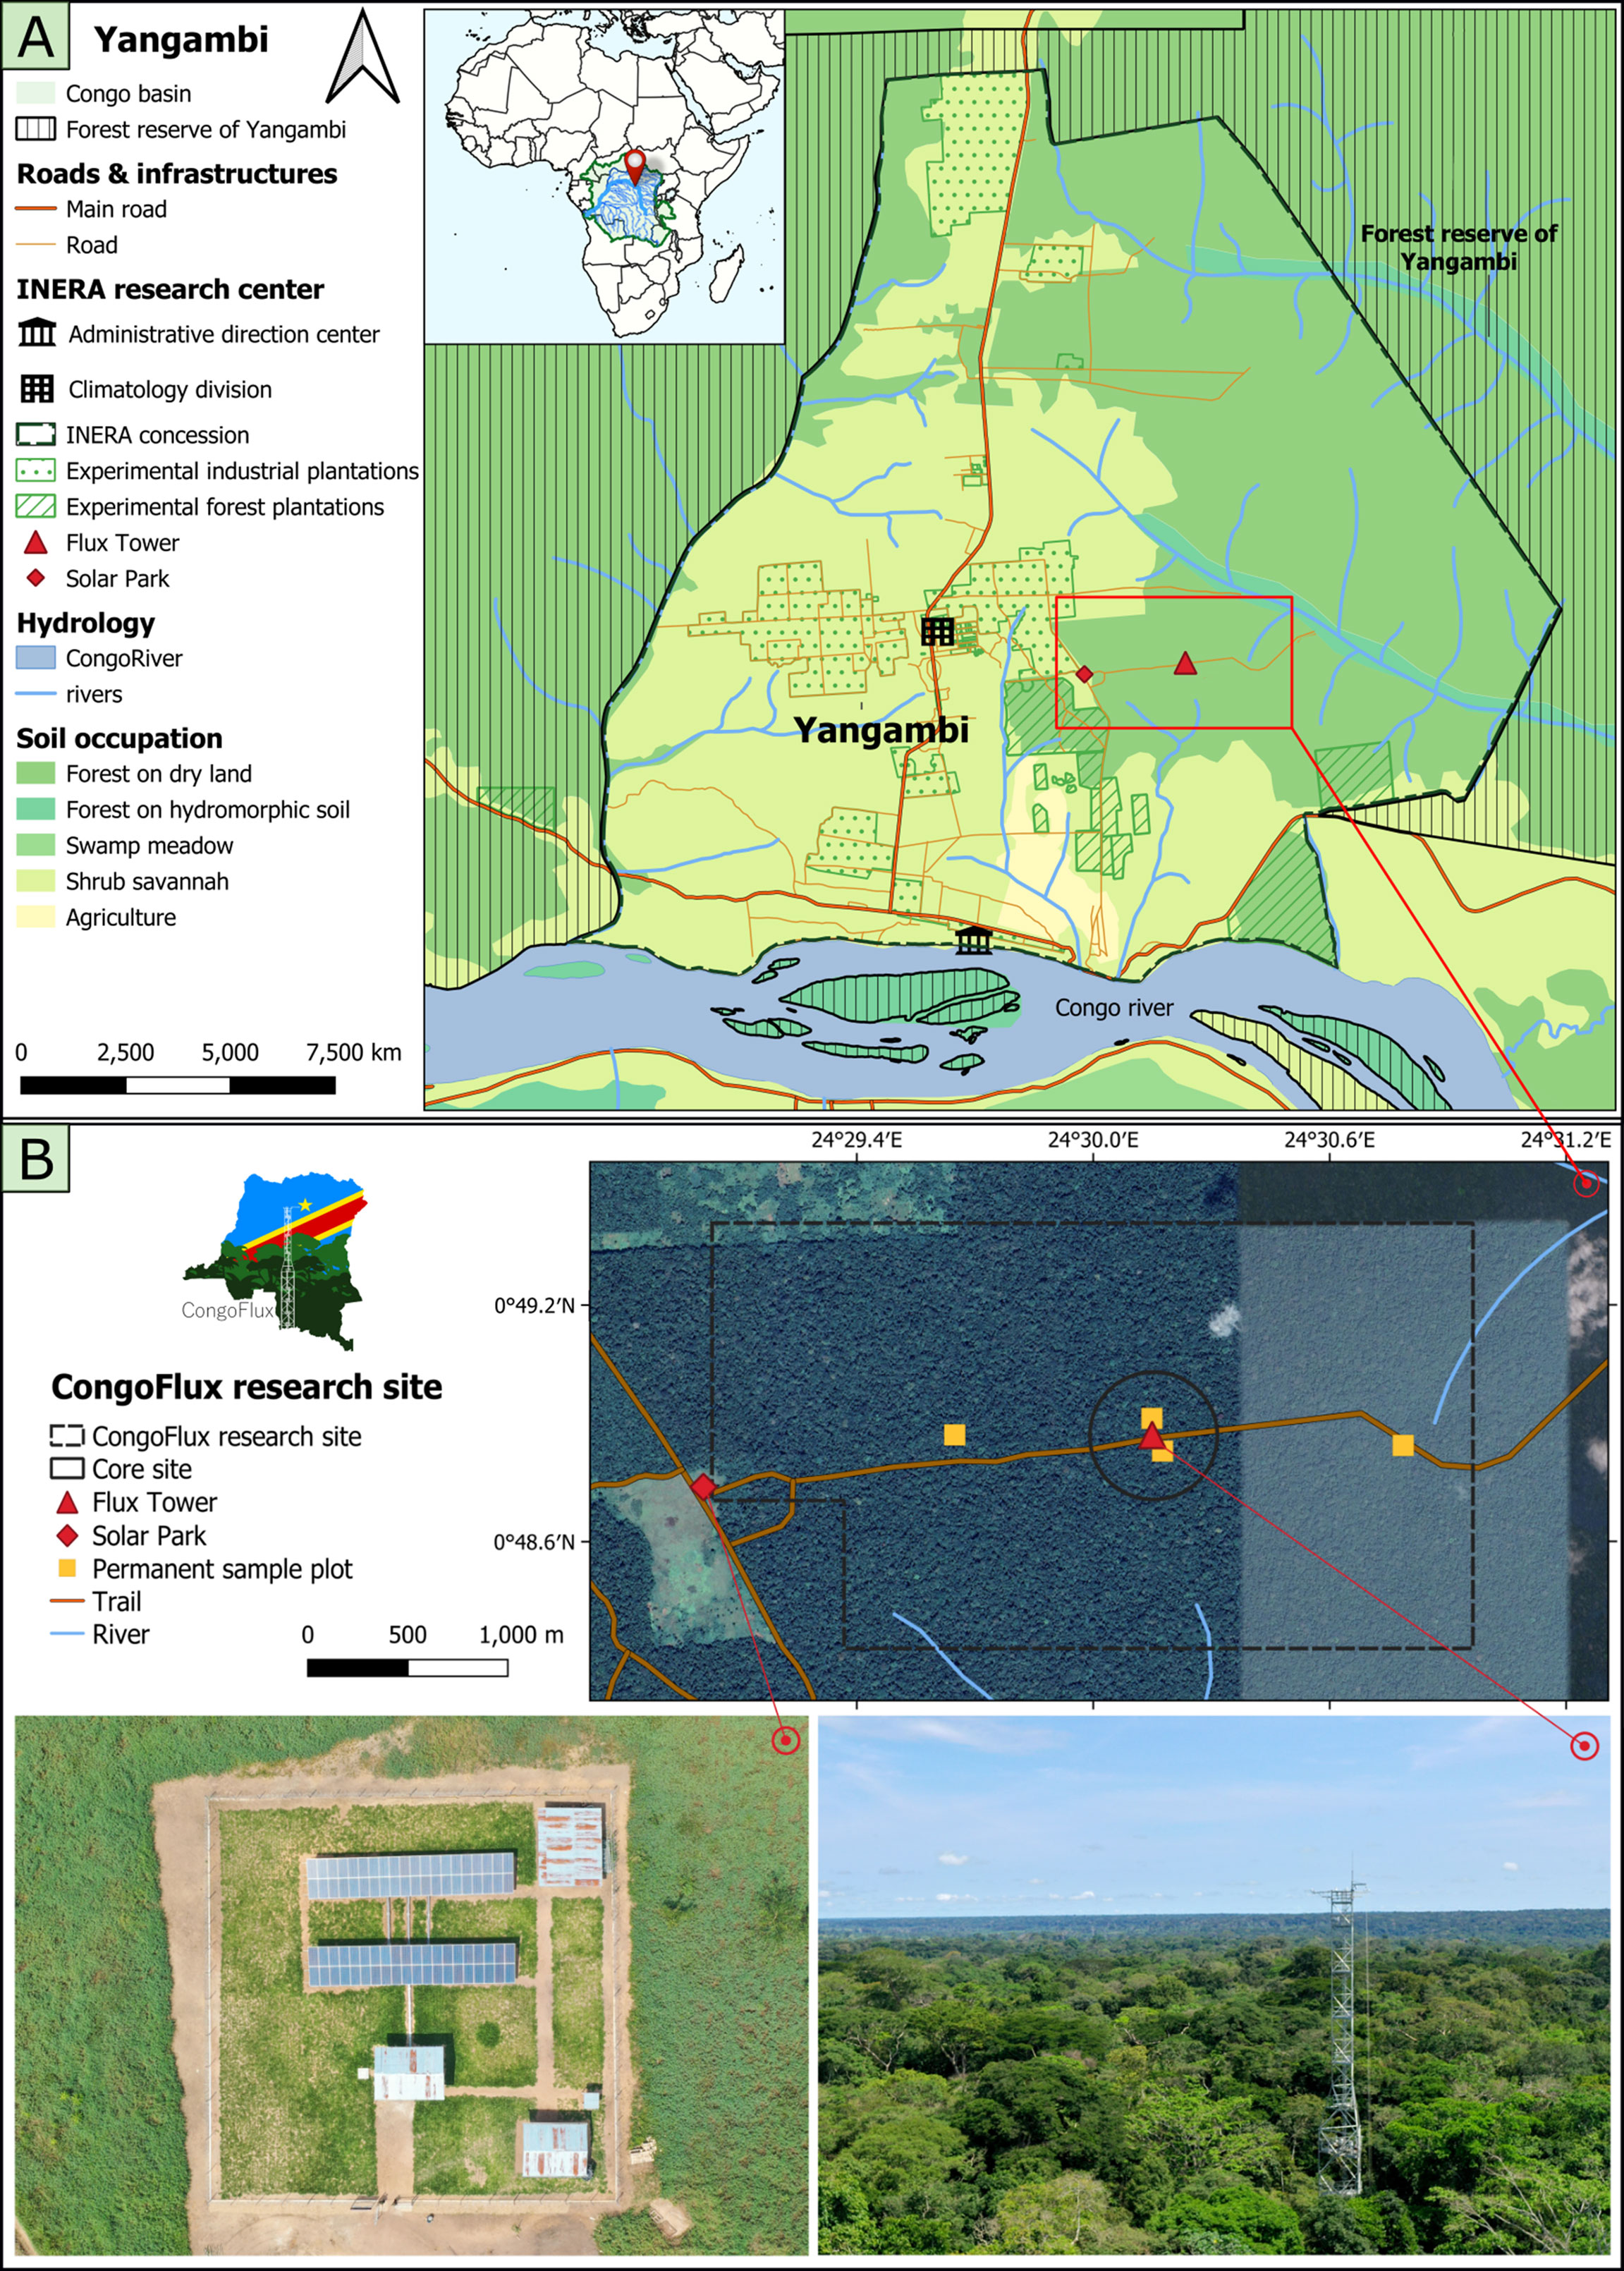
Figure 1 Map of the research center of Yangambi in the Democratic Republic of the Congo (Panel (A) and detailed map of the CongoFlux research site (Panel (B) with illustrations of the solar park (Panel (B) bottom left) and the 55m-tall eddy covariance flux tower (Panel (B) bottom right). Source: Shape-files of Yangambi downloaded at https://maps.elie.ucl.ac.be/geoportail/.
The CRY was founded in the 1930s as part of the “Institut National pour l’Étude Agronomique du Congo Belge” (INEAC) with the aim of promoting scientific development of the region, and it has a long and well-documented history (34, 35). In the 1950s, INEAC had up to 32 substations (research stations, experimental stations and plantations) spread all over different agro-ecological zones of the then Belgian Congo. As main station, CRY covered about 25,000 ha, bordering a forest area of over 200,000 ha, which allowed scientists to carry out tropical forestry and agronomic research (e.g. 33, 36). To support its scientific development objectives, CRY employed more than one hundred researchers working in twenty-one divisions, leaving behind a rich set of historical data and information still very useful today. For example, long-term records of meteorological data (since the 1930s), large scale forest plots where various silvicultural treatments were tested (34, 37), and one of the richest herbariums still well maintained in Sub-Saharan Africa.
The political and socio-economic turmoil affecting the DR Congo in recent decades did not spare the country’s research stations, including the CRY, with many research, collaboration and training activities coming to a halt over the years. Yet during the last decade, many efforts have been made by the Government in collaboration with financial and technical partners to revamp research activities – also following the ongoing LMD (Licence, Master, Doctorat) reforms – and the CRY is currently being re-established as an international center of research with the enormous potential to once again become a global benchmark for the study of tropical forests, agriculture, and agroforestry. In addition, due to its status as Man and Biosphere (MAB) Reserve (38), obtained in 1977 (39), the Yangambi Biosphere Reserve, including the CRY and the Forest reserve of Yangambi surrounding the CRY (Figure 1A), also has to sustain the socio-economic development of its neighboring communities. The region thus offers an opportunity to develop and test a ‘landscape approach’ by fostering research, training, educational activities (2), while promoting business innovation and incubation/acceleration of local small- and medium-scale enterprises to support local livelihoods.
2.1.2 The CongoFlux Research Site
The CongoFlux EC tower has been installed in a lowland mixed-species forest, east of the Yangambi research center (0°48’52.0”N 24°30’08.9”E, Figure 1A). According to a recent study (40), this region is part of a floristic group identified as semi-deciduous-evergreen transition being representative for over ca. 1,800 ha (i.e., 16%) of the African rainforests. Canopy height model (CHM) data derived from an unmanned aerial vehicle-digital aerial photogrammetry survey (UAV-DAP survey) performed within the research site (41) indicate the presence of a heterogeneous canopy with an average tree height of 29.3 m and 95% of the identified treetops ranging between 21.2m and 38.8 m (Supplementary Figure S1). The EC instrumentation is installed at a height of 56.25 m. To be able to install the equipment at this proper height, a tower structure (Figure 1B and Figure 3), having 11 secured platforms and its highest platform situated at 55 m, was constructed. The tower is supplied with electricity from a solar park (26.4 kWp) constructed 2.4 km west from the tower on an existing open spot (Figure 1B). All equipment is protected from lightning. The site is labelled as an associated station of the Integrated carbon observation network (ICOS) and FLUXNET [Station ID: CD-Ygb].
To avoid encroachment and to ensure data security and quality, two restricted areas were defined around the tower (Figure 1B). Within a 300 m radius from the tower, a core site has been established and activities are strictly limited. In a larger area surrounding the CongoFlux research site (Figure 1B), non-destructive experiments are allowed and even encouraged. Within this area, four 1-ha permanent sampling plots have been installed on the most dominant soil type (Haplic Ferrasols; Figure 2) to assess above-ground biomass, soil carbon and other biological variables such as tree mortality and fine root production according to the RAINFOR-GEM (Global Ecosystem Monitoring) field protocol (44). Lateral C exports will also be followed up by the use of flumes (installation planned in 2022).
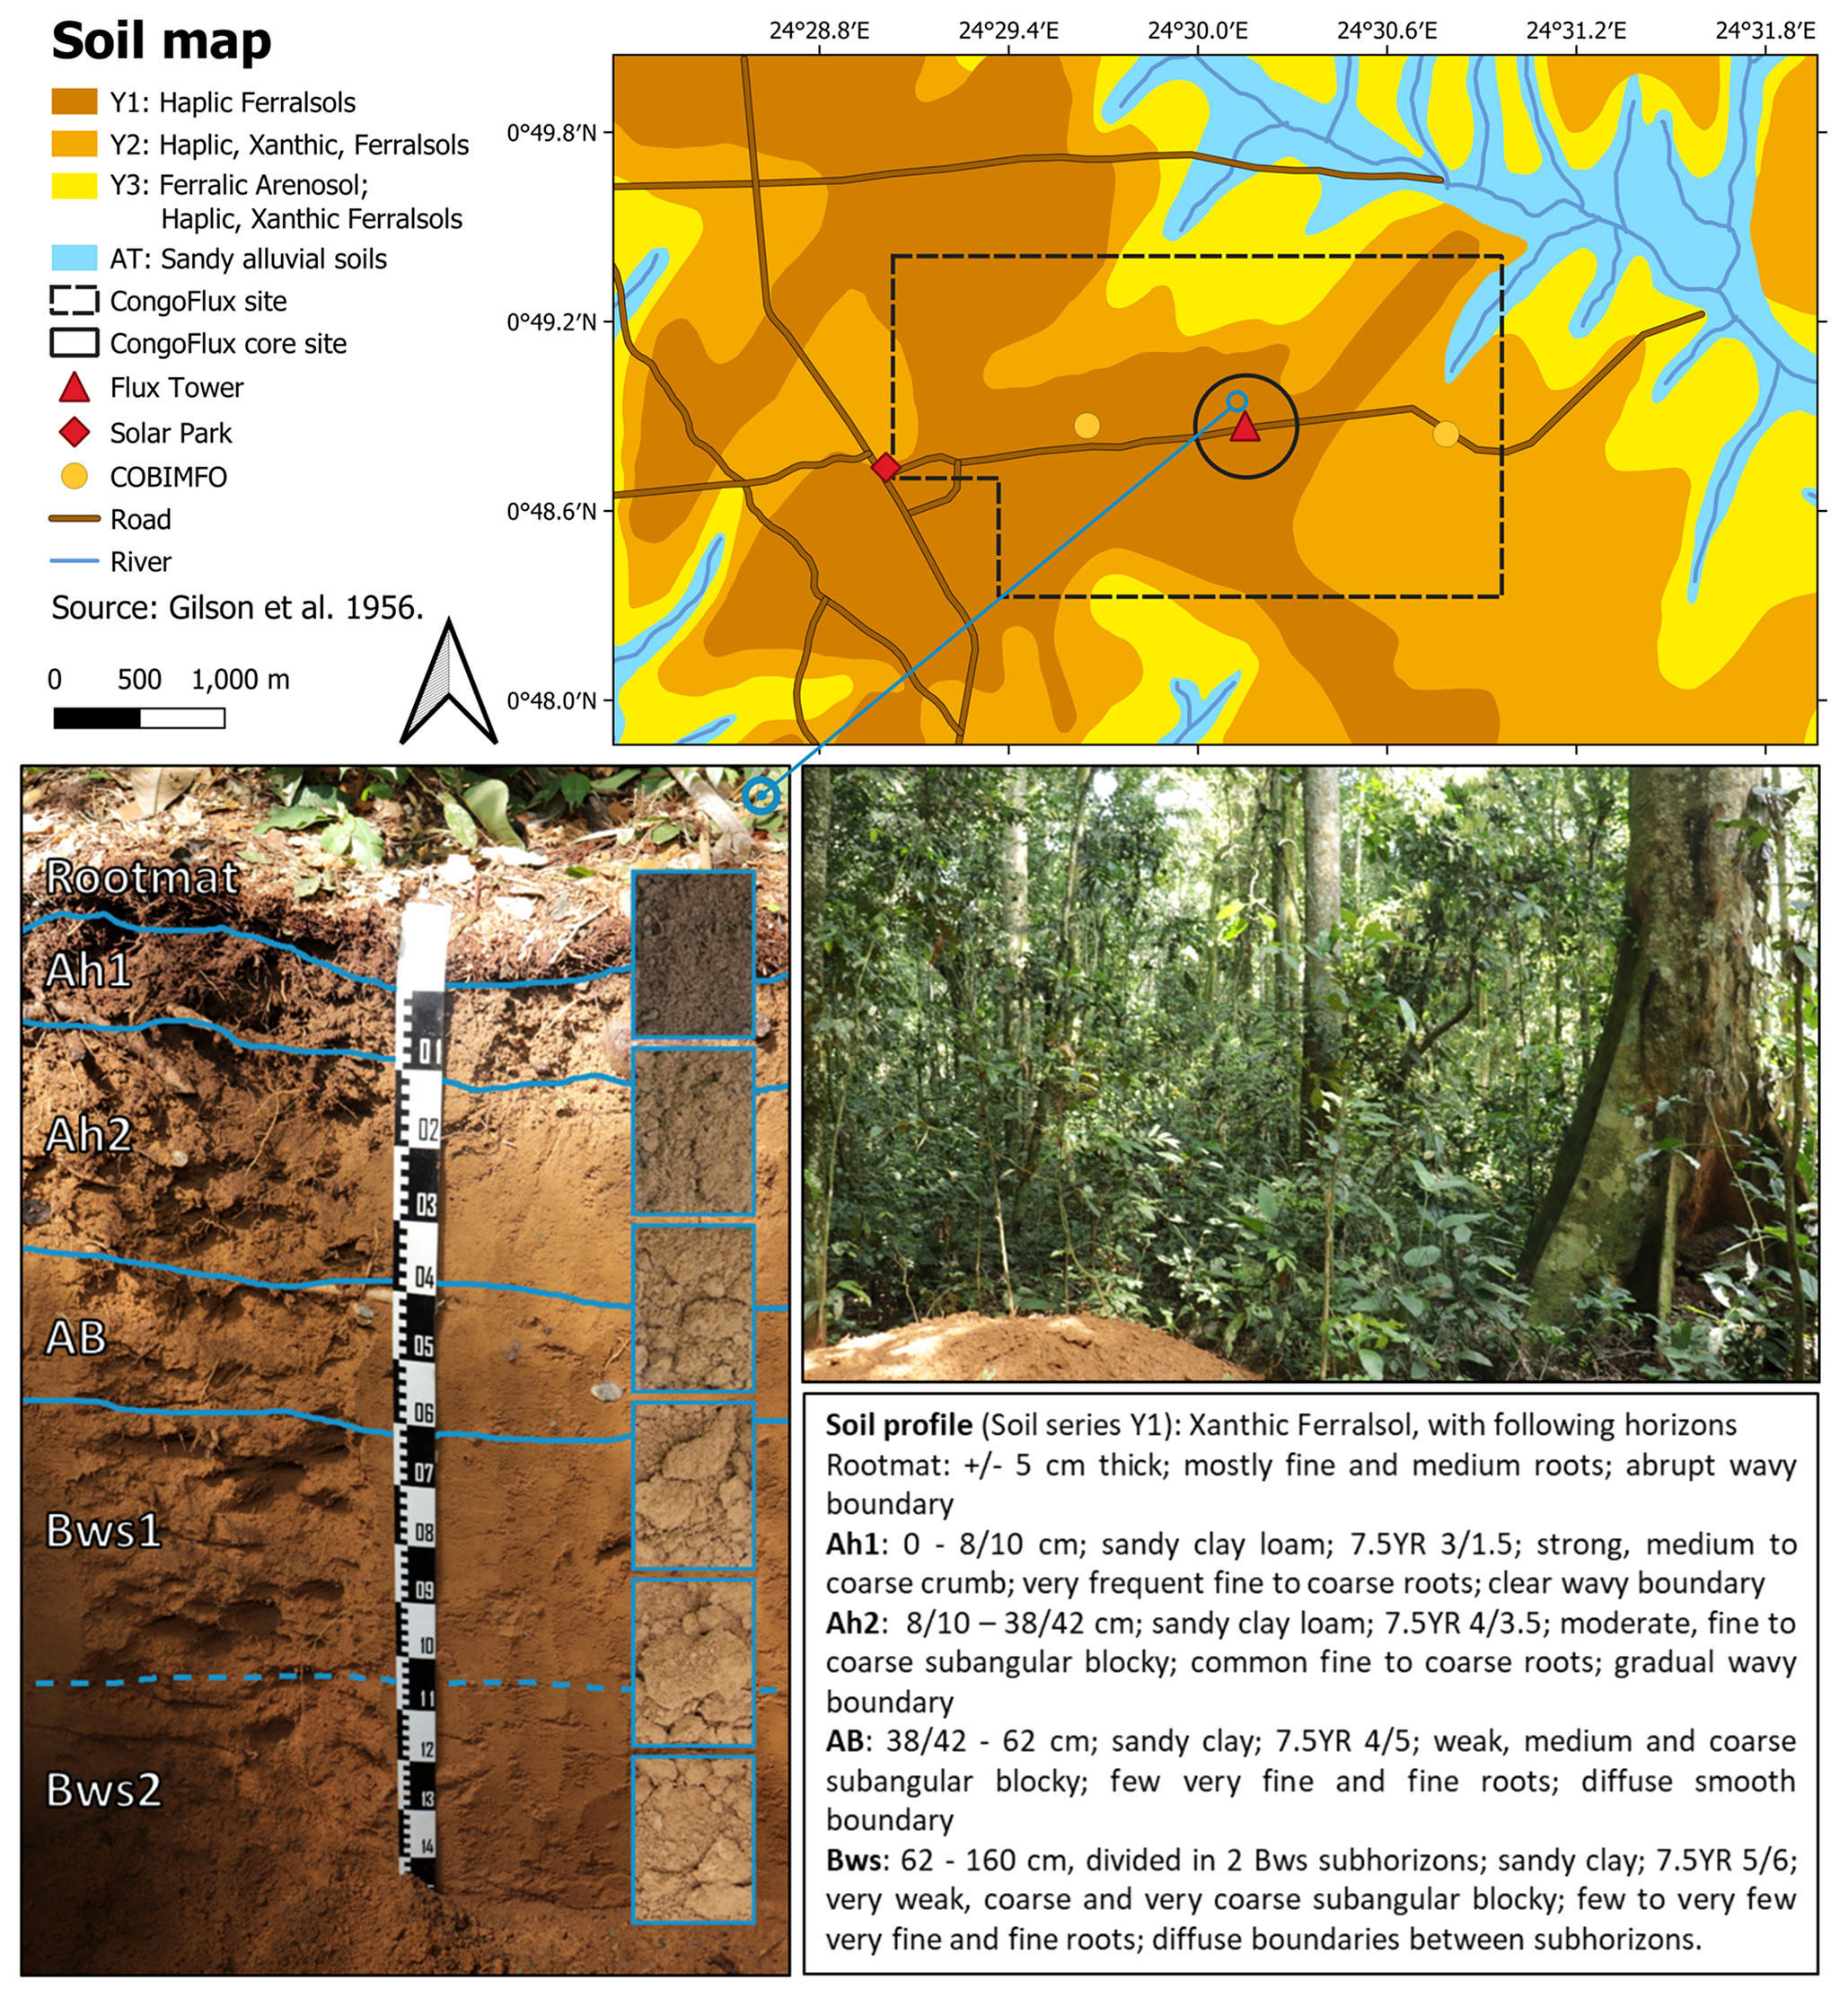
Figure 2 Soil map (top) of the CongoFlux research site and soil profile (bottom) of a Haplic Ferrasol (Y1) near the eddy covariance flux tower [0°48’52.0”N 24°30’08.9”E] in Yangambi, Democratic Republic of the Congo. The understory present on the described soil profile is also shown (middle-right). Source soil description: personal communication; Prof. Geert Baert. Soil classification reference: IUSS Working Group WRB (42). Source for soil map: (43).
2.1.3 Climate
The region has a tropical rainforest climate, Af-type according to the Köppen climate classification (45) (Supplementary Figure 2). It experiences a warm and humid climate characterized by a bimodal rain regime. From 1931 to 2017, it experienced a mean annual rainfall sum of 1811.7 ± 214.8 mm, 172 ± 22 rainy days (RDN), a relative air humidity (RH) of 87.2 ± 7.0%, a potential evapotranspiration (PET) of 1132.2 ± 54.4 mm and 2040 ± 98 hours of yearly sunshine (46). For the same period, the annual average temperature was 24.9 ± 0.3°C with annual average maximum and minimum temperatures of 29.8 ± 0.4°C and 19.8 ± 0.3°C, respectively (46).
2.1.4 Topography and Soils
The topography of the research area is characterized by the presence of two successive slightly undulating and deeply dissected plateaus, respectively at 50-70 m and 115-125 m above the Congo river (around 375 m a.s.l.) and its alluvial floodplains (47). The EC tower is located on the higher plateau at an altitude of 466 m a.s.l.
Soils and vegetation were mapped at a scale of 1:50.000 in the early 1950s (43, 48–50). Soil distribution (Figure 2) was hereby assessed by a large number of soil profiles and augering in the different landscape positions and by physicochemical analysis at the soil laboratory of the Yangambi research station. Additional soil data has been made available over the last decades (51–55). The parent material of the colluvial soils is composed of Pleistocene (fluvio-)aeolian sandy deposits. All soils developed on these deposits (in situ or reworked) are strongly weathered, i.e. Haplic or Xanthic Ferralsols (Y1 and Y2, Figure 2), and Xanthic Ferralsols and/or Sideralic Arenosols (Y3, Figure 2) on colluvial sediments bordering alluvial plains (AT, Figure 2) consisting mostly of very sandy poorly drained soils (42). From the plateaus downwards to the alluvial plains, a clear toposequence is observed. The clay content of the soils is gradually decreasing towards the valley floor, from 30-40% in Y1, over 20-30% in Y2 to < 20% in Y3. All soils are kaolinitic, acidic (pH-water <4.5) and poor in organic carbon (<1.5% in topsoil) and exchangeable cations Ca, Mg and K (sum <1 cmol(+) kg-1 soil in ferralic B-horizon). The CongoFlux research site is dominated by Haplic Ferrasols (Y1, Figure 2).
2.1.5 Vegetation
CongoFlux is installed in a mixed semi-deciduous moist forest. Vegetation belongs to the Oxystigmo-Scorodophloeion alliance (48) and is dominated by Scorodophloeus zenkeri, Panda oleosa, Anonidium mannii, Petersianthus macrocarpus, Stautia kamerunensis and Erythrophleum suaveolens species (37). According to Kearsley etal. (37), living trees (>10 cm diameter at breast height) of the forest stand have a mean stem density of 467 ± 99 trees ha-1, a mean basal area of 31.5 ± 3.3 m2 ha-1 and an average above-ground carbon stocks (AGC) of 160.5 ± 23.8 Mg C ha-1 whilst the soil organic carbon (SOC) is estimated at 95 ± 11 Mg C ha-1. Human activities, such as logging, are very rare and forest succession is thus mainly triggered by tree fall. This affects carbon and energy fluxes, and subsequently other nutrient cycles (36, 56).
Phenological traits, referring to periodic phenomena like flowering, leaf shedding and cambial activity (2), have a strong influence on ecosystems’ metabolism. In the tropical forests of Yangambi, a particularly wide variety of phenological patterns exist (2). Leaf shedding, for example, periodically occurs on both deciduous and evergreen species (36, 57). This trait influences material and energy exchange between the forest and the atmosphere (2).
2.2 Equipment
2.2.1 Installed Equipment
The first measurements of the “CongoFlux” research site have been launched on the 5th of October 2020, but were interrupted between the 29th of April 2021 and the 25th of October 2021 due to power issues. Currently this includes measurements of CO2, water vapor (H2O), latent heat (LE) and sensible heat (H) exchanges between the mixed semi-deciduous forest of the Yangambi Biosphere Reserve and the atmosphere. The CO2 and H2O concentrations are measured via an enclosed infrared gas analyzer (LICOR Biosciences, LI-7200RS, Lincoln, USA) coupled to a non-orthogonal 3-axis ultrasonic anemometer (Gill Instruments, HS-50, Lymington, UK), following the ICOS guidelines. These devices are logging 56.25 m above ground level with a frequency of 10 Hz (Figure 3). Furthermore, CO2, temperature and relative humidity (RH) profiles are measured at 8 heights along the tower (Figure 3). These measurements should allow to quantify inter- and intra-annual CO2, H2O and energy exchange and to derive net ecosystem exchange (NEE) and water use efficiency (WUE).
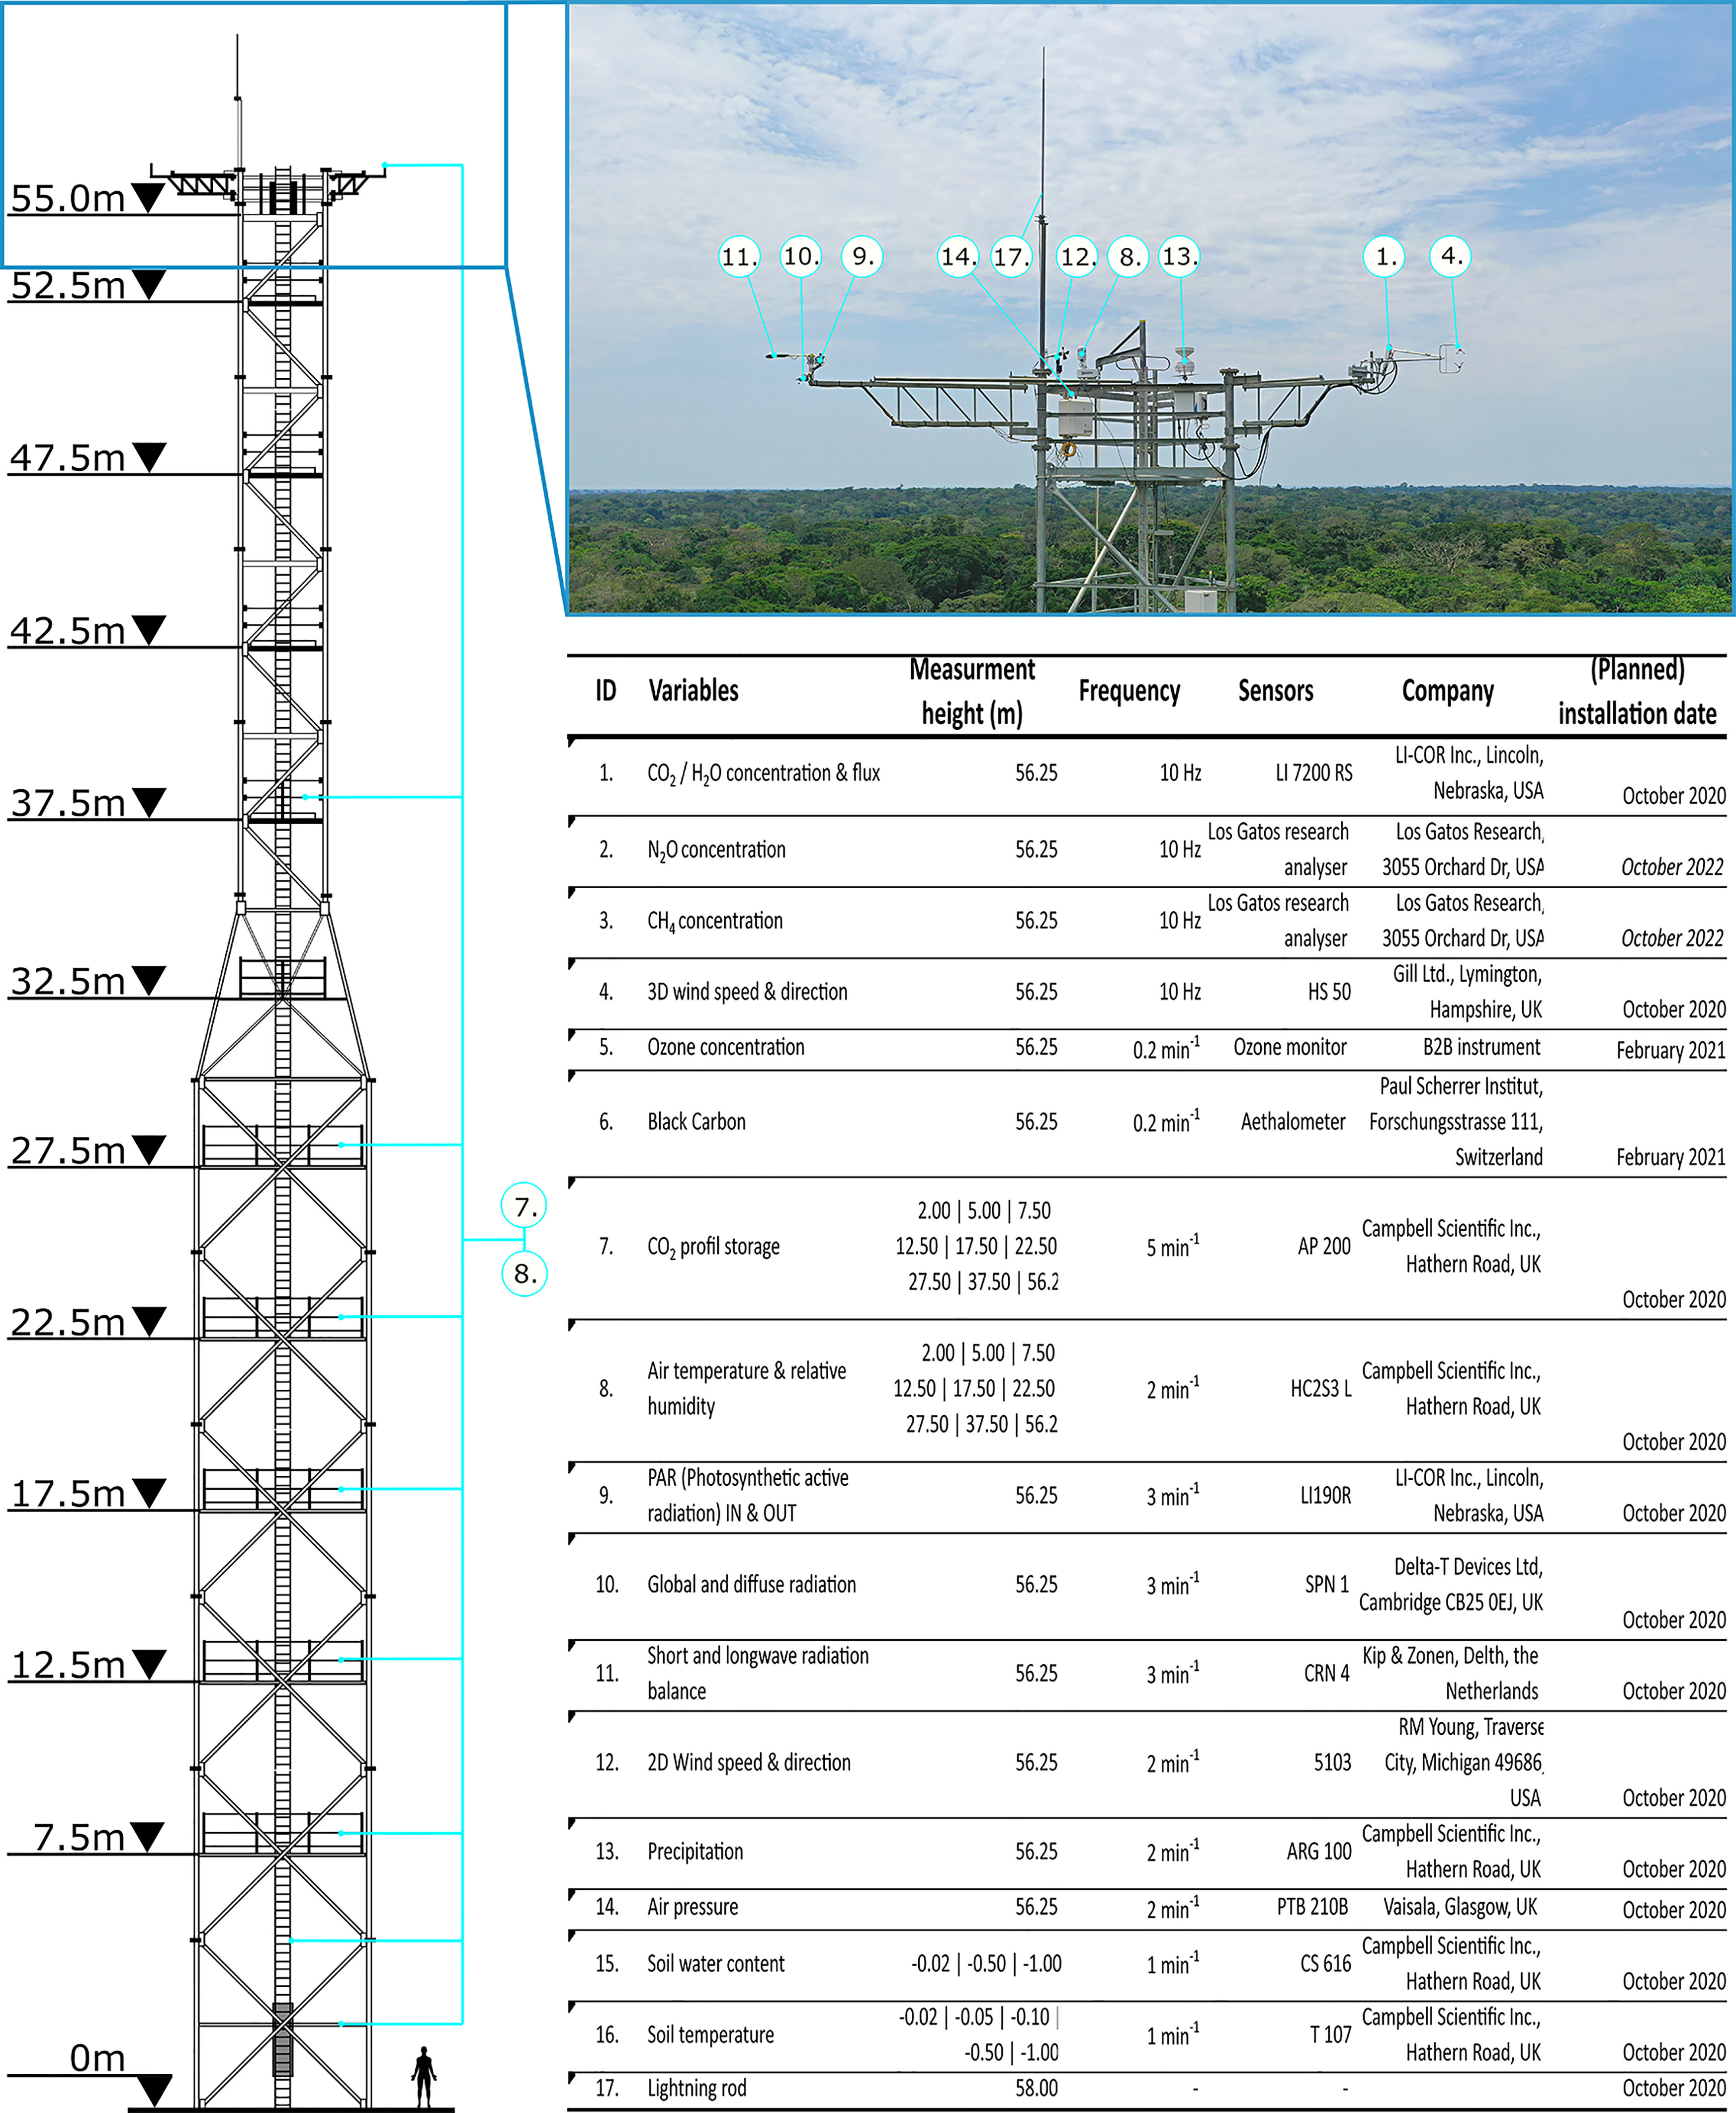
Figure 3 The CongoFlux eddy covariance flux tower structure and its equipment, Yangambi (DR Congo) [Top-right picture was taken on October 2020].
Moreover, an ensemble of meteorological and hydrological data is recorded, including incoming and outgoing short and longwave radiation, photosynthetic active radiation (PAR), incoming diffuse light, air pressure, temperature, precipitation and wind-direction and –speed (Figure 3). Such data should enable to analyze the climatic factors that control the seasonal patterns of NEE and WUE.
Soil microclimate is measured at three different soil pits around the tower. Each pit contains five soil temperature sensors (at 0.02, 0.05, 0.10, 0.50, 1.00 m depth) and three soil water content sensors (at 0.10, 0.50, 1.00 m depth) (Figure 3).
With the intention to study the impact of tropospheric ozone (O3) on the NEE, an O3 analyzer was mounted with an inlet at 56.25 m in February 2021.
2.2.2 Planned Equipment Installation
To achieve full GHG balance quantification, the site will also be equipped with a high-frequency N2O and CH4 analyzer (installation planned for 2022). Furthermore, during the same period, a system with nine automated soil chambers is to be installed to measure the CH4, N2O and CO2 fluxes between the soil and the atmosphere. In order to study the impact of black carbon (BC) on the NEE, a BC analyzer will be installed in 2022 at the same inlet height as the O3 analyzer (e.i. 56.25 m). Moreover, to further study atmospheric pollution’s impact on the NEE, an NOx analyzer will be installed (installation planned for 2023).
3 Demonstration
As a demonstration of what the tower will be measuring in the years to come, we present selected data of an average day for a 30-days wet period (23/10/2020 – 21/11/2020, Ptot = 283 mm) and an average day for a 30-days dry period (01/01/2021 – 30/01/2021, Ptot = 88 mm) (Figure 4). Although these data still need gap filling, storage correction and obviously longer monitoring periods are needed to conclude on the forest’s C and H2O balance, the data already show clear diurnal patterns.
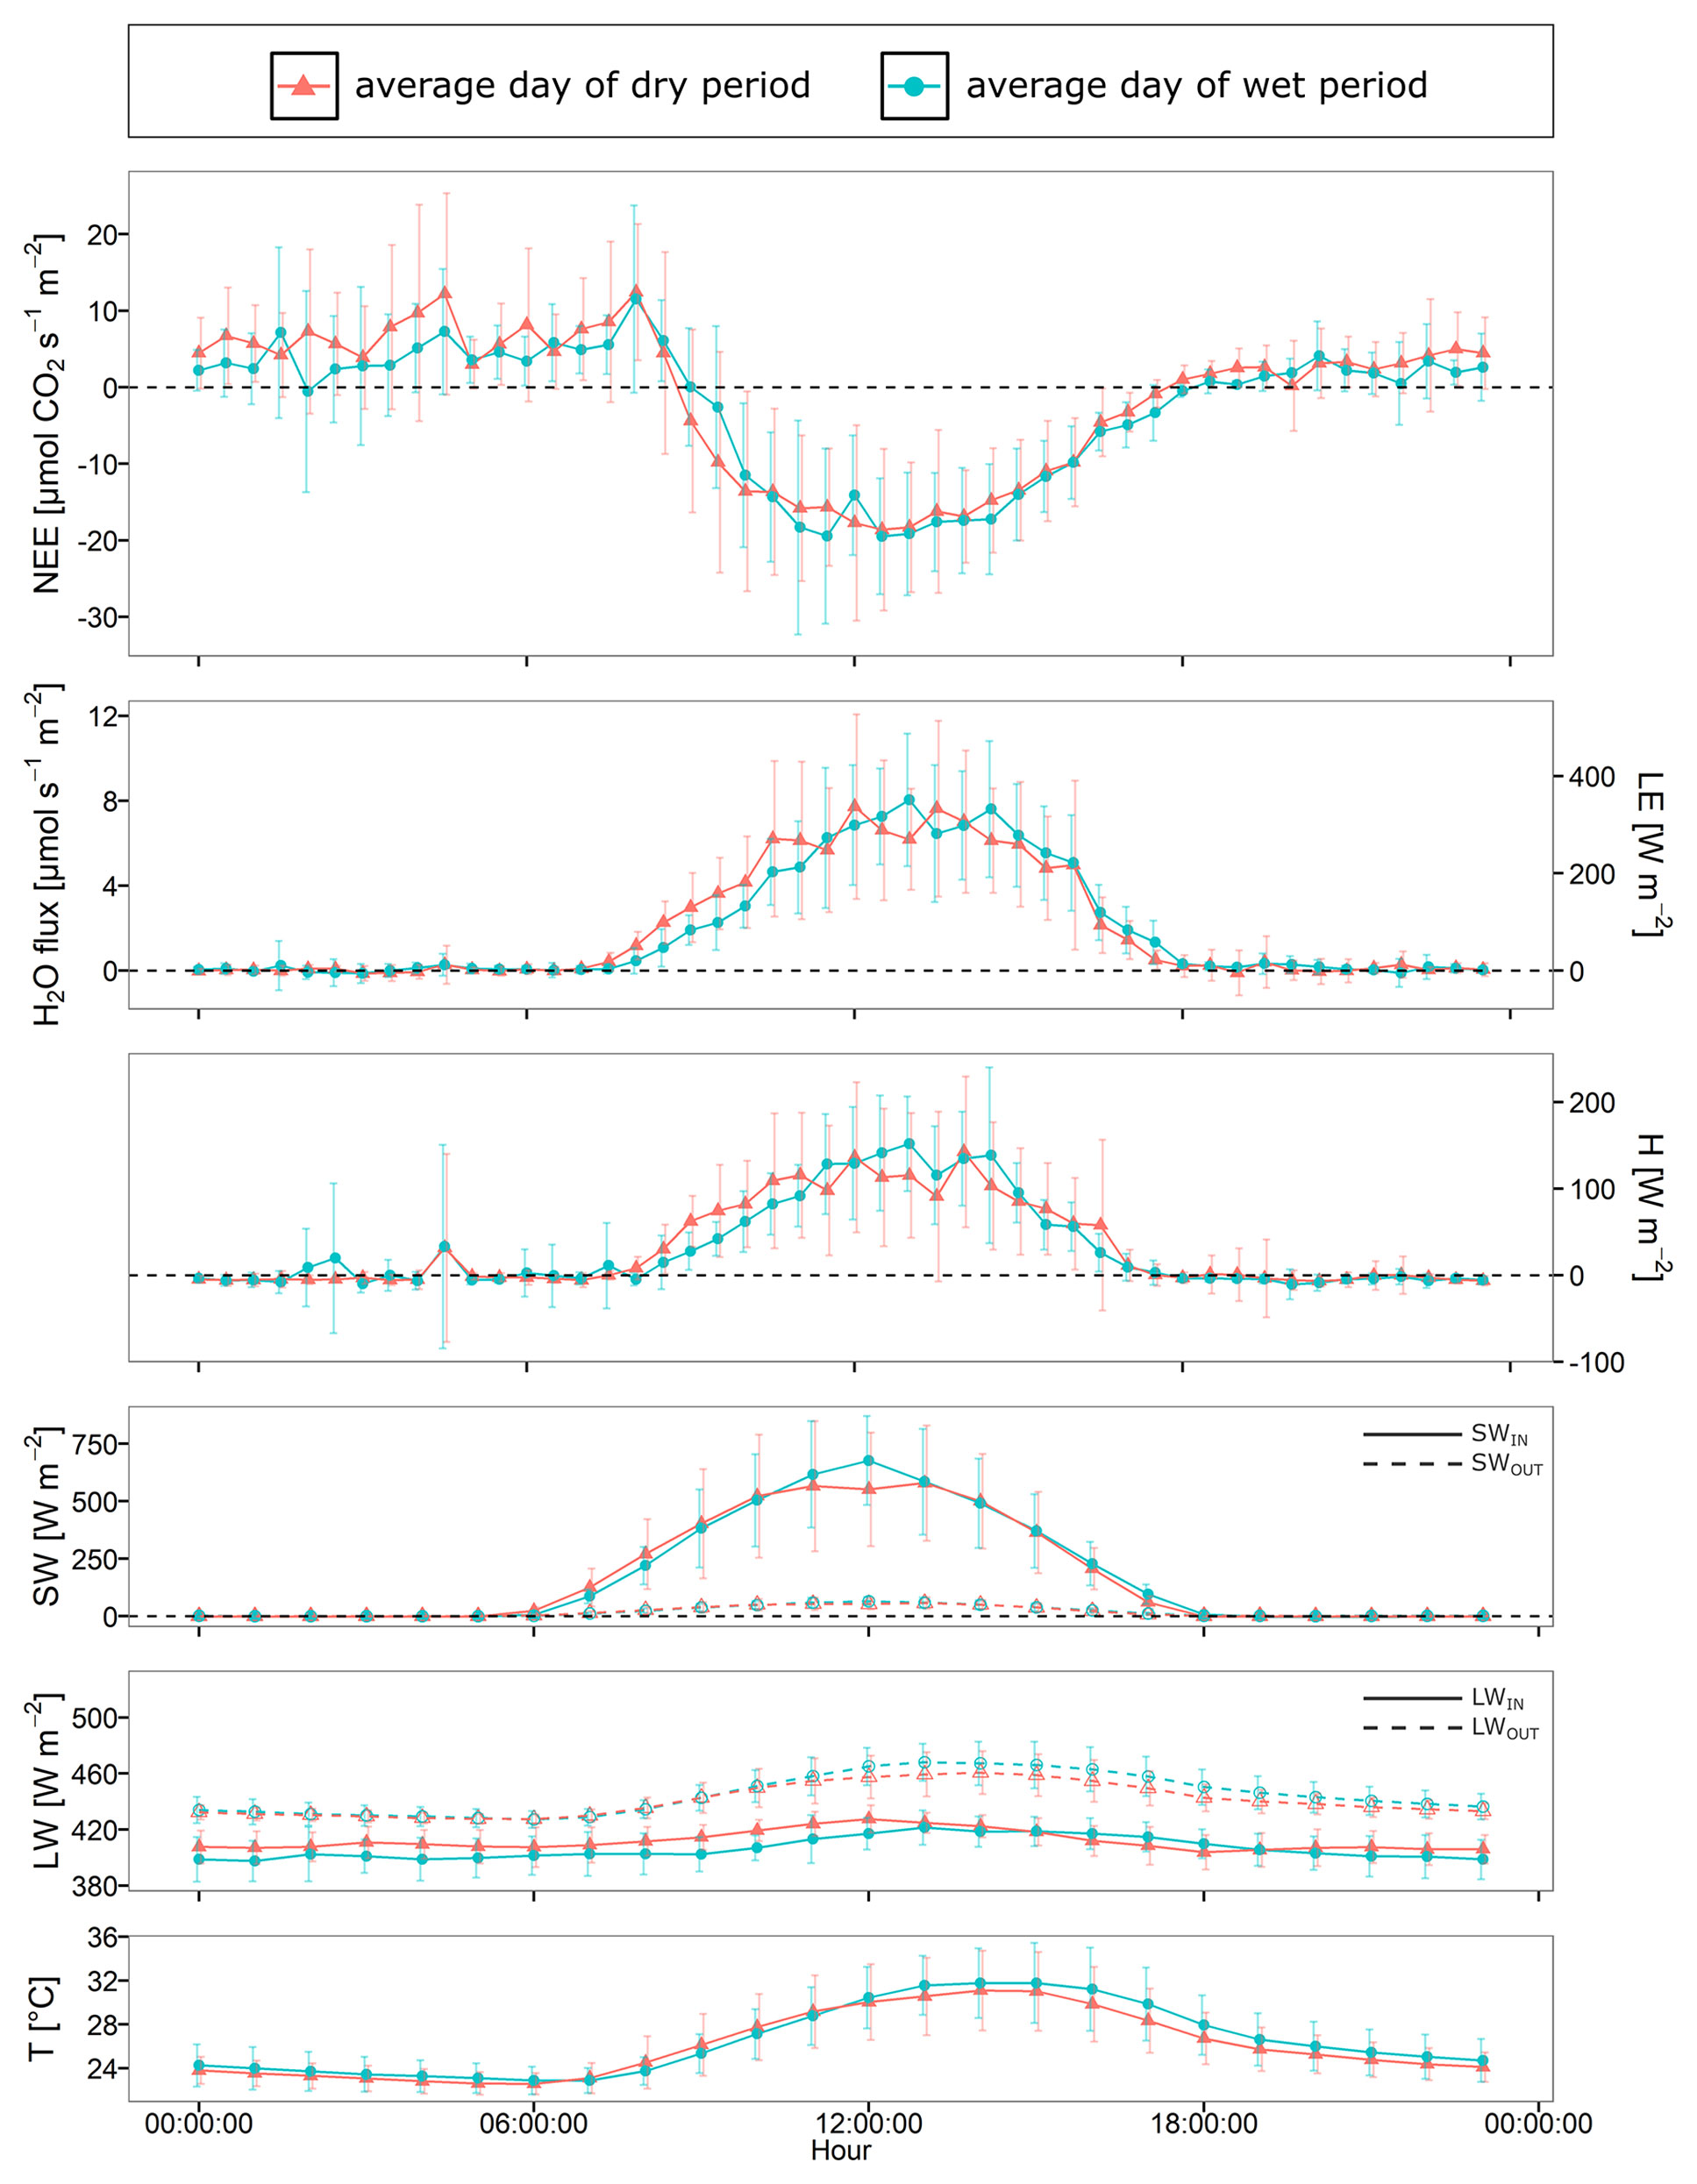
Figure 4 Sample data of the CongoFlux eddy covariance flux tower, Yangambi (DR Congo). Net ecosystem exchange (NEE), water flux (H20 flux), latent (LE) and sensible (H) heat flux, short wave incoming radiation (SWIN) and short wave outgoing radiation (SWOUT), long wave incoming radiation (LWIN) and long wave outgoing radiation (LWOUT), and air temperature (T) for an average day within a dry period (red, 01/01/2021 – 30/01/2021, Ptot = 88 mm) and wet period (blue, 23/10/2020 – 21/11/2020, Ptot = 283 mm). The above flux-data (NEE, H20, LE and H fluxes) were processed by using LICOR EddyPro 7 software (Version 7.0.6). Because of the nature and purpose of data presented, no post-processing (e.g. gap-filling, storage correction) has been applied. The flux data (NEE, H20, LE and H fluxes) were all quality checked using the steady-state test (58). Using this method fluxes are divided in best quality (0), suitable for analysis (1) and bad fluxes (2). Only fluxes flagged as 0 and 1 were included.
The driver of these diurnal patterns is incoming shortwave radiation (SWIN) from the sun. As SWIN reaches the ecosystem, it gets partially reflected (SWOUT) and partially absorbed causing the ecosystem to heat and emit long wave radiation (LWOUT). Most of the emitted longwave radiation warms the lower atmosphere, which in turn warms the surface. These processes are observable by the lag effect of SWIN on LWOUT, sensible heat fluxes (H) and air temperature (Tair) (Figure 4). Obviously, SWIN also triggers vegetation activity as it is a crucial condition for photosynthesis. During the day, in sufficient presence of SWIN, the ecosystem shows a net uptake of CO2 (i.e., a negative NEE) and emits water vapor via evaporation. However, when SWIN levels are insufficient, as is the case during night, photosynthetic activity stops causing the ecosystem to emit CO2 (i.e., a positive NEE) due to respiration. The evaporative flux stops as well. Even though the shown data are only preliminary and should not be further interpreted in their actual state, they already make it possible to observe all of the above described processes (Figure 4). Further measurement and processing of the data will also enable the partitioning of NEE into gross primary production (GPP) and the total CO2 release due to respiration processes (Reco) of the ecosystem.
In the wake of global change, there is a need for a better understanding of the current and future response of natural ecosystems. Further and continuous measurement of the ecosystem’s exchange by the above-described climate infrastructure should contribute to a better understanding of the second-largest tropical forest on Earth: The tropical forests of the Congo Basin.
4 Scientific Collaboration
The Congoflux research site is open to scientific collaboration. Complementary research contributing to better top-down/bottom-up comprehension of carbon, water and GHG fluxes in the tropical forests of the Congo Basin are specially welcomed.
Data Availability Statement
The data included in Figure 4 are preliminary data and are only presented as a demonstration of what the tower will be measuring in the years to come. The authors thus do not recommend to use these data for any further use. Nevertheless, the tower is part of the ICOS network. All data collected by the flux tower will thus be put online once it has been processed and passed all quality checks. Requests to access the datasets should be directed to dGhvbWFzLnNpYnJldEB1Z2VudC5iZQ==.
Author Contributions
TS wrote the paper, with significant contributions from MB and PB and active participation of LL, EB, HV, PC, BM, ML, and JM; TS performed the analyses and the figures with help of MB, PB, and LL; JM collected and shared all meteorological data shown in 2.1.3; LL and EB contributed to the full technical description of the flux towers equipment; PB and HV initiated and designed the CongoFlux-project. All authors actively helped in the realization of the described project. All authors contributed to the article and approved the submitted version.
Funding
The authors thank the Directorate General for Development Cooperation and Humanitarian Aid Belgium (DGD Belgium) and the European Commission for the financial support of DGD Belgium through the 10th European Development Fund which allowed the installation of this research infrastructure [B/15226/01]. The authors also do thank the Fonds wetenschappelijk onderzoek (FWO) and the Bijzonder Onderzoeksfonds (BOF) for their financial support via the FWO-IRI [FWO.IRI.2021.0005.01] and Methusalem [BOF.MET.2021.0004.01], respectively, which both ensure the maintenance and daily operationalization of the site. Moreover, we would like to thank the institutions who made the installation of this project possible including UGent, R&SD, CIFOR, ERAIFT, INERA and Enabel.
Conflict of Interest
The authors declare that the research was conducted in the absence of any commercial or financial relationships that could be construed as a potential conflict of interest.
Publisher’s Note
All claims expressed in this article are solely those of the authors and do not necessarily represent those of their affiliated organizations, or those of the publisher, the editors and the reviewers. Any product that may be evaluated in this article, or claim that may be made by its manufacturer, is not guaranteed or endorsed by the publisher.
Acknowledgments
Moreover, the authors thank Prof. Geert Baert of the Department of Environment, Ghent University for his valuable help in sharing literature on the topography and soils of Yangambi as well as his soil profile description (Figure 2). Finally, the authors thank Dr. He Zhang and Dr. Kristof Van Oost of the Earth and Life Institute, Université Catholique de Louvain for the sharing of canopy height data.
Supplementary Material
The Supplementary Material for this article can be found online at: https://www.frontiersin.org/articles/10.3389/fsoil.2022.883236/full#supplementary-material
References
1. Harrison IJ, Brummett R, Stiassny MLJ. (2016) The Congo River Basin. In: Finlayson C.M., Milton G.R., Prentice R.C., Davidson N.C. (eds) The Wetland Book. (Dordrecht:Springer Science). 1-18. doi: 10.1007/978-94-007-6173-5_92-2
2. Beeckman H. The Luki and Yangambi Biosphere Reserves: Laboratories for Climate Change Research and Sustainable Development. IOP Conf Ser Earth Environ Sci (2019) 298:10. doi: 10.1088/1755-1315/298/1/012009
3. Malhi Y, Wright J. Spatial Patterns and Recent Trends in the Climate of Tropical Rainforest Regions. Philos Trans R Soc B Biol Sci (2004) 359:311–29. doi: 10.1098/rstb.2003.1433
4. Spracklen DV, Arnold SR, Taylor CM. Observations of Increased Tropical Rainfall Preceded by Air Passage Over Forests. Nature (2012) 489:282–5. doi: 10.1038/nature11390
5. Lewis SL, Sonké B, Sunderland T, Begne SK, Lopez-Gonzalez G, van der Heijden GMF, et al. Above-Ground Biomass and Structure of 260 African Tropical Forests. Philos Trans R Soc B Biol Sci (2013) 368:20120295. doi: 10.1098/rstb.2012.0295
6. Hubau W, Simon L L, Oliver L P, Affum-Baffoe K. Asynchronous Carbon Sink Saturation in African and Amazonian Tropical Forests. Nature (2020) 597:80-7. doi: 10.1038/s41586-020-2035-0
7. Harris NL, Gibbs DA, Baccini A, Birdsey RA, de Bruin S, Farina M, et al. Global Maps of Twenty-First Century Forest Carbon Fluxes. Nat Clim Change (2021) 11:234–40. doi: 10.1038/s41558-020-00976-6
8. Washington R, James R, Pearce H, Pokam WM, Moufouma-Okia W. Congo Basin Rainfall Climatology: Can We Believe the Climate Models? Philos Trans R Soc B Biol Sci (2013) 368(1625):20120296. doi: 10.1098/rstb.2012.0296
9. Palmer PI, Feng L, Baker D, Chevallier F, Bösch H, Somkuti P. Net Carbon Emissions From African Biosphere Dominate Pan-Tropical Atmospheric CO2 Signal. Nat Commun (2019) 10:1–9. doi: 10.1038/s41467-019-11097-w
10. Malhi Y, Adu-Bredu S, Asare RA, Lewis SL, Mayaux P. African Rainforests: Past, Present and Future. Philos Trans R Soc B Biol Sci (2013) 368(1625):20120312. doi: 10.1098/rstb.2012.0312
11. Williams CA, Hanan NP, Neff JC, Scholes RJ, Berry JA, Denning AS, et al. Africa and the Global Carbon Cycle. Carbon Balance Manage (2007) 2:3. doi: 10.1186/1750-0680-2-3
12. Cais PC, Bombelli A, Williams M, Piao SL, Chave J, Ryan CM, et al. The Carbon Balance of Africa: Synthesis of Recent Research Studies. Philos Trans R Soc A Math Phys Eng Sci (2011) 369:2038–57. doi: 10.1098/rsta.2010.0328
13. López-Ballesteros A, Beck J, Bombelli A, Grieco E, Lorencová EK, Merbold L, et al. Towards a Feasible and Representative Pan-African Research Infrastructure Network for GHG Observations. Environ Res Lett (2018) 13:085003. doi: 10.1088/1748-9326/aad66c
14. Gond V, Fayolle A, Pennec A, Cornu G, Mayaux P, Camberlin P, et al. Vegetation Structure and Greenness in Central Africa From Modis Multi-Temporal Data. Philos Trans R Soc B Biol Sci (2013) 368(1625):20120309. doi: 10.1098/rstb.2012.0309
15. Gibbs HK, Brown S, Niles JO, Foley JA. Monitoring and Estimating Tropical Forest Carbon Stocks: Making REDD a Reality. Environ Res Lett (2007) 2:045023. doi: 10.1088/1748-9326/2/4/045023
16. Somorin OA, Brown CPH, Visseren-Hamakers IJ, Sonwa DJ, Arts B, Nkem J. The Congo Basin Forests in a Changing Climate: Policy Discourses on Adaptation and Mitigation (REDD+). Glob Environ Change (2012) 22:288–98. doi: 10.1016/j.gloenvcha.2011.08.001
17. IPCC. Climate Change 2014: Synthesis Report. Contribution of Working Groups I, II and III to the Fifth Assessment Report of the Intergovernmental Panel on Climate Change. Pachauri RK, Meyer LA, editors. Geneva, Switzerland: IPCC (2014). Core Writing Team.
18. Shukla PR, Skea J, Calvo Buendia E, Masson-Delmotte V, Pörtner HO, Roberts DC, IPCC. Climate Change and Land: An IPCC Special Report on Climate Change, Desertification, Land Degradation, Sustainable Land Management, Food Security, and Greenhouse Gas Fluxes in Terrestrial Ecosystems. Shukla PR, Skea J, Buendia EC, Masson-Delmotte V, Pörtner H-O, Roberts DC, et al, editors (2019).
19. UNFCCC. (2016). FCCC/CP/2015/10/Add.1: Paris Agreement, in: Rep. Conf. Parties its twenty-first Sess, Paris, 30 Novemb. to 13 December 2015, Add. 01194, 36.
20. Baldocchi DD. How Eddy Covariance Flux Measurements Have Contributed to Our Understanding of Global Change Biology. Glob Change Biol (2020) 26:242–60. doi: 10.1111/gcb.14807
21. Aubinet M, Vesala T, Papale D. Eddy Covariance: A Practical Guide to Measurement and Data Analysis. Netherlands: Springer (2012). Available at: http://books.google.com/books?hl=it&lr=&id=8a2bIJER5ZwC&pgis=1.
22. Burba G. Illustrative Maps of Past and Present Eddy Covariance Measurement Locations: II. High-Resolution Images. (2019), 1–9. doi: 10.13140/RG.2.2.25992.67844
23. Pastorello G, Trotta C, Canfora E, Chu H, Christianson D, Cheah YW, et al. The FLUXNET2015 Dataset and the ONEFlux Processing Pipeline for Eddy Covariance Data. Sci Data (2020) 7:225. doi: 10.1038/s41597-020-0534-3
24. Kumar A, Bhatia A, Fagodiya RK, Malyan SK, Meena BL. Eddy Covariance Flux Tower: A Promising Technique for Greenhouse Gases Measurement. Adv Plants Agric Res (2017) 7(4):337-40. doi: 10.15406/apar.2017.07.00263
25. Law BE, Falge E, Gu L, Baldocchi DD, Bakwin P, Berbigier P, et al. Environmental Controls Over Carbon Dioxide and Water Vapor Exchange of Terrestrial Vegetation. Agric For Meteorol (2002) 113:97–120. doi: 10.1016/S0168-1923(02)00104-1
26. van Dijk AIJM, Dolman AJ, Schulze ED. Radiation, Temperature, and Leaf Area Explain Ecosystem Carbon Fluxes in Boreal and Temperate European Forests. Global Biogeochem Cycles (2005) 19:1–15. doi: 10.1029/2004GB002417
27. Keenan TF, Hollinger DY, Bohrer G, Dragoni D, Munger JW, Schmid HP, et al. Increase in Forest Water-Use Efficiency as Atmospheric Carbon Dioxide Concentrations Rise. Nature (2013) 499:324–7. doi: 10.1038/nature12291
28. Keenan TF, Gray J, Friedl MA, Toomey M, Bohrer G, Hollinger DY, et al. Net Carbon Uptake has Increased Through Warming-Induced Changes in Temperate Forest Phenology. Nat Clim Change (2014) 4:598–604. doi: 10.1038/nclimate2253
29. Reichstein M, Bahn M, Mahecha MD, Kattge J, Baldocchi DD. Linking Plant and Ecosystem Functional Biogeography. Proc Natl Acad Sci U. S. A. (2014) 111:13697–702. doi: 10.1073/pnas.1216065111
30. Kim D-G, Bond-Lamberty B, Ryu Y, Seo B, Papale D. Reviews and Syntheses: Enhancing Research and Monitoring of Land-to-Atmosphere Greenhouse Gases Exchange in Developing Countries. Biogeosci Discuss (2021), 1–30. doi: 10.5194/bg-2021-85
31. Chave J, Davies SJ, Phillips OL, Lewis SL, Sist P, Schepaschenko D, et al. Ground Data are Essential for Biomass Remote Sensing Missions. Surv Geophys (2019) 40:863–80. doi: 10.1007/s10712-019-09528-w
32. Nickless A, Scholes RJ, Vermeulen A, Beck J, López-Ballesteros A, Ardö J, et al. Greenhouse Gas Observation Network Design for Africa. Tellus Ser B Chem Phys Meteorol (2020) 72:1–30. doi: 10.1080/16000889.2020.1824486
33. Leonard J. Aperçu Préliminaire Des Groupements Végétaux Pionniers Dans La Région De Yangambi (Congo Belge). Vegetatio (1952) 3:279–97. doi: 10.1007/BF00539822
34. Bauters M, Ampoorter E, Huygens D, Kearsley E, De Haulleville T, Sellan G, et al. Functional Identity Explains Carbon Sequestration in a 77-Year-Old Experimental Tropical Plantation. Ecosphere (2015) 6:1–11. doi: 10.1890/ES15-00342.1
35. COBECORE. COBECORE - Congo Basin Eco-Climatological Data Recovery and Valorisation (2021). Available at: http://cobecore.org (Accessed April 1, 2021).
36. Bartholomew WV, Meyer J, Laudelout H. Mineral Nutrient Immobilization Under Forest and Grass Fallow in the Yangambi (Belgian Congo) Region. Publ L’Institut Natl Pour L’Etude Agron du Conge Belge Ser Sci (1953) 57:1–27.
37. Kearsley E, De Haulleville T, Hufkens K, Kidimbu A, Toirambe B, Baert G, et al. Conventional Tree Height-Diameter Relationships Significantly Overestimate Aboveground Carbon Stocks in the Central Congo Basin. Nat Commun (2013) 4:2269. doi: 10.1038/ncomms3269
38. UNESCO Man and the Biosphere (MAB) Programme . Available at: https://en.unesco.org/mab (Accessed March 29, 2021).
39. Kyale Koy J, Wardell DA, Mikwa J-F, Kabuanga JM, Monga Ngonga AM, Oszwald J, et al. Dynamique De La Déforestation Dans La Réserve De Biosphère De Yangambi (République Démocratique Du Congo) : Variabilité Spatiale Et Temporelle Au Cours Des 30 Dernières Années. Bois Forets Des Trop (2019) 341:15. doi: 10.19182/bft2019.341.a31752
40. Réjou-Méchain M, Mortier F, Bastin J-F, Cornu G, Barbier N, Bayol N, et al. Unveiling African Rainforest Composition and Vulnerability to Global Change. Nature (2021) 593:90–4. doi: 10.1038/s41586-021-03483-6
41. Zhang H, Bauters M, Boeckx P, Van Oost K. Mapping Canopy Heights in Dense Tropical Forests Using Low-Cost UAV-Derived Photogrammetric Point Clouds and Machine Learning Approaches. Remote Sens (2021) 13:3777. doi: 10.3390/rs13183777
42. IUSS Working Group WRB. World Reference Base for Soil Resources 2014, Update 2015. International Soil Classification System for Naming Soils and Creating Legends for Soil Maps. Rome: FAO (2015).
43. Gilson P, Van Wambeke A, Gutzweiller R. 6 : Yangambi, Planchette 2: Yangambi. Notice Explicative De La Carte Des Sols Et De La Végétation. Bruxelles: INEAC (1956).
44. Marthews TR, Metcalfe D, Malhi Y, Phillips OL, Huarasca-Huasco W, Riutta T, et al. Measuring Tropical Forest Carbon Allocation And Cycling: A RAINFOR Field Manual for Intensive Census Plots (V2.2). Manual. Global Ecosystems Monitoring Network (2013). Available at: http://gem.tropicalforests.ox.ac.uk/.
45. Peel MC, Finlayson BL, McMahon TA. Updated World Map of the Köppen-Geiger Climate Classification. Hydrol Earth Syst Sci (2007) 11:1633–44. doi: 10.5194/hess-11-1633-2007
46. Likoko B, Mbifo N, Besango L, Totiwe T, Badjoko D, Likoko A, et al. Climate Change for Yangambi Forest Region, DR Congo. J Aquat Sci Oceanogr (2019) 1:1–10.
47. Gilson R, Van Wambeke A, Gutzwiller R. Carte Des Sols Et De La Végétation Du Congo Belge Et Du Ruanda-Urundi. Brussels, Belgium:L’Institut National pour l’Etude Agronomique du Congo Belge (I.N.E.A.C.) (1956).
48. Van Wambeke A, Evrard C. Carte Des Sols Et De La Vegetation Du CongoBelge Et Du Ruanda-Urundi. Publ L’Institut Natl Pour L’Etude Agron du Conge Belge (1954).
49. Gilson P, Jongen P, Van Wambeke A. 6 : Yangambi, Planchette 3: Lilanda. Notice Explicative De La Carte Des Sols Et De La Végétation. Bruxelles: INEAC (1957).
50. Van Wambeke A, Liben L. Notice Explicative De La Carte Des Sols Et De La Végétation. Planchette (1957) 4:47.
51. Ngongo L. Classification Des Sols Et Evaluation Du Milieu Physique De La Cuvette Zaïroise Pour L’agriculture. Ghent; Ghent University: Belgium (1991).
52. Menea FKB. Diagnostic De La Fertilité Des Sols Dans La Cuvette Centrale Congolaise. (2004), Cas des séries Yangambi et Yakonde. (Chisinau, Republic of Moldova: Éditions universitaires européennes)
53. Ngongo M, Van Ranst E, Baert G, Kasongo E, Verdoodt A, Mujinya BB, et al. Guide Des Sols En R.D. Congo. Tome II : Description Et Données Physico-Chimiques De Profils Types. Lubumbashi: Imprimerie Salama-Don Bosco (2009).
54. Ngongo M, Kasongo E, Muzinga B, Baert G, Van Ranst E. “Soil Resources in the Congo Basin: Their Properties and Constraints for Food Production. Proceedings International Conference ‘Nutrition and Food Production in the Congo Basin,”. In: Royal Acedemies for Science and Arts of Belgium, Brussels, vol. 35–54. (2014).
55. Alongo LS. Etude Microclimatique Et Pédologique De L’effet De Lisiere En Cuvette Centrale Congolaise: Impact Écologique De La Fragmentation Des Écosystèmes, Cas Des Séries Yangambi Et Yakonde À La Région De Yangambi (R.D. Congo). (2013).
56. Yang H, Detto M, Liu S, Yuan W, Hsieh CI, Wang X, et al. Effects of Canopy Gaps on N2O Fluxes in a Tropical Montane Rainforest in Hainan of China. Ecol Eng (2017) 105:325–34. doi: 10.1016/j.ecoleng.2017.04.042
57. Germain R, Evrard C. Etude Écologique Et Phytosociologique De La Forêt De Brachystegia Laurentii. Bruxelles: Institut National d’Étude Agronomique du Congo belge: Des Presses des Ets Vromant, s.a (1956).
Keywords: eddy covariance, flux tower, greenhouse gases, carbon dioxide, nitrous oxide, methane, Congo basin, tropical forest
Citation: Sibret T, Bauters M, Bulonza E, Lefevre L, Cerutti PO, Lokonda M, Mbifo J, Michel B, Verbeeck H and Boeckx P (2022) CongoFlux – The First Eddy Covariance Flux Tower in the Congo Basin. Front. Soil Sci. 2:883236. doi: 10.3389/fsoil.2022.883236
Received: 24 February 2022; Accepted: 11 May 2022;
Published: 23 June 2022.
Edited by:
Jorge Perez-Quezada, University of Chile, ChileReviewed by:
Ifo Suspense Averti, Marien Ngouabi University, Republic of CongoMario Guevara, University of California, Riverside, United States
Copyright © 2022 Sibret, Bauters, Bulonza, Lefevre, Cerutti, Lokonda, Mbifo, Michel, Verbeeck and Boeckx. This is an open-access article distributed under the terms of the Creative Commons Attribution License (CC BY). The use, distribution or reproduction in other forums is permitted, provided the original author(s) and the copyright owner(s) are credited and that the original publication in this journal is cited, in accordance with accepted academic practice. No use, distribution or reproduction is permitted which does not comply with these terms.
*Correspondence: Thomas Sibret, dGhvbWFzLnNpYnJldEBVR2VudC5iZQ==