 Mingzhu He
 Liang Tang1
- 1Northwest Institute of Eco-environment and Resources, Chinese Academy of Sciences, Lanzhou, China
- 2University of Chinese Academy of Sciences, Beijing, China
Soil organic carbon is an important factor for the cultivation and production of traditional Chinese medicine. This study aimed to reveal the spatial distribution of the soil organic carbon density (SOCD) and the effects of the climatic and topographic factors in Longxi County (Gansu Province, China). The soil organic carbon (SOC) from 200 sampling points were collected and analyzed in 2018. Results showed that the total SOCD was 26.7 ± 10.2 Mg ha-1, while the SOCDs at a soil depth of 0–10, 10–30, and 30–50 cm were 6.3 ± 1.7, 11.0 ± 3.8, and 9.3 ± 4.8 Mg ha-1, respectively. The temperature, precipitation, elevation, and stream power index showed significant correlations with the SOCD at each soil layer. With an increasing soil depth, the correlation between the slope, relief amplitude, surface roughness, and SOCD gradually decreased. From the central plains to the mountainous areas, the SOCD increased with rising elevation, while the valley plain that formed by the river basin showed low levels of SOCD. Therefore, the scientific management of soil fertility and the development of precision agriculture, combined in a soil testing fertilization formula, will guarantee the healthy development of the Chinese herbal medicine planting.
Introduction
Under the background of global warming, the “carbon emission reduction” associated with the increasing concentration of CO2 in the atmosphere has attracted much attention (1–3). As an important part of the terrestrial ecosystem, cropland is affected by both the natural environment and human activities. In croplands, soil organic carbon (SOC) sequestration is of fundamental importance to soil fertility, food production and soil health (4–6). An appropriate SOC content is an important prerequisite for soil to provide the best plant growth conditions, nutrient cycling and available water infiltration and storage (7–11). Soil organic carbon density (SOCD) represents the storage of SOC at a certain depth per unit area, which is an important index to measure soil fertility and quality and small changes in its level cause changes in carbon fluxes in the cropland ecosystem, and then change the process of the cropland biogeochemical cycle (12–14). However, the climate change and the land-use change caused by the rapid development of industrialization, urbanization and agricultural intensification have had a profound impact on the change in SOC (4, 10). The law of spatio-temporal change of SOC has gradually become a research hotspot and frontier in multi-disciplinary fields, such as agriculture, ecology, environment, global change science and so on (15). Therefore, understanding the spatial characteristics of cropland SOCD is of great significance for reducing the cropland greenhouse gas emissions and optimizing the earth system model under the background of global warming (5, 16).
In recent years, many studies have made an in-depth analysis of the cropland SOC content and the changes in the SOCD characteristics through integrating multi-source geospatial data at different spatial scales, such as field collection (10), literature collation (17), and national soil survey data (18, 19). At the national scale, some studies have shown that the SOC content of Chinese croplands has exhibited an increasing trend, but there were great differences in the increasing rate and spatial pattern among different studies (4, 20, 21). The cropland SOCD is a comprehensive reflection of the SOC content, soil bulk density and soil depth. Based on the Second National Soil Survey data, the cropland SOCD in China showed obvious regional differences and was affected by hydrological and thermal factors to a certain extent (11, 22–24). Due to the complexity and diversity of climate types, the soil data obtained from different sources are often restricted by the small spatial scale, inconsistent sampling time, methods and other factors. It is hard to comprehensively understand the long-term pattern in changes of cropland SOCD (4, 5). Additionally, regarding the analysis of influencing factors on the cropland SOCD, some studies have often adopted a correlation analysis to measure the linear relationship between the SOCD and its influential factors. If the correlation coefficient was not significant, there was no obvious linear relationship between them, but this did not mean that there was no nonlinear relationship between them. Therefore, how to quantitatively analyse the contribution of different factors (such as the geographical environment, climatic factors, crop types and soil factors, among others) to the cropland SOCD is still one of the most important problems to solve at the present stage (25–28). In recent years, the geostatistical method has constituted an effective tool for analyzing the driving forces behind the various complex phenomena and the interactions among multiple influential factors (29). At present, this method has been widely applied in the fields of geography, ecology and environmental science, such as climatic zoning (30), species diversity survey (31) and describing spatial pattern in stream networks (32).
Medicinal plants play an important role in traditional medicine and the development of new drugs, in China, more than 11000 plants are used for medicinal purposes (33). However, human activities and climate change are fragmenting habitats for medicinal plants, threatening the survival and reproduction of these species (34). In addition, as environmental stress increasing, bioactive compounds in medicinal plants may change, which may affect the quality of raw materials and products (35). For example, a recent study showed that the G. macropylla is strongly influenced by soil properties and environmental factors could affect Gentiana plants (36). SOC is not only the basis of soil fertility, food production and soil health, but also contribute to the global and regional carbon balance (37). Therefore, it is of great significance to clarify the temporal and spatial variation in SOC for ensuring soil health and the safety of the traditional Chinese medicine that is planted in that soil, which could give full play to the service function of the soil ecosystem under the current climate change conditions. In this study, Longxi County, one of the main producing areas of traditional Chinese medicinal herbs, was selected as the study area. It is rich in 313 kinds of traditional Chinese medicine and is one of the important producing areas of “authentic medicinal materials”, such as Codonopsis pilosula, Astragalus membranaceus and Radix Scutellariae. However, due to the limited area of arable land coupled with continuous cultivation, the growth status, yield and quality of medicinal plants become worse which led to continuous cropping obstacle (38). At the same time, continuous cropping requires the application of a large amount of chemical fertilizer and pesticide, resulting in an increase in pesticide residues and nitrate content in medicinal plants, resulting in a quality decline in medicinal plants. Therefore, based on intensive site surveying, the spatial distribution characteristics of SOCD and its influential factors were analyzed to provide scientific guidance for the management of soil fertility and for the healthy development of the planting industry of traditional Chinese medicine.
Materials and methods
Study area
The study was conducted in Longxi County (34°50′-35°23′N, 104°18′-104°54′E), which is in the middle of the Loess Plateau, in northwest China (Figure 1). There is a typical continental climate, with four distinct seasons, abundant sunshine and a mild climate. The mean annual precipitation is 445.8 mm, while the mean annual average temperature is 6.54°C. Influenced by the general circulation of East Asia and the special topography around the Qinghai Tibet Plateau. The area is located between the edge of loess plateau in northwest China and the foothills of the Qinling mountains. The terrain is high in the northwest and low in the southeast and the altitude ranges from 1612 to 2762m. Longxi County can be divided into three main climatic regions, namely, the temperate-warm semi-arid region which has a relatively low altitude, mild climate, more accumulated temperature, longer frost-free period and rich light resources, the temperate-cool semi-arid region where the climate is warm and cool with moderate heat but is colder in winter, and the temperate-cold semi-humid area, compared with the other areas, in which precipitation is abundant, but heat is insufficient and accumulated temperature is the least. The loess hilly, mountain and river plain are the most typical landforms. The agrotype in Longxi Country can be divided into five soil types (1): Ustochrept, formed by direct cultivation and ripening on the parent material of loess, without obvious profile development level, having good water storage, but poor soil nutrients and anti-scour ability (2); Chernozem, as a special soil type developed in the semi-arid climate of warm temperate zone with aeolian loess as parent material and grassland xerophytic vegetation as main vegetation forms, it has a uniform texture but poor permeability (3); Krasnozem, the parent material is tertiary red layer, being coarse in texture and poor in water and fertility preservation (4); Aquoll, as a kind of micro-regional soil formed by river sediments, having poor cultivability and low fertility (5); Alfisols, as a kind of forest soil in the vertical zone of mountain, with complex parent materials including Loess, Tertiary sediments, Cretaceous sediments and residual slope deposits of Paleozoic rocks, having high humus content and sticky texture. As the major producing areas of Chinese medicinal materials in Gansu Province, and even in China, more than 70 Chinese medicinal herbs are cultivated there, including 50 wild species and 20 cultivated species, such as Codonopsis pilosula (Franch.) Nannf, Astragalus propinquus Schischkin, Scutellaria baicalensis Georgi, Glycyrrhiza uralensis Fisch, and Bupleurum spp., among others (39).
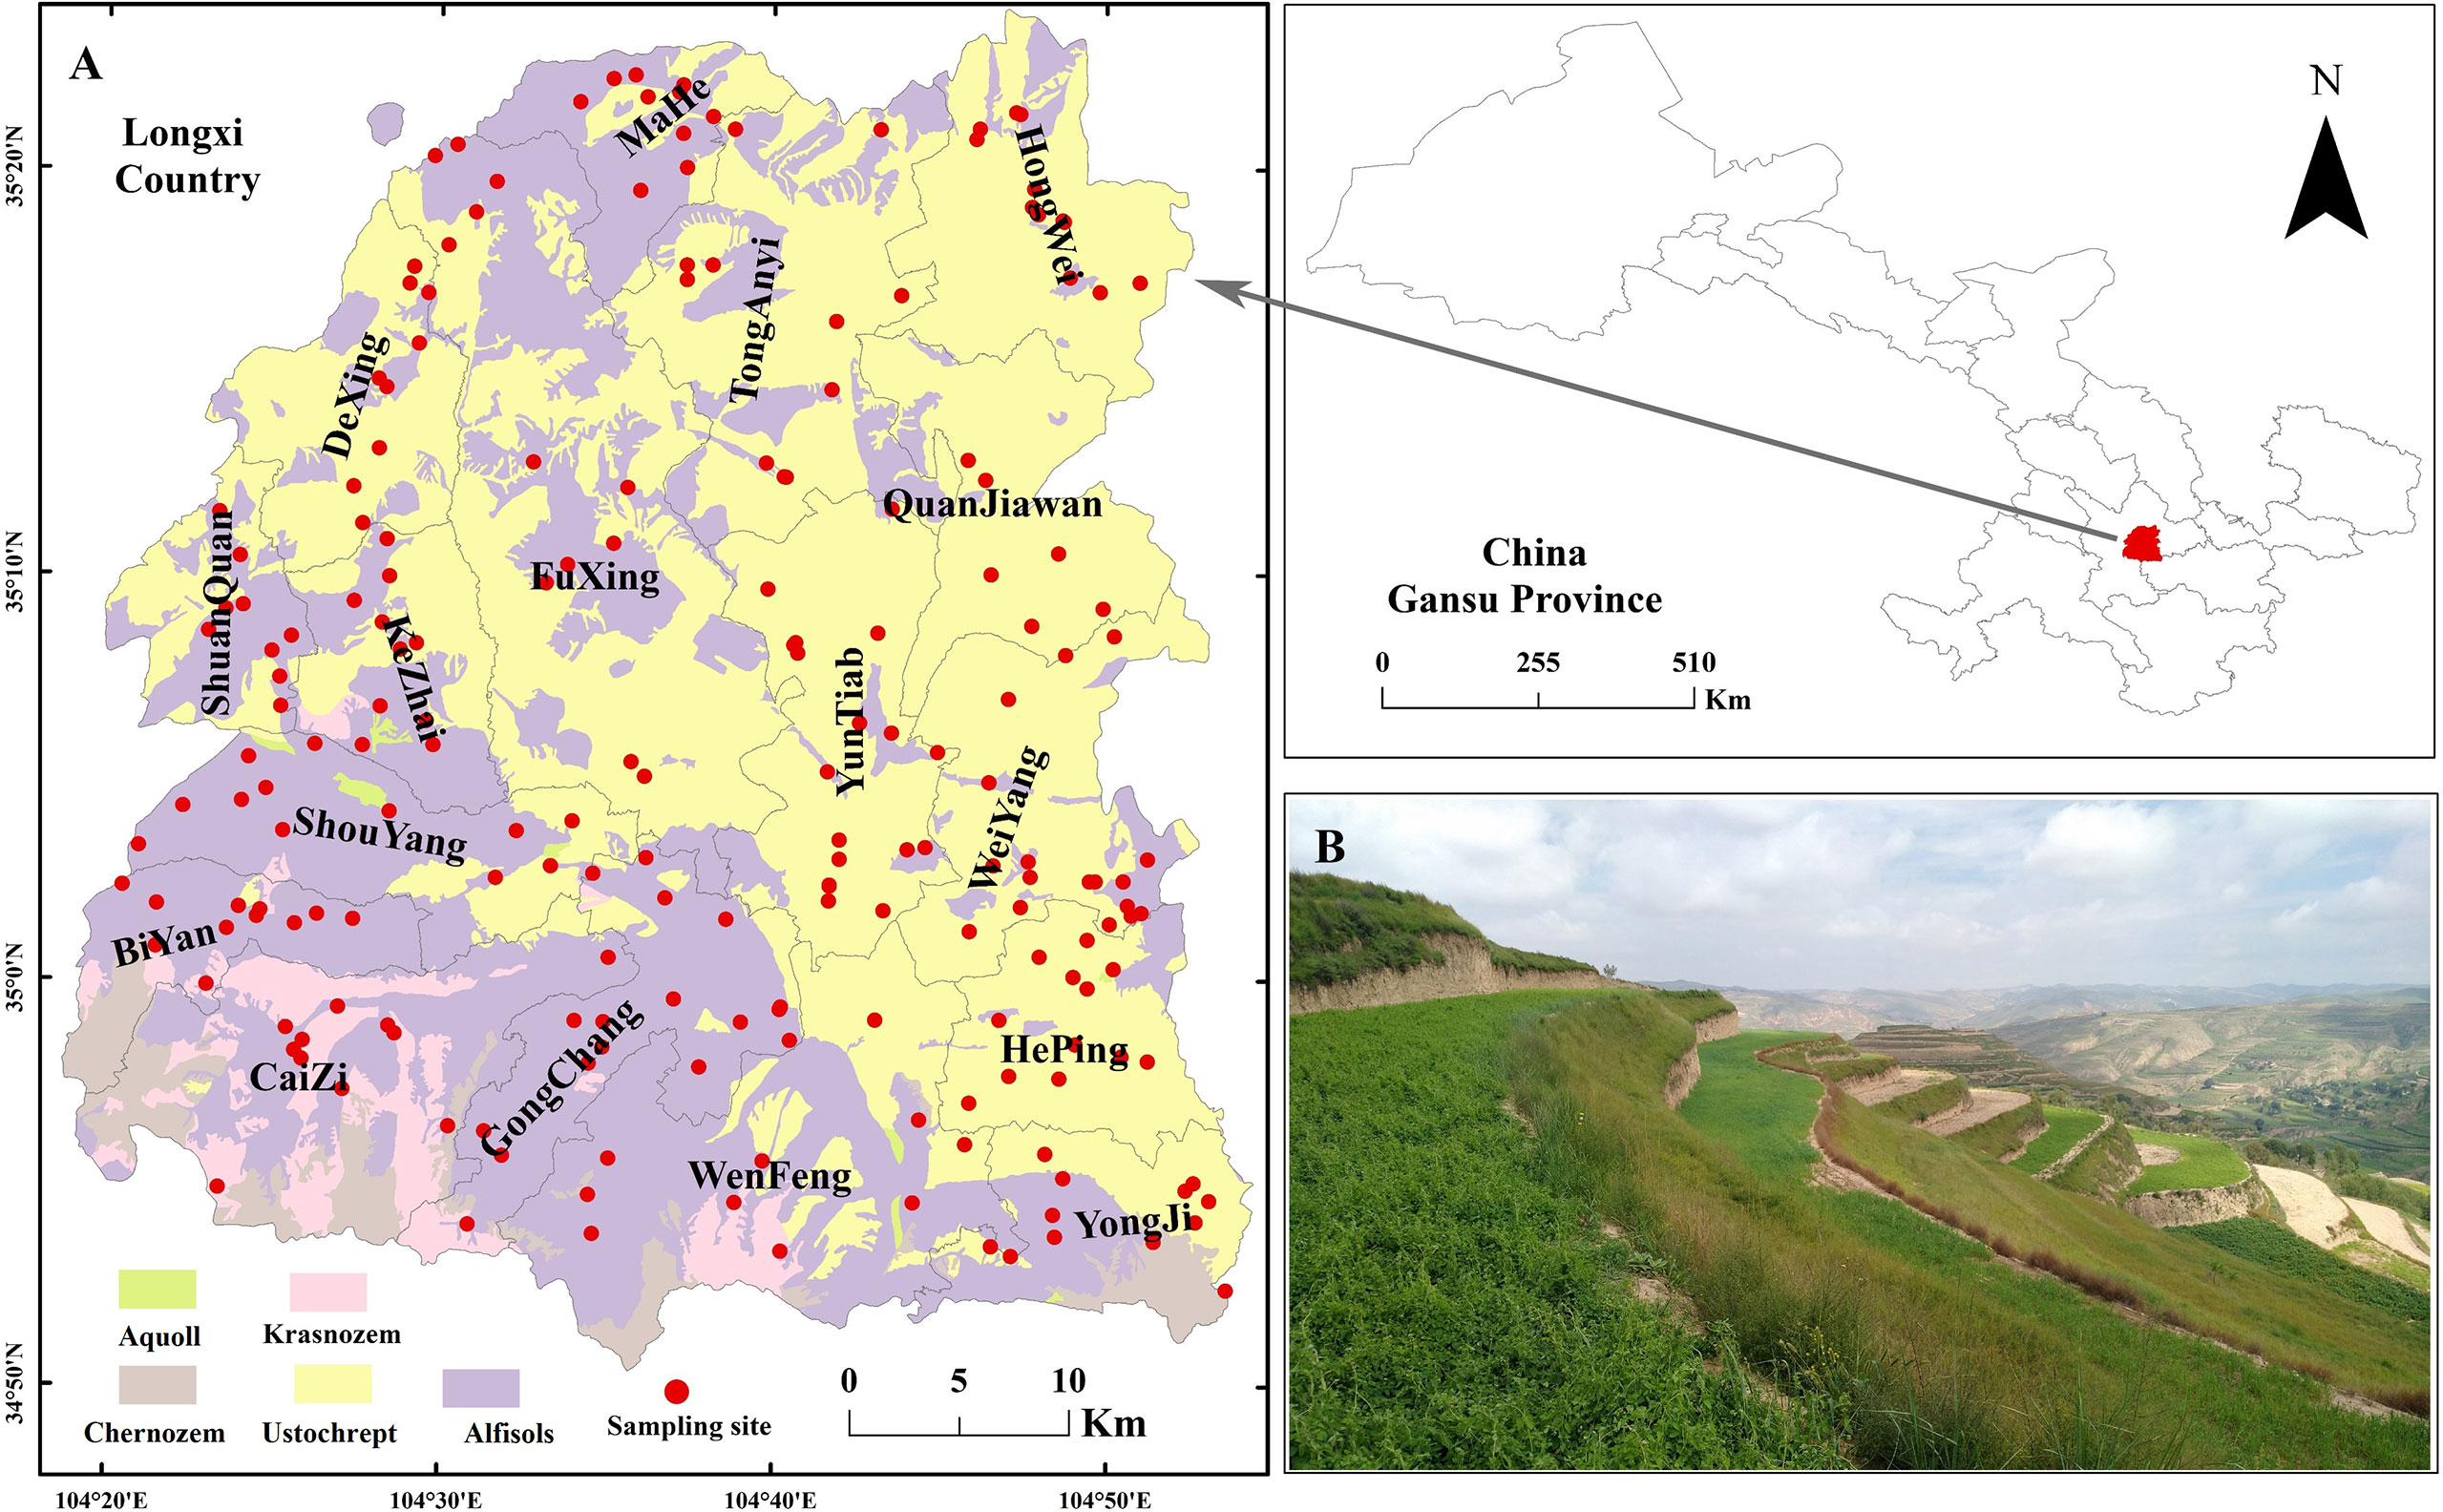
Figure 1 Spatial arrangement of the sampling sites in Longxi County, Gansu, northwest China. The left panel shows the map of the soil types, the distribution of townships, and the sampling sites with red solid cycle (A) and bottom-right panel is the typical landscape and topography in research area (B).
Soil sampling and laboratory analyses
Longxi County mainly contains planted traditional Chinese medicinal herbs, and the planting area accounts for about 70% of the cultivated land. In 2018, soil sampling was conducted at 200 locations in 134 villages of 17 towns in which traditional Chinese medicinal herbs were cultivated (Figure 1). The geographic co-ordinates of the sampling locations were recorded using a hand-held GPS set. Soil sampling points were randomly set in each location, and the distance among pairwise points was more than 2m. Three mixed soil samples at 0–10 cm, 10–30 cm and 30–50 cm soil depths were collected in each sampling location. Soil bulk densities were determined by cutting ring method in site. In total, 600 soil samples were collected. The weeds, roots and gravel in soil were eliminated from the air-dried soil samples, and then sieved using a 2 mm sieve. The SOC was determined via potassium dichromate titration and calculated using the following formula (40):
Where SOC is the soil organic carbon content, g kg-1; c is the standard solution concentration of 0.8000 mol L-1 (1/6 K2Cr2O7); 5 is the volume of the potassium dichromate standard solution added, mL; V0 is the blank titration volume of FeSO4, mL; 3.0 is the molar mass of 1/4 carbon atom, g mol-1; 1.1 is the oxidation correction factor; m represents the quantity of the air-dried soil samples, g; and k is the conversion coefficient of the dried soil.
Where SOCDi is the soil organic carbon density, 103 kg ha-1; SOCi is the soil organic carbon content, g kg-1; Di is the soil bulk density; and Ei is the thickness of the soil layer, cm.
where SOCRi is the organic carbon storage on each soil layer, kg; SOCDi represents the organic carbon density of each soil layer, kg m-2; and Si is the pixel area, m2.
The meteorological data (1958–2018) was provided by China Meteorological Science data sharing Service Network (http://cdc.nmic.cn) and the local meteorological bureau. In order to fully exhibit the spatial distribution of temperature (AT) and precipitation (PR), the multiple regression equations (formula 4 and 5) among the meteorological longitude (LON), latitude (LAT), altitude (ALT), AT and PR were established based on the data of 14 meteorological stations, which assisted us in deducing the meteorological data of each sampling plot.
The digital elevation model (DEM) data were derived from the geospatial cloud platform (www.gscloud.cn/). ArcGIS 10.6 software was used to obtain the basic topographic data of Longxi County, including the elevation, slope, aspect, surface roughness, relief amplitude, slope of aspect (SOA) and composite terrain variable parameters, which were represented by the stream power index (SPI), sediment transport index (STI) and topographic wetness index (TWI). The SPI denoted the moving capacity of the runoff to surface materials of the slope; STI mirrored the transport status of the surface sediments; TWI is an index that describes the soil moisture distribution [7]. The formula used was as follows:
AS represents the specific catchment area of any point on the surface; β represents the slope of the point.
Statistical analyses
Data analyses were carried out using R 4.0.4 with its add-in packages: “car”, “Box-Cox”, “MASS” and “multcomp”. One-way ANOVA was adopted to determine the differences in SOCD in the different townships and soil layers. The normal distribution of SOCD was analyzed using the Kormolov-Sminov test. Box-Cox function package was applied to calculate the normal conversion coefficient, and the bcPowerBox-Cox function package was adopted to carry out the conversion. The conversion formula used was as follows:
where NSOCDi represents the soil organic carbon density of each soil layer; SOCDi is the density of soil organic carbon in each soil layer; and λi stands for the conversion coefficient of each soil layer.
To eliminate the influence of dimensionality, we standardized the environmental variables, and then analyzed the correlation between the SOCD and climate and terrain factors using the Pearson correlation coefficient. The regression model between SOCD and the environmental factors was built using a multiple linear regression. Principal component analysis was used to transform the data. The principal components were extracted using the Kaiser-Harris criterion, and the eigenvalues greater than 1 were retained. According to the score coefficient of the environmental variables on each principal component, both the regression expression of each principal component variable and environmental variable could be obtained. The calculated principal component variables of F1i and F2i were taken as new independent variables, which were then incorporated into the regression modelling process of principal components and NSOCD; thus, the principal component regression fitting models were established through synthesizing the information of the main environmental variables. The residual values of principal component regression analysis were interpolated using ordinary Kriging and Arcgis 10.6. The formula used is the following:
where λ represents the normal conversion coefficient; principal component regression Kriging (PCRK) represents the SOCD based on the principal component regression Kriging model prediction; PCA stands for the SOCD values predicted using principal component regression models; REKR represents the SOCD values predicted via Kriging interpolation for principal component regression residuals; a represents the regression coefficient; represents the weighted sum of n principal components; Fi is the I principal component, bi represents the principal component regression coefficient; and n is the principal component score.
Random sample data collected from 30 sampling points were selected as validation datasets and the remaining 170 samples served as training datasets. The mean error (ME), mean absolute error (MAE), root mean square error (RMSE) and relative accuracy (RA) were selected to estimate the prediction accuracy of the model. When the ME value is greater than 0, the prediction value is lower than the actual measured value; when the ME value is lower than 0, the prediction value is higher than the measured value. The values of MAE, RMSE, or RA were used to evaluate the prediction accuracy of the model; the smaller the value, the higher the accuracy.
Results
SOCD and its vertical distribution
The SOCD in the 0–50 cm soil layer in Longxi County ranged from 15.68 Mg ha-1 to 38.20 Mg ha-1 (Table 1). The average SOCD was 6.60, 11.52 and 10.18 Mg ha-1 in the 0–10 cm 10–30 cm and 30–50 cm soil layer, respectively. Except for Fuxing Town, Shuangquan Town and Tong’anyi Town, the SOCD in the 10–30 cm soil layer was the highest, which was 1.07 to 1.44 times that of the 30–50 cm soil layer, and 1.28 to 2.03 times that of the 0–10 cm soil layer. The SOCD in the 30–50 cm soil layer took the second place and was 1.15–1.58 times that of the 0–10 cm soil layer, and the lowest level of SOCD was observed in the 0–10 cm soil layer. The mean standard deviation (σ) increased gradually with the soil depth, indicating that the variations in SOCD became more and more significant with the increase in soil depth.
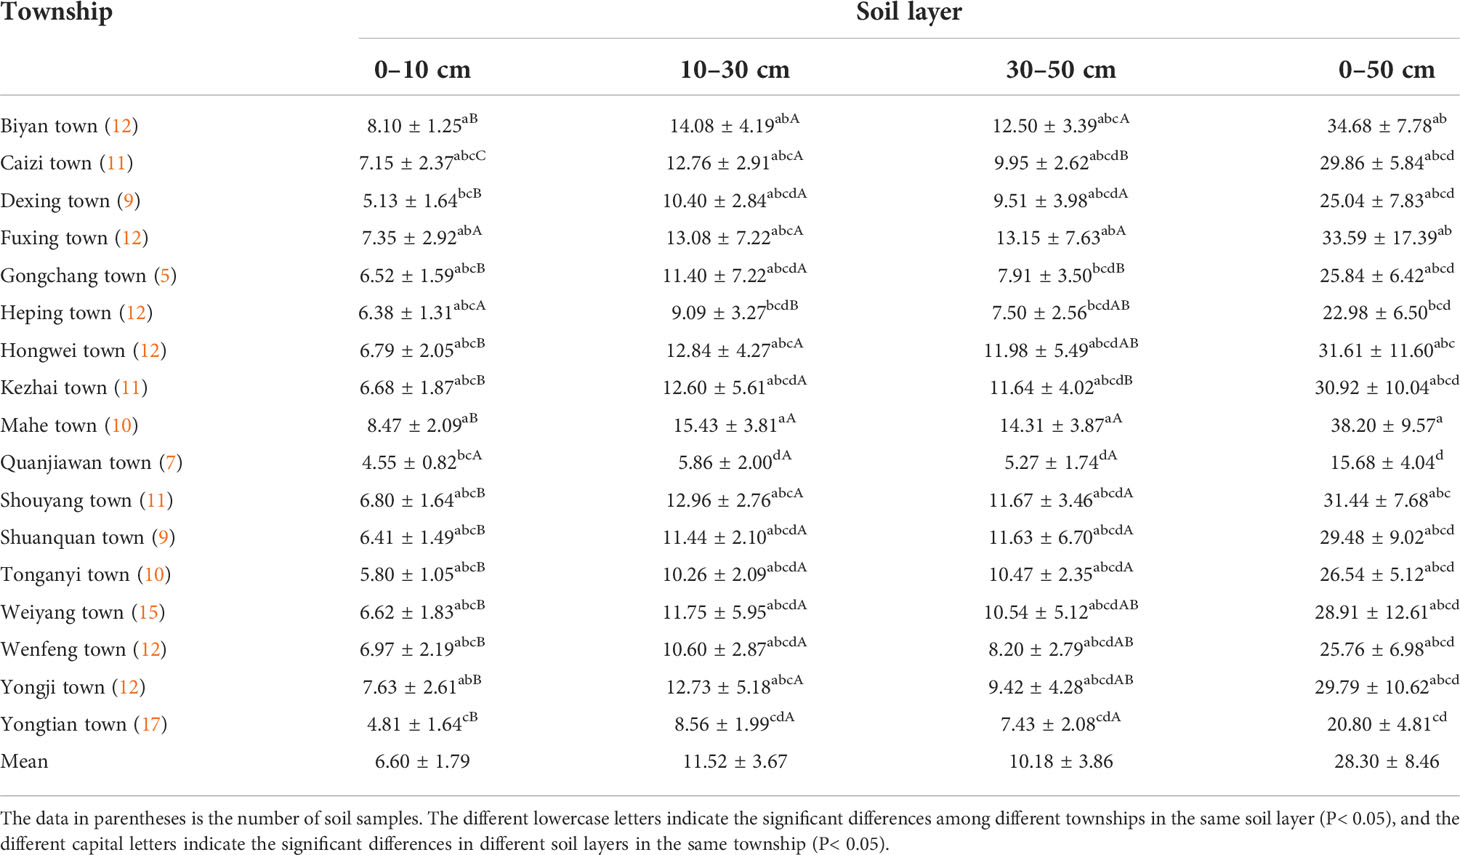
Table 1 Soil organic carbon density (mean ± standard deviation, Mg ha-1).
The relationship between SOCD and the environmental factors
The SOCD of each soil layer showed non-normality, and the normality conversion coefficient λ of the 0–10, 10–30 and 30–50 soil layers were 0.7, 0.25 and 0.3, respectively. The results of correlation analysis showed that the temperature, precipitation, elevation and TWI were significantly correlated with the NSOCD (P< 0.05), while the NSOCD10cm was significantly (P< 0.05) correlated with the slope, roughness and relief amplitude. The NSOCD30cm was also significantly correlated with the slope, and the NSOCD50cm was significantly correlated with the TWI (P< 0.05, Table 2).
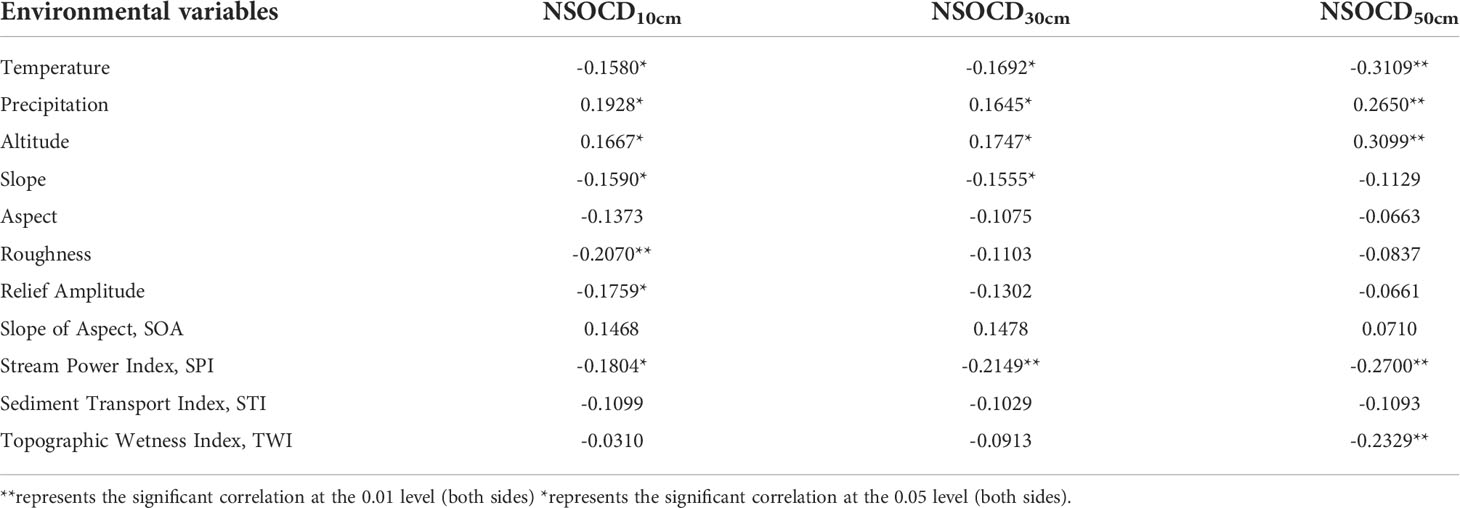
Table 2 The correlation between the soil organic carbon density and the environmental variables in different soil layers.
The correlation analysis results showed that a total of eight environmental variables were related to the NSOCD, of which the NSOCD10cm, NSOCD30cm and NSOCD50cm was related to seven, five, and five environmental variables, respectively (Table 3). The results of principal component analysis showed that the first two principal components related to NSOCD10cm, NSOCD30cm, and NSOCD50cm contained 89.41%, 91.38% and 89.41% of the information. F1i and F2i were used to represent the two principal components of each soil layer. (Equations 12, 13, and 14).
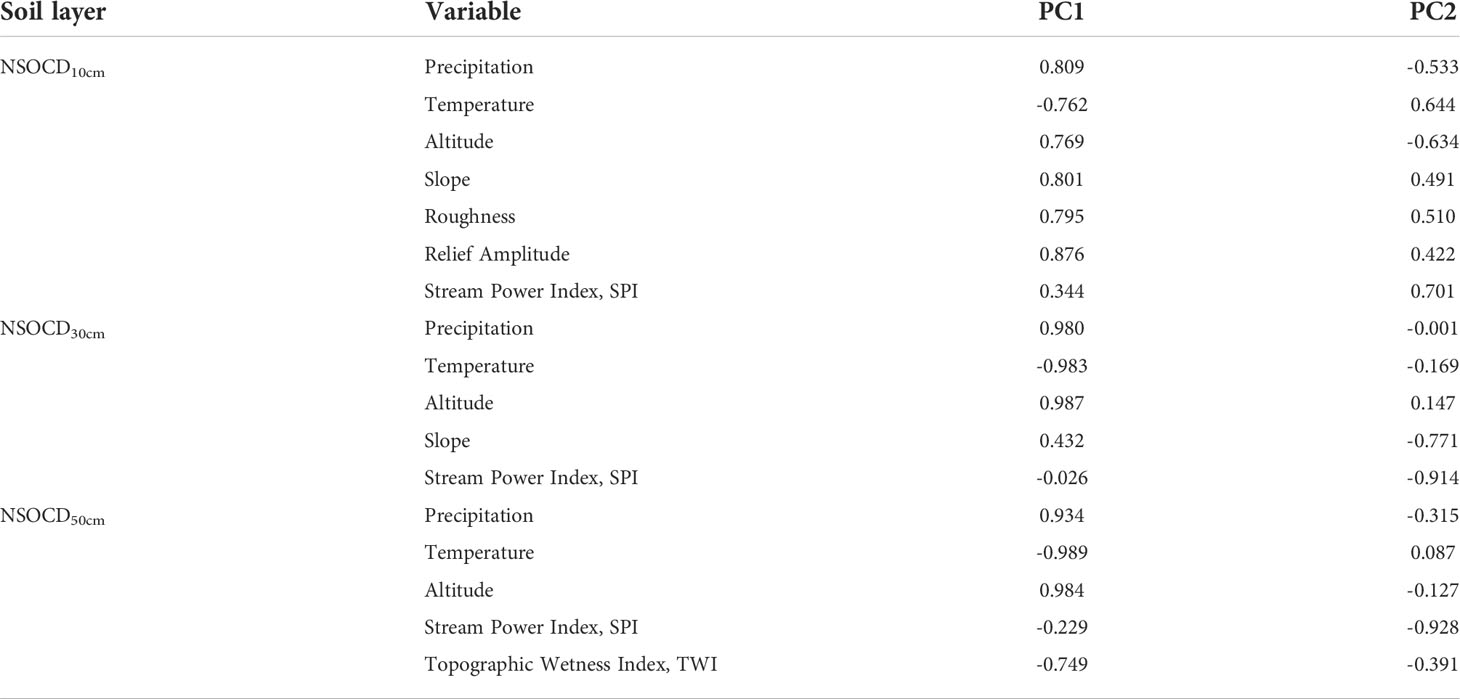
Table 3 Scoring coefficients of principal components.
The dimensionality reduction of the environmental variables was performed through correlation analysis and principal component analysis, and the relationship between the environmental variables and the SOCD was fully excavated by using a principal component regression model. However, the regression model only considers the structure of the data, which has a low degree of explanation for the SOCD, and the residual part cannot be fully explained. Therefore, a Kriging interpolation was carried out for the residual regression model, and then the residual results and the fitting results of the regression model were added together to obtain the PCRK to predict the spatial distribution characteristics of the SOCD (Table 4).
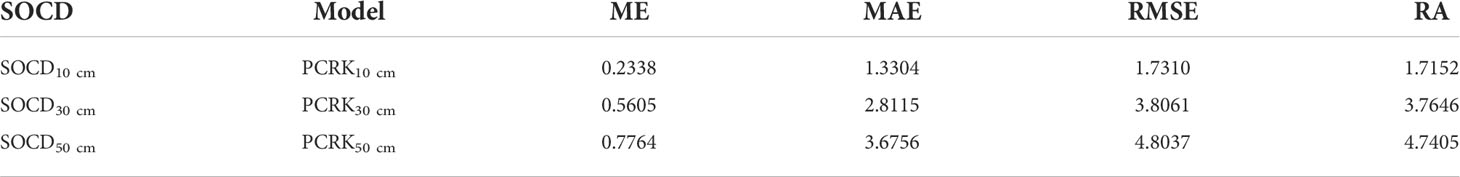
Table 4 Verified accuracy of the principal component regression kriging model.
Spatial distribution of SOCD and their organic carbon stocks
The results showed that the total SOCD (0-50cm) was about 26.7 ± 10.2 Mg ha-1 and the estimated stock of soil organic carbon reached 6.29 ± 2.41 Tg. The SOCD and stocks were different at different depths; in the first layer (0–10 cm), second layer (10–30 cm), and in the last layer (30–50 cm), the average SOCD reached 6.3 ± 1.7, 11.0 ± 3.8 and 9.3 ± 4.8 Mg ha-1 with a stock of 1.49 ± 0.41, 2.58 ± 0.90 and 2.21 ± 1.11 Tg, respectively (Figure 2).
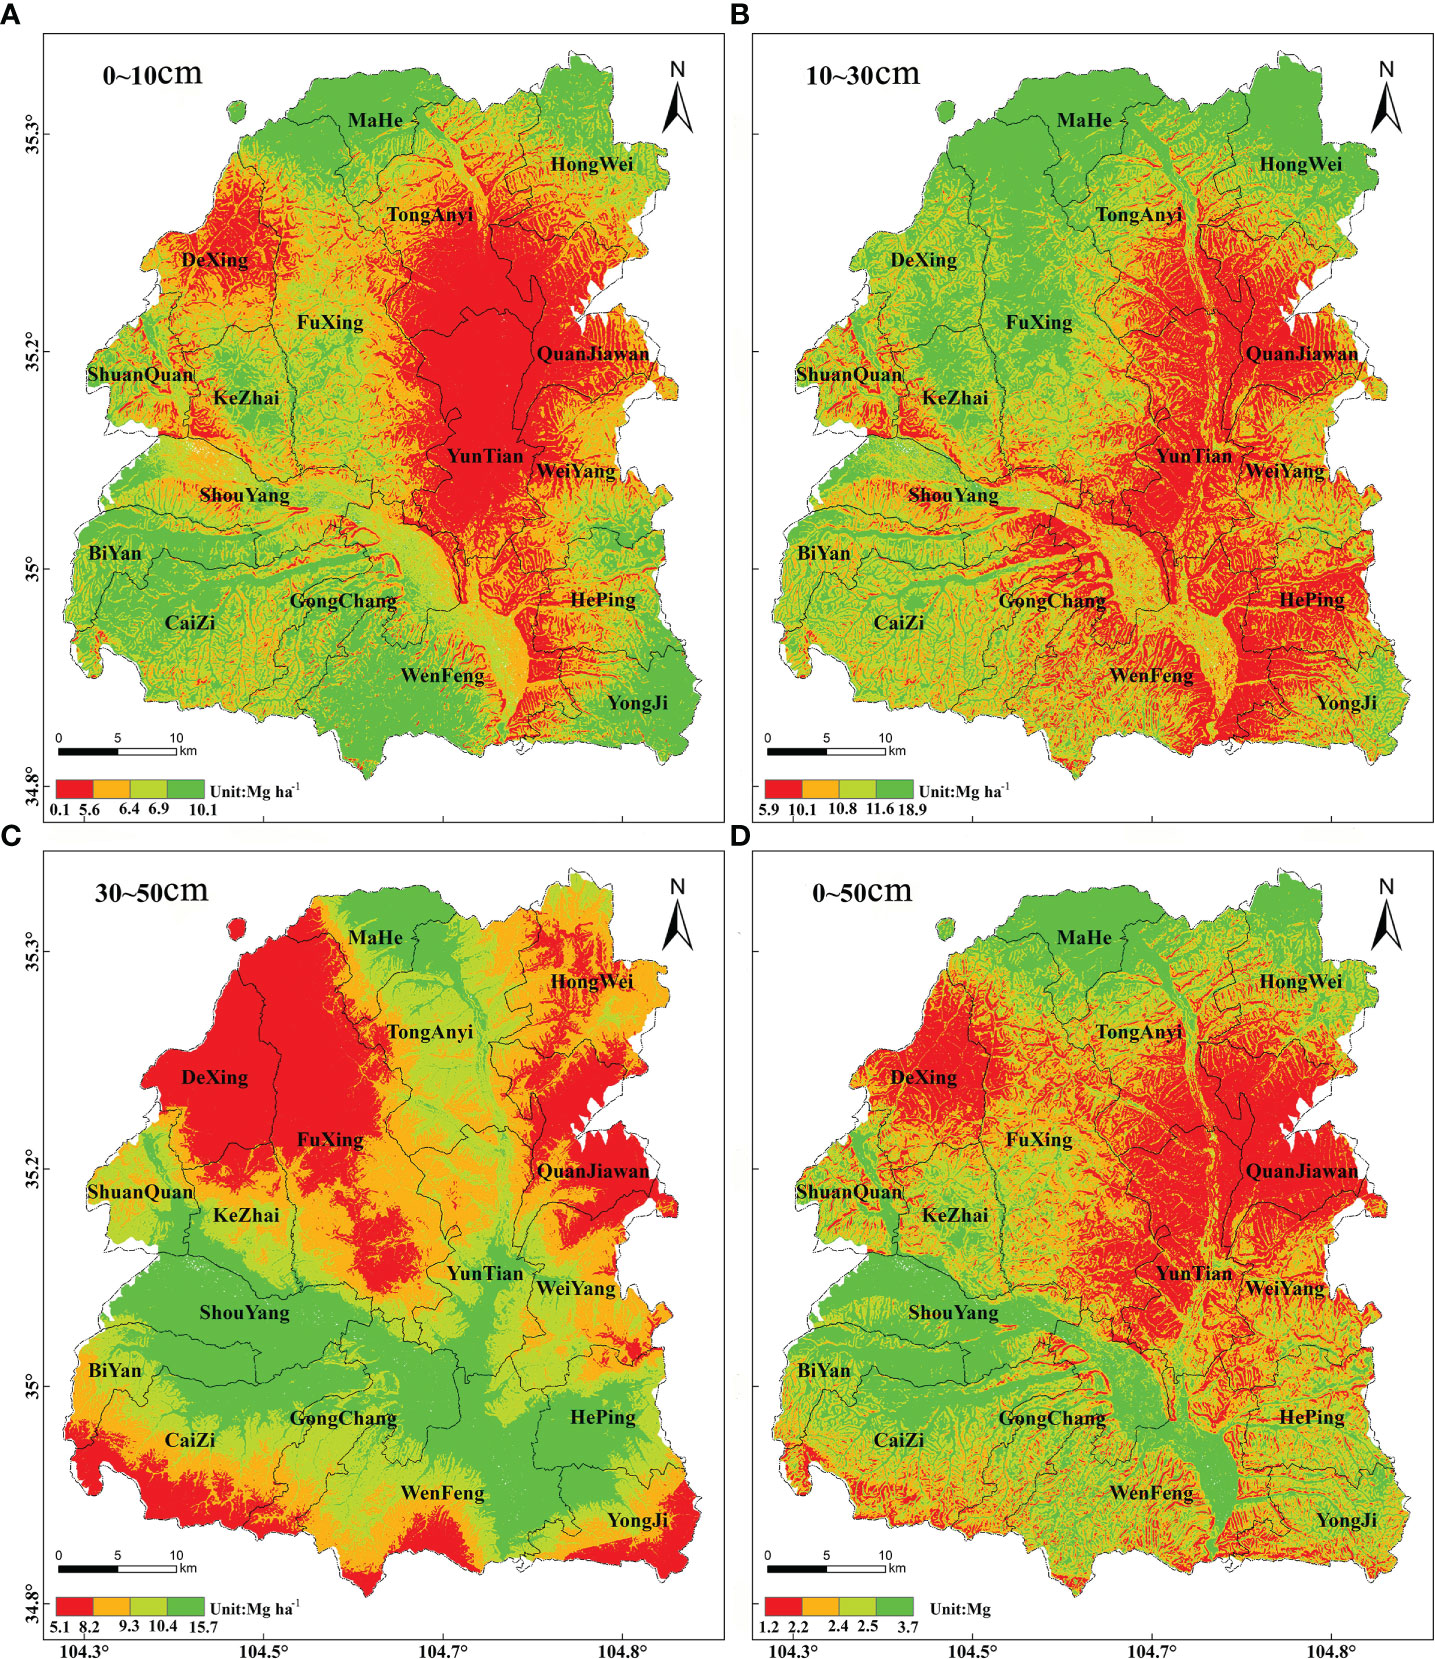
Figure 2 Interpolation results of the principal component regression Kriging model of SCOD in the (A) 0–10 cm soil layer, (B) the 10–30 cm soil layer, and the (C) 30–50 soil layer; and (D) soil organic carbon storage in the 0–50 cm soil layer.
Discussion
Relationships between the soil properties and the SOCD
Longxi County, which is located in the Loess Plateau, is the most important agricultural and traditional Chinese medicine planting area in Gansu Province. Its SOCD (0-20cm) level was 10.9 Mg ha-1, which was lower than the cropland of the Loess Plateau and the average levels of the Chinese croplands (20.5 to 21.7 Mg ha-1). The main soil types of Longxi County include Ustochrept, Chernozem, Krasnozem, Aquoll, and Alfisols, accounting for 82.99% of the county area (42, Figure 1). Among them, Ustochrept, chernozem and krasnozem show a coarse texture and serious leakage of water and fertilizer, which is not conducive to root development, resulting in a low content of soil organic matter (41). The SOCD of above-mentioned three soil types were 11.4, 18.6 and 16.1Mg ha-1 (42), respectively. The area of these three soil types in Longxi County accounts for 75.16% of the total area, which is an important cause of the low SOCD levels in the tillage layer of croplands.
Factors influencing spatial variability of SOC
Climatic factors (temperature, precipitation) and topographic factors (elevation, slope, surface roughness, among others) are important factors affecting the SOC content. These factors have direct/indirect effects on the mineralization rate of SOC, microbial activity, aboveground biomass, soil erosion and human activities, resulting in spatial heterogeneity of organic carbon (5, 20, 43). Results showed that there was a significant negative correlation between the SOCD and temperature. With the increase in temperature, both heterotrophic respiration and CO2 emissions increased, which led to a decrease in the SOCD levels (44–46). The rainfall is one of the main sources of soil water, affecting the soil moisture, permeability and the soil redox reactions, including mineralization, synthesis and decomposition of soil organic matter (47, 48). Studies had shown that the SOC content and precipitation were related, but the correlations varied from region to region (49). In this study, the SOCD in each soil layer was positively correlated with the annual rainfall. The reason is that the research area belongs to a semi-arid climate, and the increase in rainfall promotes the growth of vegetation and the decomposition of litter, which is conducive to the input and accumulation of organic carbon (50).
Topographic factors affected the redistribution of the soil hydrothermal resources and the process and intensity of material circulation in the soil ecosystem, thus affecting the organic carbon contents in soil (51, 52). This study showed that elevation and the SPI had a significant correlation with the SOCD in each soil layer, with the former being a significant positive correlation. With an increase in soil depth, the correlation between elevation and the SOCD was enhanced, and the correlation with the SPI was significantly negative. Climate change induced by altitude is a major determining factor; generally, a higher altitude leads to a lower temperature, less activity of the soil microbes, a lower decomposition rate of carbon, but a higher content of soil carbon (53, 54). The SPI is used to describe the erosivity of the surface flow. Higher levels of SPI indicate a greater extent of soil erosion, which ultimately leads to lower SOC levels (55). Additionally, the slope, relief amplitude and surface roughness can characterize the erosion of surface soil, the disturbance of the soil surface and the irregular changes in the micro-geomorphology (56). The surface soil was greatly affected by human activities, litters, crop residues, regular application of organic fertilizer and regular tillage (57). The behaviors mentioned above mostly affected the erosion status and micro topography of the soil surface, which resulted in a correlation between the slope, topographic fluctuation, surface roughness and the SOCD, which gradually decreased with an increase in the soil depth (8). Therefore, no obvious correlation was found in the deeper soil layer. In general, the TWI characterizes the dry and wet state of the soil and measures the water content of the soil. The results showed a negative correlation between the TWI and the SOCD with the increase in soil depth. Deep soil, which has a lower oxygen content and worse permeability, generally shows lower levels of SOCD and lower decomposition rates. For the agricultural land, human production activities have a great impact on soil, especially in traditional Chinese medicine planting areas; for example, different planting densities, technologies, fertilizer use, and continuous cropping or rotation tillage methods can affect the soil nutrients (6).
Conclusions
A deep understanding of the SOC levels is very important for Chinese medicine planting and its healthy development. In this study, the spatial distribution of SOC was shown to be comprehensively influenced by the climatic and topographical factors, at the county scale. The temperature, precipitation, elevation and confluence dynamic index were significantly correlated with the SOCD in each soil layer. The effects of the slope, topographic fluctuation and surface roughness on the distribution of the SOCD decreased gradually with the increase in soil depth. The scientific management of soil fertility and the development of precision agriculture by using a combining soil testing fertilization formula will guarantee the healthy development of Chinese medicine planting.
Data availability statement
The original contributions presented in the study are included in the article/Supplementary Material. Further inquiries can be directed to the corresponding author.
Author contributions
MH: Conceptualization, Methodology, Data curation, manuscript formation and editing. LT: Methodology, Visualization, Data analyses. CL: Writing- Original draft. JR: Investigation. All authors contributed to the article and approved the submitted version.
Funding
This study was supported by the Science and Technology Service Network Initiative, CAS (No. 855Z11002) and National Natural Science Foundation of China (No.41671103).
Conflict of interest
The authors declare that the research was conducted in the absence of any commercial or financial relationships that could be construed as a potential conflict of interest.
Publisher’s note
All claims expressed in this article are solely those of the authors and do not necessarily represent those of their affiliated organizations, or those of the publisher, the editors and the reviewers. Any product that may be evaluated in this article, or claim that may be made by its manufacturer, is not guaranteed or endorsed by the publisher.
Supplementary material
The Supplementary Material for this article can be found online at: https://www.frontiersin.org/articles/10.3389/fsoil.2022.877261/full#supplementary-material
Abbreviations
MAE, Mean absolute error; ME, Mean error; PCRK, Principal component regression Kriging; RA, Relative accuracy; RMSE, Root mean square error; SCA, Specific catchment area; SOA, Slope of aspect; SOC, Soil organic carbon; SOCD, Soil organic carbon density; SPI, Stream power index; STI, Sediment transport index; TWI, Topographic wetness index.
References
1. Lal R. Soils and world food security. Soil Till Res (2009) 102(1):1–4. doi: 10.1016/j.still.2008.08.001
2. van Groenigen KJ, Osenberg CW, Hungate BA. Increased soil emissions of potent greenhouse gases under increased atmospheric CO2. Nature (2011) 475:214–6. doi: 10.1038/nature10176
3. FAO. The state of food and agriculture: Climate change, agriculture and food security. Rome, Italy (2017). Available at: https://www.fao.org/publications/sofa/2016/en/
4. Zhao YC, Wang MY, Hu SJ, Zhang XD, Ouyang Z, Zhang GL, et al. Economics- and policy-driven organic carbon input enhancement dominates soil organic carbon accumulation in chinese croplands. P Natl Acad Sci USA (2018) 115(16):4045–50. doi: 10.1073/pnas.1700292114
5. Ren W, Banger K, Tao B, Yang J, Huang Y, Tian H. Global pattern and change of cropland soil organic carbon during 1901-2010: Roles of climate, atmospheric chemistry, land use and management. Geogr Sustainability (2020) 1(1):59–69. doi: 10.1016/j.geosus.2020.03.001
6. Xiao G, Hu Y, Zhang Q, Wang J, Li M. Impact of cultivation on soil organic carbon and carbon sequestration potential in semiarid regions of China. Soil Use Manage (2020) 36:83–92. doi: 10.1111/sum.12540
7. Herrick JE, Wander MM. Relationships between soil organic carbon and soil quality in cropped and rangeland soils: The importance of distribution, composition, and soil biological activity. In: Lal R, Kimble JM, Follett RF, Stewart BA, editors. Soil processes and the carbon cycle. New York, NY: CRC Press LLC (1997).
8. Zinn YL, Lal R, Resck DV. Changes in soil organic carbon stocks under agriculture in Brazil. Soil Till Res (2005) 84(1):28–40. doi: 10.1016/j.still.2004.08.007
9. Ogle SM, Breidt FJ, Easter M, Williams S, Killian K, Paustian K. Scale and uncertainty in modeled soil organic carbon stock changes for US croplands using a process-based model. Global Change Biol (2010) 16(2):810–22. doi: 10.1111/j.1365-2486.2009.01951.x
10. Cardinael R, Chevallier T, Barthes BG, Saby NPA, Parent T, Dupraz C, et al. Impact of alley cropping agroforestry on stocks, forms and spatial distribution of soil organic carbon - a case study in a Mediterranean context. Geoderma (2015) 259:288–99. doi: 10.1016/j.geoderma.2015.06.015
11. Havaee S, Ayoubi S, Mosaddeghi MR, Keller T. Impacts of land use soil organic matter and degree of compactness in calcareous soils of central Iran. Soil Use Manage (2014) 30(1):2–9. doi: 10.1111/sum.12092
12. Falahatkar S, Hosseini SM, Salman Mahiny A, Shamsollah A, Shao QW. Soil organic carbon stock as affected by land use/cover changes in the humid region of northern Iran. J Mt Sci (2014) 11:507–18. doi: 10.1007/s11629-013-2645-1
13. Samereh F, Seyed MH, Shamsollah A, Abdolrassoul S. Predicting soil organic carbon density using auxiliary environmental variables in northern Iran. Arch Agron Soil Sci (2016) 62(3):375–93. doi: 10.1080/03650340.2015.1051472
14. Li XG, Li YK, Li FM, Ma QF, Zhang PL, Yin P. Changes in soil organic carbon, nutrients and aggregation after conversion of native desert soil into irrigated arable land. Soil Till Res (2009) 104(2):263–9. doi: 10.1016/j.still.2009.03.002
15. Fang JY, Yu GR, Liu LL, Hu SJ, Chapin FS. Climate change, human impacts, and carbon sequestration in China. P Natl Acad Sci USA (2018) 115(16):4015–20. doi: 10.1073/pnas.1700304115
16. Han PF, Zhang W, Wang GC, Sun WJ, Huang Y. Changes in soil organic carbon in croplands subjected to fertilizer management: A global meta-analysis. Sci Rep (2016) 6:27199. doi: 10.1038/srep27199
17. Kumar S. Estimating spatial distribution of soil organic carbon for the Midwestern united states using historical database. Chemosphere (2015) 127:49–57. doi: 10.1016/j.chemosphere.2014.12.027
18. Martin MP, Wattenbach M, Smith P, Meersmans J, Jolivet C, Boulonne L, et al. Spatial distribution of soil organic carbon stocks in France. Biogeosciences (2011) 8(5):1053–65. doi: 10.5194/bg-8-1053-2011
19. Filippi P, Cattle SR, Pringle MJ, Bishop T. Space-time monitoring of soil organic carbon content across a semi-arid region of Australia. Geoderma Reg (2021) 24:e00367. doi: 10.1016/j.geodrs.2021.e00367
20. Zhang F, Wang Z, Glidden S, Wu YP, Tang L, Liu QY, et al. Changes in the soil organic carbon balance on china's cropland during the last two decades of the 20th century. Sci Rep (2017) 7:7144. doi: 10.1038/s41598-017-07237-1
21. Xu L, Yu GR, He NP. Increased soil organic carbon storage in Chinese terrestrial ecosystems from the 1980s to the 2010s. J Geogr Sci (2019) 29(1):49–66. doi: 10.1007/s11442-019-1583-4
22. Wang Z, Zhang B, Song KS, Liu D, Li F, Guo Z, et al. Soil organic carbon under different landscape attributes in croplands of northeast China. Plant Soil Environ (2008) 54(10):420–7. doi: 10.17221/402-pse
23. Liu ZP, Shao MA, Wang YQ. Large-Scale spatial variability and distribution of soil organic carbon across the entire loess plateau, China. Soil Res (2012) 50(2):114–24. doi: 10.1071/SR11183
24. Zhang P, Shao MA. Spatial variability and stocks of soil organic carbon in the gobi desert of northwestern China. PloS One (2014) 9(4):e93548. doi: 10.1371/journal.pone.0093584
25. Tajik S, Ayoubi S, Zeraatpisheh M. Digital mapping of soil organic carbon using ensemble learning model in mollisols of hyrcanian forests, northern Iran. Geoderma Reg (2020) 20:e00256. doi: 10.1016/j.geodrs.2020.e00256
26. Ajami M, Heidari A, Khormali F, Gorji M, Ayoubi S. Environmental factors controlling soil organic carbon storage in loess soils of a subhumid region, northern Iran. Geoderma (2016) 281:1–10. doi: 10.1016/j.geoderma.2016.06.017
27. Sun B, Wang Y, Li Z, Gao W, Wu J, Li C, et al. Estimating soil organic carbon density in the otindag sandy land, inner Mongolia, China, for modelling spatiotemporal variations and evaluating the influences of human activities. Catena (2019) 179:85–97. doi: 10.1016/j.catena.2019.03.034
28. Wu Z, Wang B, Huang J, An Z, Jiang P, Chen Y, et al. Estimating soil organic carbon density in plains using landscape metric-based regression kriging model. Soil Till Res (2019) 195:104381. doi: 10.1016/j.still.2019.104381
29. Dong L, Shang J, Ali R, Rehman RU. The coupling coordinated relationship between new-type urbanization, eco-environment and its driving mechanism: A case of guanzhong, China. Front Env Sci (2021) 9:638891. doi: 10.3389/fenvs.2021.638891
30. Piri I, Khanamani A, Shojaei S, Fathizad H. Determination of the best geostatistical method for climatic zoning in Iran. Appl Ecol Env Res (2017) 15(1):93–103. doi: 10.15666/aeer/1501_093103
31. Lin YP, Yeh MS, Deng DP, Wang YC. Geostatistical approaches and optimal additional sampling schemes for spatial patterns and future sampling of bird diversity. Global Ecol Biogeogr (2008) 17(2):175–88. doi: 10.1111/j.1466-8238.2007.00352.x
32. Ganio LM, Torgersen CE, Gresswell RE. A geostatistical approach for describing spatial pattern in stream networks. Front Ecol Environ (2005) 3(3):138–44. doi: 10.1890/1540-9295(2005)003[0138:AGAFDS]2.0.CO;2
33. Chen G, Sun W, Wang X, Kongkiatpaiboon S, Cai X. Conserving threatened widespread species: A case study using a traditional medicinal plant in Asia. Biodivers Conserv (2019) 28(1):213–27. doi: 10.1007/s10531-018-1648-1
34. Hinsley A, Milner-Gulland EJ, Cooney R, Timoshyna A, Ruan X, Lee TM. Building sustainability into the belt and road initiative’s traditional Chinese medicine trade. Nat Sustain (2020) 3(2):96–100. doi: 10.1038/s41893-019-0460-6
35. Applequist WL, Brinckmann JA, Cunningham AB, Hart RE, Heinrich M, Katerere DR, et al. Scientists&ph.rsquo; warning on climate change and medicinal plants. Planta Med (2020) 86(01):10–8. doi: 10.1055/a-1041-3406
36. Sadia S, Aftab B, Tariq A, Zhang JT, Razaq A. Gentiopicrin and swertiamarin contents in Gentiana macrophylla pall. Roots along elevation gradient in donglingshan meadow, Beijing, China. Pak J Bot (2019) 52(1):1–6. doi: 10.30848/PJB2020-1(31
37. Shahriaria A, Khormalia F, Kehlb M, Ayoubic S, Welpd G. Effect of a long-term cultivation and crop rotations on organic carbon in loess derived soils of golestan province, northern Iran. Int J Plant Prod (2012) 5(2):147–52. doi: 10.22069/IJPP.2012.728
38. Tan G, Liu Y, Peng S, Yin H, Meng D, Tao J, et al. Soil potentials to resist continuous cropping obstacle: Three field cases. Environ Res (2021) 200:111319. doi: 10.1016/j.envres.2021.111319
40. Walkley A, Black IA. An examination of the degtjareff method for determining soil organic matter, and a proposed modification of the chromic acid titration method. Soil Sci (1934) 37(1):29–38. doi: 10.1097/00010694-193401000-00003
41. Soil Census Office In Gansu Province. In: Soil types in gansu province. Lanzhou: Gansu Science and Technology Press. (1992)
42. Xie X, Sun B, Zhou H, Li Z, Li A. Organic carbon density and storage in soils of China and spatial analysis. Acta Pedologica Sin (2004) 41(1):35–43. doi: 10.11766/trxb200301140106.(in Chinese with English abstract)
43. Zhou Y, Hartemink AE, Shi Z, Liang ZZ, Lu YL. Land use and climate change effects on soil organic carbon in north and northeast China. Sci Total Environ (2019) 647:1230–8. doi: 10.1016/j.scitotenv.2018.08.016
44. Feng W, Liang J, Hale LE, Jung CG, Chen J, Zhou J, et al. Enhanced decomposition of stable soil organic carbon and microbial catabolic potentials by long-term field warming. Global Change Biol (2017) 23(11):4765–76. doi: 10.1111/gcb.13755
45. Ding X, Chen S, Zhang B, Liang C, He H, Horwath WR. Warming increases microbial residue contribution to soil organic carbon in an alpine meadow. Soil Biol Biochem (2019) 135:13–9. doi: 10.1016/j.soilbio.2019.04.004
46. Li F, Peng Y, Chen L, Yang G, Abbott BW, Zhang D, et al. Warming alters surface soil organic matter composition despite unchanged carbon stocks in a Tibetan permafrost ecosystem. Funct Ecol (2020) 34(4):911–22. doi: 10.1111/1365-2435.13489
47. Li X, Liang Z, Li Y, Zhu Y, Tian X, Shi J, et al. Short-term effects of combined organic amendments on soil organic carbon sequestration in a rain-fed winter wheat system. Agron J (2021) 113(2):2150–64. doi: 10.1002/agj2.20624
48. Tiefenbacher A, Weigelhofer G, Klik A, Mabit L, Santner J, Wenzel W, et al. Antecedent soil moisture and rain intensity control pathways and quality of organic carbon exports from arable land. Catena (2021) 202:105297. doi: 10.1016/j.catena.2021.105297
49. She W, Zhang Y, Qin S, Wu B, Bai Y. Increased precipitation and nitrogen alter shrub architecture in a desert shrubland: Implications for primary production. Front Plant Sci (2016) 7:1908. doi: 10.3389/fpls.2016.01908
50. Gordon H, Haygarth PM, Bardgett RD. Drying and rewetting effects on soil microbial community composition and nutrient leaching. Soil Biol Biochem (2008) 40(2):302–11. doi: 10.1016/j.soilbio.2007.08.008
51. Yimer F, Ledin S, Abdelkadir A. Soil organic carbon and total nitrogen stocks as affected by topographic aspect and vegetation in the bale mountains, Ethiopia. Geoderma (2006) 135:335–44. doi: 10.1016/j.geoderma.2006.01.005
52. Yang F, Wei X, Huang M, Li C, Zhao X, Zhang Z. Spatiotemporal variability of soil organic carbon for different topographic and land use types in a gully watershed on the Chinese loess plateau. Soil Res (2021) 59(4):383–95. doi: 10.1071/sr19317
53. Oueslati I, Allamano P, Bonifacio E, Claps P. Vegetation and topographic control on spatial variability of soil organic carbon. Pedosphere (2013) 23(1):48–58. doi: 10.1016/s1002-0160(12)60079-4
54. Schillaci C, Acutis M, Lombardo L, Lipani A, Fantappie M, Maerker M, et al. Spatio-temporal topsoil organic carbon mapping of a semi-arid Mediterranean region: The role of land use, soil texture, topographic indices and the influence of remote sensing data to modelling. Sci Total Environ (2017) 601:821–32. doi: 10.1016/j.scitotenv.2017.05.239
55. Ghunowa K, MacVicar BJ, Ashmore P. Stream power index for networks (SPIN) toolbox for decision support in urbanizing watersheds. Environ Modell Software (2021) 144:105185. doi: 10.1016/j.envsoft.2021.105185
56. Wang S, Zhuang Q, Wang Q, Jin X, Han C. Mapping stocks of soil organic carbon and soil total nitrogen in liaoning province of China. Geoderma (2017) 305:250–63. doi: 10.1016/j.geoderma.2017.05.048
Keywords: climate conditions, geostatistical analysis, human activity, soil profile, soil organic carbon storage, topographic feature
Citation: He M, Tang L, Li C and Ren J (2022) Factors controlling the spatial distribution of soil organic carbon in the Chinese medicine producing area of NW China1. Front. Soil Sci. 2:877261. doi: 10.3389/fsoil.2022.877261
Received: 16 February 2022; Accepted: 22 July 2022;
Published: 15 August 2022.
Edited by:
Ruhollah Taghizadeh, University of Tübingen, GermanyReviewed by:
Jorge Álvaro-Fuentes, Spanish National Research Council (CSIC), SpainShamsollah Ayoubi, Isfahan University of Technology, Iran
Copyright © 2022 He, Tang, Li and Ren. This is an open-access article distributed under the terms of the Creative Commons Attribution License (CC BY). The use, distribution or reproduction in other forums is permitted, provided the original author(s) and the copyright owner(s) are credited and that the original publication in this journal is cited, in accordance with accepted academic practice. No use, distribution or reproduction is permitted which does not comply with these terms.
*Correspondence: Mingzhu He, aG16ZWNvbG9neUBsemIuYWMuY24=