 David Emde
 Kirsten D. Hannam
 Andrew J. Midwood
 Melanie D. Jones
- 1Biology Department, University of British Columbia, Okanagan Campus, Kelowna, BC, Canada
- 2Agriculture and Agri-Food Canada, Summerland Research and Development Centre, Summerland, BC, Canada
To successfully reduce atmospheric CO2 by sequestering additional soil carbon, it is essential to understand the potential of a given soil to store carbon in a stable form. Carbon that has formed organo-mineral complexes with silt and clay particles is believed to be less susceptible to decay than non-complexed, or particulate, organic carbon. Using direct measurements of mineral associated organic matter (MAOC) on a subset of samples, and an approach developed previously for primarily allophanic soils, we took a modeling approach to estimate MAOC for 537 samples of much coarser and younger soils from 99 non-cultivated and agricultural sites in the Okanagan Valley, British Columbia, Canada. Using specific surface area (SSA) or soil texture as indicators of the mineral surface area available for sorption of organic matter, we used both Random Forest (RF) and Stepwise Multiple Regression with Akaike Information Criterion (SMR) to determine a best fit model for predicting MAOC. Random Forest modeling using SSA in addition to total SOC, exchangeable calcium, exchangeable potassium, and soil pH performed better than SMR for determining MAOC in these soils (R2: 0.790 for RF; R2: 0.713 for SMR). To determine if a MAOC deficit existed for these soils, we then applied a quantile regression approach wherein the predicted 90th quantile of MAOC represents the MAOC formation capacity. We determined that MAOC deficits were present in all soils and increased with depth. Moreover, clay rich soils had greater MAOC deficits (1.62 g kg−1 for 0–15 cm, 4.01 g kg−1 for 15–30 cm, and 5.80 g kg−1 for 30–60 cm), than sandier soils (1.01 g kg−1 for 0–15 cm, 2.72 g kg−1 for 15–30 cm, and 3.69 g kg−1 for 30–60 cm). Furthermore, the upper 30 cm of these soils have the potential to increase MAOC stocks by 29% (48.0 million kg of MAOC over 8,501 ha) before they reach formation capacity. This study highlights the variability in MAOC formation capacity of soils with different physicochemical properties and provides a framework for estimating MAOC concentrations and deficits for soils with a wide range of physicochemical properties.
Introduction
Land-use change and land management practices have altered the earth's largest terrestrial carbon pool: soil carbon (1). For example, since the advent of agriculture, conversion of non-cultivated land has decreased global C stocks by ~116 Pg (2), amounting to a loss of ~5% of the current global terrestrial carbon stock (3). There is a growing understanding that agricultural management practices that promote soil carbon sequestration provide benefits not only to crop productivity and increased nutrient cycling, but also long term sequestration of CO2 from the atmosphere (4–7). Agricultural soils have thereby become a rallying point for carbon farming initiatives (8) as well as broader-reaching net-zero carbon commitments, such as Canada's Strengthened Climate Plan, which is aimed at exceeding Canada's 2030 Paris agreement reduction goals and achieving net-zero emissions by 2050 (9).
Soil organic matter (SOM) can be separated into two broadly defined pools: particulate organic matter, and mineral-associated organic matter (10–12). Particulate organic matter (POM) more closely resembles the plant, animal, and fungal material it originated from and tends to be unbound in the soil matrix (7, 13–15). Mineral-associated organic matter (MAOM), by contrast, is typically comprised of small molecular weight, microbially processed compounds, and is sorbed to the surfaces of mineral particles in the soil (12, 16–18). Here, we refer to the carbon component of POM and MAOM as particulate organic carbon (POC) and mineral-associated organic carbon (MAOC), respectively. Given that it forms part of the unbound organic matter in the soil, POC is more vulnerable to agricultural management practices that cause disturbance to the soil (i.e., tillage), and is generally believed to have a relatively quick turnover time (10, 18–21), whereas MAOC, which is physically protected from microbial decay, can remain in soils for decades to centuries (17, 22, 23). Furthermore, MAOC is far more resistant to changes in decomposition rate as temperatures increase (24). Therefore, from a climate change mitigation perspective, the benefits of increasing MAOC are two-fold: first, residence times of MAOC are greater than POC, and second, the vulnerability of MAOC to rising global temperatures is lower than POC (23).
Global estimates of soil carbon sequestration capacity are often limited to total soil carbon, rather than the more stable MAOC fraction within the total soil carbon pool. That being said, Chen et al. (25) and Wiesmeier et al. (26) applied the Hassink (27) equation to estimate fine fraction C saturation potential in French and southeastern German soils, respectively. Chen et al. (25) concluded that cropland and vineyard/orchard soils have fine fraction C saturation deficits of ~36 and 57%, respectively, while Wiesmeier et al. (26) concluded that cropland soils have a fine fraction C saturation deficit of ~50%. Rather than relying on the Hassink equation to estimate fine fraction SOC (MAOC) concentration, we developed a model for estimating MAOC concentrations that was parameterized using actual measurements of MAOC conducted on a subset of our soil samples. In order to focus carbon sequestration efforts on the adoption of management practices that increase MAOC in soils, it is important to identify soils that have not yet reached maximum MAOC capacity. While carbon stabilization methods have been discussed more frequently in recent years, there are very few studies that attempt to quantify the potential for additional carbon storage in specific soils beyond surface depths.
To quantify any potential for additional MAOC storage, two measures must be determined for a given soil: the current concentration of MAOC in the soil, and the maximum achievable concentration of MAOC for the soil (i.e., its “stabilization capacity”). The difference between these two values is then considered to be the “stable carbon deficit” (28, 29).
There is a general consensus that MAOC formation is strongly influenced by the fine fraction of the soil (27, 29). Clay and silt particles account for the majority of the surface area available for sorption of MAOC and, therefore, clay and silt content have often been used to estimate current MAOC concentrations (29–31). More recently, however, McNally et al. (29) found that current MAOC was estimated more accurately by using the specific surface area (SSA) of the soil coupled with extractable aluminum concentrations rather than soil texture per se. The New Zealand-wide soils database used in McNally et al. (29) included primarily acidic soils of volcanic origin containing fine-textured allophanes. By contrast, many agricultural soils in the Northern Hemisphere are of glacial origin and are often coarse-textured; furthermore, those in semi-arid regions tend to be more alkaline (32). In acidic soils, aluminum- and iron-oxides stabilize soil carbon by forming organo-mineral complexes, whereas in alkaline soils, calcium forms divalent cation bridges between fine soil carbon and mineral surfaces (33–36). Differences in how MAOC is formed in soils with varying pH, texture, and mineralogy highlights the importance of taking a more mechanistic approach to MAOC estimation—one that can accommodate individual differences in soil parent material (29, 37). In order to do so, development of any model to estimate MAOC must use predictor variables appropriate for the soil type in the region.
Current concepts of carbon stabilization capacity revolve around the notion of mineral saturation by fine fraction carbon; that is, the point at which carbon is bound to all available mineral surfaces such that no further binding of carbon is possible (38, 39). Statistical methods offer insights into the theoretical MAOC saturation threshold values, but the mechanisms behind these values provide conceptual challenges. For example, any values generated by MAOC saturation threshold models are necessarily affected by current MAOC values, which are, in turn, influenced by current soil conditions. As such, the resulting MAOC saturation threshold determined by these models does not necessarily represent “saturation,” but is instead a reflection of the challenges imposed by the current climatic, agronomic, and soil physicochemical conditions. If some combination of those conditions change, the theoretical MAOC saturation capacity is also likely to change over time. Further, it has been shown that OM preferentially binds to rough mineral surfaces and existing organo-mineral clusters, to the degree that <19% of the visible mineral surface area of Luvisols during a 42 day incubation experiment was occupied by OM (39). It follows that the MAOC saturation threshold value generated by model estimates is therefore a MAOC formation capacity under the current soil conditions, rather than a saturation threshold, per se. Therefore, instead of the term “saturation,” we recommend adopting the nomenclature “MAOC formation capacity,” as we have here. This term makes no assumptions regarding the limits of mineral saturation, and more accurately represents the values estimated using carbon stabilization models.
The capacity for a soil to form MAOC is difficult to determine with confidence. Several studies have used the mass proportion of fine soil particles (clay and fine silt) to predict MAOC formation capacity directly using a least squares regression model (15, 27). However, Six et al. (15) and Beare et al. (28), have shown that this approach likely underestimates the MAOC formation capacity due to limitations in the application of least squares regression (30). Two such limitations stand out in particular. First, there is an underlying assumption in these regression models that soil mineralogy has no effect on C stabilization (15, 30). Second, the maximum capacity regression line generated by such models relies on the assumption that all samples used in the model are near their maximum C stabilization capacity (30). In light of these issues, McNally et al. (29) endeavored to improve the statistical method by which the MAOC formation capacity of New Zealand's soils could be estimated. To account for differences in mineralogy, current MAOC was estimated using SSA and concentration of exchangeable aluminum in the soils, and further, MAOC formation capacity was considered to be the 90th quantile of MAOC in the samples, as calculated using a quantile regression model (29). This method thereby uses the upper range of measured MAOC values to estimate the theoretically obtainable, upper threshold of MAOC formation for a soil.
The objective of the current study was to adapt the method developed by McNally et al. (29) for estimating the MAOC deficit for fine textured, acidic soils of volcanic origin in New Zealand so that it is appropriate for estimating the MAOC deficit for predominantly coarse-textured, alkaline soils of glacial origin in the Okanagan Valley, British Columbia, Canada. First, we confirmed that different factors correlated with the accumulation of C in the total SOC, and the POC and MAOC fractions by examining the variables that best predicted their C contents. In all subsequent analyses, we focused on MAOC only, because we were particularly interested in looking at factors related to stable soil C storage. After determining the best predictor variables to include in the model to estimate current MAOC, and then select an appropriate model algorithm. One of the most important questions we sought to answer was whether soil texture or SSA was a better predictor variable for these soils. We used previously published chemical and texture data from a recent soil survey conducted in orchards and vineyards in this region (7, 19), as well as new data we collected on the specific surface area of the same soils. The five soil groups included in this study represent a range of textures, meaning the results may be used widely. Recent work conducted on a subset of these soil samples showed that the concentration of MAOC in the top 30 cm of soil has more than doubled over several decades of perennial cropping relative to adjacent non-cultivated soils, and has a current MAOC stock of 168.0 million kg across 8,501 ha (7). However, such MAOC accrual cannot be expected to continue indefinitely. Here, we wanted to: (i) determine if there is still a MAOC deficit present in these soils, given the large, relatively recent accumulation of MAOC, and (ii) identify soil types with the greatest potential to store additional MAOC. Because direct measurement of MAOC is difficult and time consuming, we first needed to: (iii) determine the best modeling approach for estimating current MAOC concentrations using commonly measured soil characteristics, which required (iv) determining the most efficient method for estimating SSA. Hence, we generated candidate models for estimation of MAOC and then, using the best performing model, estimated missing MAOC values for our dataset. Next, we used the 90th quantile approach established by McNally et al. (29) to estimate MAOC formation capacity, by depth increment, for each of the five soil groups.
Materials and Methods
The multi-stage process by which MAOC deficits in the soils Okanagan Valley perennial cropping systems were determined involved the careful selection and assessment of both soil physicochemical variables and modeling approaches. This process can be roughly grouped into three overall stages: (i) data acquisition and variable selection; (ii) model selection for MAOC estimation; and (iii) MAOC deficit estimation (Figure 1).
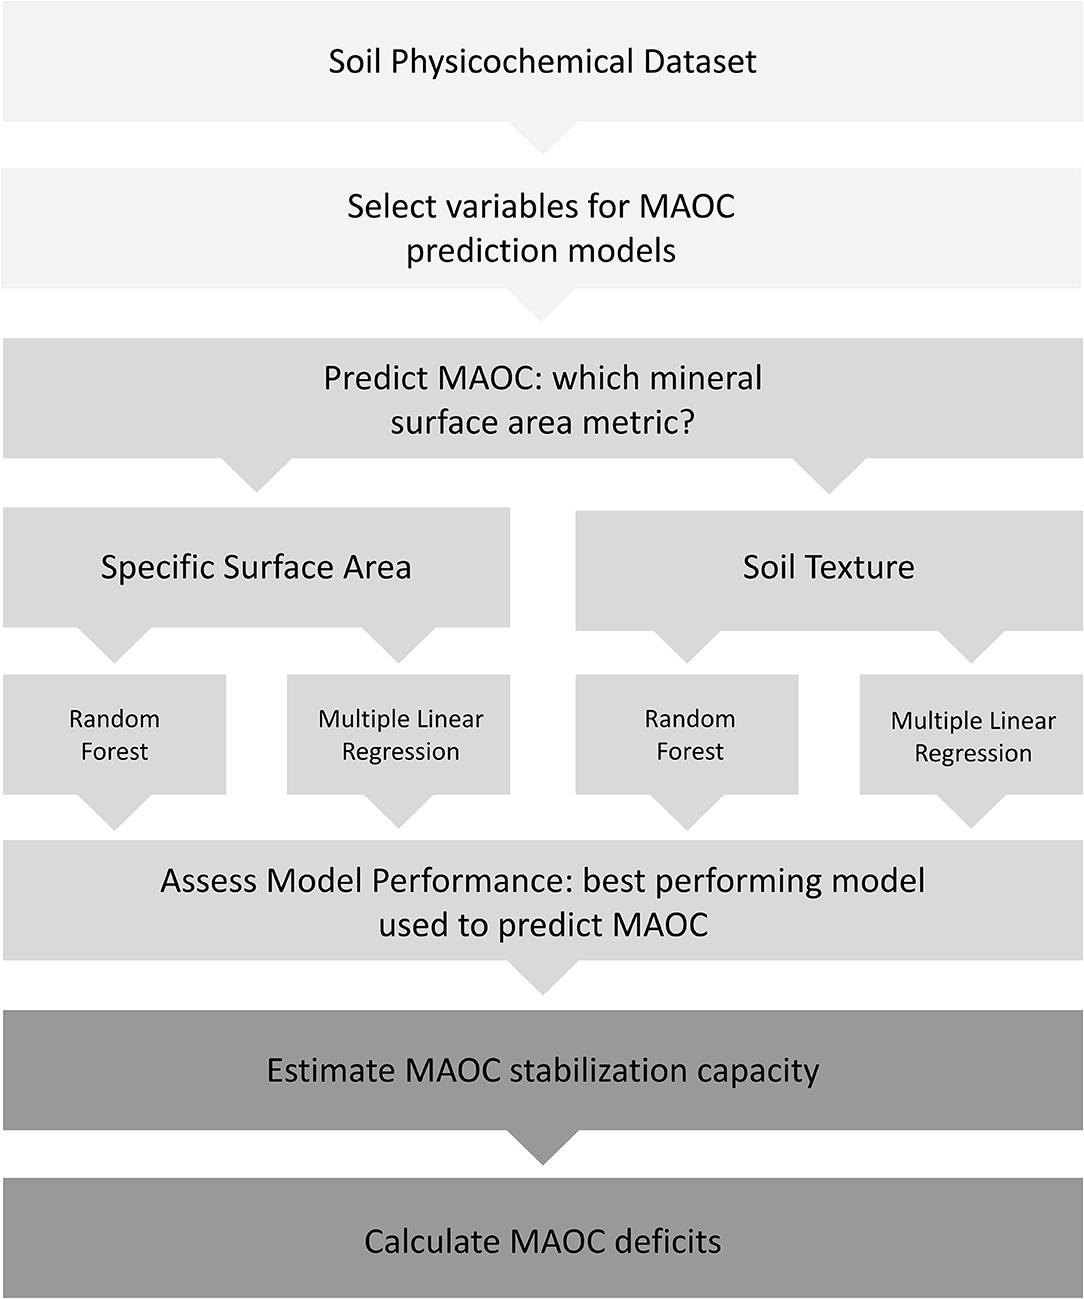
Figure 1. Outline of the MAOC deficit determination process. Light gray sections denote the data acquisition and variable selection stage, middle gray denotes the model selection for MAOC estimation process, and dark gray denotes the MAOC deficit calculation process.
Data Acquisition and Variable Selection
Okanagan Valley Soils Database
The Okanagan Valley resides along a 200 km-long temperature and precipitation gradient, with 30-year annual daily temperature and precipitation averages of 18.0°C and 279.5 mm in the southern part of the Valley, and 15.0°C and 383.5 mm in the north (40). The region is known for its cultivation of woody perennial fruit crops, including wine grapes, apples, and sweet cherries. Five groups of common soil types were selected, based on the surficial parent material from which they developed: (i) clayey glaciolacustrine sediments, (ii) sandy or silty glaciolacustrine sediments, (iii) eolian veneer over morainal deposits, (iv) gravelly fluvioglacial deposits, and (v) sandy or silty fluvioglacial deposits (Figure 2). These soil groups represent ~40% (8,501 ha) of the agricultural landbase in the Okanagan Valley and were deliberately selected to capture a range of soil textures from across the Valley, although most had sandy loam to loamy textures.
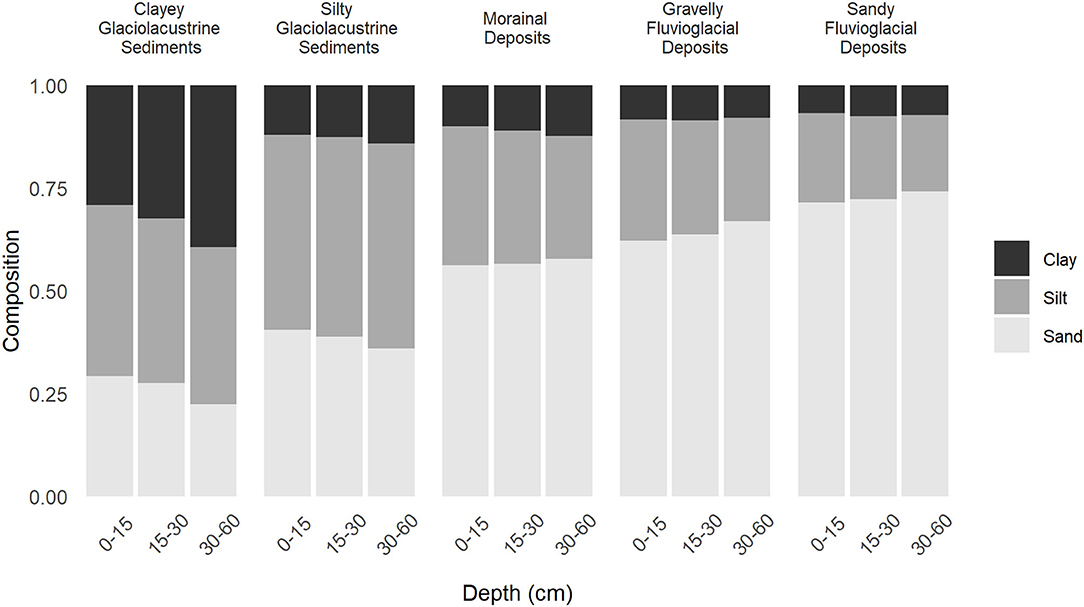
Figure 2. Soil texture composition of all 537 samples separated by the five soil groups used in this study. Soil groups are defined by their surficial deposit classifications. Modified from Midwood et al. (19).
Composite soil samples were taken at three depths (0–15, 15–30, and 30–60 cm) from the drive rows and crop rows of four woody perennial cropping systems: drip-irrigated apples and grapes, and micro-spray-irrigated apples and cherries in each of the five soil groups. Non-cultivated, adjacent areas under native vegetation [typically grassland and shrubland, e.g., Ponderosa pine (Pinus ponderosa), sagebrush (Artemisia spp.), yellow rabbitbrush (Chrysothamnus viscidiflorus), bluebunch wheatgrass (Elymus spicatus)] with similar soil classification, elevation, climatic conditions, and aspect were also sampled (7). Data from 537 soil samples collected from 99 sites were used for the current study (18 uncultivated sites ×3 depths; 81 cultivated sites ×3 depths for drive- and crop-row samples; three individual samples were inaccessible at the 30–60 cm depth); the soil sampling and analysis protocol was outlined in detail in Midwood et al. (19). Briefly, soil samples were collected from between 10 and 20 randomly chosen points over an approximate area of 0.25–0.5 ha and composited by depth increment. In agricultural sites, separate composite samples were collected, by depth, from the crop rows and the drive rows (strips of herbaceous vegetation between the crop rows). Composite samples were then sieved to 8 mm to remove large stones and roots, air-dried, and then further sieved to 2 mm prior to further analysis.
Each sample was analyzed for soil texture (% sand, % silt, and % clay); exchangeable Ca (meq 100 g−1 dry soil), Mg (meq 100 g−1 dry soil), K (meq 100 g−1 dry soil), and Na (meq 100 g−1 dry soil); total N (%); soil organic and inorganic carbon (SOC, %; SIC, %); mean δ13C composition (‰); and soil pH. Details on the specific methods applied can be found in Midwood et al. (7, 19). Mineral-associated organic carbon (MAOC) was measured on a subset of 216 samples, chosen to represent a cross-section of all soil types, cropping systems, and soil depths sampled, such that the subset matched the soil property representation of the larger dataset as closely as possible. The soil fractionation process is outlined in greater detail in Midwood et al. (7) and follows the method described in Poeplau et al. (18) as “Par+Den5.” Briefly, this method uses a combination of flotation and repeated wet sieving to produce a series of mechanistically distinct fractions. Overall, fractionation resulted in good recovery with the average accumulated weight of the two fractions accounting for 94.3% of the initial soil weight (low of 90.8%, high of 96.8%). More detail on the efficiency and recovery of the method used to separate POM and MAOM is provided in Midwood et al. (7). The resulting soil fractions were simplified, following the approach used by Cotrufo et al. (16), into the two soil carbon fractions used in this analysis: MAOM (<50 μm fraction = silt + clay) and POM (>50 μm fraction). Here, MAOC refers to the C content measured from the <50 μm fraction. This fractionated subset (216 soil samples) was used to develop a model that estimated current MAOC concentrations using other soil variables, with the best performing model being used to fill in missing MAOC values for the remaining 321 soil samples for which MAOC was not directly measured.
Methods of Estimating Specific Surface Area
Specific surface area (SSA) represents the surface area of minerals (Figure 3) available for binding small molecular weight, microbially processed carbon (28, 29); consequently, we wanted to include SSA in the models to estimate MAOC, but these data had not previously been measured on the Okanagan Valley soil samples. Specific surface area analyses of soils can be difficult and time consuming; therefore, we used three approaches for measuring SSA: (i) direct measurement of SSA on a small number of samples using specialized equipment based on the Brunauer, Emmett, and Teller theory (BET); (ii) interpolation of the remainder of the samples based on the BET results obtained in (i); and (iii) measurements of water mass loss after drying soils at 120°C as per Beare et al. (28), described below.
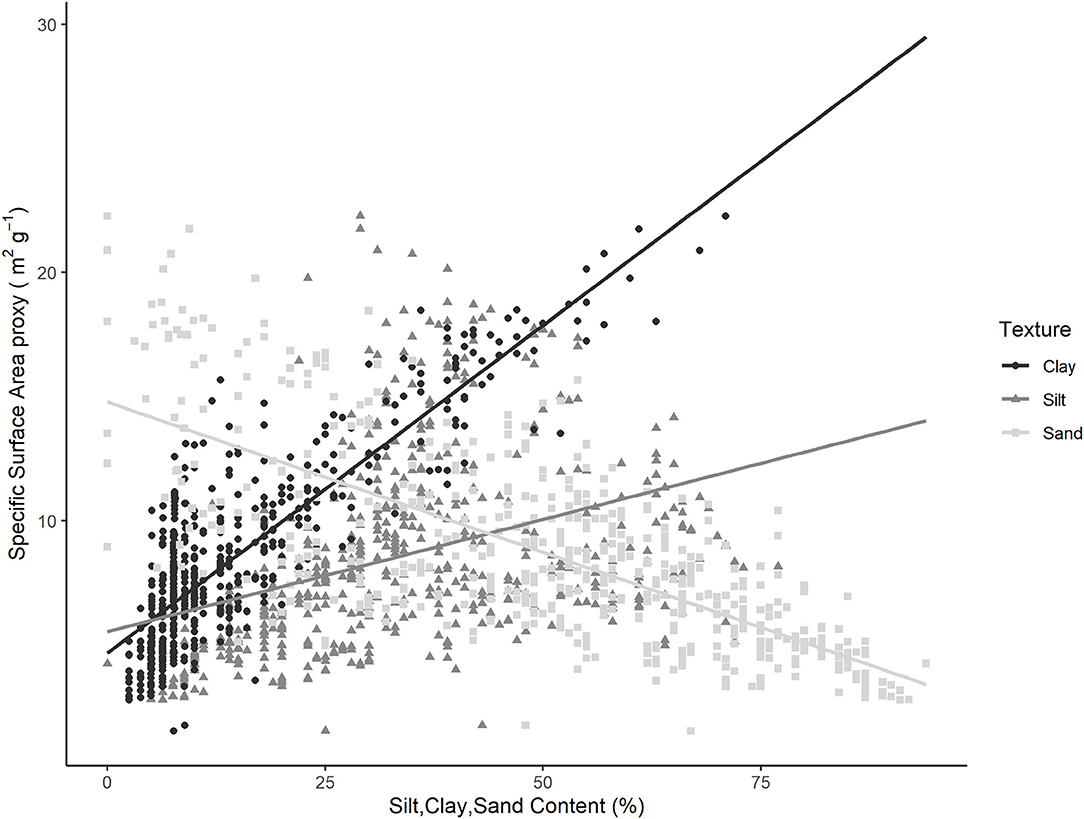
Figure 3. Comparison of SSAproxy (measured using moisture loss as in Equation 2) and soil texture variables for 537 samples collected from orchards, vineyards, and under native vegetation. Each soil sample has three points on the figure: one for Clay % vs. SSAproxy (p <0.001; R2: 0.74), a second for Silt % vs. SSAproxy (p <0.001; R2: 0.14), and a third for Sand % vs. SSAproxy (p <0.001; R2: 0.53).
The BET theory of gas adsorption to solid particles (41) is used to directly measure SSA. Because this technique requires specialized equipment, and is time consuming and expensive to conduct, we selected only 10 samples for direct SSA measurement. The samples were selected across the full textural range of our entire 537 sample dataset, and were analyzed using a TriStar II Plus, surface area and porosity analyser (Micrometrics Instrument Corp, Norcross, GA, USA). We then used a simple trend line of BET (i.e., actual SSA) to interpolate values between measured points to determine SSAinterpolated for the remaining 527 samples when ranked by moisture loss after oven drying (see below).
As a less expensive alternative to the BET method for measuring SSA, the mass of water lost when air-dried soils are oven dried can be used as a reasonable approximation of BET (28). We assessed the utility of this method using sieved (2 mm), air-dried soil samples held at 30°C and 30% humidity for at least 1 week in a controlled environment chamber (Conviron PGCFLEX model; Controlled, Environments Ltd., Winnipeg, MB, Canada), then oven dried at 120°C to a constant mass. We used the difference between the air-dried and oven-dried mass of the soil samples to estimate the mineral surface area available for binding carbon in soils, as was done for Allophanic, Brown, and Recent soils in New Zealand, using the following equation (42):
We then plotted the SSAproxy values against our measured and interpolated values of SSA (which relied on the BET method) and found that Equation (1) greatly overestimated the SSA of the 432 soil fractions in the training set (Supplementary Figure 1 in Supplementary Materials). We therefore calculated a new equation to estimate SSA using the “moisture loss” method for soils in the Okanagan Valley as follows:
Variable Selection
Because SOC is more frequently measured than POC and MAOC in studies of soil C, we performed correlation analyses to determine whether correlates of soil C storage differed among each carbon fraction. In order to determine the strongest predictors of MAOC concentrations across soil types in the Okanagan Valley soils, we used Pearson correlation analyses to examine the relationships among measured soil properties (MAOC; SOC; SSAproxy; POC; % sand, % silt, and % clay; exchangeable Ca, Mg, K, and Na; total N; SIC; mean δ13C composition; C:N ratio; and soil pH) in order to determine the strongest predictors of MAOC, POC, and SOC concentrations (Supplementary Figure 2 in Supplementary Materials). Based on the results of correlation analysis, we parsed the variables down to SOC concentration, SSAproxy, exchangeable Ca, exchangeable K, % clay, % silt, and % sand, %N, C:N ratio, and soil pH (Figure 4). Because soil texture varies among soil groups, “soil group” is autocorrelated with the % sand, % sild, and % clay; thus, “soil group” was not included in the model. Specific surface area proxy and soil texture variables (% clay, % silt, and % sand) were included as indicators of the mineral area available for soil C binding, while exchangeable Ca was selected due to its strong correlation with MAOC in the more neutral soils of the Okanagan Valley (32). While soil pH did not correlate well with current MAOC in our samples, it has previously been identified as an important factor in MAOC storage dynamics in the literature that formed the basis for our modeling approach (28) and variable selection process (32). Exchangeable K, soil C, soil N, and C:N ratio were similarly identified as strong predictors of MAOC stocks in European soils using Random Forest models analogous to those used in this study (16).
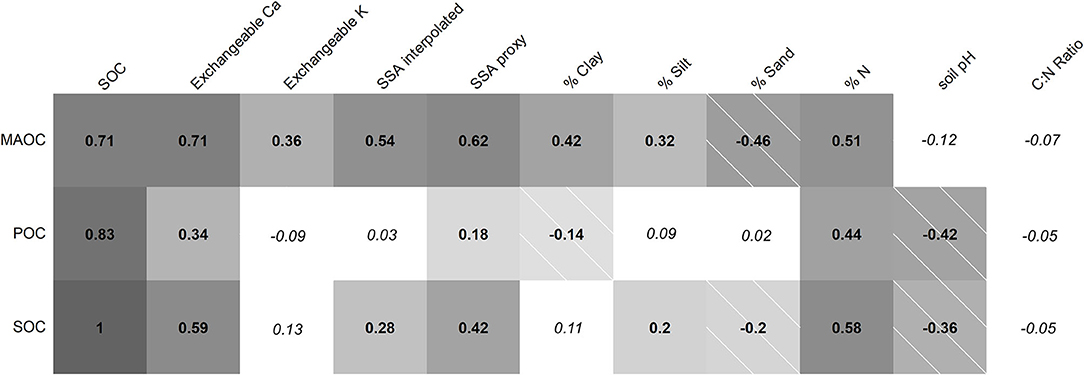
Figure 4. Correlation matrix of soil characteristics measured on the 216 measured samples included in the models and for discussion. Numbers in each cell are the Pearson correlation coefficient between the two variables. Shade intensity is representative of the strength of the correlation, and hashed boxes represent negative correlations. Relationships in white cells with italicized correlation coefficients were not statistically significant (p > 0.05). SSA interpolated values are specific surface area values calculated using the Brunauer, Emmet, and Teller (BET) theory and values interpolated using a best fit line. Mineral associated organic carbon (MAOC) is the C concentration in the <50 μm fraction, while Particulate organic carbon (POC) is the C concentration in the >50 μm fraction. Soil organic carbon (SOC) is the total organic carbon present in the soil sample. Specific surface area proxy (SSAp;roxy) is the mineral surface area as measured using the moisture loss method as in Equation (2).
Model Selection for MAOC Estimation
Two model algorithms were chosen for estimating current MAOC concentrations using the selected variables: stepwise multiple regression with AIC, because of its predominance in generating pedotransfer functions (28); and random forest, a relatively new, non-parametric machine learning approach with the potential to produce more accurate MAOC estimates (16). Given the close relationship between SSAproxy and soil texture found in the literature, we generated two model iterations using either SSAproxy or soil texture in addition to all of the selected variables mentioned above, for each of the two algorithms: (i) stepwise multiple regression with AIC using SSAproxy values but no % clay and % silt; (ii) stepwise multiple regression with AIC using % clay and % silt but no SSAproxy; (iii) random forest algorithm with SSAproxy but no % clay and % silt; and (iv) random forest algorithm with % clay and % silt but no SSAproxy.
Stepwise Multiple Regression With AIC
The data used in the analysis (SOC, exchangeable Ca and K, SSAproxy, % clay, % silt, % sand, % N, soil pH, and C:N ratio) were largely skewed to the right, suggesting that there were few extremely high values in the samples (43). To normalize the data for use with stepwise multiple regression, values were log-transformed (natural log) prior to applying stepwise multiple regression. Akaike's Information Criterion was used to select the best-fit model (29, 44). Stepwise multiple regression with AIC was carried out using the stepAIC package including 10-fold cross validation via the caret package (45, 46) in R version 4.1.1 (47).
Random Forest Modeling
The same data (SOC, exchangeable Ca and K, SSAproxy, % clay, % silt, % sand, % N, soil pH, and C:N ratio) were used to estimate current MAOC via random forest modeling. Random forest models work by combining a large number of regression trees, trained using bootstrap aggregation, to build a robust predictive model that is resistant to noise in the data (48). The randomForest base package was used alongside caret for hyperparameter tuning and R2 determination (mtry) and 10-fold cross validation (46, 47). Model fit was determined from the fitted models via the cross validated R2.
Model Performance
The performance of the models developed to estimate MAOC concentrations were evaluated based on the R2 performance metric, carried out using 10-fold cross validation, for each of the model types. Linear models that compared the estimated MAOC values from each of the four estimation models with the MAOC values measured on the 216-sample subset highlighted the difference in relative performance across the range of MAOC values (Figure 5). The model with the highest model performance metric was selected to estimate the current MAOC concentrations for the 321 samples for which MAOC concentrations had not been directly measured.
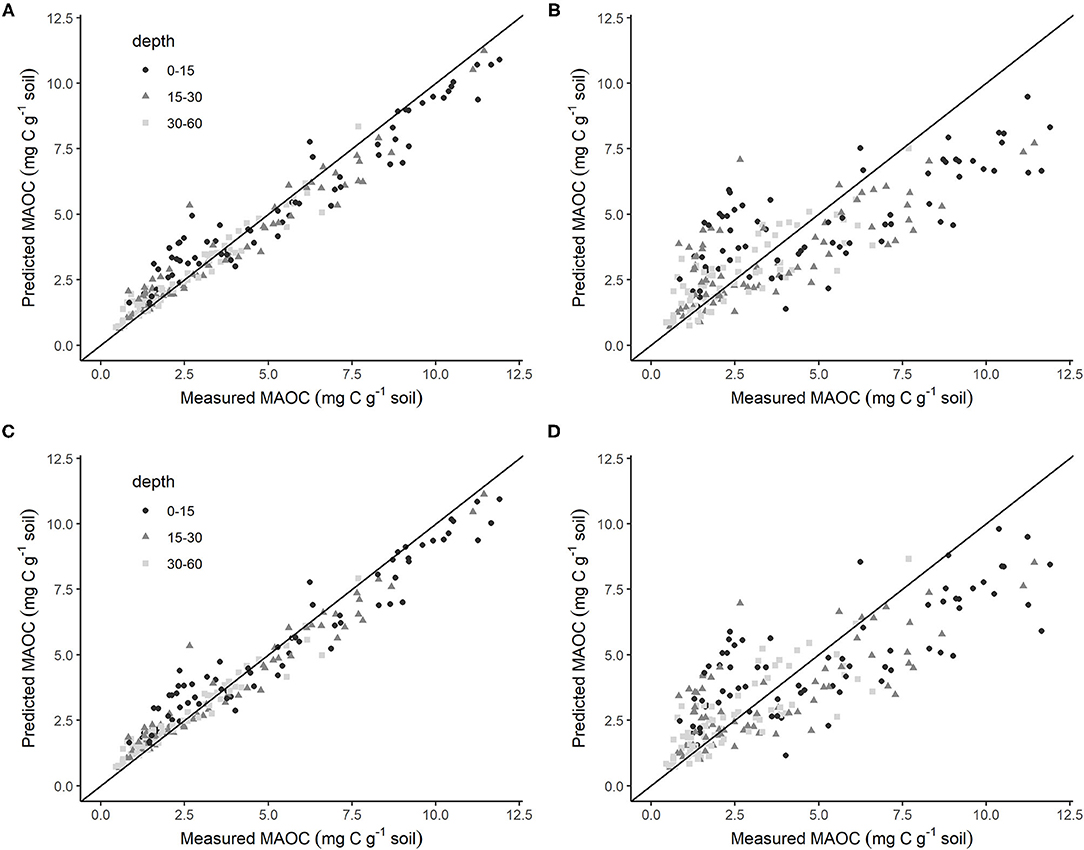
Figure 5. Values of MAOC from predictive models using SSAproxy as the mineral surface area availability metric (A,B), or texture (%clay and %silt) as the mineral surface area availability metric (C,D) plotted against measured MAOC values (C concentration in the <50 μm fraction) on the same 216 samples. (A,C) use Random Forest predictive algorithms (A R2: 0.790; C R2: 0.788) while (B,D) are from Stepwise Multiple Regression with AIC algorithms (B R2: 0.713; D R2: 0.717). The black line shows a 1:1 relationship.
MAOC Deficit Estimation
We estimated MAOC deficits as the difference between current MAOC concentrations and the MAOC formation capacity of each soil sample. Current MAOC concentrations had either been measured directly (216 samples) or estimated as described in Section Model Selection for MAOC Estimation (321 samples).
We used the multivariate quantile regression method described by McNally et al. (29) to estimate the MAOC formation capacity. According to this method, the 90th quantile of current MAOC concentrations was designated as the formation capacity for the entire population of soil samples; 90th quantiles of current MAOC concentration were calculated separately for each of the five soil groups included in the dataset. The carbon deficits were then calculated as the difference between the current measured (or estimated) value of MAOC concentration for each individual sample and the mean 90th quantile of MAOC for all samples within each soil group. Confidence intervals (95%) were calculated using a root mean square approach (29).
MAOC deficits were subsequently compared among soil groups and depths using a two-factor ANOVA with means separation using Tukey's Honestly Significant Difference (Tukey's HSD) test.
Calculating MAOC Stocks and Stock Deficits
MAOC stocks (Mg ha−1) were calculated from MAOC concentrations (g kg−1) using an adjusted soil bulk density value (BD). This adjusted BD value was determined by correcting the whole soil bulk density (7) for the fine fraction portions of the soil in which the MAOC is found. The adjusted BD and the resultant MAOC stock values were therefore calculated as follows:
where MAOCconc. is mineral-associated organic carbon concentration in g kg−1; BDwhole soil is the measured, whole soil bulk density, in g cm−3; BDadjusted is the bulk density adjusted for the silt and clay soil fraction, in g cm−3; t is the thickness of the depth increment (cm), and 0.1 is the conversion factor for Mg ha−1 .
As with MAOC concentrations, MAOC stock (Mg ha−1) formation capacities were calculated using the 90th quantile method, but applied to values of MAOC stock. The MAOC stock deficit was calculated on a per-sample basis as the difference between the MAOC stock upper limit for each soil type, and the current MAOM stock.
Results
Carbon Fractions and Soil Properties
The first step in developing a model to estimate current MAOC concentrations was to determine the most appropriate predictor variables for the soil samples in our dataset. We conducted correlation analyses among the measured MAOC concentrations (determined for 216 of the 537 soil samples collected for the aforementioned Okanagan Valley soil survey) and other variables measured on the same soil samples (see Section Model Selection for MAOC Estimation). Correlation analyses were also conducted for POC and SOC using the same dataset to compare differences in the drivers of soil C storage among each carbon fraction.
Correlations Between Measured MAOC and Other Soil Variables
Mineral-associated organic carbon showed the strongest positive correlations with concentrations of SOC and exchangeable Ca in the whole (unfractionated) soil (Figure 4). Mineral-associated organic carbon also correlated positively with those factors most associated with increased SSA (i.e., SSAinterpolated, SSAproxy, % clay, and % silt) and with exchangeable K and % nitrogen. Mineral-associated organic carbon was negatively correlated with % sand, and was not correlated with soil pH nor C:N ratio.
Correlations Between Measured POC and Other Soil Variables
Storage of soil carbon as MAOC and POC were driven by different soil properties (Figure 4). Other than positive correlations with concentrations of SOC, % N, exchangeable Ca, and SSAproxy in the whole (unfractionated) soil, POC was not positively correlated with the same variables as MAOC. Instead, POC was negatively correlated with soil pH and % clay and showed no relationship with exchangeable K, SSAinterpolated, % silt, % sand, or C:N ratio.
Correlations Between Measured SOC and Other Soil Variables
The concentration of SOC in the whole soil was most strongly positively correlated with exchangeable Ca, SSAproxy, and % N, with weaker (but still positive) correlations with SSAinterpolated and % silt. Soil organic carbon was negatively correlated with % sand and soil pH, and was not related to exchangeable K, % clay, and C:N ratio (Figure 4).
Predicting Current MAOC: Model Comparison
Following the correlation analyses, the variables shown in Figure 4 were then used to generate the four model types outlined in section Section Model Selection for MAOC Estimation, that is: (i) stepwise multiple regression with AIC using SSAproxy values but no % clay and % silt; (ii) stepwise multiple regression with AIC using % clay and % silt but no SSAproxy; (iii) random forest algorithm with SSAproxy but no % clay and % silt; and (iv) random forest algorithm with % clay and % silt but no SSAproxy. Based on comparisons of values of MAOC concentration predicted by the model vs. measured values of MAOC (C concentration in the <50 μm fraction; Section Data Acquisition and Variable Selection), random forest (Figures 5A,C) performed better than stepwise multiple regression with AIC (Figures 5B,D) for estimating MAOC concentrations (Table 1). The random forest model containing SSAproxy as an input variable explained the most variance (R2: 0.790), followed very closely by the random forest containing soil texture as an input variable (R2: 0.788). Variable importance plots identified total SOC, exchangeable Ca, and SSAproxy as the most impactful variables for estimating MAOC (Supplementary Figure 3 in Supplementary Materials).
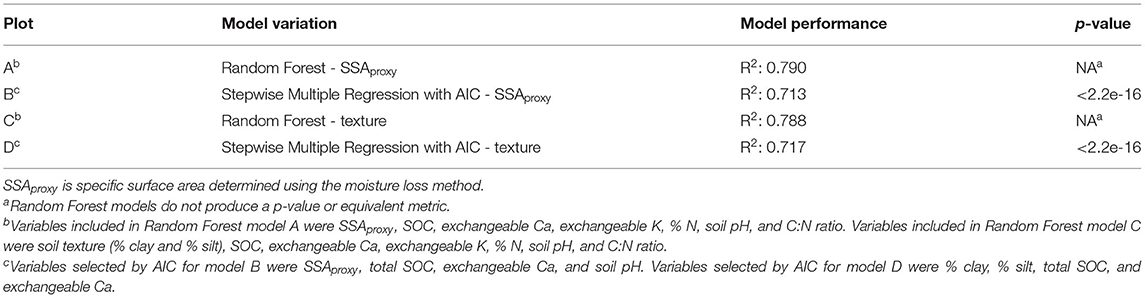
Table 1. Model performance metrics for MAOC estimation.
Like the random forest models, stepwise multiple regression with AIC containing either SSAproxy or soil texture as input variables produced similar results (Figure 5), with R2 of 0.717 using soil texture and 0.713 using SSAproxy data (Table 1). For the model generated using SSAproxy data, variables selected by the best-fit AIC were total SOC, exchangeable Ca, SSAproxy, and soil pH. For the model using soil texture data, variables selected by the best-fit AIC were total SOC, exchangeable Ca, % clay, and % silt. Notably, exchangeable K, total N, and C:N ratio were not selected for either model. While the stepwise multiple regression models showed a greater spread in predicted MAOC values than the random forest models, these models have the advantage of providing coefficients for a simple pedotransfer function. The pedotransfer functions for calculating MAOC, when SOC, exchangeable Ca, clay, and silt concentrations, SSA, and soil pH are known, were produced from the best-fit stepwise multiple regression with AIC for both soil texture (Equation 5) variables and SSAproxy (Equation 6), and are shown in Table 2.
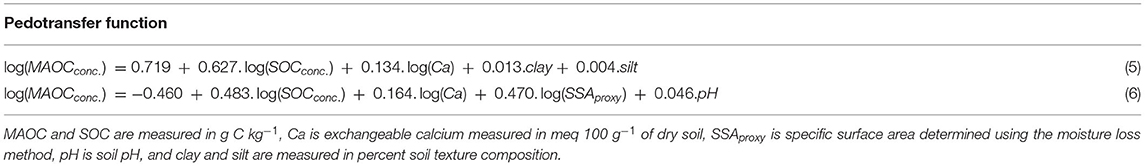
Table 2. Pedotransfer functions produced from best-fit stepwise multiple regression with AIC models using either soil texture variables (% clay and silt; Equation 5) or SSAproxy (Equation 6).
Mineral-Associated Organic Carbon Formation Capacity
Current concentrations of MAOC, as estimated using the random forest model with SSAproxy, were highest in soil samples taken from the top 15 cm of drive row soils in all cropping systems (Supplementary Table 1 in Supplementary Materials). Soils with surficial deposits comprised of clayey glaciolacustrine sediments had the highest capacity for MAOC formation as calculated using the 90th quantile approach (9.9 g kg−1), while those of sandy fluvioglacial deposits had the lowest (5.3 g kg−1) (vertical lines, Figure 6). The remaining three soil groups had MAOC formation capacities of 6.3, 7.1, and 9.0 g kg−1 for soils with surficial deposits comprised of silty glaciolacustrine sediment, morainal deposit, and gravelly fluvioglacial deposit soils, respectively (Figure 6).
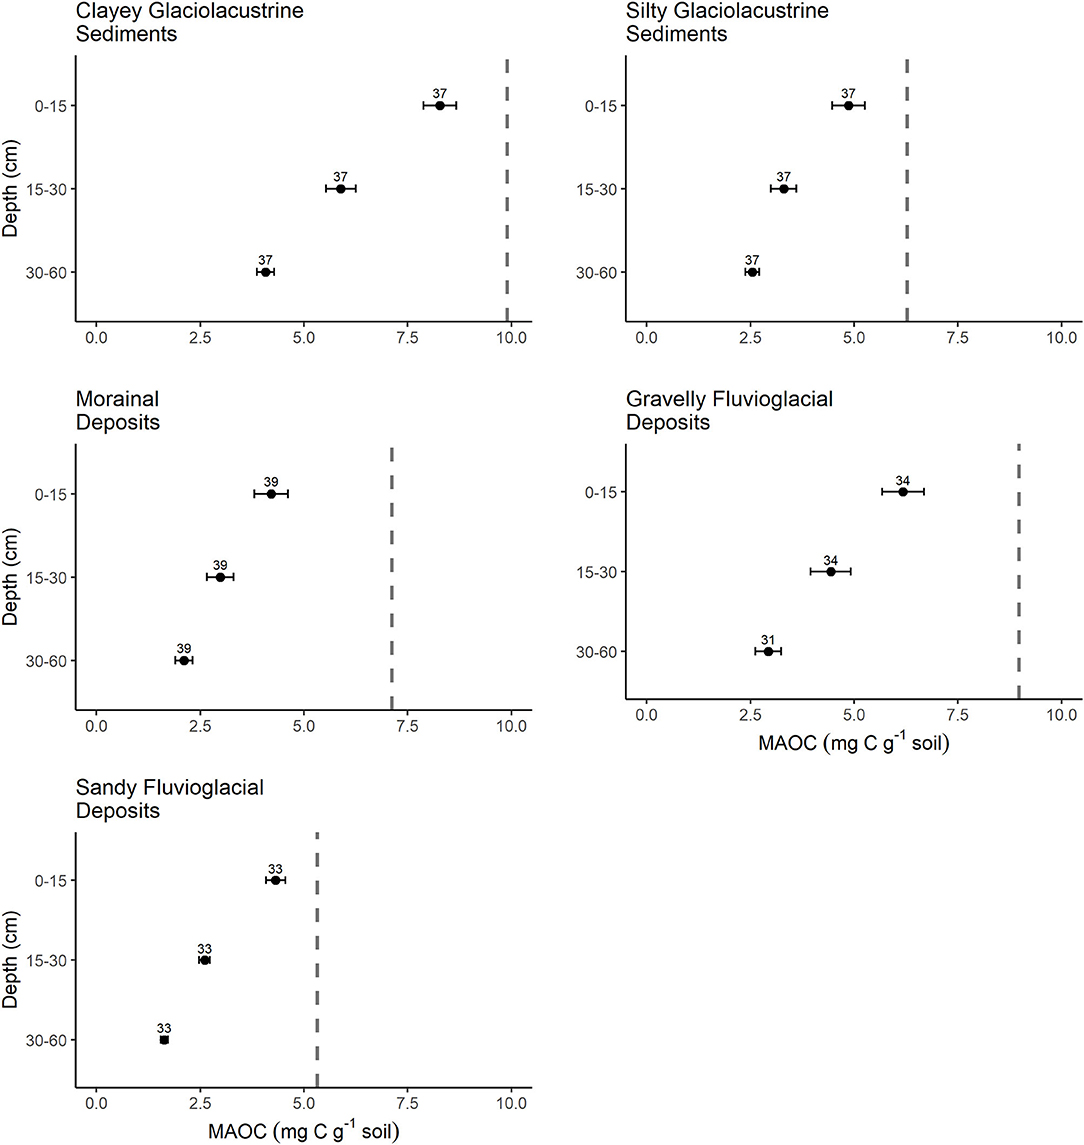
Figure 6. Current MAOC concentration, as determined by MAOC modeling in combination with measured MAOC where available, and MAOC formation capacity as determined using a quantile regression (τ = 0.90) model, separated by soil group and soil depth. Black dots represent the mean MAOC for each soil group and depth, with the number of samples in each group shown above. Bars represent the standard error of the mean. The vertical gray dashed line is the MAOC formation capacity.
Deficits in MAOC: Concentrations
Deficits in MAOC concentration were present in all soil groups (p <0.001), and increased with depth (p <0.001; Supplementary Table 2, Figures 6, 7). Soils derived from clayey glaciolacustrine sediment, showed similar MAOC deficits (1.62 g kg−1 for 0–15 cm, 4.01 g kg−1 for 15–30 cm, and 5.80 g kg−1 for 30–60 cm) to both Morainal Deposit (2.91 g kg−1 for 0–15 cm, 4.14 g kg−1 for 15–30 cm, and 5.02 g kg−1 for 30–60 cm) and Gravelly Fluvioglacial Deposit (2.79 g kg−1 for 0–15 cm, 4.53 g kg−1 for 15–30 cm, and 6.03 g kg−1 for 30–60 cm) derived soils, while soils derived from silty glaciolacustrine sediments and sandy fluvioglacial deposits, showed smaller deficits [silty glaciolacustrine sediments: 1.42 g kg−1 for 0–15 cm, 2.98 g kg−1 for 15–30 cm, and 3.74 g kg−1 for 30–60 cm; sandy fluvioglacial deposits: 1.01 g kg−1 for 0–15 cm, 2.72 g kg−1 for 15–30 cm, and 3.69 g kg−1 for 30–60 cm (Table 3, Supplementary Table 2 in Supplementary Materials)].
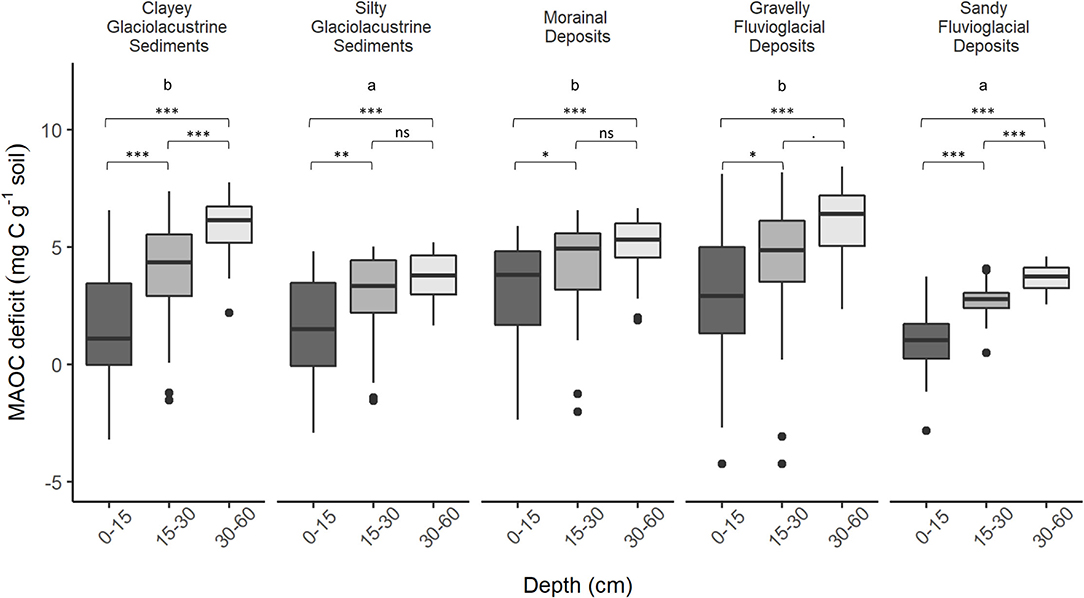
Figure 7. Mineral-associated organic carbon deficits by soil group and depth, calculated as the difference between the MAOC formation capacity estimated using a 90th quantile approach and the current MAOC. Boxes show the 25th to 75th interquartile range, with the median shown as a black bar. Whiskers show the range of data present for each box. Significant differences between samples from different depths within a soil type, determined using ANOVA with means separation using Tukey's Honestly Significant Difference (Tukey's HSD) test are shown above each soil depth combination (ns, not significant; .: p ≤ 0.1; *p ≤ 0.05; **p ≤ 0.01; ***p ≤ 0.001).
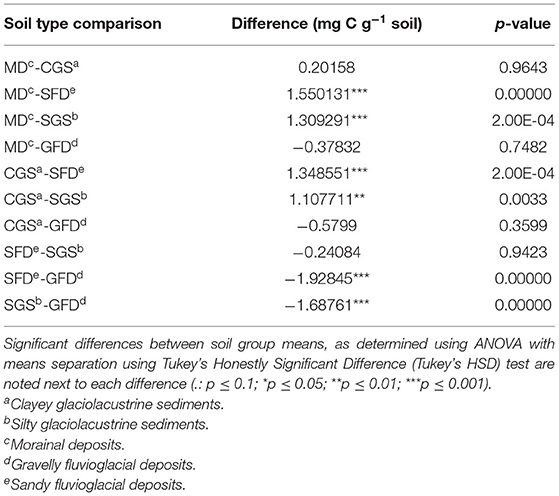
Table 3. Difference in whole profile MAOC values between soil groups.
Deficits in MAOC: Stocks
Bulk density measurements were obtained as per Midwood et al. (7) for only the 0–15 and 15–30 cm depths. Therefore, MAOC stocks (Mg ha−1) and their resulting deficits were calculated only for the upper 30 cm of the soil profiles. Across all soil groups, the current MAOC stock was 11.34 Mg ha−1 on average, for the 0–15 cm depth, and 8.43 Mg ha−1 on average, for the 15–30 cm depth. Across all soil groups, deficits in MAOC stocks were an estimated 1.79 Mg ha−1 for the 0–15 cm depth, and an estimated 3.86 Mg ha−1 for the 15–30 cm depth. When considered across the 8,501 ha of agricultural land represented by these soil groups across the Okanagan Valley, there is currently a MAOC stock of 168,065 Mg C in the upper 30 cm of the soil profile, and a MAOC stock deficit of 48,030 Mg C.
Discussion
Variable Selection
Soil carbon modeling of the whole soil (total SOC) may be less effective than modeling mechanistically distinct soil carbon fractions. For example, our results showed that not only are there often different drivers of total SOC, POM, and MAOC, but that % clay, a well-established factor affecting soil carbon storage, is correlated in the opposite direction for MAOC and POM (Figure 4). For example, % clay in the samples used for this study had a significant positive correlation with MAOC, and a significant negative correlation with POC, such that the overall effect of % clay on total SOC was nearly neutral and not significant. As such, it isn't possible to make any determinations regarding the mechanisms of SOC retention by looking at the correlations between total SOC and these such soil properties. While POC is an important indicator of soil health, from a climate change mitigation standpoint, MAOC offers greater benefits in the form of long term carbon storage in soils.
One of the aims of this study was to provide a framework for estimating MAOC stocks and predicting MAOC deficits that could be applied to soils with a broad range of physico-chemical properties. Selecting variables for inclusion in current MAOC models should be done on a per-soil basis, as soil properties often interact to form the conditions necessary for MAOC storage. For example, the Okanagan Valley soils used in this study developed from glacial outwash and debris left behind by retreating glaciers ~10,000 years ago (49). While arable soils across the globe typically have > 50% of their SOC in the form of MAOC (50, 51), soils in Okanagan Valley orchards and vineyards have relatively low MAOC, averaging only 27% of SOC across all plots. Meanwhile, Wiesmeier et al. (26) estimated that the portion of fine-fraction carbon present in the well-developed soils of cropland, grassland, and forest in Bavaria were 77, 60, and 38%, respectively. This difference may be attributed to the semi-arid climate, low productivity of native plants, and relatively young, therefore lightly weathered, soils (7, 52), and the short period of time during which many of these soils have been actively managed for agriculture (i.e., <70 years). The mineral weathering process is responsible for the development of reactive (clay) surfaces that bind and help protect MAOC from microbial decay, thereby vastly increasing the residence time of soil C (53). It follows that soils with different combinations of soil genesis, soil age, climate, and native vegetation will result in unique physicochemical conditions.
While % clay and SSA are both related to the mineral surface area potentially available for adsorption of fine fraction OM, models utilizing either soil texture or SSA tend to have varying accuracy in different soil types. Nano-scale analyses of OM surfaces; iron- and aluminum-oxides, and exchangeable calcium; as well as mineral surfaces, have highlighted the availability of, and mechanisms behind, mineral adsorption sites (54–57). In acidic soils, aluminum- and iron-oxides play an important role in MAOC formation by forming organo-metal complexes with low molecular weight OM, while in alkaline soils, exchangeable calcium serves a similar function by forming divalent cation bridges (33, 35, 36). This results in uneven adsorption of OM to mineral surfaces, and may partially account for differences in the efficacy of using soil texture vs. SSA in previous fine fraction C deficit modeling. Clay (%) alone cannot account for unevenness in the binding capacity of clays, while SSA can at least partially account for differences in clay mineralogy (54, 58). In fact, while utilization of the SSAproxy (air-dry vs. oven-dry weight) method used here may, strictly speaking, give a less accurate measure of overall fine fraction surface area than direct measurements of SSA obtained via the Brunauer–Emmett–Teller (BET) isotherm, the SSAproxy may more accurately account for the increased water holding capacity of the adsorbed OM (56). If this is the case, then MAOC prediction models for soils with predominantly 1:1 clays, low overall clay content, or low MAOC will likely find that soil texture variables like % clay and % silt serve as well as SSA in predicting MAOC, as we have here.
Because Okanagan Valley soils tend to be more alkaline, Exchangeable Ca plays an important role in MAOC formation; the relationship between MAOC and exchangeable Ca in these soils showed a correlation coefficient of 0.71, which is equivalent to that between MAOC and overall total SOC (Figure 4). Variable importance ranking also showed that exchangeable Ca was the second-most important variable for estimating MAOC in the random forest models [second only to total SOC (Supplementary Figure 3 in Supplementary Materials)]. In addition to cation bridging (59–61), exchangeable calcium plays an important role in SOC accumulation in neutral and alkaline soils via entrapment of occluded SOC in Ca-promoted aggregates (36, 54, 62). Calcium and low molecular weight organic C molecules work with clay minerals to form organo-clay complexes, by which carbon is bound to the edges and surface of clay minerals (60). In addition to the stabilization of carbon due to divalent cation bridging via Ca2+ (63), the prevalence of micropores in clay-rich soils physically protects trapped carbon from microbial interaction (60). The result is that as exchangeable Ca levels increase in soil, MAOC also increases, even if soil conditions favor oxidation of SOM (63).
Prediction of Current MAOC Using Stepwise and Random Forest Models
Measures of SSA can be employed in association with other soil physico-chemical properties (such as exchangeable Ca and soil pH) to accurately estimate current MAOC concentrations in situations where it is not practical or affordable to measure MAOC directly (27, 28, 64). However, the coefficient used to estimate SSA in Beare et al. (28) grossly overestimated the SSA of the younger, coarser-textured soils used here, as measured using BET. We therefore adopted a smaller coefficient, which more closely represented the SSAinterpolated values obtained for these soils (Equation 2). In any case, the patterns of change in SSAproxy and BET-derived SSAinterpolated values were very similar (Supplementary Figure 1 in Supplementary Materials). It follows that in order to accurately approximate the SSA for a given soil using the SSAproxy approach, comparisons with measured SSA values may need to be considered (as we did using the BET method), and the coefficient may need to be individually assessed for soils with divergent physicochemical properties. That being said, when using the resulting calculated SSAproxy value for MAOC estimation, the pattern of change and relative SSAproxy value are what drove model predictions, particularly with non-parametric model types such as Random Forest. As such, the SSAproxy approach to SSA estimation remains appropriate for the purposes of modeling soil parameters impacted by changes in the specific surface area of soils.
A series of four models were created to compare the efficacy of soil texture and SSAproxy to estimate MAOC in perennial cropping systems of the Okanagan Valley, British Columbia, Canada (Figure 5). The two random forest models (one using SSAproxy and one using soil texture) performed equally well (with R2 of ~0.79); the two stepwise multiple regression models (again, one using SSAproxy and one using soil texture) also performed similarly (SSA with R2 of 0.71 and soil texture with R2 of 0.72). These results are in line with previous studies that concluded that the mass proportion of the fine fraction is the most quantitatively important factor in controlling the storage of C in the MAOC fraction (27, 30, 38). However, these results contrast with McNally et al. (29), which concluded that SSAproxy was a much better predictor of MAOC than soil texture. This difference may be due, in part, to factors related to soil genesis and clay characteristics discussed in Section Data Acquisition and Variable Selection.
Mineral-Associated Organic Carbon Formation Capacity
In order to estimate MAOC deficits, both current MAOC and MAOC formation capacity must be known or estimated. While it is possible to experimentally examine the mechanisms behind MAOC storage in soils and to obtain accurate estimates of current MAOC values, it is difficult to determine the mechanisms and values behind the absolute capacity of a soil to stabilize carbon.
Current “saturation” concepts of MAOC storage revolve around the notion that maximum MAOC storage is achieved when there is no more surface area available to bind small molecular weight, microbially processed, carbon (38, 39). However, it has been shown that OM preferentially binds not only to the edges and rougher surfaces of mineral particles, but also to existing MAOC clusters. As such, only a limited portion of clay particles participate in MAOC formation, and a majority of the available mineral surface area is left bare (39). Further, estimation of the maximum capacity for soils to form MAOC necessarily relies on measurements of current MAOC content, which, in turn, is affected by environmental conditions, agronomic practices, and soil physicochemical conditions. The result is that current methods used to estimate the upper limit of MAOC are not measuring an absolute upper limit per se, but rather the capacity for the soil to form MAOC under the current conditions. Therefore, while availability of mineral surface area is undoubtedly an important factor in the formation of MAOC, it is only one of a number of factors that potentially limit the MAOC formation capacity of a given soil.
Mineral-Associated Organic Carbon Deficits in Okanagan Valley Soils
All soil groups in our Okanagan Valley dataset showed mean concentrations of MAOC below the theoretical upper storage limit. Soils with greater % clay, and at greater depths, tended to have greater MAOC deficits. Our models show that MAOC storage capacity increases with increasing clay content (Figure 6). Further, clay content tends to increase with depth (Figure 2), likely due to downward translocation of clay particles as irrigation and rainwater move through the soil profile (6, 65, 66). There also tends to be more MAOC at the surface, due to overall higher SOM via deposition of above ground plant litter, rhizodeposition and root turnover, and organic amendments (19, 67). In particular, the surface soils of the drive row spaces in cherry orchards irrigated with micro-sprinkler irrigation had the highest overall MAOC of all of our cropping systems. This is likely due to the relatively large root systems of the Mazzard rootstock commonly used for cherry trees in the Okanagan Valley, and the similarly large amount of detritus resulting from tree trimmings, grass mowings, etc., left on the undisturbed soils of the drive row spaces (19). The resulting MAOC deficit, therefore, is likely underestimated at the soil surface because there is an underlying assumption that some soils have achieved the maximum possible concentration of MAOC, and even further underestimated at depth, where inputs of plant litter and roots are relatively low while concentrations of clay, due to the downward translocation of clay particles, is relatively high.
While perennial cropping systems in the Okanagan valley already have significantly elevated soil C when compared to adjacent, non-cultivated areas under natural vegetation (7), this research shows that there is still room to store additional soil C as MAOC. Therefore, efforts made toward increasing MAOC in these soils will not go to waste. Hereafter, the challenge is in further optimizing the agricultural management practices already in place to promote further accumulation of MAOC, while not impacting the productivity of the orchards and vineyards. To this end, the drive-row spaces (the unmanaged spaces between crop rows) offer a promising focus. Passive OM inputs from pruning litter, and increased groundcover productivity due to over-spray from crop irrigation sources has inadvertently created spaces where soil C, including MAOC, increases at a rate beyond that of the managed crop rows (19). Actively managing these spaces to further enhance soil C input has the potential to not only increase site-wide MAOC stocks but also positively affect soil characteristics related to soil health and good soil hydrology. Further, by limiting herbicide use on the crop rows, and instead using soil amendments (i.e., organic mulches) or cover crops to limit competitive weed growth, there is the potential to further increase MAOC input, and enhance soil moisture retention in the crop row. Improved water-use efficiency is a critical concern with this semi-arid region, where irrigation is required to maintain crop productivity, and the availability of water is limited. Thus, such changes could simultaneously enhance irrigation water-use efficiency, increase MAOC stocks, and improve agricultural productivity (7, 19).
Limitations of 90th Quantile Deficit Modeling and Specific Surface Area Estimations
Despite having comparatively low % clay and % silt, soils derived from gravelly fluvioglacial deposits showed MAOC deficits comparable to the most clay heavy soils in our dataset. This runs counter to our expectations and highlights both the strength and limitations of determining the MAOC formation capacity using real soil values.
While using real soil measurements to model MAOC formation capacity provides confidence that the formation capacity estimates are within attainable limits, it is also certain to underestimate the true potential MAOC formation capacity of these soils. For the gravelly fluvioglacial deposit derived soils in this study, current MAOC concentrations were quite variable, with a few samples that were very high in MAOC. As a consequence, the estimated MAOC formation capacity for this soil group was also unexpectedly high. Given the low mean current MAOC concentrations for most samples of this gravelly soil, the resultant MAOC deficit is disproportionately large.
Conclusion
As the world's largest terrestrial carbon pool, and one we manage daily for our own food and other resource needs, soils are increasingly recognized as one of our best options for sequestering carbon to combat climate change. Estimating the capacity for soils to stabilize carbon from the atmosphere is the first step in ensuring that climate mitigation efforts are successful in the long term. This study has shown that MAOC for soils under perennial cropping systems, growing on a range of soil types, can be accurately determined by utilizing a random forest model with either SSA (estimated by measuring the mass loss following oven-drying of soil) or the % of clay + silt, alongside concentration of SOC and exchangeable Ca. Furthermore, the stabilization capacity of soils with different surficial deposit types can be estimated using data on current MAOC concentrations and a quantile regression model (τ = 0.90). Not only were there MAOC deficits in all representative soil groups, but soils with greater % clay tended to have both greater MAOC formation capacity and greater MAOC deficits, with the exception of soils derived from gravelly fluvioglacial deposits.
This study provides further insight into the applicability of an established method of determining the stabilization capacity of soils, and highlights the importance of continued research into the mechanisms, and capacity of different soil types to sequester soil carbon over the long term. By providing estimates of MAOC deficits at the soil group level, this approach may be used to help prioritize farmer's efforts for increased carbon capture by calling attention to soils that have the potential to store additional carbon. Further, because MAOC tends to be more persistent, knowing where application of additional OM will increase persistent soil carbon is important to environmental efforts.
Data Availability Statement
The datasets presented in this study can be found in online repositories. The names of the repository/repositories and accession number(s) can be found below: Open Science Framework. https://10.17605/OSF.IO/SEUZX.
Author Contributions
DE, KH, AM, and MJ contributed to conception and design of the study and manuscript revision and editing. AM developed the database used in the study. DE performed the modeling and analysis. DE wrote the full manuscript with guidance from KH, AM, and MJ. All authors contributed to manuscript revision, read, and approved by the submitted version.
Funding
This work was funded by the Agricultural Greenhouse Gases Program of Agriculture and Agri-food Canada (Project AGGP2-25).
Conflict of Interest
DE has been employed with the Johann Heinrich von Thünen Institute, and AM has been employed by Terramera Inc. after submission of the manuscript.
The remaining authors declare that the research was conducted in the absence of any commercial or financial relationships that could be construed as a potential conflict of interest.
Publisher's Note
All claims expressed in this article are solely those of the authors and do not necessarily represent those of their affiliated organizations, or those of the publisher, the editors and the reviewers. Any product that may be evaluated in this article, or claim that may be made by its manufacturer, is not guaranteed or endorsed by the publisher.
Acknowledgments
Thank you to Tirhas Gebretsadikan, Naomi Yamaoka, Sophia Russo, Ieva Zigg, IIka Most, Allyson Dyck, Maya Bandy, Paige Munro, Jadyn Patton, Shawn Kuchta, Istvan Losso, Brayden Jones, Seanna Zintel, Alene Wong, Kat Chen, and Nora Skuridina who helped with the extensive soil sampling and laboratory work, and to the vineyard managers and orchardists who allowed us to take samples from their properties.
Supplementary Material
The Supplementary Material for this article can be found online at: https://www.frontiersin.org/articles/10.3389/fsoil.2022.812249/full#supplementary-material
References
1. Schmidt MWI, Torn MS, Abiven S, Dittmar T, Guggenberger G, Janssens IA, et al. Persistence of soil organic matter as an ecosystem property. Nature. (2011) 478:49–56. doi: 10.1038/nature10386
2. Sanderman J, Hengl T, Fiske GJ. Soil carbon debt of 12,000 years of human land use. Proc Natl Acad Sci USA. (2017)114:9575–80. doi: 10.1073/pnas.1706103114
3. Zomer RJ, Bossio DA, Sommer R, Verchot LV. Global sequestration potential of increased organic carbon in cropland soils. Sci Rep. (2017) 7:15554. doi: 10.1038/s41598-017-15794-8
4. Bai X, Huang Y, Ren W, Coyne M, Jacinthe PA, Tao B, et al. Responses of soil carbon sequestration to climate smart agriculture practices: a meta-analysis. Glob Chang Biol. (2019) 25:14658. doi: 10.1111/gcb.14658
5. Bai Z, Caspari T, Gonzalez MR, Batjes NH, Mäder P, Bünemann EK, et al. Effects of agricultural management practices on soil quality: a review of long-term experiments for Europe and China. Agric Ecosyst Environ. (2018) 265:1–7. doi: 10.1016/j.agee.2018.05.028
6. Emde D, Hannam KD, Most I, Nelson LM, Jones MD. Soil organic carbon in irrigated agricultural systems: a meta-analysis. Glob Chang Biol. (2021) 27:3898–910. doi: 10.1111/gcb.15680
7. Midwood AJ, Hannam KD, Gebretsadikan T, Emde D, Jones MD. Storage of soil carbon as particulate and mineral associated organic matter in irrigated woody perennial crops. Geoderma. (2021) 403:115185. doi: 10.1016/j.geoderma.2021.115185
8. Cabuzel T. Carbon Farming. Avaialble online at: https://ec.europa.eu/clima/policies/forests/carbon-farming_en (accessed July 20, 2021).
9. Service Canada. Net-Zero Emissions by 2050. (2020). Avaialble online at: https://www.canada.ca/en/services/environment/weather/climatechange/climate-plan/net-zero-emissions-2050.html (accessed July 20, 2021).
10. Cambardella CA, Elliott ET. Particulate soil organic-matter changes across a grassland cultivation sequence. Soil Sci Soc Am. (1992) 56:777–83. doi: 10.2136/sssaj1992.03615995005600030017x
11. Cambardella CA, Elliott ET. Methods for physical separation and characterization of soil organic matter fractions. Geoderma. (1993) 56:449–57. doi: 10.1016/B978-0-444-81490-6.50036-4
12. Gregorich EG, Beare MH, McKim UF, Skjemstad JO. Chemical and biological characteristics of physically uncomplexed organic matter. J Soil Sci Soc Am. (2006) 70:975–85. doi: 10.2136/sssaj2005.0116
13. Golchin A, Oades JM, Skjemstad JO, Clarke P. Soil structure and carbon cycling. Austr J Soil Res. (1994) 32:1043–68. doi: 10.1071/SR9941043
14. Golchin A, Oades JM, Skjemstad JO, Clarke P. Study of free and occluded particulate organic matter in soils by solid state 13c CP/MAS NMR spectroscopy and scanning electron microscopy. Austr J Soil Res. (1994) 32:285–309. doi: 10.1071/SR9940285
15. Six J, Conant RT, Paul EA, Paustian K. Stabilization mechanisms of soil organic matter: implications for C-saturation of soils. Plant Soil. (2002) 241:155–76. doi: 10.1023/A:1016125726789
16. Cotrufo MF, Ranalli MG, Haddix ML, Six J, Lugato E. Soil carbon storage informed by particulate and mineral-associated organic matter. Nat Geosci. (2019) 12:989–94. doi: 10.1038/s41561-019-0484-6
17. Lavallee JM, Soong JL, Cotrufo MF. Conceptualizing soil organic matter into particulate and mineral-associated forms to address global change in the 21st century. Glob Chang Biol. (2020) 26:261–73. doi: 10.1111/gcb.14859
18. Poeplau C, Don A, Six J, Kaiser M, Benbi D, Chenu C, et al. Isolating organic carbon fractions with varying turnover rates in temperate agricultural soils – a comprehensive method comparison. Soil Biol Biochem. (2018) 125:10–26. doi: 10.1016/j.soilbio.2018.06.025
19. Midwood AJ, Hannam KD, Forge TA, Neilsen D, Emde D, Jones MD. Importance of drive-row vegetation for soil carbon storage in woody perennial crops: a regional study. Geoderma. (2020) 377:114591. doi: 10.1016/j.geoderma.2020.114591
20. Wander MM, Bidart MG, Aref S. Tillage impacts on depth distribution of total particulate organic matter in three Illinois soils. Soil Sci Soc Am J. (1998) 62:1704–11. doi: 10.2136/sssaj1998.03615995006200060031x
21. Wander MM, Bidart MG. Tillage practice influences on the physical protection, bioavailability and composition of particulate organic matter. Biol Fertil Soils. (2000) 32:360–7. doi: 10.1007/s003740000260
22. Mikutta R, Turner S, Schippers A, Gentsch N, Meyer-Stüve S, Condron LM, et al. Microbial and abiotic controls on mineral-associated organic matter in soil profiles along an ecosystem gradient. Sci Rep. (2019) 9:10294. doi: 10.1038/s41598-019-46501-4
23. Trumbore SE. Potential responses of soil organic carbon to global environmental change. Proc Natl Acad Sci USA. (1997) 94:8284–91. doi: 10.1073/pnas.94.16.8284
24. Benbi DK, Boparai AK, Brar K. Decomposition of particulate organic matter is more sensitive to temperature than the mineral associated organic matter. Soil Biol Biochem. (2014) 70:183–92. doi: 10.1016/j.soilbio.2013.12.032
25. Chen S, Martin MP, Saby NPA, Walter C, Angers DA, Arrouays D. Fine resolution map of top- and subsoil carbon sequestration potential in France. Sci Total Environ. (2018) 630:389–400. doi: 10.1016/j.scitotenv.2018.02.209
26. Wiesmeier M, Hübner R, Spörlein P, Geuß U, Hangen E, Reischl A, et al. Carbon sequestration potential of soils in southeast Germany derived from stable soil organic carbon saturation. Global Change Biol. (2014) 20:653–65. doi: 10.1111/gcb.12384
27. Hassink J. The capacity of soils to preserve organic C and N by their association with clay and silt particles. Plant Soil. (1997) 191:77–87. doi: 10.1023/A:1004213929699
28. Beare MH, McNeill SJ, Curtin D, Parfitt RL, Jones HS, Dodd MB, et al. Estimating the organic carbon stabilisation capacity and saturation deficit of soils: a New Zealand case study. Biogeochemistry. (2014) 120:71–87. doi: 10.1007/s10533-014-9982-1
29. McNally SR, Beare MH, Curtin D, Meenken ED, Kelliher FM, Calvelo Pereira R, et al. Soil carbon sequestration potential of permanent pasture and continuous cropping soils in New Zealand. Glob Chang Biol. (2017) 23:4544–55. doi: 10.1111/gcb.13720
30. Feng W, Plante AF, Six J. Improving estimates of maximal organic carbon stabilization by fine soil particles. Biogeochemistry. (2013) 112:81–93. doi: 10.1007/s10533-011-9679-7
31. Skjemstad JO, Swift RS, McGowan JA. Comparison of the particulate organic carbon and permanganate oxidation methods for estimating labile soil organic carbon. Soil Res. (2006) 44:255–63. doi: 10.1071/SR05124
32. Rasmussen C, Heckman K, Wieder WR, Keiluweit M, Lawrence CR, Berhe AA, et al. Beyond clay: towards an improved set of variables for predicting soil organic matter content. Biogeochemistry. (2018) 137:297–306. doi: 10.1007/s10533-018-0424-3
33. Kaiser K, Guggenberger G. The role of DOM sorption to mineral surfaces in the preservation of organic matter in soils. Org Geochem. (2000) 31:711–25. doi: 10.1016/S0146-6380(00)00046-2
34. Matus F, Amigo X, Kristiansen SM. Aluminium stabilization controls organic carbon levels in Chilean volcanic soils. Geoderma. (2006) 132:158–68. doi: 10.1016/j.geoderma.2005.05.005
35. Mikutta R, Mikutta C, Kalbitz K, Scheel T, Kaiser K, Jahn R. Biodegradation of forest floor organic matter bound to minerals via different binding mechanisms. Geochim Cosmochim Acta. (2007) 71:2569–90. doi: 10.1016/j.gca.2007.03.002
36. Rowley MC, Grand S, Spangenberg JE, Verrecchia EP. Evidence linking calcium to increased organo-mineral association in soils. Biogeochemistry. (2021) 153:223–41. doi: 10.1007/s10533-021-00779-7
37. Matus FJ. Fine silt and clay content is the main factor defining maximal C and N accumulations in soils: a meta-analysis. Sci Rep. (2021) 11:6438. doi: 10.1038/s41598-021-84821-6
38. Angers DA, Arrouays D, Saby NPA, Walter C. Estimating and mapping the carbon saturation deficit of French agricultural topsoils: carbon saturation of French soils. Soil Use Manage. (2011) 27:448–52. doi: 10.1111/j.1475-2743.2011.00366.x
39. Vogel C, Mueller CW, Höschen C, Buegger F, Heister K, Schulz S, et al. Submicron structures provide preferential spots for carbon and nitrogen sequestration in soils. Nat Commun. (2014) 5:2947. doi: 10.1038/ncomms3947
40. Environment Canada. Canadian Climate Normals 1981-2010 Station Data. Environment Canada (2019). Available online at: https://climate.weather.gc.ca/climate_normals/ (accessed August 17, 2021).
41. Brunauer S, Emmett PH, Teller E. Adsorption of gases in multimolecular layers. J Am Chem Soc. (1938) 60:309–19. doi: 10.1021/ja01269a023
42. Parfitt RL, Whitton JS, Theng BKG. Surface reactivity of A horizons towards polar compounds estimated from water adsorption and water content. Soil Res. (2001) 39:1105–10. doi: 10.1071/SR00059
43. Ngailo JA, Vieira SR. Spatial patterns and correlation of soil properties of a lowland soil. J Soil Sci Environ Manag. (2012) 3:287–96. doi: 10.5897/JSSEM11.142
44. Munro P, Forge TA, Jones MD, Nelson LM. Soil biota from newly established orchards are more beneficial to early growth of cherry trees than biota from older orchards. Appl Soil Ecol. (2020) 155:103658. doi: 10.1016/j.apsoil.2020.103658
45. Venables WN, Ripley BD. Modern Applied Statistics With S. Cham: Springer (2002). doi: 10.1007/978-0-387-21706-2
47. R Core Team. R: A Language and Environment for Statistical Computing. Vienna: R Core Team (2020).
49. Fulton RJ. Glacial Lake History, Southern Interior Plateau, British Columbia. Okanagan Valley: Department of Energy, Mines and Resources (1969). doi: 10.4095/106455
50. Christensen BT. Physical fractionation of soil organic matter in primary particle size density separates. In: Stewart BA, editor. Advances in Soil Science: Volume 20. New York, NY: Springer New York (1992). p. 1–90.doi: 10.1007/978-1-4612-2930-8_1
51. Curtin D, Beare MH, Qiu W, Sharp J. Does particulate organic matter fraction meet the criteria for a model soil organic matter pool? Pedosphere. (2019) 29:195–203. doi: 10.1016/S1002-0160(18)60049-9
52. Ross GJ, Hoyt PB, Neilsen GH. Soil chemical and mineralogical changes due to acidification in Okanagan apple orchards. Canad J Soil Sci. (2013) 65:347–55. doi: 10.4141/cjss85-038
53. Trumbore S. Radiocarbon and soil carbon dynamics. Annu Rev Earth Planet Sci. (2009) 37:47–66. doi: 10.1146/annurev.earth.36.031207.124300
54. Boiteau RM, Kukkadapu R, Cliff JB, Smallwood CR, Kovarik L, Wirth MG, et al. Calcareous organic matter coatings sequester siderophores in alkaline soils. Sci Total Environ. (2020) 724:138250. doi: 10.1016/j.scitotenv.2020.138250
55. Gerin PA, Genet MJ, Herbillon AJ, Delvaux B. Surface analysis of soil material by X-ray photoelectron spectroscopy. Eur J Soil Sci. (2003) 54:589–604. doi: 10.1046/j.1365-2389.2003.00537.x
56. Woche SK, Goebel M-O, Mikutta R, Schurig C, Kaestner M, Guggenberger G, et al. Soil wettability can be explained by the chemical composition of particle interfaces - an XPS study. Sci Rep. (2017) 7:42877. doi: 10.1038/srep42877
57. Yuan G, Soma M, Seyama H, Theng BKG, Lavkulich LM, Takamatsu T. Assessing the surface composition of soil particles from some Podzolic soils by X-ray photoelectron spectroscopy. Geoderma. (1998) 86:169–81. doi: 10.1016/S0016-7061(98)00049-4
58. Lehmann J, Kinyangi J, Solomon D. Organic matter stabilization in soil microaggregates: implications from spatial heterogeneity of organic carbon contents and carbon forms. Biogeochemistry. (2007) 85:45–57. doi: 10.1007/s10533-007-9105-3
59. Kalinichev AG, Kirkpatrick RJ. Molecular dynamics simulation of cationic complexation with natural organic matter. Eur J Soil Sci. (2007) 58:909–17. doi: 10.1111/j.1365-2389.2007.00929.x
60. Pennock D, Bedard-Haughn A, Viaud V. Chernozemic soils of Canada: Genesis, distribution, and classification. Can J Soil Sci. (2011) 91:719–47. doi: 10.4141/cjss10022
61. Sutton R, Sposito G, Diallo MS, Schulten H-R. Molecular simulation of a model of dissolved organic matter. Environ Toxicol Chem. (2005) 24:1902–11. doi: 10.1897/04-567R.1
62. Martí-Roura M, Hagedorn F, Rovira P, Romanyà J. Effect of land use and carbonates on organic matter stabilization and microbial communities in Mediterranean soils. Geoderma. (2019) 351:103–15. doi: 10.1016/j.geoderma.2019.05.021
63. Rowley MC, Grand S, Verrecchia ÉP. Calcium-mediated stabilisation of soil organic carbon. Biogeochemistry. (2018) 137:27–49. doi: 10.1007/s10533-017-0410-1
64. Balesdent J, Besnard E, Arrouays D, Chenu C. The dynamics of carbon in particle-size fractions of soil in a forest-cultivation sequence. Plant Soil. (1998) 201:49–57. doi: 10.1023/A:1004337314970
65. Puy A, Garcia Aviles JM, Balbo AL, Keller M, Riedesel S, Blum D, et al. Drip irrigation uptake in traditional irrigated fields: the edaphological impact. J Environ Manage. (2017) 202:550–61. doi: 10.1016/j.jenvman.2016.07.017
66. Xu X, Shi Z, Li D, Rey A, Ruan H, Craine JM, et al. Soil properties control decomposition of soil organic carbon: results from data-assimilation analysis. Geoderma. (2016) 262:235–42. doi: 10.1016/j.geoderma.2015.08.038
Keywords: mineral associated organic C, carbon deficit, soil carbon (C) sequestration potential, soil carbon, carbon stabilization, carbon saturation, perennial crop
Citation: Emde D, Hannam KD, Midwood AJ and Jones MD (2022) Estimating Mineral-Associated Organic Carbon Deficits in Soils of the Okanagan Valley: A Regional Study With Broader Implications. Front. Soil Sci. 2:812249. doi: 10.3389/fsoil.2022.812249
Received: 09 November 2021; Accepted: 10 February 2022;
Published: 22 March 2022.
Edited by:
Rémi Cardinael, Centre de Coopération Internationale en Recherche Agronomique pour le Développement (CIRAD), FranceReviewed by:
Martin Wiesmeier, Technical University of Munich, GermanySongchao Chen, ZJU-Hangzhou Global Scientific and Technological Innovation Center, China
Copyright © 2022 Emde, Hannam, Midwood and Jones. This is an open-access article distributed under the terms of the Creative Commons Attribution License (CC BY). The use, distribution or reproduction in other forums is permitted, provided the original author(s) and the copyright owner(s) are credited and that the original publication in this journal is cited, in accordance with accepted academic practice. No use, distribution or reproduction is permitted which does not comply with these terms.
*Correspondence: David Emde, ZHNlbWRlQGdtYWlsLmNvbQ==
†Present Address: Andrew J. Midwood, Terramera Inc., Vancouver, BC, Canada David Emde, Johann Heinrich von Thünen Institute, Braunschweig, Germany