
95% of researchers rate our articles as excellent or good
Learn more about the work of our research integrity team to safeguard the quality of each article we publish.
Find out more
ORIGINAL RESEARCH article
Front. Soil Sci. , 17 March 2022
Sec. Soil Management
Volume 2 - 2022 | https://doi.org/10.3389/fsoil.2022.803892
This article is part of the Research Topic Sustainable Land Management Practices to Alleviate Land Degradation in Changing Environment View all 4 articles
 Silvio J. Gumiere1*
 Yann Periard2
 Paul Celicourt1
 Thiago Gumiere1
 Jonathan A. Lafond3
 Alain N. Rousseau4
 Jacques Gallichand1
 Jean Caron1
This article proposes an analytical strategy that combines X-ray Computed Tomography (CT) and Continuous Wavelet Transform (CWT) analysis as an alternative solution to long-term experiments that seek to investigate spatiotemporal variations in soil hydraulic properties induced by drainage and recharge cycles. We conducted CT scanning on 100-cm-high column filled with two types of sandy soil in a laboratory environment to simulate, over the period of a month, the equivalent of nearly 40 years of drainage/recharge cycles akin to agricultural fields adopting subirrigation as water management practices. We also monitored soil matric potential, water inflow and outflow, as well as movement of tracers. This later consists in zirconium oxide (ZrO2) that we added to the top 20 cm of each soil column. The results revealed that drainage and recharge cycles greatly affect the evolution of soil hydraulic properties at different locations along the soil profile by reducing drainage and capillary capacities. The approach also allowed us to identify each periodic component of drainage and recharge cycles, and thereby calculate the periodic drift over time. The proposed method can be applied to predict soil evolution according to soil texture, drainage system design and water management, thereby offering a potential basis for proposing mitigation measures related to soil hydrodynamics. It may find its application in agricultural farms adopting subirrigation and surface (e.g., drip) irrigation approaches and, in mining and civil engineering.
Subsurface drainage systems, a commonly used agricultural water management practice, can considerably influence the formation and evolution of soils (1, 2). Subsurface drainage systems alter the frequency of water table fluctuations (drainage and recharge cycles) and soil physicochemical properties (3, 4) including soil pores size distribution (5, 6). The repeated drainage and recharge cycles reduce percolation, induce soil shrinkage, and decrease soil bulk density, as observed in rice paddies (7), soybean fields (2), and for a range of soil types and land use conditions (8). These effects occur over both space and time (9, 10) and intensify alterations of soils under anthropogenic activities (11). An example of such anthropogenic soils is observed in cranberry fields which consist of natural or constructed sandy and peat soils.
The spatiotemporal variability in soil profiles induced by drainage systems is capable of influencing yield and irrigation water use. Gumiere et al. (12) found that: (a) areas of low crop yield are spatially correlated with soil horizons of low saturated hydraulic conductivity, and (b) accounting for spatial variability of soil hydraulic properties holds the potential to reduce irrigation water use by up to 75%, in a highly drained sandy soil under cranberry cultivation. Therefore, the prediction of spatiotemporal variations in soil hydraulic properties under drainage conditions, especially in cranberry fields with subirrigation, is of prime importance.
Assessing spatiotemporal variation in soil hydraulic properties requires laboratory analysis of soil samples in addition to in situ observations (13). However, core sampling may alter soil properties, such as bulk density and pore size distribution, leading to differences between in situ and laboratory measurements of soil water retention and unsaturated hydraulic conductivity (14). Similarly, soil properties may vary rapidly following tillage, a process that standard soil sampling techniques may fail to capture (15). Furthermore, in situ experiments often require extensive and continuous field instrumentation as well as periodical instruments removal to allow agricultural practices (16, 17). The time-consuming and labor-intensive nature of these field operations suggest the need for more convenient and, more importantly, non-destructive techniques to examine soil structures.
Various non-destructive imaging techniques have been proposed as solutions to the abovementionned problems with in situ soil structure analysis. The devices that implement these techniques work by producing signals that contain information on the targeted soil properties that are subsequently inferred using a statistical model. Electrical resistivity tomography can characterize active zones of water uptake (18). Spectral electrical impedance tomography and electrical impedance spectroscopy have been used to characterize and monitor crop root systems (19). Ground-penetrating radar (GPR) can measure soil water content (20). A thorough review of soil imaging methods and their corresponding measurable soil properties can be found in (21).
Among non-destructive techniques, X-ray computed tomography (CT) is acknowledged as a technique to observe and measure soil structure (i.e., shape or type, size) and soil pores characteristics (i.e., quantity, size, location, and shape), and soil rupture resistance (i.e., plasticity, toughness, stickiness, penetration resistance and excavation difficulties). CT has been used for high-resolution monitoring of time-dependent changes in soil properties, such as bulk density, porosity, volumetric water content, and solute transport parameters (22), aggregate characteristics (23), and water characteristic curves (24). A detailed account of X-ray CT technology, and its application in soil science can be found in (25, 26), respectively.
We hypothesized that a combination of imaging (e.g., X-ray CT scanner) and non-imaging in situ sensors (e.g., soil matric potential) can yield time series of the data required to quantify changes in soil drainage and capillary capacities. However, the non-stationary nature of these time series calls for statistical models such as Fourier transforms (FT) and wavelet transforms (WT) (27). Prior studies have suggested that WT are more effective than FT in analyzing non-stationary data as they provide a time-scale representation of the data (27). Therefore, as with the spectral analysis performed by (5), WT can decompose a time series, such as soil matric potential, into its contributing components, i.e., periods of drainage and recharge. Hence, it enables a complete representation of the timings between drainage and recharge events with different frequencies of occurrence.
The main objective of this study was to define a method for analyzing long-term spatiotemporal variability in hydraulic properties of a sandy soil under repeated drainage and recharge cycles without waiting several years before obtaining the results. To this end, soil column experiments were performed to: (a) simulate nearly 40 years of water-table depth variations in sandy soil samples obtained from a cranberry field in Quebec (Canada), through down-scaled and accelerated, drainage and recharge cycles, and (b) assess the soil hydrodynamic response. The proposed strategy aims at anticipating changes in soil hydraulic properties that may occur following the construction of cranberry fields equipped with subsurface drainage systems. It represents an alternative to long-term field experiments and traditional methods for assessing potential spatiotemporal variations in soil hydraulic properties.
At the INRS CT Scanning for Civil Engineering and Natural Resources Laboratory1 (Quebec, Canada), we set up an experiment consisting in four transparent plexiglass soil columns (height: 100 cm, diameter: 15.24 cm—Figure 1A) packed with sand. The percentage of silt and clay were negligible. The columns contained either a fine or medium-coarse sandy soil or the two grades in 20–80% proportions. The soil was added into the columns in 2-cm-thick layers at a uniform bulk density of 1.6 g/cm3. The upper 20 cm of each column was a mixed with zirconium oxide (ZrO2) tracer (5 g of ZrO2 per 100 g of sand). The ZrO2 tracer was used to simulate the movement of finer, but heavier particles compared to sand particles, and consisted of spherical colloidal particles between 0.01 and 10 μm in size, with a median particle size (d50) of 1.5 μm and was considered inert. The ZrO2 particle size distribution is shown in Figure 1B.
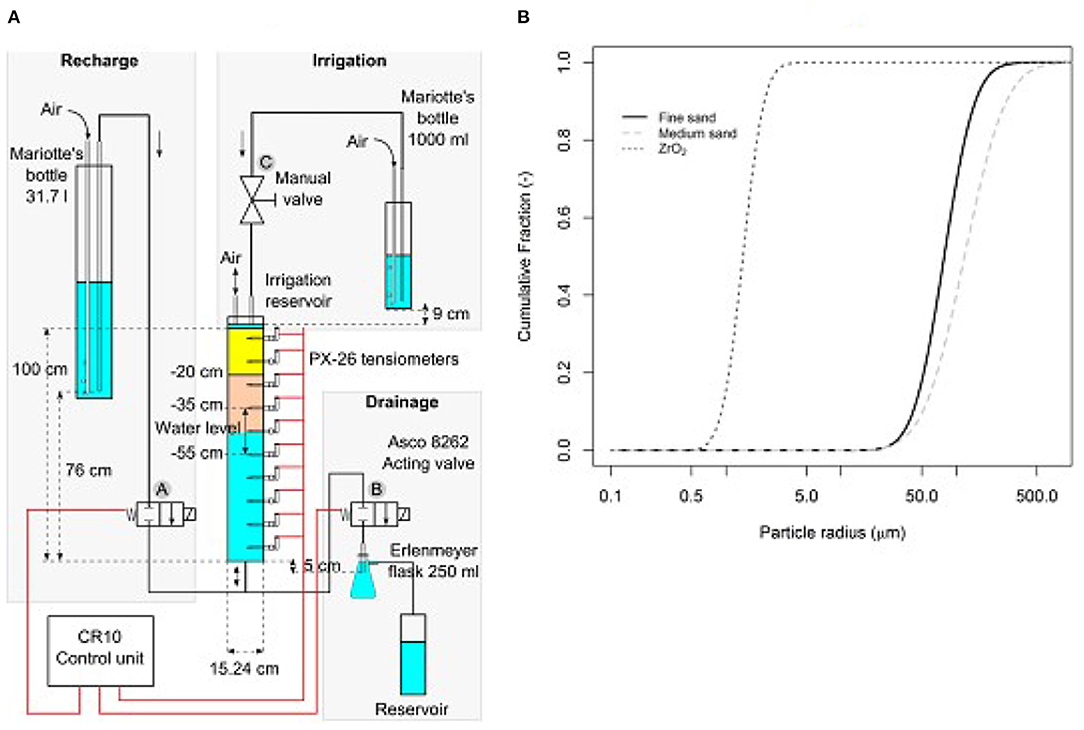
Figure 1. Soil column experiment: (A) setup and control unit, and (B) particle size distributions of the fine and medium-coarse sands and zirconium oxide (ZrO2) used in the columns.
We performed experiments involving four soil profiles:
• Type-1 composed of fine sand only (d50 = 174 μm) and named FS hereafter,
• Type-2 with 20 cm of medium-coarse sand (d50 = 229 μm) on top of 80 cm of fine sand (d50 = 174 μm) and named MCS/FS hereafter,
• Type-3 with 20 cm of fine sand (d50 = 133 μm) on top of 80 cm of medium-coarse sand (d50 = 229 μm) and named FS/MCS hereafter,
• Type-4 composed of medium-coarse sand only (d50 = 229 μm) and named MCS hereafter.
For each column, three types of water flow were simulated by opening or closing three valves (Figure 1A):
• Recharge: automatically activated by a control unit (CR-10, Campbell Scientific; Logan, UT, USA), which opens an acting valve (A) and closes a second valve (B; Asco 8262). A constant head was maintained at 76 cm from the bottom of the column using a Mariotte bottle.
• Drainage (inverse of recharge): automatically occurred when the control unit closes the acting valve (A) and opens the second valve (B) by applying suction with an Erlenmeyer flask positioned at 5 cm below the bottom of the soil column.
• Irrigation: manually triggered by opening a valve (C), which applied a constant head of 9 cm from the top of the column using a Mariotte bottle, and stopped when 6 mm of water was applied. The irrigation mode was activated independently of the recharge and drainage cycles.
Each experiment started with a recharge event that raised the water level in the column to a depth of 35 cm below the soil surface, followed by a drainage event that lowered the water level to a depth of 55 cm. To monitor the water table fluctuations, we installed 10 tensiometers equipped with pressure transducer (PX-26, Omega Engineering Inc., CT, USA) at 10 cm intervals between depths of 5 and 95 cm from the top of each column (Figure 1A). The tensiometers were connected to the control unit; recording average soil matric potential every 5 min. Recharge was automatically activated as soon as the tensiometer installed at 55 cm recorded a value of soil matric potential below zero, indicating that the water table had reached that depth. Similarly, recharge was stopped, and drainage activated as soon as the tensiometer installed at 35 cm recorded a value below zero. The number of recharge and drainage cycles, as well as the start and stop time of drainage and recharge events, were automatically recorded by a CR10 control unit (Campbell Scientific, Logan, UT, USA).
The simulation duration, which is 38.92 years, was determined by measuring soil matric potential time series during a growing season and deducing that a year corresponds to approximately 75 drainage/recharge cycles. We therefore calculated the number of years corresponding to each simulation by dividing the cumulative number of cycles by 75. This approximation is conservative because we considered only the number of cycles during the growing season, which corresponds to the periods of artificial drainage/recharge events in cranberry fields.
The Continuous Wavelet Transform (CWT) of a time series vector y is defined as the convolution of ym with a scaled and translated version of the wavelet function ψ:
where the amplitudes of wavelet representations (given by the complex conjugate ψ*) of the original time series y are scaled and translated along the continuous wavelet scale (s) and discrete localized time index (m). The function ψ must be localized in both time and frequency and have a zero mean to qualify as a wavelet function (28). Here, we used the Morlet wavelet (29), a complex non-orthogonal plane wave (i.e., a wave with equally spaced maxima) modulated by a Gaussian function:
where w0 is the non-dimensional frequency and η is a non-dimensional time parameter. We used w0 = 6 to satisfy the zero-mean condition. CWT analysis is facilitated by a wavelet power spectrum which can be obtained by normalizing the absolute expected value of the Morlet wavelet transform (Wm(s)) with respect to the series variance σ2 over a range of scales:
In using the normalized power spectrum to perform CWT analyses, the longest period for which a trend can be detected depends on the length of the time series. In this study, we applied the CWT to soil matric potential time series recorded by the tensiometer installed at 15 cm below the soil surface. This depth was selected because it is just above the interface between the two soil horizons used in the FS/MCS and MCS/FS columns and corresponds to the bottom of the cranberry root zone (30). Our objective in using the CWT algorithm was to quantify the duration between occurrences of two successive drainage and recharge events. This analysis was performed using the library WaveletComp (31) of the R programming language (32).
The experiments were performed using a Somatum Volume Access CT scanner (Siemens, Munich, Germany). Two energy levels were used, 140 and 120 keV, and the spatial resolution (voxel) was 0.06 × 0.01 × 0.01 cm3 (x, y, z). The CT images were recorded in DICOM V5 format and analyzed using the R programming language (32) with the oro.dicom library (33). The spatiotemporal variations in soil properties were monitored on a weekly basis over a period of 7 weeks. Before each scan, the soil columns were completely saturated through irrigation activation.
Changes in the soil porosity and tracer (ZrO2) concentration can be obtained from the X-ray CT scan data using the following equations (34):
where CZr is the tracer concentration at depth (z); Cs is the solid phase concentration (assumed to be equal to the concentration of quartz) at depth (z); ϕ is the porosity as a function of depth; HUm1 and HUm2 are the absorption coefficients of quartz at energy levels of 140 and 120 keV, respectively, which correspond to 1,798 and 1,886 HU (Hounsfield Units); HUZr1 and HUZr2 are the absorption coefficients of ZrO2 at energy levels of 140 and 120 keV, respectively, which correspond to 14,170 and 16,650 HU; and HU1 and HU2 are the mean absorption coefficients (image slices from the X-ray CT scans of the soil columns) of saturated soil at energy levels of 140 and 120 keV, respectively.
We used the Carnahan–Starling approximation of the near-surface complementary cumulative density function (cdf) for voids [evi(δ, z); (35, 36)] to derive the water retention and unsaturated hydraulic conductivity curves of the soil:
where δ is the particle radius (μm); η (z) is the dimensionless density, which is calculated as 1- ϕ(z); Si is the surface area ratio; m1i is the first moment of the dual lognormal particle size distribution used in this study, and a0i, a1i, and a2i are coefficients corresponding to the moments of the distribution.
The soil matric potential measured at 15 cm with respect to the soil surface for all soil columns used in this study are presented in the upper panels of Figures 2–5. These results show that the soil matric potential oscillates between approximately −40 and −20 cm for FS, FS/MCS, and MCS profiles, and from -50 to -20 cm for the MCS/FS profile. These oscillations reflect the unsaturated conditions of the soil columns and can be attributed to the opening and closing sequences of the recharge and drainage valves. Higher positive values correspond to irrigation and complete recharge events. The results also demonstrate the differences in drainage behavior between homogeneous and heterogeneous soil profiles as well as between coarse-over-fine and fine-over-coarse soil layers as reported by (37, 38).
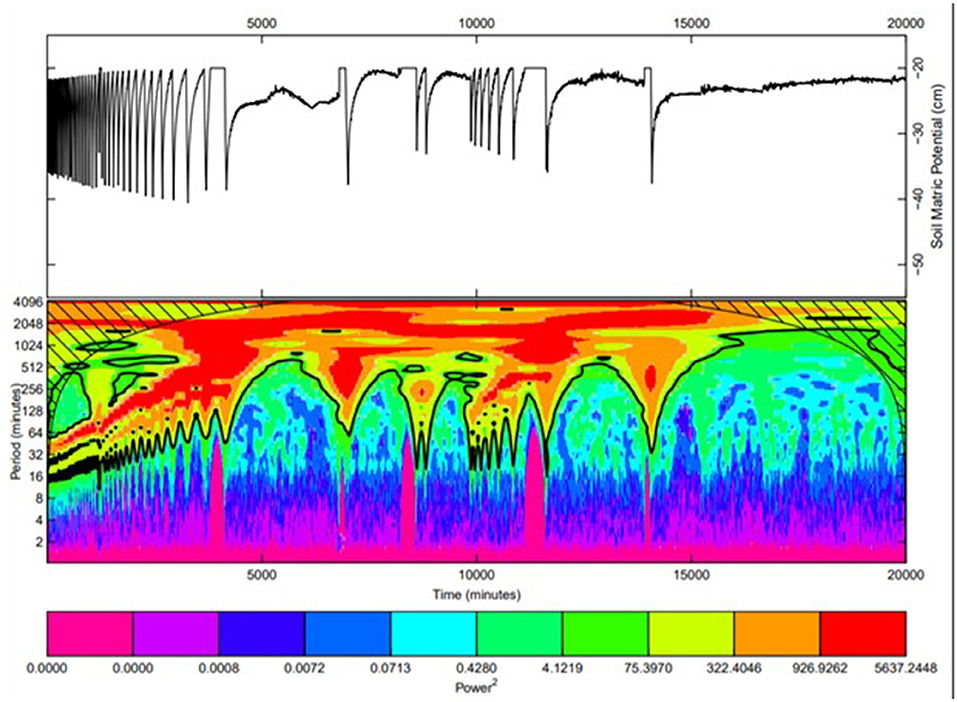
Figure 2. Time series of the soil matric potential at a depth of 15 cm for FS soil profile (upper) and the related wavelet transform (lower).
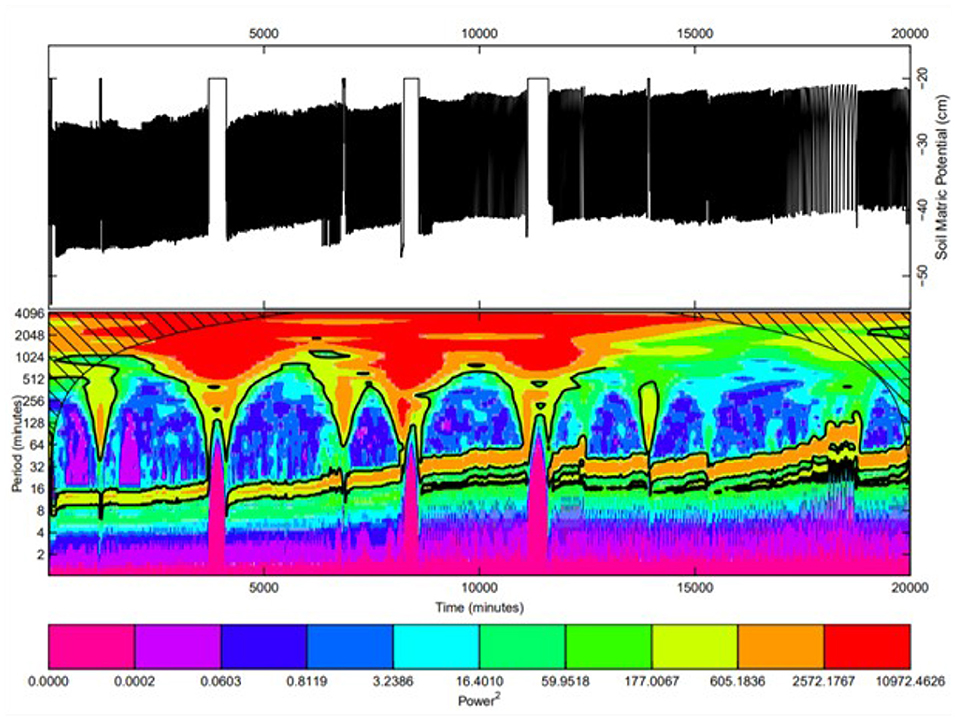
Figure 3. Time series of the soil matric potential at a depth of 15 cm for MCS/FS soil profile (upper) and the related wavelet transform (lower).
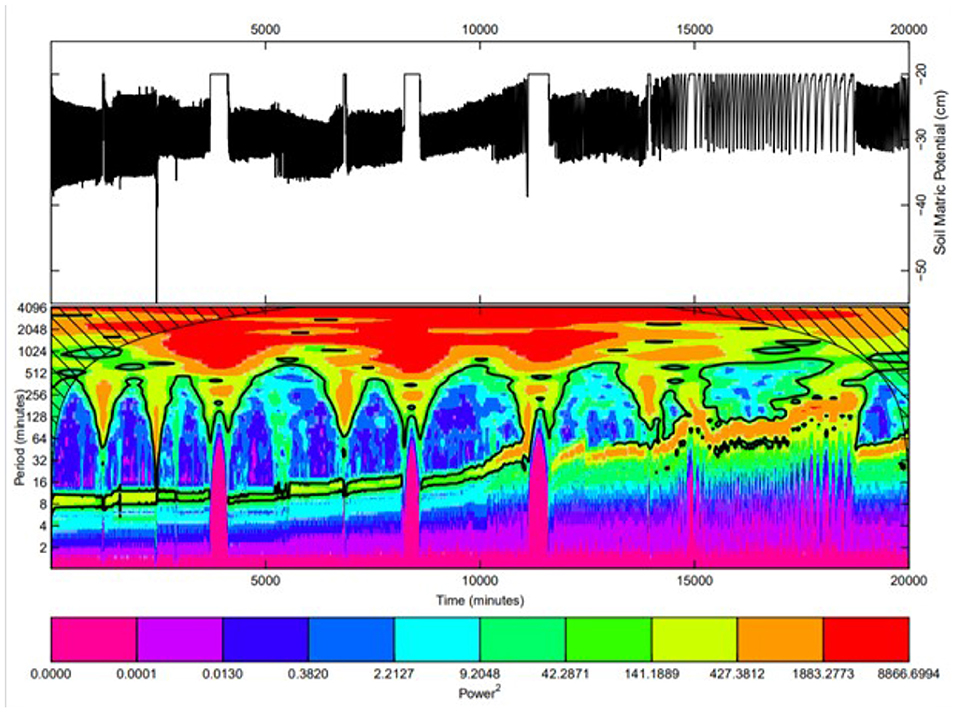
Figure 4. Time series of the soil matric potential at a depth of 15 cm for FS/MCS soil profile (upper) and the related wavelet transform (lower).
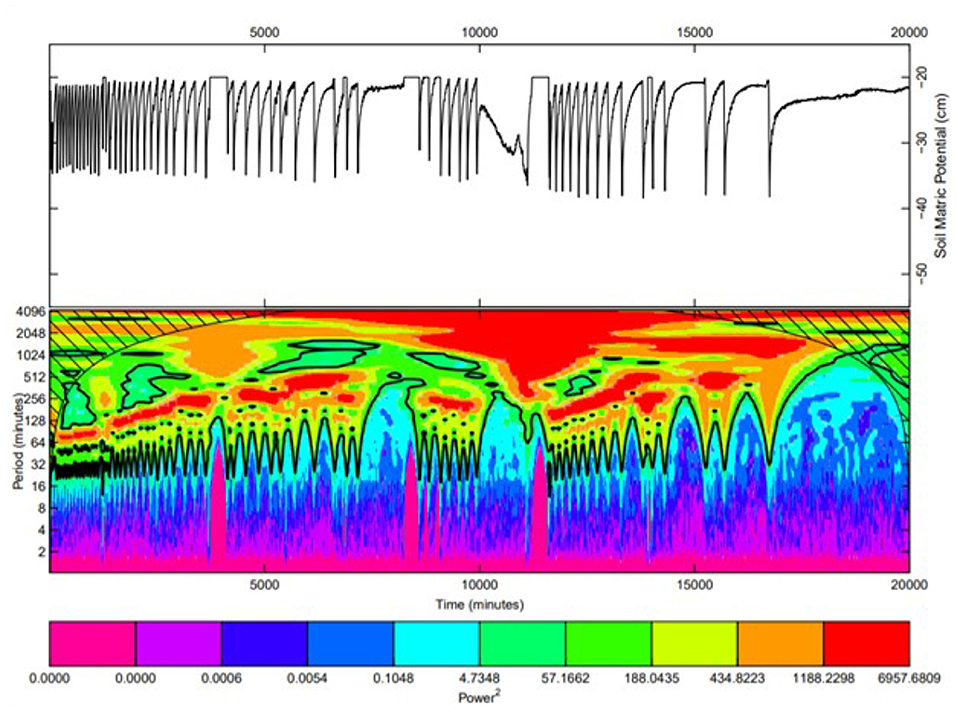
Figure 5. Time series of the soil matric potential at a depth of 15 cm for MCS soil profile (upper) and the related wavelet transform (lower).
The initial oscillation, followed by the stabilization in the time series as shown in Figures 2, 5, reflects rapid changes in soil consolidation occurring in cranberry fields immediately after construction. We were able to reconstruct the original time series from the wavelet transform with a coefficient of determination (R2) close to 0.9; indicating that the wavelet transform was able to adequately reproduce the time evolution of the main oscillating components of the time series.
The resulting wavelet power spectra of the experimental drainage and recharge cycles are presented in the lower panels of Figures 2–5. In these figures, the red band (high wavelet power level) corresponds to the process with the longest wavelet period, i.e., recharge, whereas the blue band (low wavelet power level) corresponds to the process with a series of shorter wavelet periods, i.e., drainage. They reflect the duration of drainage and recharge events.
For all soil profiles, the spectrograms generally show an increase in the periods of the red and blue bands over time, indicating an increase in duration between successive drainage and recharge events. This may be due to the reduction in porosity and to the accumulation of small particles in the pores occurring during water table fluctuations within the soil profiles and they are the governing processes responsible for the increase in duration of drainage and recharge cycles within the soil profiles. Due to the spatial nature of drainage and recharge processes, this increase in duration suggests a spatiotemporal shift toward lower values of soil hydraulic properties; an indication that the proposed method bears the potential to simulate spatiotemporal variations in soil hydraulic properties.
All columns, except the MCS/FS column, present high period shifting. The periodic drift for FS/MCS profile did not change much although FS/MCS soil profiles are prone to the suffusion phenomenon which is an internal erosion of the fine particles through the voids of the coarse ones due to seepage flow.
For the FS and MCS soil profiles, a halt in the cycle duration increase is observed at different points in time (lower panels of Figures 2, 5). This is because it became impossible for the system to reach the minimum and maximum matric potential thresholds beyond these points in time. This implies considerable changes in soil hydraulic properties presumably due to the reduced capillary capacity caused by the particle size discontinuity in these columns, preventing the water table from reaching a matric potential triggering drainage.
Recharge and drainage periodicity, as a function of simulation time, is presented in Figure 6. We observed an increase in the periods between successive drainage and recharge events except for the Type-2 profile (Figure 6B). This behavior may be due to the dynamic characteristics of the soil during its evolution, i.e., the migration of small particles and the reorganization of coarse particles in the soil matrix during recharge and drainage.
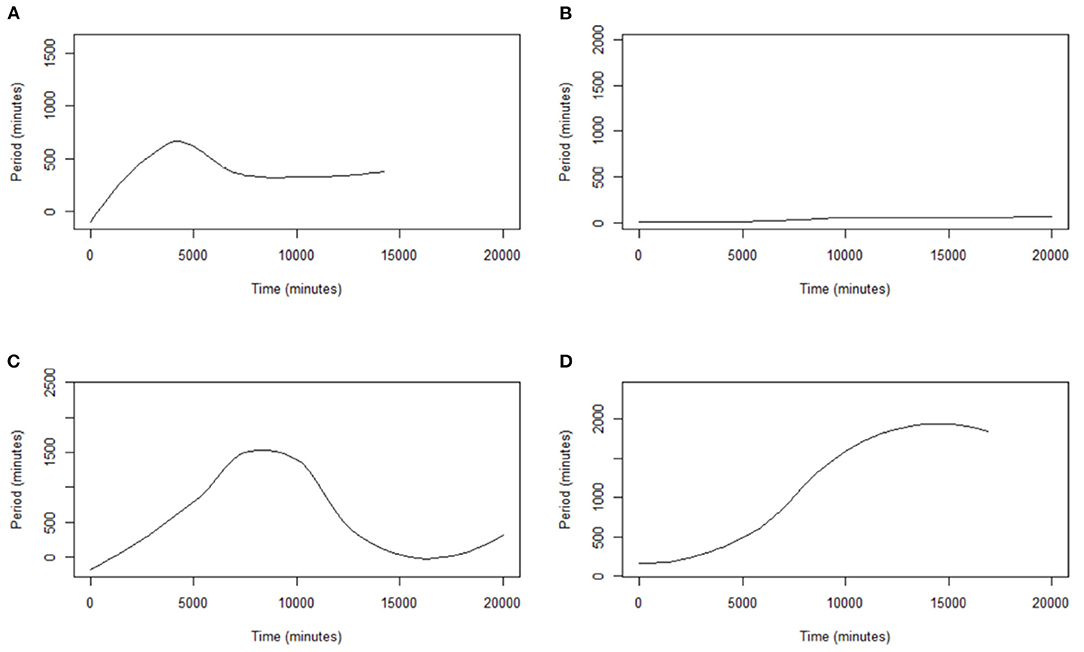
Figure 6. Evolution of the recharge/drainage cycles periodicity as a function of simulation time. The labels (A–D) correspond to FS, MCS/FS, FS/MCS, and MCS soil profiles, respectively.
We present the spatiotemporal variability (weekly) in total porosity (ϕ) and ZrO2 concentration for the soil columns in Figure 7. We observed a reduction in ϕ at the bottom of the sand-ZrO2 layer mix, i.e., at a depth of approximately 20 cm, for MCS/FS and FS/MCS profiles only, but no noticeable reduction below this layer for the other soil profiles. This was probably due to the less intense soil packing at the interface between the two heterogeneous (fine-coarse) layers that composed these two profiles. However, there is a slightly different pattern in total porosity change below the sand-ZrO2 layer between FS and MCS profiles. For instance, there is an increase in ϕ below the interface for the FS profile. These results can be explained by the downward migration of small particles, especially ZrO2. The movement of small particles may have destabilized the soil structure at approximately 20 cm and increased ϕ due to the reorganization of coarse particles. This increase in ϕ is consistent with the increases observed in the size and number of coarse pores during wetting-drying cycles reported by (5).
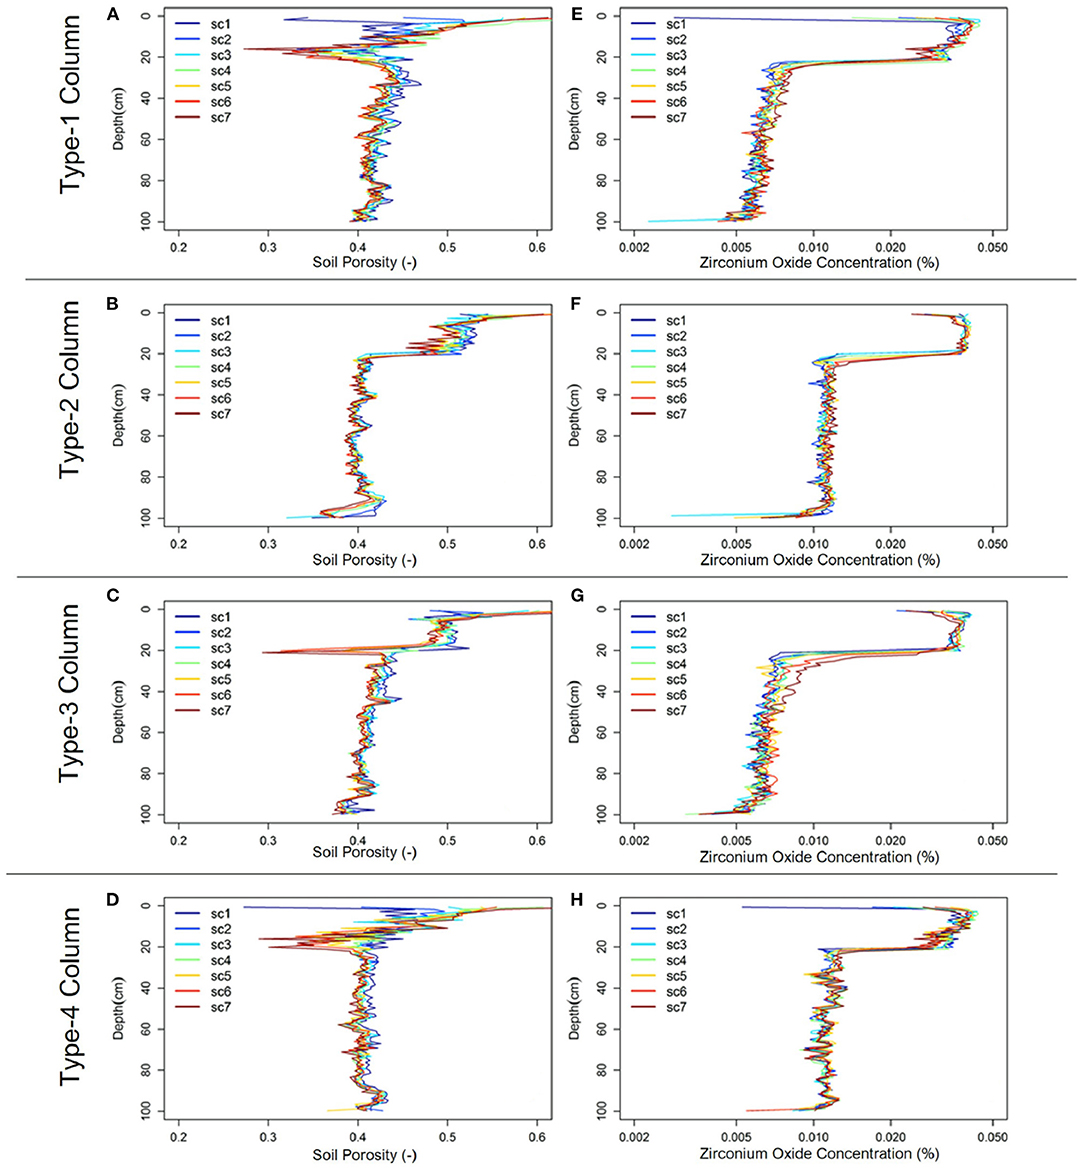
Figure 7. Total porosity (ϕ; A–D) and ZrO2 concentration (%; E–H) profiles for the soil profiles. The symbols sc1 through sc7 represent X-ray CT scan numbers 1–7, respectively.
We observed the migration of small particles in all four soil columns. We noticed that the ZrO2 concentration increased in the upper part of the water table fluctuation zone. It is important to note that before each scan, the soil columns were completely saturated by a recharge event, complemented when necessary with irrigation. Therefore, the upward water flow may have caused upward movement of small ZrO2 particles. Indeed, the ZrO2 particle size distribution was not uniform (Figure 1) and the fine size fraction used in the experiments can be very mobile.
Below the surface horizon (0–20 cm), the ZrO2 concentration profiles were indicative of hyperexponential deposition. This phenomenon is caused by straining and mechanical filtration, which primarily occurs near the outlet source of colloids and at the smallest pores network (39). Considerable downward migration of ZrO2 was observed, and this migration caused the observed increase in the corresponding ZrO2 concentration at depths from approximately 20 cm to the bottom of the column for MCS/FS and MCS profiles. The increase in concentration indicates accumulation that may be attributed to clogging, straining, and attachment to solid soil faces and to the air/water/solid interface (40–42).
Our results corroborate with those of (43, 44), who observed greater compaction under drainage conditions in coarse sand compared to fine sand, due mostly to a low capillary force caused by the presence of large pores. They are also consistent with those of (45), who observed a reduction in the bulk density measured by gamma-ray CT scans during experiments involving wetting–drying cycles. Ma et al. (46) also observed that wetting–drying cycles affect the porosity, mainly by reducing macropores with diameters greater than 100 μm.
For each of the four soil columns, Figure 8 shows the unsaturated hydraulic conductivity curves for drainage (top set of curves) and recharge (bottom set of curves) at the locations that experienced the greatest porosity reductions in the soil profiles. At low soil matric potentials and near-saturation conditions, unsaturated hydraulic conductivity decreased rapidly with increasing matric potential, which is typical of sand. These large changes in unsaturated hydraulic conductivity of the soil columns contributed to modifying the drainage and capillary capacities of the soil, as evidenced by the drops in the periods of drainage and recharge cycles given by the CWT analysis (see for example Figure 3). Furthermore, the pair of curve sets in Figure 8 depicts the effect of the hysteresis phenomenon on the hydraulic behavior of the soil profiles. The results show that hysteresis does not affect the porosity for the studied soil profiles, but is a phenomenon solely dependent on soil moisture and hydraulic conductivity.
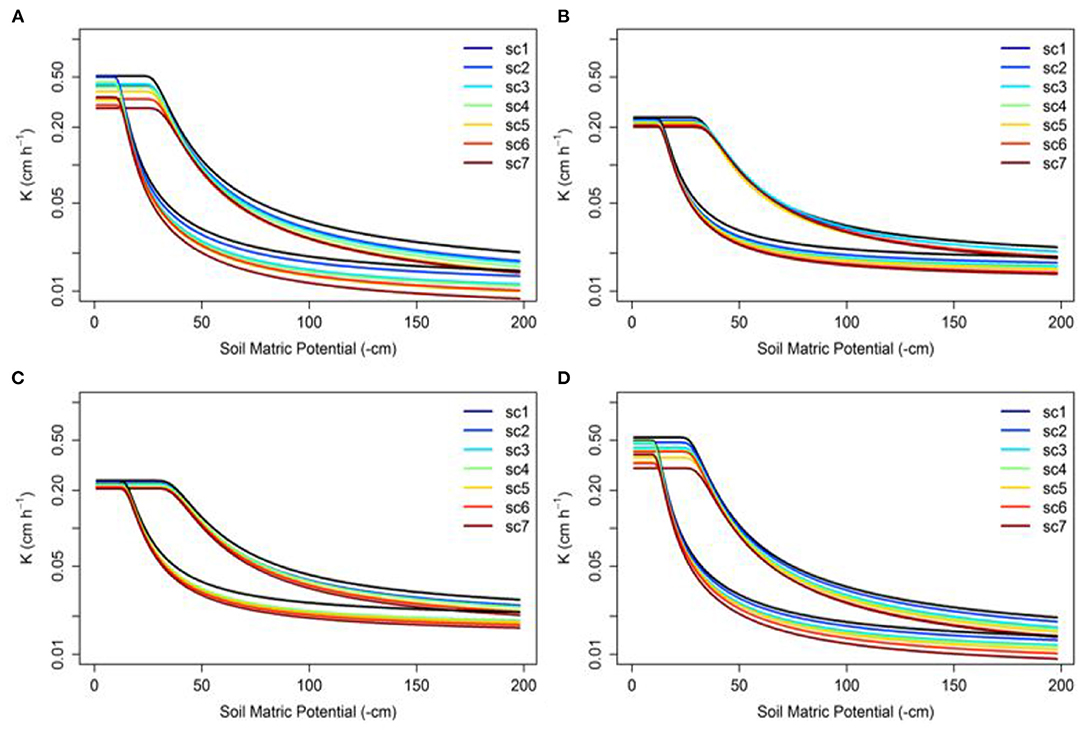
Figure 8. Unsaturated hydraulic conductivity curves as a function of soil matric potential for the soil studied columns for drainage (top set of curves) and recharge (bottom set of curves) water flows at locations that experienced the highest porosity reduction. The labels (A–D) correspond to FS, MCS/FS, FS/MCS, and MCS soil profiles, respectively.
In real-world situations, different factors, including management practices, biological factors, rainfall, soil consolidation or sedimentation, soil disaggregation, drying and wetting processes, initial soil moisture, and erosional and depositional processes, have been identified to explain changes in soil hydraulic conductivity (2). The soil is relatively loose following tillage and irrigation, thus, the first infiltration event for various textured soils is another factor that can also induce strong variations in hydraulic properties based on the soil type and irrigation method (5). The soil gradually compacts during subsequent wetting and drying cycles. For instance, Zeng et al. (47) observed relative rates of change of 0.57 and 0.84 in the saturated hydraulic conductivity (Ksat) of sandy loam under furrow irrigation (2,250–2,700 mm of water) and drip irrigation (675–787 mm of water) after 15 irrigation events, respectively. Our study showed similar results, i.e., a reduction of Ksat over time for all columns except for the Type-2 profile. The water pressure boundary of 9 cm during irrigation and complete saturation is similar to the conditions found in paddy soil (48). In particular, Yoshida et al. (48) and Zhang et al. (49) studied paddy soils and found that the soil drainage capacity is reduced under submerged conditions associated with flooding as a result of diminished hydraulic conductivity and that this reduced drainage is caused mainly by dispersion, flocculation, migration and reorganization of soil particles.
The proposed method did not consider the effects of varying temperatures and pressures and the influence of evaporation; therefore, further work should extend the method to consider these conditions. Also, it should be extended to other soil types and management practices, in addition to research in other types of irrigation methods such as drip irrigation.
The results presented in this article further demonstrate the relevance of CT and CWT in anticipating the spatial variability of anthropogenic-soil properties. However, the typical cost of running the experiments may be a prohibiting factor to widespread application and replication of the proposed method. Fortunately, nowadays, X-ray CT has become more commonplace in the earth sciences for imaging soil samples (25, 26, 50). For instance, recent developments in X-ray microtomography have led to many commercially available and miniaturized desktop CT systems, making CT and even micro-CT (higher spatial resolution typically around 1 μm) accessible to a large number of researchers (51, 52). Furthermore, industrial X-ray CT scanners are typically custom-built (25), which makes it possible to, for example, repurpose a scanning electron microscope into an X-ray microscope-microtomography to generate X-rays for tomographic reconstruction in the micrometer range (51). Such a solution, although somewhat limited by the recording time, may be a very affordable alternative to adequately replicate our experiments. Also, inexpensive and compact CT units may not be able to accommodate the full length of the plexiglass columns used in this study because of their smaller field of view. This limitation may be overcome by applying an appropriate tomographic images stitching strategy as reviewed by (53). A recent example demonstrating the application of such strategies, termed Tomosaic, is presented by (54).
This study has been conducted in a laboratory environment and has not considered a number of real-world factors. These factors include microbial and root effects as well as field interventions that add sand layer to foster rooting, which are hard to simulate. This limitation suggests the need for field-based experimental verification of the computational method over a longer period of time. This is all the more important to verify the effects of raising the water table to much higher levels and the associated speed would have on colloidal particle movement, although the conclusion of this study is consistent with the amount of compaction observed in the field.
We proposed an analysis strategy based on X-ray CT for predicting soil water retention and hydraulic conductivity, particle size distribution, and the CWT of the soil matric potential. The main advantages of the proposed method are its ability to: (i) calculate decreases in porosity and unsaturated hydraulic conductivity for drainage and recharge cycles and small particle concentrations at a high resolution (600 μm); (ii) rapidly conduct analyses relative to traditional long-term field experiments; (iii) simulate years of drainage and recharge cycles; and (iv) identify each component of individual drainage and recharge cycles and calculate the periodic drift in time. The proposed method presents an alternative solution to long-term experiments in the field and traditional methods for determining spatiotemporal variations in soil hydraulic properties. It may allow the evolutionary characteristics of soils to be predicted according to the vertical distribution of particle sizes, drainage system design and water management practices implemented, thereby allowing variations in soil hydrodynamic parameters to be anticipated and possibly controlled.
The method is equally applicable to non-agricultural fields subjected to naturally occurring drainage and recharge cycles. Furthermore, we anticipate a potential application in drip-irrigated fields as the high frequency of the water application under drip irrigation influences soil properties as well. The method is also relevant to the mining industry as wetting and drying cycles influence, for example, the mechanical strength characteristics of coal samples and the microstructure of rock mass. The civil engineering industry is another potential field of application as the strength of waste materials such as clay and fly ash used for developing sustainable construction materials may be impacted by wetting and drying cycles.
The raw data supporting the conclusions of this article will be made available by the authors, without undue reservation.
YP, JL, and SG were responsible for the planning and design of the research work. YP and SG carried out the experiments and data analysis. PC participated in the drafting of the manuscript and interpretation of the results. JL, JG, AR, JC, and TG reviewed and proofread the article. All authors contributed to the article and approved the submitted version.
YP was employed by the company Hortau Inc.
The remaining authors declare that the research was conducted in the absence of any commercial or financial relationships that could be construed as a potential conflict of interest.
All claims expressed in this article are solely those of the authors and do not necessarily represent those of their affiliated organizations, or those of the publisher, the editors and the reviewers. Any product that may be evaluated in this article, or claim that may be made by its manufacturer, is not guaranteed or endorsed by the publisher.
The authors acknowledge the financial contributions of the Natural Sciences and Engineering Research Council of Canada (NSERC) (RCIPJ 411630-08 and RDCPJ 394875-09) and Le Fonds de Recherche du Québec-Nature et Technologies (FRQNT) (166725). They would also like to thank Hortau, Canneberges Bieler, Nature Canneberge, and Transport Gaston Nadeau for their financial and technical support.
1. ^https://inrs.ca/en/research/research-facilities/find-a-research-facilitie/ct-scanning-for-civil-engineering-and-natural-resources-laboratory/
1. Montagne D, Cornu S, Le Forestier L, Hardy M, Josiare O, Caner L, et al. Impact of drainage on soil-forming mechanisms in a French Albeluvisol: input of mineralogical data in mass-balance modelling. Geoderma. (2008) 145:426–38. doi: 10.1016/j.geoderma.2008.02.005
2. Hu W, Shao M, Wang Q, Fan J, Horton R. Temporal changes of soil hydraulic properties under different land uses. Geoderma. (2009) 149:355–66. doi: 10.1016/j.geoderma.2008.12.016
3. Huang LM, Thompson A, Zhang G-L, Chen L-M, Gong Z-T. The use of chronosequences in studies of paddy soil evolution: a review. Geoderma. (2015) 237–238:199–210. doi: 10.1016/j.geoderma.2014.09.007
4. Montagne D, Cornu S, Le Forestier L, Cousin I. Soil drainage as an active agent of recent soil evolution: a review. Pedosphere. (2009) 19:1–13. doi: 10.1016/S1002-0160(08)60078-8
5. Bordner G, Scholl P, Kaul HP. Field quantification of wetting–drying cycles to predict temporal changes of soil pore size distribution. Soil Tillage Res. (2013) 133:1–9. doi: 10.1016/j.still.2013.05.006
6. Mubarak I, Mailhol JC, Angulo-Jaramillo R, Ruelle P, Boivin P, Khaledian M. Temporal variability in soil hydraulic properties under drip irrigation. Geoderma. (2009) 150:158–65. doi: 10.1016/j.geoderma.2009.01.022
7. Zhang ZB, Peng X, Wang LL, Zhao QG, Lin H. Temporal changes in shrinkage behavior of two paddy soils under alternative flooding and drying cycles and its consequence on percolation. Geoderma. (2013) 192:12–20. doi: 10.1016/j.geoderma.2012.08.009
8. Rainer H, Xinhua P, Heiner F, Jose D. Pore rigidity in structured soils—only a theoretical boundary condition for hydraulic properties? Soil Sci Plant Nutr. (2014) 60:3–14. doi: 10.1080/00380768.2014.886159
9. Tang CS, Wang DY, Shi B, Li J. Effect of wetting–drying cycles on profile mechanical behavior of soils with different initial conditions. Catena. (2016) 139:105–16. doi: 10.1016/j.catena.2015.12.015
10. Wang DY, Tang CS, Cui YJ, Shi B, Li J. Effects of wetting–drying cycles on soil strength profile of a silty clay in micro-penetrometer tests. Eng Geol. (2016) 206:60–70. doi: 10.1016/j.enggeo.2016.04.005
11. IUSS Working Group WRB. World Reference Base for Soil Resources 2014. International Soil Classification for Naming Soils and Creating Legends for Soils Maps. FAO, Rome (2014).
12. Gumiere SJ, Lafond JA, Hallema DW, Periard Y, Caron J, Gallichand J. Mapping soil hydraulic conductivity and matric potential for water management of cranberry: characterisation and spatial interpolation methods. Biosyst Eng. (2014) 128:29–40. doi: 10.1016/j.biosystemseng.2014.09.002
13. Bordner G, Scholl P, Loiskandl W, Kaul HP. Environmental and management influences on temporal variability of near saturated soil hydraulic properties. Geoderma. (2013) 204–205:120–9. doi: 10.1016/j.geoderma.2013.04.015
14. Pires LF, Bacchi OOS, Reichardt K. Assessment of soil structure repair due to wetting and drying cycles through 2D tomographic image analysis. Soil Tillage Res. (2007) 94:537–45. doi: 10.1016/j.still.2006.10.008
15. Rab MA, Haling RE, Aarons SR, Hannah M, Young IM, Gibson D. Evaluation of X-ray computed tomography for quantifying macroporosity of loamy pasture soils. Geoderma. (2014) 213:460–70. doi: 10.1016/j.geoderma.2013.08.037
16. Alletto L, Pot V, Giuliano S, Costes M, Perdrieux F, Justes E. Temporal variation in soil physical properties improves the water dynamics modeling in a conventionally-tilled soil. Geoderma. (2015) 243–4:18–28. doi: 10.1016/j.geoderma.2014.12.006
17. Šípek V, Jačka L, Seyedsadr S, Trakal L. Manifestation of spatial and temporal variability of soil hydraulic properties in the uncultivated Fluvisol and performance of hydrological model. Catena. (2019) 182:104119. doi: 10.1016/j.catena.2019.104119
18. Rossi R, Amato M, Bitella G, Bochicchio R, Ferreira Gomes JJ, Lovelli S, et al. Electrical resistivity tomography as a non-destructive method for mapping root biomass in an orchard. Eur J Soil Sci. (2011) 62:206–15. doi: 10.1111/j.1365-2389.2010.01329.x
19. Weigand M, Kemna A. Imaging and functional characterization of crop root systems using spectroscopic electrical impedance measurements. Plant Soil. (2019) 435:201–24. doi: 10.1007/s11104-018-3867-3
20. Jonard F, Mahmoudzadeh M, Roisin C, Weihermuller L, Andre F, Minet J, et al. Characterization of tillage effects on the spatial variation of soil properties using ground-penetrating radar and electromagnetic induction. Geoderma. (2013) 207:310–22. doi: 10.1016/j.geoderma.2013.05.024
21. Hartemink AE, Minasny B. Towards digital soil morphometrics. Geoderma. (2014) 230:305–17. doi: 10.1016/j.geoderma.2014.03.008
22. Helliwell JR, Sturrock CJ, Grayling KM, Tracy SR, Flavel RJ, Young IM, et al. Applications of X-ray computed tomography for examining biophysical interactions and structural development in soil systems: a review. Eur J Soil Sci. (2013) 64:279–97. doi: 10.1111/ejss.12028
23. Garbout A, Munkholm LJ, Hansen SB. Temporal dynamics for soil aggregates determined using X-ray CT scanning. Geoderma. (2013) 204–5:15–22. doi: 10.1016/j.geoderma.2013.04.004
24. Tracy SR, Daly KR, Sturrock CJ, Crout NMJ, Mooney SJ, Roose T. Three-dimensional quantification of soil hydraulic properties using x-ray computed tomography and image-based modeling. Water Resour Res. (2015) 51:1006–22. doi: 10.1002/2014WR016020
25. Ketcham RA, Carlson WD. Acquisition, optimization and interpretation of X-ray computed tomographic imagery: applications to the geosciences. Comput Geosci. (2001) 27:381–400. doi: 10.1016/S0098-3004(00)00116-3
26. Taina IA, Heck RJ, Elliot TR. Application of X-ray computed tomography to soil science: a literature review. Can J Soil Sci. (2008) 88:1–19. doi: 10.4141/CJSS06027
27. Adamowski J, Chan HF. A wavelet neural network conjunction model for groundwater level forecasting. J Hydrol. (2011) 407:28–40. doi: 10.1016/j.jhydrol.2011.06.013
28. Farge M. Wavelet transforms and their applications to turbulence. Annu Rev Fluid Mech. (1992) 24:395–458. doi: 10.1146/annurev.fl.24.010192.002143
29. Bernardino A, Santos-Victor J. A real-time gabor primal sketch for visual attention. In: Iberian Conference on Pattern Recognition and Image Analysis. Berlin; Heidelberg: Springer (2005). p. 335–42. doi: 10.1007/11492429_41
30. Caron J, Pelletier V, Kennedy CD, Gallichand J, Gumiere S, Bonin S, et al. Guidelines of irrigation and drainage management strategies to enhance cranberry production and optimize water use in North America. Can J Soil Sci. (2017) 97:82–91. doi: 10.1139/CJSS-2016-0086
31. Roesch A, Schmidbauer H. WaveletComp: Computational Wavelet Analysis. Quebec, CA: R package version 1.0 (2014). Available online at: https://CRAN.R-project.org/package=WaveletComp (accessed October 02, 2021).
32. R Development Core Team. R: A Language and Environment for Statistical Computing. Vienna: R Foundation for Statistical Computing (2008).
33. Whitcher B, Schmid VJ, Thornton A. Working with the DICOM and NIfTI data standards in R. J Stat Softw. (2011) 44:1–28. doi: 10.18637/jss.v044.i06
34. Rogasik H, Crawford JW, Wendroth O, Young IM, Joschko M, Ritz K. Discrimination of soil phases by dual energy x-ray tomography. Soil Sci Soc Am J. (1999) 63:741–51. doi: 10.2136/sssaj1999.634741x
35. Chan TP, Govindaraju RS. Estimating soil water retention curve from particle-size distribution data based on polydisperse sphere systems. Vadose Zone J. (2004) 3:1443–54. doi: 10.2136/vzj2004.1443
36. Lu BL, Torquato S. Nearest-surface distribution functions for polydispersed particle systems. Phys Rev A. (1992) 45:5530–44. doi: 10.1103/PhysRevA.45.5530
37. Moore ID, Eigel JD. Infiltration into two-layered soil profiles. Trans ASAE. (1981) 24:1496–503. doi: 10.13031/2013.34480
38. Li X, Chang SX, Salifu KF. Soil texture and layering effects on water and salt dynamics in the presence of a water table: a review. Environ Rev. (2014) 22:41–50. doi: 10.1139/er-2013-0035
39. Bradford SA, Simunek J, Bettahar M, van Genuchten MT, Yates SR. Significance of straining in colloid deposition: evidence and implications. Water Resour Res. (2006) 42:W12S15. doi: 10.1029/2005WR004791
40. Mays DC, Hunt JR. Hydrodynamic aspects of particle clogging in porous media. Environ Sci Technol. (2005) 39:577–84. doi: 10.1021/es049367k
41. Bacchin P, Derekx Q, Veyret D, Glucina K, Moulin P. Clogging of microporous channels networks: role of connectivity and tortuosity. Microfluidics Nanofluidics. (2014) 17:85–96. doi: 10.1007/s10404-013-1288-4
42. Shin S, Ault JT, Warren PB, Stone HA. Accumulation of colloidal particles in flow junctions induced by fluid flow and diffusiophoresis. Phys Rev X. (2017) 7:041038. doi: 10.1103/PhysRevX.7.041038
43. Ke K-Y, Tan Y-C, Chen C-H, Chim K-S, Yeh T-CJ. Experimental study of consolidation properties of unsaturated soils during draining. Hydrol Process. (2004) 18:2565–78. doi: 10.1002/hyp.1467
44. Periard Y, Gumiere SJ, Long B, Rousseau AN, Caron J. Use of X-ray CT scan to characterize the evolution of the hydraulic properties of a soil under drainage conditions. Geoderma. (2016) 279:22–30. doi: 10.1016/j.geoderma.2016.05.020
45. Pires LF, Prandel LV, Saab SC. The effect of wetting and drying cycles on soil chemical composition and their impact on bulk density evaluation: an analysis by using XCOM data and gamma-ray computed tomography. Geoderma. (2014) 213:512–20. doi: 10.1016/j.geoderma.2013.09.003
46. Ma R, Cai C, Li Z, Wang J, Xiao T, Peng G, et al. Evaluation of soil aggregate microstructure and stability under wetting and drying cycles in two Ultisols using synchrotron-based X-ray micro-computed tomography. Soil Tillage Res. (2015) 149:1–11. doi: 10.1016/j.still.2014.12.016
47. Zeng C, Wang Q, Zhang F, Zhang J. Temporal changes in soil hydraulic conductivity with different soil types and irrigation methods. Geoderma. (2013) 193–4:290–9. doi: 10.1016/j.geoderma.2012.10.013
48. Yoshida S, Adachi K, Hosokawa H. Analysis of seasonal change in paddy soil structure based on the elasto-plastic deformation model. Geoderma. (2014) 228–9:104–13. doi: 10.1016/j.geoderma.2013.08.002
49. Zhang ZB, Zhou H, Zhao QG, Lin H, Peng X. Characteristics of cracks in two paddy soils and their impacts on preferential flow. Geoderma. (2014) 228–9:114–21. doi: 10.1016/j.geoderma.2013.07.026
50. Cnudde V, Boone MN. High-resolution X-ray computed tomography in geosciences: a review of the current technology and applications. Earth Sci Rev. (2013) 123:1–17. doi: 10.1016/j.earscirev.2013.04.003
51. Sasov A, Van Dyck D. Desktop X-ray microscopy and microtomography. J Microsc. (1998) 191(Pt 2):151–8. doi: 10.1046/j.1365-2818.1998.00367.x
52. Cochard H, Delzon S, Badel E. X-ray microtomography (micro-CT): A reference technology for high-resolution quantification of xylem embolism in trees. Plant Cell Environ. (2015) 38:201–6. doi: 10.1111/pce.12391
53. Kyrieleis A, Ibison M, Titarenko V, Withers PJ. Image stitching strategies for tomographic imaging of large objects at high resolution at synchrotron sources. Nuclear Instrum Methods Phys Res A. (2009) 607:677–84. doi: 10.1016/j.nima.2009.06.030
Keywords: soil hydraulic properties, X-ray CT scanning, soil consolidation, soil compaction, soil particle migration, wavelets
Citation: Gumiere SJ, Periard Y, Celicourt P, Gumiere T, Lafond JA, Rousseau AN, Gallichand J and Caron J (2022) A Computational Method for Modeling Spatiotemporal Variability of Hydrodynamic Properties in Sandy Soil Under Drainage and Recharge. Front. Soil Sci. 2:803892. doi: 10.3389/fsoil.2022.803892
Received: 28 October 2021; Accepted: 07 February 2022;
Published: 17 March 2022.
Edited by:
Xiaodong Gao, Northwest A&F University, ChinaReviewed by:
Hongjie Guan, Beijing Forestry University, ChinaCopyright © 2022 Gumiere, Periard, Celicourt, Gumiere, Lafond, Rousseau, Gallichand and Caron. This is an open-access article distributed under the terms of the Creative Commons Attribution License (CC BY). The use, distribution or reproduction in other forums is permitted, provided the original author(s) and the copyright owner(s) are credited and that the original publication in this journal is cited, in accordance with accepted academic practice. No use, distribution or reproduction is permitted which does not comply with these terms.
*Correspondence: Silvio J. Gumiere, c2lsdmlvLWpvc2UuZ3VtaWVyZUBmc2FhLnVsYXZhbC5jYQ==
Disclaimer: All claims expressed in this article are solely those of the authors and do not necessarily represent those of their affiliated organizations, or those of the publisher, the editors and the reviewers. Any product that may be evaluated in this article or claim that may be made by its manufacturer is not guaranteed or endorsed by the publisher.
Research integrity at Frontiers

Learn more about the work of our research integrity team to safeguard the quality of each article we publish.