 Lucas P. Canisares1,2
 Hanna Poffenbarger2
 Eoin L. Brodie3,4
 Patrick O. Sorensen3
 Ulas Karaoz3
 Daniel M. Villegas5
 Jacobo Arango5
 Letusa Momesso6
 Carlos Alexandre Costa Crusciol6
 Heitor Cantarella1*
- 1Soils and Environmental Resources Center, Agronomic Institute of Campinas, Campinas, Brazil
- 2Department of Plant and Soil Sciences, University of Kentucky, Lexington, KY, United States
- 3Earth and Environmental Sciences Area, Lawrence Berkeley National Laboratory, Berkeley, CA, United States
- 4Department of Environmental Science, Policy and Management, University of California, Berkeley, Berkeley, CA, United States
- 5International Center for Tropical Agriculture (CIAT), Cali, Colombia
- 6College of Agricultural Sciences, São Paulo State University, Botucatu, Brazil
Maize-forage grasses intercropping systems have been increasingly adopted by farmers because of their capacity to recycle nutrients, provide mulch, and add C to soil. However, grasses have been shown to increase nitrous oxide (N2O) emissions. Some tropical grasses cause biological nitrification inhibition (BNI) which could mitigate N2O emissions in the maize cycle but the reactions of the N cycle and the microbial changes that explain the N2O emissions are little known in such intercropping systems. With this in mind, we explored intercropping of forage grasses (Brachiaria brizantha and Brachiaria humidicola) with distinct BNI and yield potential to increase N cycling in no-till maize production systems compared to monocrop with two N rates (0 and 150 kg ha−1) applied during the maize season. These grasses did not strongly compete with maize during the period of maize cycle and did not have a negative effect on grain yield. We observed a legacy of these grasses on N mineralization and nitrification through the soil microbiome during maize growth. We observed that B. humidicola, genotype with higher BNI potential, increased net N mineralization by 0.4 mg N kg−1 day−1 and potential nitrification rates by 1.86 mg NO3-N kg−1 day−1, while B. brizantha increased the soil moisture, fungi diversity, mycorrhizal fungi, and bacterial nitrifiers, and reduced saprotrophs prior to maize growth. Their legacy on soil moisture and cumulative organic inputs (i.e., grass biomass) was strongly associated with enhanced mineralization and nitrification rates at early maize season. These effects contributed to increase cumulative N2O emission by 12.8 and 4.8 mg N2O-N m−2 for maize growing after B. brizantha and B. humidicola, respectively, regardless of the N fertilization rate. Thus, the nitrification inhibition potential of tropical grasses can be outweighed by their impacts on soil moisture, N recycling, and the soil microbiome that together dictate soil N2O fluxes.
Introduction
Agricultural managements that relieve the pressure on deforestation are critical for tropical agriculture and might have global impact on the climate crisis since tropical forests are typically reported as a sink of atmospheric carbon (C). Intercropping maize with tropical grasses have been a common agricultural practice in Brazil (1–3) that increases land use efficiency and spare land for other activities because in this system plants grow almost all year-round (4). In this cropping system, although the forage grass is planted at the same time as maize, their phenology are distinct: maize germinates earlier than the grass and grow faster during the summer, while the forage grass develops slowly (5). After maize is harvested, the forage grass grows unshaded during the fall-winter-spring for 3–7 months, depending on the number of cash crops (crop of economic interest) cultivated in the summer. Typically, forage grasses are included in these systems if maize is the single or second summer cash crop planted in the same growing season. The forage grass is commonly used to feed animals or as a soil cover (mulch) for the next no-till cash crop. The intercropping system does not reduce the grain yield of the crop with economic interest (5), and growing forage grasses in between growing seasons increases land use efficiency (4), improves soil fertility parameters beneficial to the following crop (6) and may also reduce erosion.
Recently, Canisares et al. (1) found that N2O emissions were higher during the maize growing season when brachiarias were included in the system than in the sole maize treatments. Despite the widespread adoption by farmers of the maize-brachiaria cropping systems, there is little information on the N cycle and microbial processes that drive N2O emission in such systems. These intercropping systems may exhibit the benefits of biological nitrification inhibition (BNI) via this tropical forage grass (7). The conversion of B. humidicola grassland to maize has enhances soil N cycling and increased crop nitrogen use efficiency (NUE) when compared with monocropping (8). However, it is unclear whether intercropping systems used in Brazilian maize production can reduce soil nitrification (3, 9). Growing tropical forage grasses in a maize cropping system could impact soil N cycling directly during growth of the tropical grass due to soil N scavenging, root exudation of BNI compounds, and/or stimulation of N mineralization (10, 11) without negative effect on the crop of economic interest (5). Teutscherova et al. (12) showed the same plant genotypes that reduced potential net nitrification rates also had higher root colonization with arbuscular mycorrhizal fungi (AMF) and higher plant root: shoot ratios. Moreover, lower N2O emission and AOB abundance, along with higher abundance of AMF, suggests possible competition for N mineralization products between mycorrizal fungi and ammonium oxidizing organisms (AOO) This tropical forage grass could also impact soil N cycling during its decomposition due to the release of BNI compounds from plant litter or the relative ratio of N immobilization to N mineralization depending on the residue C:N ratio (13). The C:N ratios of the shoot residue may vary with the brachiaria species and growing conditions (1, 14). Thus, inclusion of this tropical forage grass in a cropping system with maize may lead to substantial relative differences in N immobilization vs. mineralization potential due to the residue C:N stoichiometry while chemically slowing soil nitrification through release of BNIs during decomposition (10, 15, 16), which highlights the importance of the whole microbial community to better understand the effect of plants with BNI potential on soil N dynamics (17).
The impact of agricultural management on microbial communities has been explored in many recent studies (18–20), although using management practices to promote beneficial microbial interactions with crops is an ongoing challenge for the sustainable intensification of agriculture (21). Similarly, linking microbial community changes to important soil functions remains a challenge. Garland et al. (22), found a negative correlation between bacterial alpha diversity and soil multifunctionality based on soil parameters related to structure, fertility, and N cycling potential in agricultural soils. Fungal diversity is typically lower in more stable soil environments (i.e., those with less moisture and temperature fluctuation) but higher with high biomass production and is potentially affected by intercropping or cover cropping (23, 24). However, soil biological functional diversity, as opposed to taxonomic diversity, has been associated with ecosystem multifunctionality (25, 26). Thus, beyond the BNI potential of tropical grasses, increasing plant diversity and land use efficiency through intercropping may lead to higher microbial diversity (23, 27) and potentially enhancing soil functioning related to N mineralization (28).
To understand the potential use of an intercropping system to mitigate the N losses from fertilization, we hypothesized that: (i) tropical grasses (B. humidicola and B. brizantha) result in lower potential soil net nitrification due to BNI and lower N2O emission during maize growing season; (ii) B. brizantha increases net mineralization rates, offsetting the benefits of BNI, while B. humidicola reduces mineralization, enhancing the BNI effect; (iii) these species cause different changes on soil microbiome diversity and functional groups related to N cycling.
Materials and Methods
A field experiment was set up in December 2016 and conducted at the same location during three growing seasons: 2016/2017, 2017/2018, and 2018/2019. The present study focused on evaluations made during the 2018/2019 growing season. The field experiment was located at an experimental farm in Botucatu, State of São Paulo (22°49'S 48°25'W) at 740 m of altitude in Brazil. The experimental site is classified as “tropical of altitude” (CWa), which is characterized by dry winters and hot and wet summers, according to Köppen classification (29). The soil is classified as a kaolinitic, thermic Typic Haplorthox (30). Prior to the experiment set up, the soil pH(CaCl2) was 4.8, SOM was 31.7 g dm−3, Presin and S were 23 and 13.4 mg dm−3, Al+3, potential acidity (H+Al+3), K, Ca, Mg, cation exchange capacity were 3.5, 45, 4.7, 25, 12, and 86 mmolc dm−3, base saturation status was 48%, bulk density was 1.4 g cm−3 and sand, silt and clay content were 173, 235, and 592 g kg−1 (31).
The experiment was designed as a split plot randomized complete block design with five replicates. The main plots (4.5 × 30 m) consisted of three cropping systems: [1] maize hybrid 2B587 PW monocropped, [2] maize intercropped with Brachiaria brizantha, or [3] maize intercropped with Brachiaria humidicola cv. Tully. The cropping systems were subjected to two different topdress N fertilization rates, 0 and 150 kg ha−1, in subplots of 4.5 × 15 m (Figure 1).
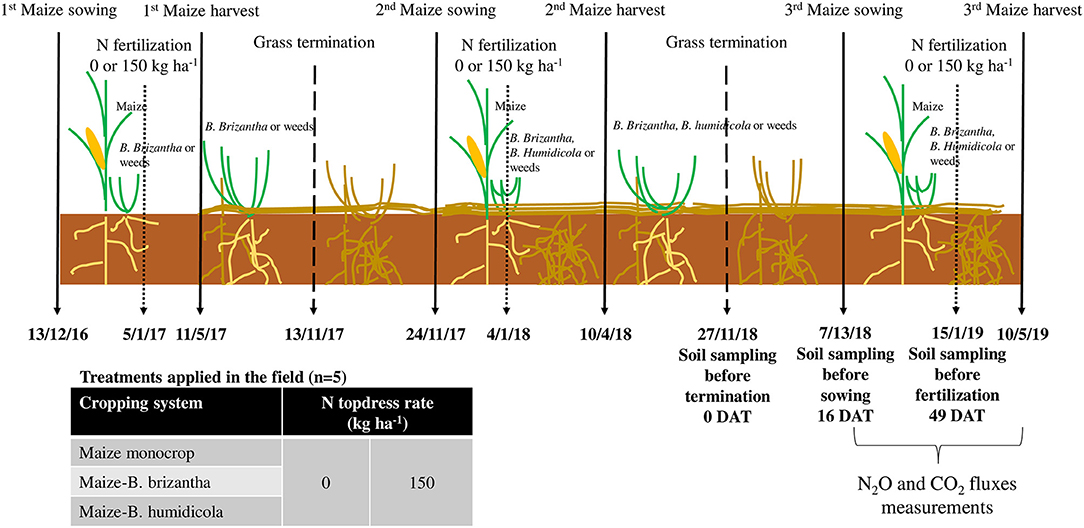
Figure 1. Field experiment timeline. Solid arrows represent the beginning and end of the maize seasons, shorter dashed arrows represent the N fertilization events, and longer dashed arrows represents the end of the grass seasons since the first maize sowing event. Important soil sampling events and the interval of N2O and CO2 measurements are discriminated in the respective date (Day/Month/Year). This study was conducted with data of the 2018/2019 season, which also had the residual effect of treatments applied in the previous seasons.
A fertilization supplying 30, 70, and 50 kg of N, P2O5, and K2O ha−1, respectively, was performed at maize sowing for all plots on three dates (December 13th, 2016; November 24th, 2017; December 13th, 2018). Maize was sown at 3 cm depth to reach a population of 66,000 plants ha−1. During maize sowing, plots receiving the intercropping treatments had seeds of the respective species mixed with fertilizer and band-incorporated 5 cm deep and 5 cm from maize rows aiming to reach a population between 80,000 and 100,000 plants ha−1. The N fertilizer treatments (0 or 150 kg N ha−1) were top-dressed in narrow bands (~0.05 m) ~0.10 m to the side of the maize rows at the V4–V6 stage. B. humidicola did not germinate in the first season (2016/2017) and was replanted in 2017/2018 when maize was seeded. After the maize grain was harvested, B. brizantha (both seasons) and B humidicola (2017/2018) grew unshaded during the fall-spring season and were terminated with herbicides ~1 month before a new maize crop started. Data of grain yield, N cycling and N2O emission in the first two seasons (2016/17 and 2017/18) were reported in Canisares et al. (1). In the two growing seasons (2016/2017 and 2018/2019) previous to the evaluations performed in this study, the only N removed with plant materials from the plots was that of the maize grains that ranged from 45 to 55.9 and from 116.6 to 168.6 kg N ha−1 for plots with 0 and 150 kg ha−1 of N as topdress maize fertilization (1). The B. brizantha accumulated 106 kg N ha−1 more than the plots under fallow during the fall-spring (maize monocrop) (1). The amounts of biomass produced in the first two cycles varied from 8 to 10 t stove ha−1 yr−1 for the fertilized maize, to 4–5 t stove ha−1 yr−1 for non-fertilized maize; the mulch of B. brizantha varied from 6 to 12 t DM ha−1 yr−1 and for B. humidicola was 2.5 t DM ha−1 in the second season as there was no production of this grass in the first year (1). In this study, we present the data from the final year of cultivation (2018/2019), in addition to data about the microbial processes resulting from the cumulative effect of the treatments applied in previous years.
Maize grain was harvested in May 2019, after the grain moisture was below 20%. B. brizantha and B. humidicola grew unshaded after the maize harvest during the fall-winter between maize crops. Twenty-two days before maize sowing on December 13th 2018, all plots were chemically terminated using the combination of 6 and 0.7 L ha−1 glyphosate, N-(phosphonomethyl) glycine, and clethodim, (RS)-2-[(E)-1-[(E)-3-chloroallyloxyimino]propyl]-5-[2-(ethylthio)propyl]-3-hydroxycyclohex-2-enone, respectively. The desiccated brachiarias or the weeds—in the monocrop treatments were maintained on the soil surface and served as mulch for the no-till maize crop.
Weather Conditions
During the first 2 months of maize growth, December 2018 and January 2019, the cumulative precipitations were 91 and 181 mm, 48 and 79% of the historic rains for these months. The precipitation in February, March, and April were 237, 194, and 125 mm, 12, 30 and 99% higher than the historic average for these months (Figure S1A). The total precipitation from December 2018 to April 2019 was 827 mm, 98% of the historic average for these periods, but the lower precipitation observed in December 2018 and January 2019 probably affected the maize yield. The monthly mean air temperature during the same period ranged from 21.8 to 24.8°C while the historic values ranged from 19.3 to 22°C, so the monthly mean air temperature was 0.9–2.8°C higher than the historic average for March and January, respectively (Figure S1B).
Soil Moisture, Inorganic N Content, and pH
Soil samples were collected in each field plot at three time points: just before termination of forage grasses and weeds (0 DAT, November 20, 2018), just before maize sowing (16 DAT, December 7, 2018), and just before maize N fertilization (49 DAT, January 19, 2019) (Figure 1). Composite soil samples comprised soil from 8 sampling locations of the maize interrow of each plot to a depth of 10 cm using an Edelman auger. We measured soil water filled pore space (WFPS), pH, and −content. The WFPS was calculated with the gravimetric water content determined after drying at 105°C and the soil bulk and particle densities. Soil inorganic N (NH4 and NO3) was extracted from fresh soil with KCl (1M) and quantified by steam distillation (32). Soil pH was measured after shaking 10 g of soil with 50 mL of 0.01M CaCl2 for 30 min and waiting for the soil to settle.
Soil Incubations
Potential Net Nitrification Rate (NH4 Surplus)
Potential soil net nitrification rates were assessed on the same soil samples above using an aerated microcosm incubation (10, 15). The soil was air dried (25°C) and sieved (2 mm) prior to the incubation assay. Soil samples (5g) of all treatments were incubated with (NH4)2SO4 (300 mg NH4-N kg−1 of dry soil) in 50 mL amber flasks to ensure that NH4 supply was not limiting for nitrification over the incubation period. This amount of N was expected to be more than enough for more than 7 days even in case of N immobilization since nitrification rates were not expected to exceed 10 mg NO3-N kg−1 day−1 (10, 33). The incubation was performed at 25°C and soil moisture at 60% of water holding capacity. The soil NO3-N was extracted using KCl (1 M) at the beginning and 7 days after starting the incubation and was determined by steam distillation (32). Daily rates of nitrification were calculated by the difference between final and initial NO3-N content divided by the number of incubation days and expressed as mg NO3-N g-soil−1 d−1.
We used a randomized design with four out of five replicates of the field treatments since the variability is lower under temperature and moisture-controlled condition in the laboratory than the observed in the field. As the efficacy of nitrification inhibitors depends on edaphoclimatic conditions, a commercially available nitrification inhibitor, dicyandiamide (DCD), was applied at a rate of 5% of the N to soil as an extra treatment to verify the responsiveness of the soil to nitrification inhibitors using the soil samples from the maize monocrop treatment. In this preliminary test we observed that soil of maize monocrop with DCD had the potential net nitrification rates of 2.29 ± 1.41 mg NO3-N g-soil−1 d−1 while the same soil without DCD resulted in 4.08 ± 2.15 mg NO3-N g-soil−1 d−1, confirming the efficacy of nitrification inhibitors in those edaphoclimatic conditions.
Net N Mineralization
The same soil samples of previous sections were used for the determination of net N mineralization. Five grams of soil from each sample were incubated during 21 days at 20°C and 60% of the water holding capacity. The flasks were randomly arranged with four replicates in an incubation chamber. To best capture the rate of organic N conversion to mineral N, no inorganic N was added to the flasks in this incubation. The net N mineralization rate was the sum of NH4-N and NO3-N, accumulated during 21 days of incubation. The daily rates were calculated by the difference of final and initial inorganic N content divided by incubation days. The inorganic N was extracted with KCl (1M) and quantified by steam distillation (32).
Nitrous Oxide Emissions and Soil Respiration
One static chamber (30 cm diameter) was installed in each field plot to measure nitrous oxide (N2O) and carbon dioxide (CO2) efflux during the 2018/2019 maize growing season (34). The chamber was placed at 5 cm distance from the planted row. Frequent gas sampling (>2 sampling days per week) was undertaken after sowing and N fertilization followed by at least weekly measurements until the end of the maize season (Table S1). The sampling took place between 9:00 and 10:00 am to represent the mean daily gas flux (35). Gases were sampled 0, 15 and 30 minutes after chamber closure and stored in evacuated glass vials protected by a gas-impermeable stopper. The gases were analyzed by gas chromatography (Shimadzu GC-2014), detecting N2O and CO2 concentration by electron capture detector. The gas fluxes were calculated by linear interpolation of concentrations during the sampling period, according with the following equation:
where, F is the efflux (mg C-CO2 m−2 day−1 or μg N2O-N m−2 day−1), is the variation of gases concentration while the chamber was closed (mol−1h−1), V is the volume of the chamber headspace (m3), A is the soil area covered by the chamber (m2), m is the molar mass (g mol−1), and Vm is the molar volume of the chamber (m3 mol−1).
The flux calculated by equation 1 represents the daily gas flux. To calculate the cumulative gas emission, the linear interpolation of measured fluxes on sampling events was used to estimate the flux on non-sampled events (36).
Soil DNA Extraction and Quantification, and Abundance of 16S rDNA and AOA Genes
Soil DNA was extracted from 0.3 g of soil sampled from the 0-10 cm layer of four replicates in the field plots at two contrasting time points, 0 and 49 DAT. The DNA extraction was performed using Qiagen Power soil DNA extraction kit and the DNA was quantified using Qubit fluorometer (Life Technologies, Carlsbad, CA, USA), the total extracted DNA was normalized and expressed in ng g−1 of soil as a proxy for total microbial abundance. The quality of the DNA was measured using NanoDrop 1000 spectrophotometer (NanoDrop Technologies, Montchanin, USA). The bacterial/archaeal 16S rDNA abundance was quantified using primers 515F (5′ -GTGCCAGCMGCCGCGGTAA-3′) and 806R (5′ -GGACTACVSGGGTATCTAAT-3′). Eight nanograms of the DNA samples were diluted in 10 μL of SYBRGreen (2X) 1 μL of the forward and reverse primer and 7 μL of MQ water (Sigma Aldrich) and the abundance of the genes were quantified using real-time PCR with PCR Detection System (Bio-Rad, USA). The thermal conditions were: 1 cycle of 3 min at 95°C for denaturation; 30 cycles of 30 s at 95°C, 45 s at 52°C and 90 s at 72oC for annealing; and 1 cycle of 12 min at 72°C for extension. The qPCR run of DNA samples had a standard curve with serial dilution of known concentration of plasmids measured previous using the Qubit fluorometer (Life Technologies, Carlsbad, CA, USA).
The abundance of ammonia oxidizing archaea (AOA), the group of AOO more sensitive to BNI (37), was quantified by real-time qPCR using the amoA gene as reporter. The total reaction volume was 20 μL, using 10 μL of SYBERGreen (2X), 1 μL for each primer, and 2 μL (10 ng total) of DNA template. The primers combination was amoA19F (5′-ATGGTCTGGCTWAGACG-3′), amoA643R (5′-TCCCACTTWGACCARGCGGCCATCCA-3′) for AOA (38). The amplification conditions of PCR were as follows: 1 cycle of 10 min at 95°C; 40 cycles of 60 s at 95°C for denaturation, 30 s at 55°C for annealing, 45 s at 72°C for extension, and 45 s at 72°C for final extension. The melting curve was generated from 65 to 95°C measuring each 0.2°C and maintained for 1 second.
Soil 16S rRNA Gene and ITS Sequencing
16S rRNA and ITS genes were amplified using PCR. The reaction was prepared using 2.5 μL of PCR buffer (10x), 2 μL of dNTPs mix (2.5 mM), 0.7 of Roche bovine serum albumin (20 mg mL−1), 1 μL of the forward and reverse primers (515F/806R and ITS1F/ITS2R), Takara Hot Start Ex Taq polymerase (5 U μL−1) and 10 ng of DNA samples. The primers were modified to include the forward and reverse adapters for Illumina Nextera and the reverse barcode contained 12-bp Golay barcode (39). The thermo cycler conditions of 16S amplification were: 1 cycle of 3 min at 95°C for denaturation; 30 cycles of 30 s at 95°C, 45 s at 52°C and 90 s at 72°C for annealing; and 1 cycle of 12 min at 72°C for extension. The set up for ITS amplification were: 1 cycle of 3 min at 95°C for denaturation; 30 cycles of 30 s at 95°C, 30 s at 51°C and 30 s at 72°C for annealing; and 1 cycle of 5 min at 72°C for extension. The products of PCR reactions were purified using SPRI bead purification (AMPure XP, Beckman Coulter Genomics, Danvers, MA) and the quality of the amplicons were checked and the average size distribution on Bioanalyzer 2100 with a DNA 7500 chip (Agilent Technologies, Santa Clara, CA). Purified amplicons of 16S and ITS were quantified using Qubit and pooled in two libraries of 16S and ITS at the same concentration (10 ng of each sample). The libraries were sequenced using v3 Illumina MiSeq at the Vincent J. Coates Genomics Sequencing Laboratory at the University of California, Berkeley.
Forward and reverse reads were aligned and paired using usearch [v10.0.240] fastq_mergepairs command (maximum diff = 3) (40). The aligned reads were quality filtered (command fastq_filter with -fastq_trunclen = 250, -fastq_maxee = 0.1), concatenated into a single fasta file, and singletons were removed (command sortbysize with minsize = 2). The resulting aligned and filtered sequences were processed using the DADA2 pipeline (41) to define amplicon sequence variants (ASVs), by first dereplicating the sequences and then denoising unique sequence pairs using the “dada” function with “err=NULL” and “selfConsist=TRUE.” Taxonomy was assigned to each ASV by a Naïve Bayes classifier using the assign_taxonomy. py command in QIIME (42) with reference to the SILVA database accessed from mothur (42). For phylogenetic inference of bacterial and archaeal ASVs, representative sequences for each bacterial OTU were aligned to a SILVA SEED sliced alignment using the PyNAST algorithm (43) and archaeal and bacterial phylogeny was inferred using FastTree (44). All sequence data were submitted to NCBI under BioProject accession number PRJNA746808.
Shoot Forage Grass Biomass and Maize Grain Yield
The shoot biomass of B. brizantha, B. humidicola and weeds (fallow) grown during the fall-winter were sampled from the plots with the respective treatments on November 21st, 2018, at the end of the dry season, using 0.25 m2 quadrants. The shoot biomass was dried at 65°C for 48 h and the dry masses were extrapolated to Mg ha−1. The weeds from plots with both forage grasses were not sampled because visually they covered <5% of the plot area.
Maize grain was harvested from 10 m in each of two central rows in each plot on May 10th, 2019 and weighed at the field moisture content. Grain subsamples of each plot were dried at 105°C for 24 h and the maize grain yield was extrapolated to 1 ha at 13% moisture, which is the standard moisture for maize commercialization in Brazil.
The biomass produced by the forage grasses and maize not harvested as grain was left on the soil surface as mulch for the no-till system. This plant material is expected to gradually decompose and contribute to the stock of soil organic matter (SOM) over the years.
Statistical Analysis
Descriptive statistics were used to obtain the frequency and distribution of data. We evaluated the effect of cropping system (maize monocrop, maize intercropped with B. brizantha and with B. humidicola) and topdress N fertilization (0 and 150 kg N ha−1) on cumulative potential net nitrification rate, net N mineralization, N2O and WFPS by analysis of variance (ANOVA) using the sp.plot function of the agricolae package (45) on the R statistical software (46). For significant factors, individual mean comparisons were performed to compare the cropping systems and the topdress N rate within each cropping system using Tukey's test (p < 0.1 or 0.05) in the same R package.
We performed non-metric dimensional scaling analysis (NMDS) to reduce data dimensionality and to observe the variance of community structure aiming to identify differences between the different treatments. Bray-Curtis distances was used for fungi and weighted-unifrac distances for bacteria. The effect of treatments on bacterial and fungi community was tested by perMANOVA test using the adonis function of R package vegan (47). We used DESeq function on DESeq2 package to identify the taxa with significant difference between pairwise comparisons (mono vs.intercrop and B. brizantha vs. B. humidicola) by calculating the log2foldchanges in relative abundances for each time point, we used the p-value adjusted for multiple comparisons by Storey's Q Value using the qvalue function of the qvalue package (48). We considered organisms that were identified at least at the order level and showed all the significant taxa in a bar plot.
The function estimate_richness from phyloseq package (49) to obtain the Shannon index used as alpha diversity. We used FUNGuild (50) to annotate and classify fungal ASVs into trophic modes and functional guilds such as saprotrophic fungi, taxa with multiple trophic modes (i.e., mixotrophic), diverse types of opportunistic fungal pathogens (e.g., Fusarium), endophytes, symbiotic organisms (i.e., Trichoderma), arbuscular mycorrhizae (AMF, i.e., Glomerales) or ectomycorrhiza (EMF). We performed ANOVA post-hoc Tukey test for alpha diversity and relative abundance of each group of fungi as described for other soil parameters.
A principal component analysis (PCA) was performed using fviz_pca_biplot function from the factoextra package (51), with the ellipses drawn using the Euclidean distance from the centroid of each treatment (interaction of cropping system and maize N topdress fertilization) with 95% confidence level. The PCAs were performed for each time point aiming to address the correlations of N cycling parameters (potential net nitrification rates, net mineralization rates and cumulative N2O emission), soil edaphic factors and microbial groups (soil inorganic N, NH4:NO3 ratio, WFPS, pH, total DNA extracted from soil, the abundances of 16S rDNA and AOA, fungi and bacterial diversity, cumulative respiration, fungi trophic modes and key fungi and bacteria taxa), and plant parameters (forage grass biomass produced during the fall-winter-spring period and the maize grain yield of the subsequent growing season).
Additionally, multiple linear regression was performed to relate proxy measurements of N cycling (potential net nitrification rate, net N mineralization and N2O cumulative emission) using the lm function from R version 3.6.2. To predict the cumulative N2O emission the considered explanatory variables were potential net nitrification rate, net N mineralization, WFPS, pH, and inorganic N pools (NH4 and NO3) sampled 0, 16 and 61 DAT as well as total DNA extracted from the soil and the abundance of 16S rDNA from soil sampled 0 and 61 DAT. The explanatory variables for potential net nitrification rate were net ammonification and nitrification, WFPS, pH, inorganic N pools (NH4 and NO3), total DNA extracted from the soil, and the abundance of 16S rDNA and AOA genes. Prediction of net N mineralization was performed using the following explanatory variables: WFPS, pH, inorganic N pools (NH4 and NO3), total DNA extracted from the soil and the abundance of 16S rDNA. The relative importance of each explanatory variable was calculated by Lindeman-Merenda-Gold using booteval.relimp function in relaimpo package, the 95% confidence intervals were obtained for 1000 iterations.
Results
Maize Grain Yield and Forage Grass Biomass
The present study (2018/19) maize grain yield averaged 3.5 Mg ha−1 across treatments without topdress N fertilization. N application increased maize yield by 125%, but no effect of intercropping system was observed on grain yield (Figure 2).
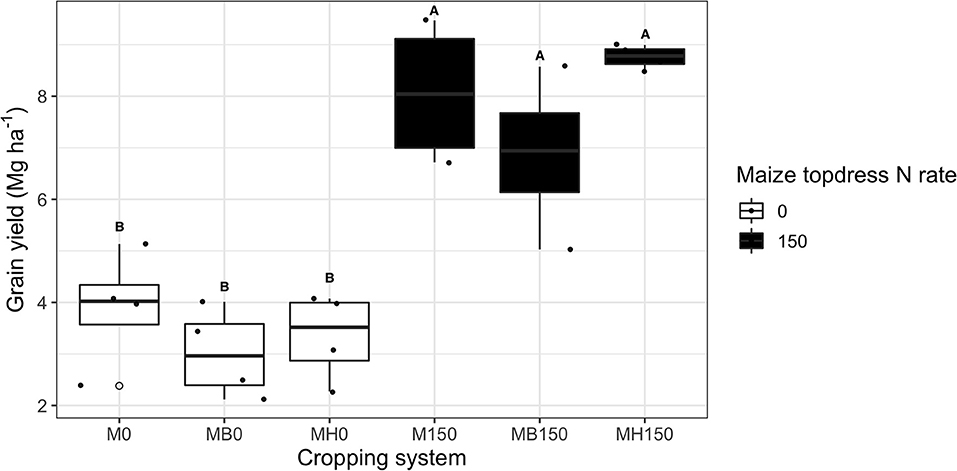
Figure 2. Maize grain yield of growing season 2018–2019 as affected by the cropping system (M: monocrop maize in yellow; MB: maize intercropped with B. brizantha in blue; and MH: B. humidicola in green) represented as the letter label and maize topdress N rate (0 and 150 kg ha−1). Different capital letters represent statistical differences between the interaction of cropping system and N rate (Tukey test, p < 0.05). The full circles represent the actual measurement for each treatment while the empty circle represents the outliers, the horizontal mark on the boxplot represent the median and the bars represent the maximum and minimum values.
Despite the positive effect of topdress N fertilization on maize yield, there was no effect of N addition on biomass of forage grasses and weeds growing after the maize harvest. The highest biomass dry matter yields was observed for B. brizantha (6.6 ± 2.4 Mg ha−1); B. humidicola accumulated on average 1 Mg ha−1 more biomass than weeds growing under fallow plots after maize monocrop (Figure 3).
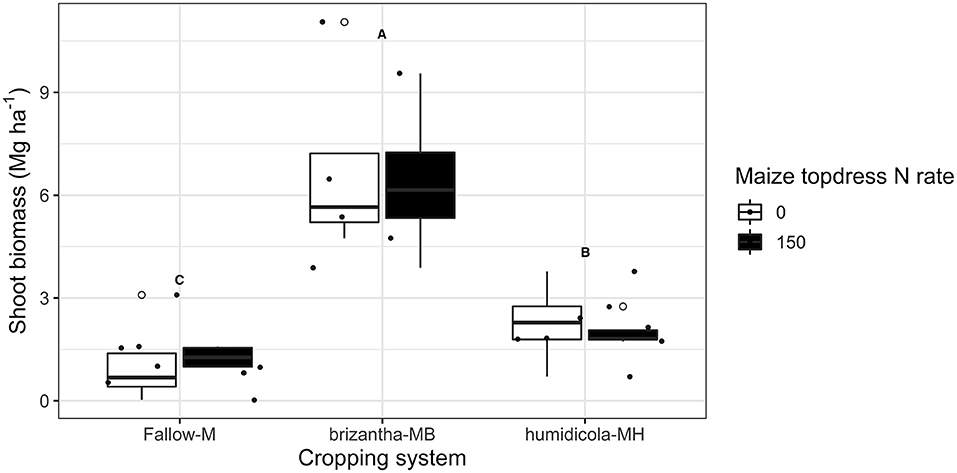
Figure 3. Grasses and weeds shoot biomass produced during 2018 fall-winter-spring as affected by the cropping system (Fallow-M: maize monocrop; brizantha – MB: maize intercropped with B. brizantha; and humidicola-MH: maize intercropped with B. humidicola) and maize topdress N rate (0 and 150 kg ha−1). Different capital letters represent statistical differences between the soil cover treatments (Tukey test, p < 0.05). The full circles represent the actual measurement for each treatment while the empty circle represents the outliers, the horizontal mark on the boxplot represent the median and the bars represent the maximum and minimum values.
Soil Parameters Related to N Availability and Losses
Averaged across N rates, B. humidicola, which had relatively low shoot biomass yield (Figure 3), increased the potential net nitrification rates before termination (0 DAT) by 1.86 mg NO3-N kg−1 day−1 compared to fallow and B. brizantha treatments. The plots with B. humidicola and annual N fertilization resulted in higher nitrification potential (e.g., 2.22 mg NO3-N kg−1 day−1) compared to plots without N fertilization (Figure 4). When the soil was sampled 16 and 49 DAT, plots intercropped with grasses had higher potential net nitrification rates regardless of the forage grass species. Intercropping with forage grasses increased potential net nitrification by 2.63 and 1.09 mg NO3-N kg−1 day−1 at 16 and 49 DAT, respectively compared to maize monocrop (Figure 4).
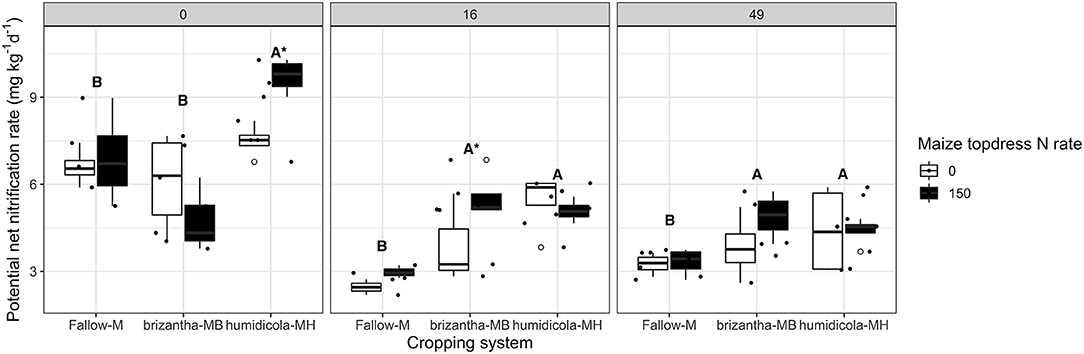
Figure 4. Soil potential net nitrification rate as affected by the cropping system (Fallow-M: maize monocrop; brizantha—MB: maize intercropped with B. brizantha; and humidicola-MH: maize intercropped with B. humidicola) and maize topdress N rate (0 and 150 kg ha−1) in three different time-points of soil sampling: 0, 16, and 49 days after cover crop termination. Different capital letters represent statistical differences between the soil cover treatments and the asterisk represents a statistical difference between maize topdress N rates within each soil cover (Tukey test, p < 0.05). The full circles represent the actual measurement for each treatment while the empty circle represents the outliers, the horizontal mark on the boxplot represent the median and the bars represent the maximum and minimum values.
In addition to increasing potential net nitrification, plots with B. humidicola mineralized 0.41 mg kg−1 day−1 more inorganic N (NH4 and NO3) than plots under fallow at 0 DAT. At this time point, maize topdress N fertilization increased net mineralization rates of plots by 0.71 mg kg−1 day−1 for plots under fallow. At 16 DAT, maize N fertilization had a positive effect only for plots under the intercropping system, increasing net mineralization by 0.36 mg kg−1 day−1. At the later time point (49 DAT), plots under the intercropping system had net mineralization rates 0.24 mg kg−1 day−1 higher than monocropping; maize N fertilization had a negative impact on mineralization of plots with B. humidicola, decreasing the mineralization rates by 0.22 mg kg−1 day−1 (Figure 5).
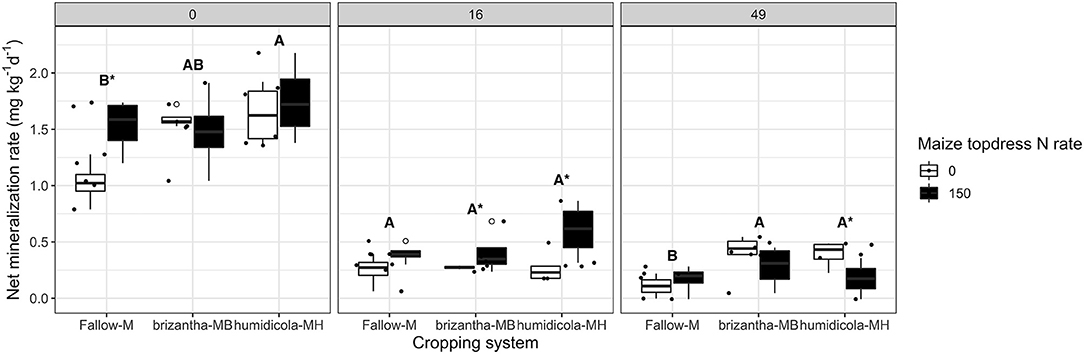
Figure 5. Net N mineralization (NH4-N and NO3-N accumulated over 21 days of soil incubation) as affected by the cropping system (Fallow-M: maize monocrop; brizantha—MB: maize intercropped with B. brizantha; and humidicola-MH: maize intercropped with B. humidicola) and maize topdress N rate (0 and 150 kg ha−1) in three different time-points of soil sampling: 0, 16, and 49 days after cover crop termination. Different capital letters represent statistical differences between the soil cover treatments and the asterisk represents a statistical difference between maize topdress N rates within each soil cover (Tukey test, p < 0.05). The full circles represent the actual measurement for each treatment while the empty circle represents the outliers, the horizontal mark on the boxplot represent the median and the bars represent the maximum and minimum values.
Nitrous oxide emissions were only affected by the cropping system but not by N fertilization. Plots of maize intercropped with B. brizantha and B. humidicola emitted 12.8 and 4.8 mg N2O-N m−2 more than that of monocropping system regardless of N fertilization; intercropped plots with B. brizantha had higher N2O emission than B. humidicola (Figure 6). Cumulative soil respiration was higher only for plots of maize intercropped with B. brizantha, which emitted 39.3 g CO2-C m−2 more than the average of the other treatments (Figure 7) and had higher WFPS values than maize monocrop plots at all three sampling times (p < 0.05) (Figure 8).
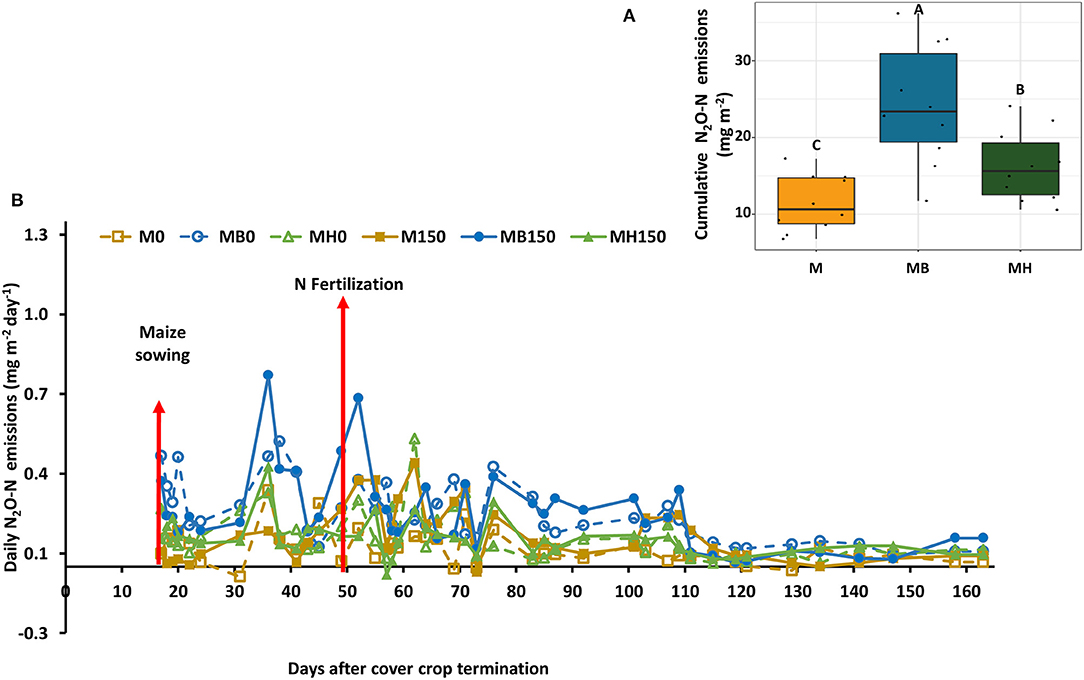
Figure 6. Daily N2O-N emission as affected by the cropping system (M: monocrop maize; MB: maize intercropped with B. brizantha; and MH: B. humidicola) (A) and fertilizer (0 and 150 kg ha−1) application during maize growing season of 2018–2019 (B). The arrows represent maize sowing (when the measurements started) and N fertilization (when high N2O emissions are expected). Capital letters in the boxplot indicate statistical difference between cover crop treatments (Tukey test, p < 0.1).
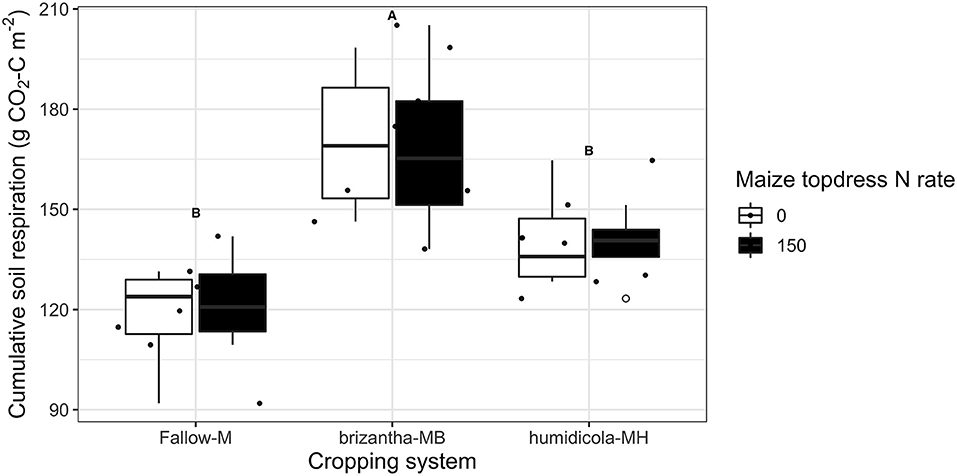
Figure 7. Cumulative soil respiration as affected by the cropping system (M: monocrop maize; MB: maize intercropped with B. brizantha; and MH: B. humidicola) and N fertilizer (0 and 150 kg ha−1) application during maize growing season of 2018–2019 Capital letters indicate statistical difference between cover crop treatments (Tukey test, p < 0.1). The full circles represent the actual measurement for each treatment while the empty circle represents the outliers, the horizontal mark on the boxplot represent the median and the bars represent the maximum and minimum values.
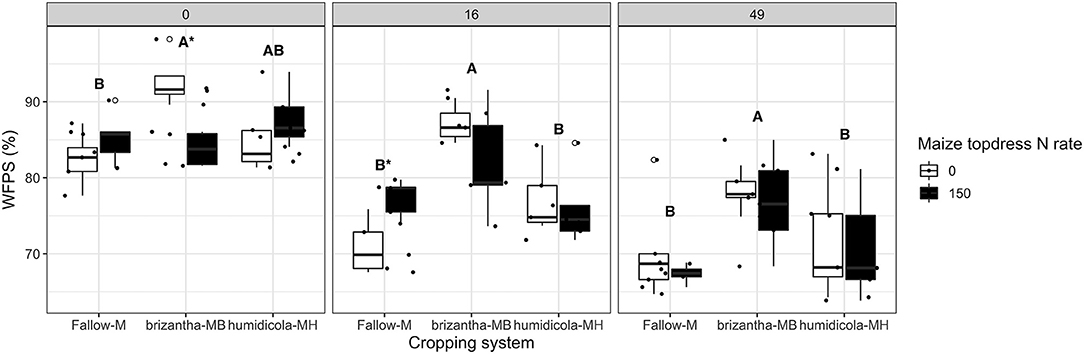
Figure 8. Soil water filled pore space (WFPS) as affected by the cropping system (Fallow-M: maize monocrop; brizantha—MB: maize intercropped with B. brizantha; and humidicola-MH: maize intercropped with B. humidicola) and maize topdress N rate (0 and 150 kg ha−1) in three different time-points of soil sampling: 0, 16, and 49 days after cover crop termination. Different capital letters represent statistical differences between the soil cover treatments and the asterisk represents a statistical difference between maize topdress N rates within each soil cover (Tukey test, p < 0.05). The full circles represent the actual measurement for each treatment while the empty circle represents the outliers, the horizontal mark on the boxplot represent the median and the bars represent the maximum and minimum values.
The effect of cropping system and N fertilization on inorganic N was only significant at 49 DAT. At this sampling time, soil with maize and B. brizantha intercropping had higher inorganic N, averaging 3.7 mg kg−1 more than plots of maize monocropping (Figure S2).
No effect of treatment was observed on total extracted DNA or the abundance of AOA genes (Figures S4–S6). The only marginally significant experimental effect was observed before forage grass termination, when B. humidicola without maize N fertilization resulted in a higher number of copies of 16S than with N fertilization (p < 0.1).
Bacterial/Archaeal and Fungi Community
The alpha diversity (Shannon index) of the bacterial community was not influenced by cropping system or N fertilization of the previous maize crops. However, fungal alpha diversity was positively affected by B. brizantha regardless of the sampling time (Figure 9). At 0 and 49 DAT, we identified 7 and 24 bacterial, respectively, and 27 and 26 fungal taxa positively associated with the monocrop system (Figure S7) while only 4 and 1 bacterial and 3 and 6 fungi taxa positively associated with intercropping system, respectively (Figure S8). Before termination (0 DAT) B. humidicola was positively associated with Nitrospira, a nitrite oxidizing organism, while B. brizantha was positively associated with Nitrosomonadaceae mle1-7, an AOB. However, this effect did not last until the maize season (Figures S9, S10). We also observed that Myxococcaceae, positively associated with B. humidicola at 0 and 49 DAT (Figure S9), could have a significant functional role for N mineralization and it was used as a possible soil biological indicator of N mineralization for the principal component analysis.
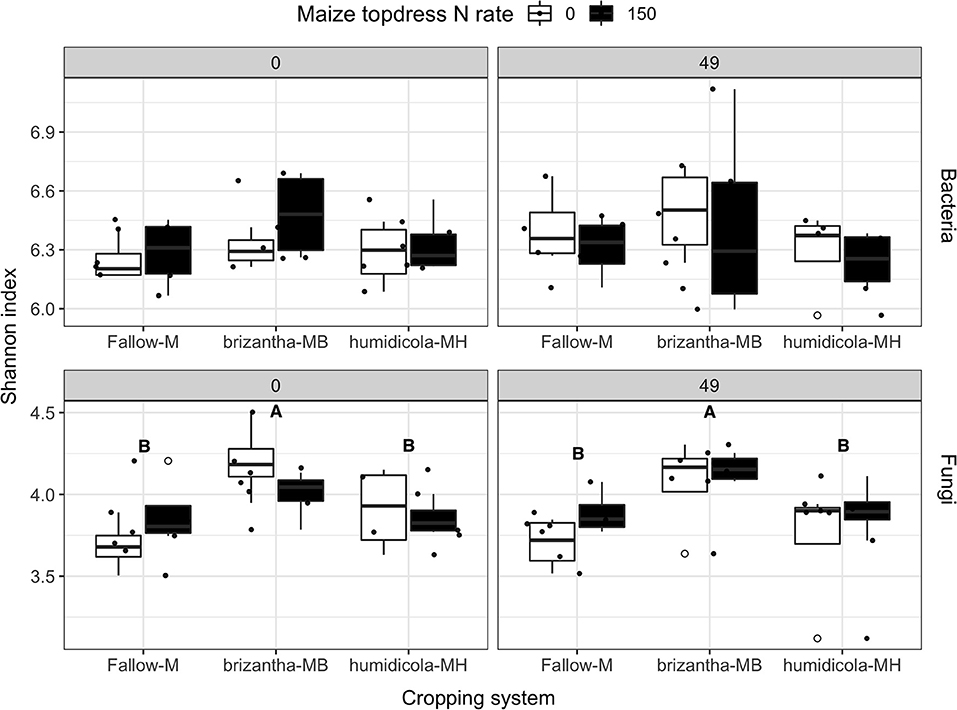
Figure 9. Bacteria and fungi alpha diversity (Shannon index) as affected by the cropping system (Fallow-M: maize monocrop; brizantha—MB: maize intercropped with B. brizantha; and humidicola-MH: maize intercropped with B. humidicola) and maize topdress N rate (0 and 150 kg ha−1) in two different time-points of soil sampling: 0 and 49 days after cover crop termination. Different capital letters represent statistical differences between the soil cover treatments (Tukey test, p < 0.05). The full circles represent the actual measurement for each treatment while the empty circle represents the outliers, the horizontal mark on the boxplot represent the median and the bars represent the maximum and minimum values.
Before forage grass termination, soil samples of the B. brizantha plots had greater fungi as well as diversity higher relative abundance of AMF and lower saprotrophs compared to other cropping systems (Figure 9 and Figure S11), however there was no effect of cropping system or maize N rate on any trophic mode for soil sampled at 49 DAT (Figure S11). In our PCA, we observed that AMF vs. EMF and endophyte vs. saprotroph opposed their relative abundances being endophytes the only trophic mode clustered with fungi diversity before the forage grasses termination (0 DAT) (Figure 10). However, at 49 DAT the AMF and endophyte clustered in a direction opposed of that saprotroph while EMF was the only group that clustered in opposition of fungal diversity (Figure 10). Although AMF clustered in opposite direction of C:N ratio at 49 DAT, the Glomerales was still positively associated with C:N ratio of the grasses even after the termination. The positive effect of B. brizantha and B. humidicola on different AMF organisms belonging to the Glomerales family persisted during the maize growing season (Figures S9, S10). One taxa of the genera Fusarium, typically classified as saprotroph organisms that could be opportunistic pathogenic or endophytic, was positively associated with intercropping system (Figure S8). Only fungal diversity clustered with grass biomass for soil sampled after the termination. The presence of soil cover was related to Trichoderma spp. regardless of the time point (Figure S8). Glomerales (AMF), Trichoderma (endophyte) and Fusarium (saprotroph) clustered with the respective trophic mode before the termination (0 DAT) but did not at 49 DAT (Figure 10). As Glomerales, Trichoderma clustered with C:N ratio in opposite direction of endophytes and AMF while Fusarium clustered in opposition to grass biomass and fungi diversity at 49 DAT (Figure 10).
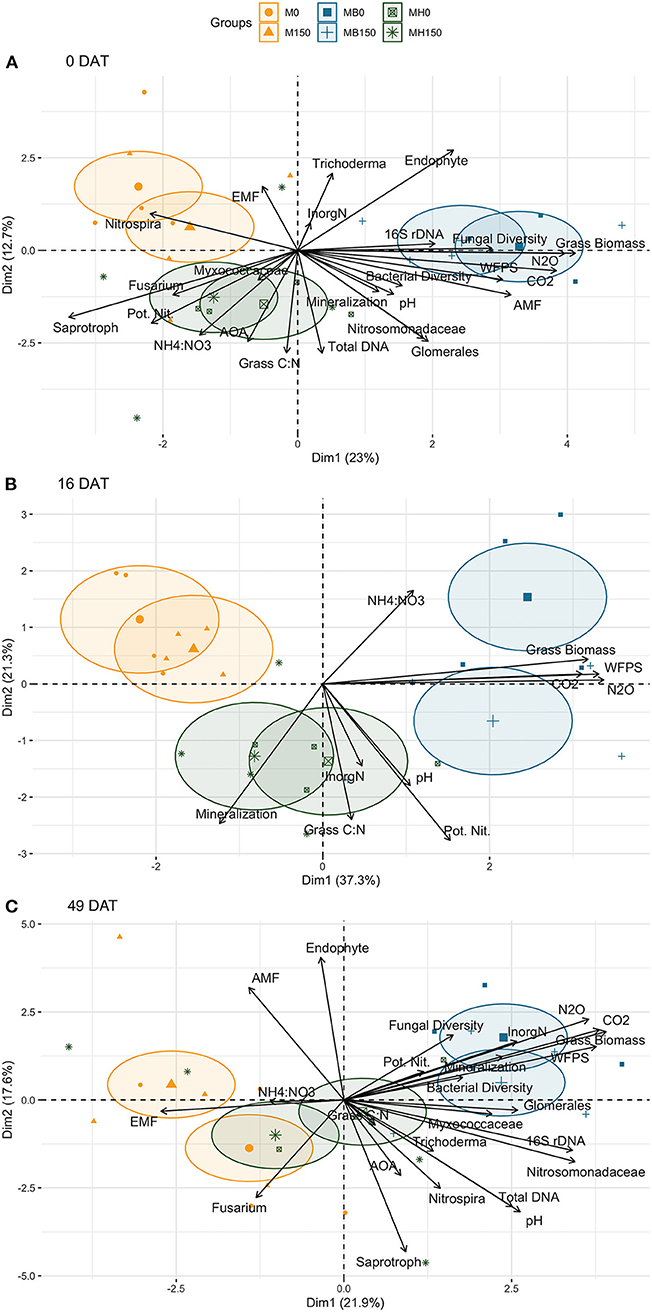
Figure 10. Principal component analysis of N cycling parameters (potential net nitrification rates, net mineralization rates and cumulative N2O emission), and other soil (soil inorganic N, NH4:NO3 ratio, WFPS, pH, total DNA extracted from soil, abundance of 16S rDNA and AOA genes, cumulative respiration and bacteria and fungi alpha diversity) and plant parameters (forage grass biomass produced during the spring-fall period and maize grain yield of the subsequent growing season) across cropping systems (M: monocrop maize; MB: maize intercropped with B. brizantha; and MH: B. humidicola) and maize N fertilization rates (0 and 150 kg ha−1) at 3 time points: 0 (A), 16 (B) and 49 (C) days after termination (DAT).
Correlations of N Cycling Parameters
PCA showed that the intercropping system impacted soil N dynamics differently during the grasses and maize growing season. Before herbicide termination, the potential net nitrification rates clustered with plant C:N ratio was associated with B. humidicola treatments and negatively correlated with grass biomass associated with B. brizantha (Figure 10). The biological indicators positively associated with potential net nitrification rates were relative abundance of saprotroph fungi and Fusarium, abundance of AOA, and relative abundance of Myxococcaceae. Net mineralization rate was associated with grass biomass and C:N ratio and clustered with relative abundance of AMF, Nitrosomonadaceae and Glomerales, bacterial diversity, and total DNA. At this time point, the cumulative N2O emission during the maize growing season clustered with fungi diversity, abundance of 16S rDNA and relative abundance of fungal endophytes while negatively associated with soil potential net nitrification rate and abundance of AOA.
However, in soil samples taken during maize growing season, the net mineralization rate was associated with potential net nitrification rate. The N2O emission clustered with both potential net nitrification rates and mineralization at 49 DAT, the biological indicators associated with that was fungal and bacteria diversity, and relative abundance of Myxococcaceae. Other soil parameters, such as Glomerales, Trichoderma, Nitrosomonadaceae, Nitrospira, saprotroph, AOA, total DNA, abundance of 16S rDNA and AOA were better associated with C:N ratio than biomass and negatively associated with the AMF and endophytes relative abundance.
In the multiple linear regression model, net mineralization rate was the main explanatory variable of potential net nitrification rate, accounting for 27% of the R2 (Table 1). In general, abundance of AOA was negatively correlated with potential net nitrification rate (12% of the R2), while the total extracted DNA (a proxy for microbial biomass), fungal diversity and pH significantly explained potential net nitrification rates (p < 0.05) but explained < 10% of the model variance. The full model explained 77% of the variance of potential net nitrification rates. PCA showed that the effect of intercropping was different at 0 and 49 DAT, being associated with saprotrophs and AOA at 0 DAT and with fungal and bacterial diversity at 49 DAT.
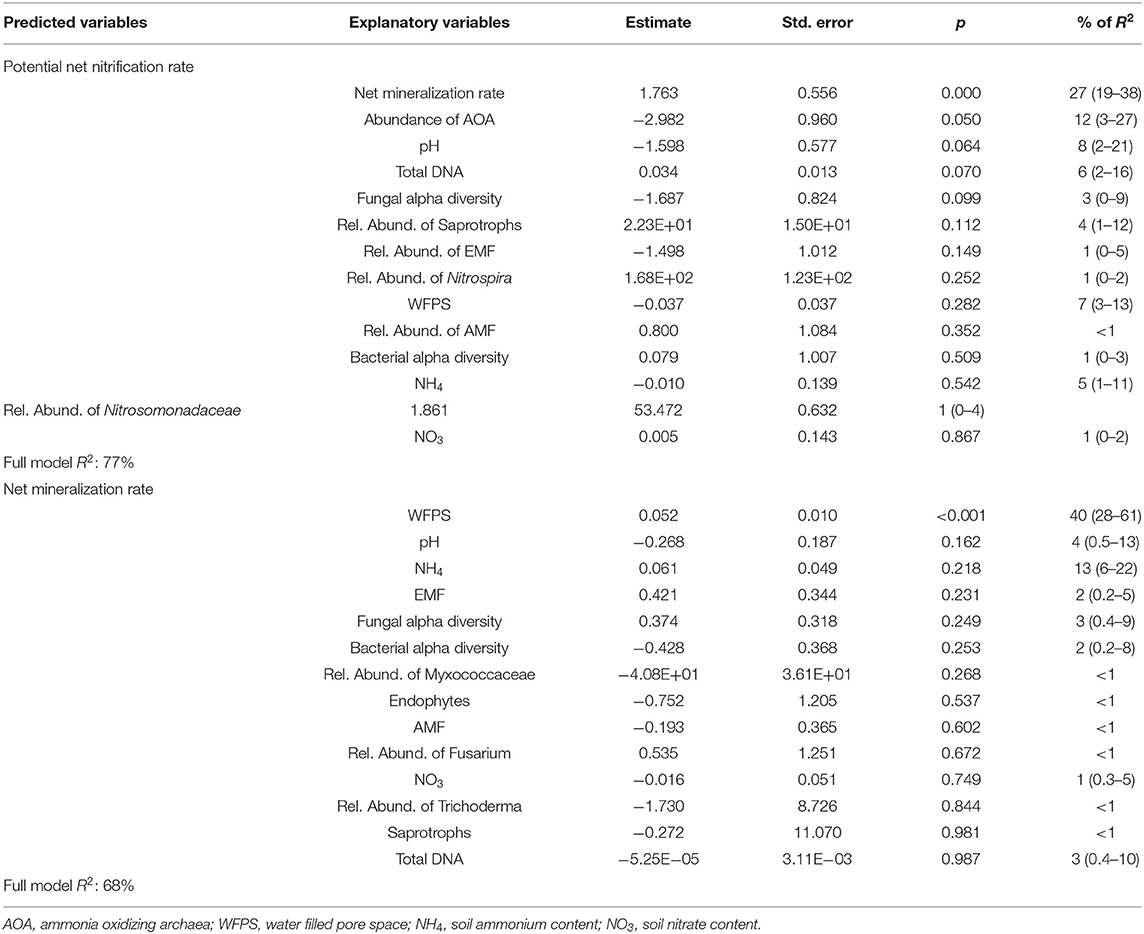
Table 1. Results of a multiple linear regression model to predict potential net nitrification rate and potential mineralizable N using explanatory variables and the relative importance of each parameter (confidence interval of 95%).
Only soil WFPS was significantly and positively correlated with net N mineralization, accounting for 40% of the model R2, and the multiple linear regression model explained 68% of the data variance (Table 1). The PCAs confirmed the strong correlation between soil water content and mineralization rates, except for soil sampled 16 DAT. The soil WFPS was also associated with treatments where biomass production during the fall-spring by forage grasses were higher (Figure 10).
Potential net nitrification and mineralization rates of soil sampled 49 DAT (1 day before topdress N fertilization) were positively correlated with N2O emission and accounted for 8 and 20% of the model R2, respectively (Table 2). PCA showed that cumulative N2O was mainly correlated with the biomass produced by grasses and weeds before maize growing season and WFPS regardless of sampling time (Figure 10).
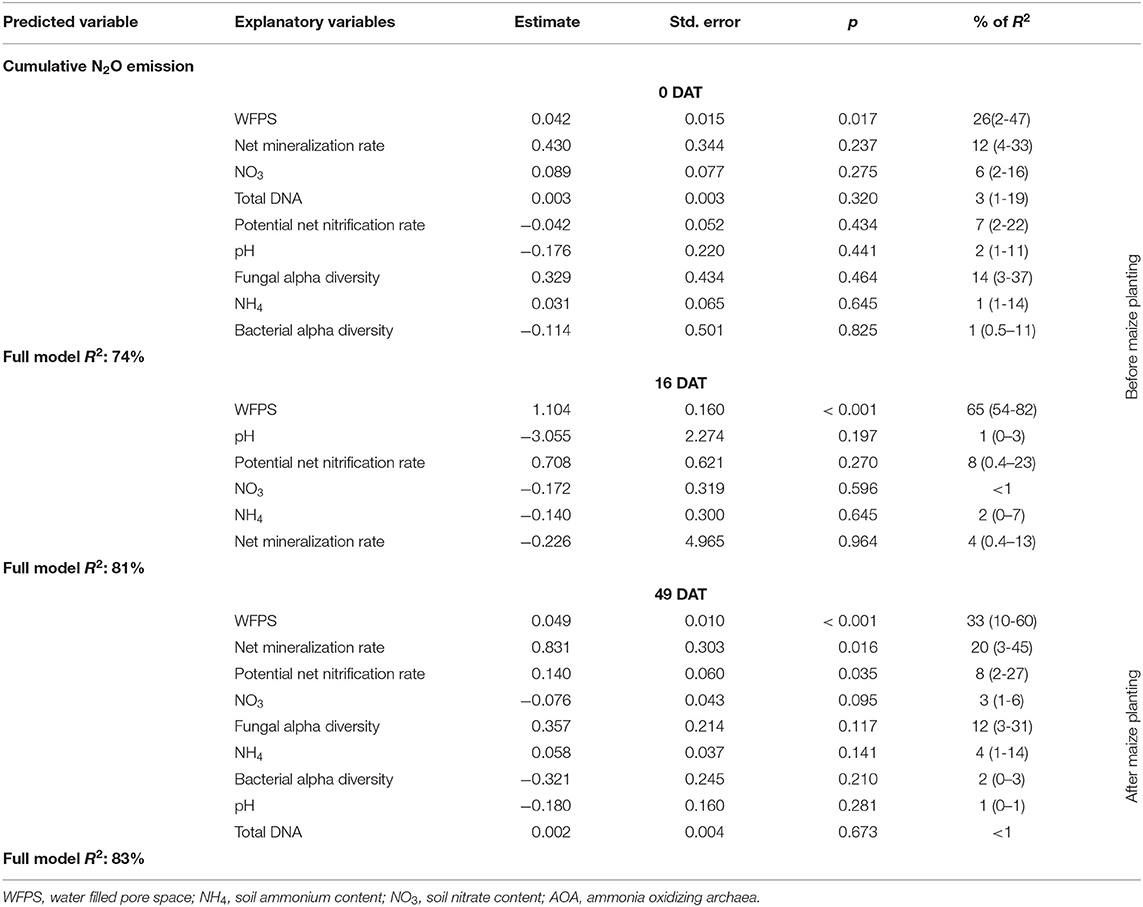
Table 2. Results of a multiple linear regression model to predict cumulative nitrous oxide emissions using explanatory variables and the relative importance of each parameter (confidence interval of 95%) measured in three different time point of soil sampling: 0, 16, and 49 days after cover crop termination (DAT).
Discussion
In this study, we sought to assess how tropical forage grasses growing in the fall-spring period in a maize intercropping system and chemically terminated before maize season affected potential soil net nitrification, N mineralization and consequently leave a legacy to either reduce or increase N2O emission by maize production in tropical soil. We observed that the forage grasses were associated with organisms related to nitrification and mineralization. However, forage grasses did not reduce the potential net nitrification rates before the termination but instead, B. humidicola, with the higher BNI potential, increased the potential net nitrification rates (Figure 4). Net mineralization rates in general followed the same trends (Figure 5), which was the main explanatory variable for the potential net nitrification rate (Table 1). Furthermore, the hypothesis that introducing forage grasses in the maize cropping system could leave a legacy to mitigate the N2O emission was denied, showing that the nitrification inhibition potential of tropical grasses may be outweighed by their impacts on soil moisture, N recycling, and the soil microbiome that together dictate soil N2O fluxes (Figure 10).
Brachiaria brizantha and Brachiaria humidicola Impact Nitrification and N Mineralization Differently Prior to Maize Cropping
At 0 DAT we observed for that forage grass intercropping increased net N mineralization and potential nitrification rates. These changes on soil functions related to N cycling are associated with changes in saprotrophic and mycorrhizal fungi, and bacterial nitrifiers prior to maize growth.
Our results of 16S rDNA amplicon sequencing showed that B. humidicola at 0 DAT, which resulted in higher potential net nitrification rates (Figure 4), was also associated with the nitrite oxidizer, Nitrospira regardless of the maize topdress N rate. The ammonia oxidizing bacteria, Nitrosomonadaceae mle1-7, was associated to B. brizantha. Although B. humidicola was shown to exudate brachialactone that inhibits the activity of Nitrosomonas europeae (52) and Byrnes et al. (15) observed that B. humidicola could reduce the abundance of AOO and net nitrification rates, our results showed the opposite effect of forage grasses on nitrifiers organism. However, when Vázquez et al. (11) compared the same cultivar of B. humidicola used in our experiment with that of the hybrid “Mulato” of the Brachiaria genus, they found no negative effect on gross nitrification rates. Along with the effect of the forage grasses on organisms related to nitrification at the end of fall-spring season (0 DAT), B. humidicola did not reduce but rather increased the potential net nitrification rates, suggesting that forage grass might impact net nitrification rates by increasing inorganic N availability (mineralization).
Although Nitrosomonadaceae mle1-7 was associated to B. brizantha, the net nitrification rates were lower when compared with B. humidicola. At this time point (0 DAT), B. brizantha showed higher relative abundance of AMF and fungi diversity, but lower saprotrophs in comparison with other treatments. One possible mechanism of nitrification inhibition is the competition of soil fungal communities with ammonium oxidizing organisms (AOO) for substrate (17). Teutscherova et al. (12) found that grasses with high BNI potential also had higher root colonization by AMF. Thus, lower net nitrification and mineralization rates in soils with growing B. brizantha when compared to B. humidicola, may be explained by the higher inorganic N consumption by AMF since its relative abundance was higher in this treatment (Figure S11).
The Legacy of Forage Grasses on Nitrification and Mineralization During Maize Cropping
The association of Nitrospira and Nitrosomonadaceae mle1-7 with B. humidicola and B. brizantha, respectively, before herbicide termination did not last after the termination (0 DAT), and both forage grasses had higher potential net nitrification and mineralization rates than plots under monocrop. Fanin et al. (13) showed that after an initial N immobilization, different residues tend to have positive net N mineralization in longer term. Plots under the intercropping system showed a positive effect of intercropping on net N mineralization at 49 DAT. As net mineralization rates were increased in plots with residues of both grasses, the hypothesis of the legacy of forage grasses causing a reduction in net nitrification rates due to N immobilization or residual of BNI activity was rejected.
Using 15N pool dilution, Vázquez et al. (11) observed that genotypes associated with high BNI potential mineralized and nitrified 2.3 and 0.5 μg g−1 day−1 more N, respectively, than genotypes with low BNI potential. Their results suggest that the effect of B. humidicola to reduce net nitrification, AOA abundance and N2O emissions (10, 15, 53, 54) might be due to their effect on gross mineralization/immobilization but not directly on gross nitrification rates. Higher N mineralization provides more substrate for nitrification and consequently increases the nitrification process (55, 56). The potential net nitrification rates are commonly better associated soil organic C than the abundance of AOA and AOB in soil (57), which might be a result of the impact of soil C on mineralization and consequently nitrification rate (55). In the same direction, our study showed that net mineralization rate was a good predictor of potential net nitrification rate (Table 1), supporting the idea that mineralization is an important bottleneck for soil nitrification (55, 58).
The 3-year legacy of the forage grasses to soil under maize cropping was positive on soil mineralization and nitrification rates, regardless of the species, and only B. brizantha left a positive legacy on fungi diversity either by rhizodeposition during the fall-spring or plant residues (23). Fungal and bacterial diversity was found to be also associated with residue mineralization rates (28). Our results reinforce that tropical forage grasses can select specific organism related to nitrification that affect potential net nitrification rates during the fall-spring season. However, the legacy of these grasses on N mineralization is the most important parameter influencing the potential net nitrification rate, or the potential of the soil to produce and accumulate NO3 (Table 1). Other parameters positively related to potential net nitrification rates were total soil DNA (Table 1). Relative abundance of Myxococcaceae also clustered with potential net nitrification rate (Figure 10), this group correspond to a predatory organism that lyses and takes up nutrients from other organisms, and is associated with high microbial biomass (59) and responsive to C and N addition (60), suggesting that changes in microbial biomass known to be positively correlated with N mineralization rates (55). Thus, our results obtained in shorter incubations (7 days) support the evidence that grasses impact the bacterial community related to N cycling before the maize growing season, leaving a positive legacy to N mineralization and nitrification rates, as also observed by Vázquez et al. (11).
The Legacy of Forage Grasses to N2O Emission During Maize Cropping
We found that that B. brizantha produced 5 Mg ha−1 of dry mass more than the fallow plots while B. humidicola only increased the shoot biomass production by 1 Mg ha−1. The biomass production of forage grasses was not affected by the N fertilization on maize. The high demand for N and fast initial growth of the cereal, shading the brachiaria plants and reducing competition, result in low N uptake by the grasses by the end of the maize growing season. Coser et al. (5) showed that only 2.08% of the 15N fertilizer applied during maize growing season was taken up by B. humidicola. In addition, N mineralization in the clay soil used in our study probably is supplying the nutrient needed for the relatively high grass biomass yields, specially of B. brizantha.
The amount of residue left in the field has been shown to be an important factor controlling soil moisture and consequently N2O emission in tropical soils (61, 62). Thus, the biomass production by forage grasses may be the main factor driving higher soil moisture, recycling N, and adding labile C consequently increasing N2O emission during the maize growing season. Plots with Brachiaria intercropping had the highest N2O emissions. On the other hand, the high yielding B. brizantha resulted in an annual C input of 3.8 Mg ha−1 more than the monocrop system, considering the shoot and root biomass at the top 40 cm soil layer, B. brizantha was shown to accumulate more than 100 kg ha−1 of N in the biomass, but emitted only 0.4 kg ha−1 of N2O-N over the second maize harvest season of the same experiment in the field (1). Carvalho et al. (63) found that, despite of the higher greenhouse gas emission from the soil as N2O and CH4, the intercropping system stored 600 kg ha−1 year−1 of C as SOC, resulting in a negative balance of greenhouse gas emission from this cropping system: those authors estimated a net reduction of 360 kg C-equivalent ha−1 year−1 for the intercropping system in a tropical soil.
The stimulatory effect of plant residues on N2O emission may be attributed to: (i) increased N supply by mineralization (64), (ii) C addition through plant residue (65), and (iii) the presence of soil cover itself (61). Canisares et al. (1) suggested also that N released shortly after grass desiccation with herbicide could increase N2O emissions. Using a synthetic and sugarcane straw compared to bare soil, Fracetto et al. (61) observed that the soil cover was responsible for retaining soil moisture and consequently increasing N2O emission regardless of labile C inputs and N mineralization during straw decomposition. The residues left on the field by the forage reduced evaporation an explain the higher soil moisture for soil sampled at 49 DAT (61, 62).
In our study, cumulative N2O emissions were correlated with WFPS regardless of the time point of soil sampling, and WFPS explained 26, 65, and 33% of N2O data variance at 0, 16 and 49 DAT, respectively (Table 2). Higher WFPS results in lower O2 availability and consequently lower redox potential, creating a more favorable condition for denitrification than the other treatments (66). However, we did not identify strong evidence of anaerobic taxa, which suggest that soil conditions do not match with ideal conditions where denitrification is the main biogeochemical process driving N2O emission (66).
Soil moisture is also associated with N mineralization and nitrification (55) and our results showed that WFPS was the only significant explanatory variable for net mineralization rate (Table 1). Besides WFPS, the N2O emission was strongly associated with N mineralization rates and soil respiration as well, mainly at 49 DAT (Figure 10). Soil moisture measurements typically follow soil C content (55). However, we did not measured soil C because several years are needed for management treatments to cause significant changes on soil C content (6). The WFPS correlated well with mineralization because of the changes on soil moisture had temporal effects, while using forage grass biomass and C:N ratio as a reference for labile C input did not follow a temporal change. Thus, the higher N2O emissions in plots with B. brizantha mulch may be attributed to a higher N and labile C pulse after forage grass termination due to its higher biomass yield than B. humidicola. The combination of higher biomass with high soil moisture at field conditions, which could not be decoupled in our experimental design, increased N mineralization, consequently supplying substrate for nitrification and denitrification (64).
Conclusion
Our study provided important insights for the understanding of previously unknown aspects of the complex maize-brachiaria intercropping system. We evaluated whether introducing tropical grasses with contrasting BNI potential could reduce nitrification and consequently reduce N2O emission during maize cultivation in a tropical soil. This hypothesis was denied. B. humidicola, with higher BNI potential, showed to positively impact the potential net nitrification rates at herbicide termination, and both grasses left a positive legacy on potential net nitrification rate 49 days after herbicide termination. B. humidicola and B. brizantha were associated with nitrifiers prior to termination but no effect on these organisms was observed during the maize season, so this effect was temporary. B. brizantha showed a positive effect on AMF and fungi diversity while reducing saprotrophs prior to maize cropping, but the legacy of this grass to maize cropping was a higher fungal diversity. Soil moisture and the forage grass biomass were associated with net mineralization rates, which was the related to potential net nitrification rates during early maize growing season. The cumulative emission of N2O during the maize growing season was strongly associated with soil moisture, respiration, bacterial and fungal diversity, net mineralization and nitrification rates, and the biomass produced by grasses during the fall-winter-spring, showing that the nitrification inhibition potential of tropical grasses can be outweighed by their impacts on N recycling, soil moisture and the soil microbiome that together dictate soil N2O fluxes. This study focused on the initial 3 years after starting this cropping system. The effect of the C input might result in higher soil organic C at the longer term that might compensate the greater N2O emission of the intercropping system. Thus, evaluations for longer periods shall be done in the future to measure the net greenhouse gases emission considering the soil C sequestration. Despite the higher N2O emissions caused by grasses, brachiarias provided C to the system and did not have a negative effect on maize grain yields. Our findings may help to devise ways for improving an already sustainable cropping system.
Data Availability Statement
The datasets presented in this study can be found in online repositories. The names of the repository/repositories and accession number(s) can be found below: NCBI [accession: PRJNA746808].
Author Contributions
LC, HC, LM, and CC contributed with the study design, run the field and lab experiment, collect the data, data analysis, and writing the manuscript. EB, PS, and UK contributed to microbial amplicon sequencing, data processing and analysis, and writing the manuscript. DV and JA contributed with measuring the abundance of amoA genes and paper writing. HP contributed with data analysis and writing the manuscript. All authors contributed to the article and approved the submitted version.
Funding
This work was undertaken as part of NUCLEUS: a virtual joint centre to deliver enhanced NUE via an integrated soil-plant systems approach for the United Kingdom and Brazil. Funded in Brazil by FAPESP—São Paulo Research Foundation [Grant 2015/50305-8], FAPEG—Goiás Research Foundation [Grant 2015-10267001479], and FAPEMA—Maranhão Research Foundation [Grant RCUK-02771/16]; and in the United Kingdom by BBSRC/Newton Fund [BB/N013201/1]. Additional grants from FAPESP [2018/20.2793-9] and CNPq [310.478/2017-0] funded this project.
Conflict of Interest
The authors declare that the research was conducted in the absence of any commercial or financial relationships that could be construed as a potential conflict of interest.
Publisher's Note
All claims expressed in this article are solely those of the authors and do not necessarily represent those of their affiliated organizations, or those of the publisher, the editors and the reviewers. Any product that may be evaluated in this article, or claim that may be made by its manufacturer, is not guaranteed or endorsed by the publisher.
Acknowledgments
LC thank the Brazilian Federal Agency of Support and Evaluation of Graduate Education (CAPES) for the Ph.D. scholarship (88881.361534/2019-01, 88882.444187/2019-01). While in CIAT Colombia, this study was undertaken as part of the LivestockPlus project funded by CGIAR—Consultative Group on International Agricultural Research —Research Program (CRP) on Climate Change, Agriculture and Food Security (CCAFS). In addition, this work was also done as part of the Livestock CRP. Part of this work was performed at Lawrence Berkeley National Laboratory under Department of Energy contract number DE-AC02-05CH11231. This work used the Vincent J. Coates Genomics Sequencing Laboratory at UC Berkeley, supported by NIH S10 OD018174 Instrumentation Grant.
Supplementary Material
The Supplementary Material for this article can be found online at: https://www.frontiersin.org/articles/10.3389/fsoil.2021.746433/full#supplementary-material
References
1. Canisares LP, Rosolem CA, Momesso L, Alexandre C, Crusciol C, Villegas DM, et al. Maize-Brachiaria intercropping: a strategy to supply recycled N to maize and reduce soil N2O emissions? Agric Ecosyst Environ. (2021) 319:107491. doi: 10.1016/j.agee.2021.107491
2. Momesso L, Crusciol CAC, Soratto RP, Vyn TJ, Tanaka KS, Costa CHM, et al. Impacts of nitrogen management on no-till maize production following forage cover crops. Agron J. (2018) 111:639–49. doi: 10.2134/agronj2018.03.0201
3. Rocha KF, Mariano E, Grassmann CS, Trivelin PCO, Rosolem CA. Fate of 15N fertilizer applied to maize in rotation with tropical forage grasses. F Crop Res. (2019) 238:35–44. doi: 10.1016/j.fcr.2019.04.018
4. Mateus GP, Crusciol CAC, Pariz CM, Borghi E, Costa C, Martello JM, et al. Sidedress nitrogen application rates to sorghum intercropped with tropical perennial grasses. Agron J. (2016) 108:433–47. doi: 10.2134/agronj2015.0236
5. Coser TR, Ramos MLG, Clio de Figueiredo C, Urquiaga S, Moreira de Carvalho A, Barros FV, et al. Nitrogen uptake efficiency of maize in monoculture and intercropped with Brachiaria humidicola and Panicum maximum in a dystrophic red-yellow latosol of the Brazilian Cerrado. Crop Pasture Sci. (2016) 67:47. doi: 10.1071/CP15077
6. Crusciol CAC, Nascente AS, Borghi E, Soratto RP, Martins PO. Improving soil fertility and crop yield in a tropical region with palisadegrass cover crops. Agron J. (2015) 107:2271. doi: 10.2134/agronj14.0603
7. Rosolem CA, Ritz K, Cantarella H, Galdos MV, Hawkesford MJ, Whalley WR, et al. Enhanced Plant Rooting and Crop System Management for Improved N Use Efficiency, 1st Edn. Washington, DC: Elsevier Inc. (2017). doi: 10.1016/bs.agron.2017.07.002
8. Karwat H, Moreta D, Arango J, Núñez J, Rao I, Rincón Á, et al. Residual effect of BNI by Brachiaria humidicola pasture on nitrogen recovery and grain yield of subsequent maize. Plant Soil. (2017) 420:389–406. doi: 10.1007/s11104-017-3381-z
9. Castoldi G, Reis JG, dos Pivetta LA, Rosolem CA. Soil nitrogen dynamics after Brachiaria desiccation. Rev Bras Ciências do Solo. (2013) 37:1620–7. doi: 10.1590/S0100-06832013000600018
10. Nuñez J, Arevalo A, Karwat H, Egenolf K, Miles J, Chirinda N, et al. Biological nitrification inhibition activity in a soil-grown biparental population of the forage grass, Brachiaria humidicola. Plant Soil. (2018) 426:401–11. doi: 10.1007/s11104-018-3626-5
11. Vázquez E, Teutscherova N, Dannenmann M, Töchterle P, Butterbach-Bahl K, Pulleman M, et al. Gross nitrogen transformations in tropical pasture soils as affected by Urochloa genotypes differing in biological nitrification inhibition (BNI) capacity. Soil Biol Biochem. (2020) 151:108058. doi: 10.1016/j.soilbio.2020.108058
12. Teutscherova N, Vazquez E, Arango J, Arevalo A, Benito M, Pulleman M. Native arbuscular mycorrhizal fungi increase the abundance of ammonia-oxidizing bacteria, but suppress nitrous oxide emissions shortly after urea application. Geoderma. (2018) 36:151–8. doi: 10.1016/j.geoderma.2018.09.023
13. Fanin N, Alavoine G, Bertrand I. Temporal dynamics of litter quality, soil properties and microbial strategies as main drivers of the priming effect. Geoderma. (2020) 377:114576. doi: 10.1016/j.geoderma.2020.114576
14. Rezende CP, Cantarutti RB, Braga JM, Gomide JA, Pereira JM, Ferreira E, et al. Litter deposition and disappearance in Brachiaria pastures in the Atlantic forest region of the South of Bahia, Brazil. Nutr Cycl Agroecosystems. 54:99–112. doi: 10.1023/A:1009797419216
15. Byrnes RC, Nùñez J, Arenas L, Rao I, Trujillo C, Alvarez C, et al. Biological nitrification inhibition by Brachiaria grasses mitigates soil nitrous oxide emissions from bovine urine patches. Soil Biol Biochem. (2017) 107:156–63. doi: 10.1016/j.soilbio.2016.12.029
16. Norton J, Ouyang Y. Controls and adaptive management of nitrification in agricultural soils. Front Microbiol. (2019) 10:1931. doi: 10.3389/fmicb.2019.01931
17. Nardi P, Laanbroek HJ, Nicol GW, Renella G, Cardinale M, Pietramellara G, et al. Biological nitrification inhibition in the rhizosphere: determining interactions and impact on microbially mediated processes and potential applications. FEMS Microbiol. Rev. (2020) 44:874–908. doi: 10.1093/femsre/fuaa037
18. Schloter M, Nannipieri P, Sørensen SJ, van Elsas JD. Microbial indicators for soil quality. Biol Fertil Soils. (2018) 54:1–10. doi: 10.1007/s00374-017-1248-3
19. Suleiman AKA, Lourenço KS, Pitombo LM, Mendes LW, Roesch LFW, Pijl A, et al. Recycling organic residues in agriculture impacts soil-borne microbial community structure, function and N2O emissions. Sci Total Environ. (2018) 631–632:1089–99. doi: 10.1016/j.scitotenv.2018.03.116
20. Ouyang Y, Norton JM. Short-term nitrogen fertilization affects microbial community composition and nitrogen mineralization functions in an agricultural soil. Appl Environ Microbiol. (2020) 86:1–15. doi: 10.1128/AEM.02278-19
21. French E, Kaplan I, Iyer-Pascuzzi A, Nakatsu CH, Enders L. Emerging strategies for precision microbiome management in diverse agroecosystems. Nat Plants. (2021) 7:256–67. doi: 10.1038/s41477-020-00830-9
22. Garland G, Edlinger A, Banerjee S, Degrune F, García-Palacios P, Pescador DS, et al. Crop cover is more important than rotational diversity for soil multifunctionality and cereal yields in European cropping systems. Nat Food. (2021) 2:28–37. doi: 10.1038/s43016-020-00210-8
23. Yang T, Adams JM, Shi Y, He J, Jing X, Chen L, et al. Soil fungal diversity in natural grasslands of the Tibetan Plateau: associations with plant diversity and productivity. N Phytol. (2017) 215:756–65. doi: 10.1111/nph.14606
24. Looby CI, Hollenbeck EC, Treseder KK. Fungi in the canopy: how soil fungi and extracellular enzymes differ between canopy and ground soils. Ecosystems. (2020) 23:768–82. doi: 10.1007/s10021-019-00439-w
26. Wagg C, Bender SF, Widmer F, Van Der Heijden MGA. Soil biodiversity and soil community composition determine ecosystem multifunctionality. Proc Natl Acad Sci USA. (2014) 111:5266–70. doi: 10.1073/pnas.1320054111
27. Kim N, Zabaloy MC, Guan K, Villamil MB. Do cover crops benefit soil microbiome? A meta-analysis of current research. Soil Biol Biochem. (2020) 142:107701. doi: 10.1016/j.soilbio.2019.107701
28. Tardy V, Spor A, Mathieu O, Lévèque J, Terrat S, Plassart P, et al. Shifts in microbial diversity through land use intensity as drivers of carbon mineralization in soil. Soil Biol Biochem. (2015) 90:204–13. doi: 10.1016/j.soilbio.2015.08.010
29. Peel MC, Finlayson BL, McMahon TA. Updated world map of the Köppen-Geiger climate classification. Hydrol Earth Syst Sci. (2007) 11:1633–44. doi: 10.5194/hess-11-1633-2007
30. USDA. United States Department of Agriculture. Keys to Soil Taxonomy. 12th Edn. Washington, DC (2014).
31. Raij B, van Andrade JC, Cantarella H, Quaggio JA. Análise Química Para Avaliação da Fertilidade de Solos Tropicais (2001).
32. Keeney DR, Nelson DW. Nitrogen-inorganic forms. In: Page AL, Miller RH, Keeney DR, editors. Methods of Soil Analysis. Part 2 - Chemical and Microbiological Properties. Madison, WI: American Society of Agronomy (1982). p. 643–98.
33. Neill C, Piccolo MC, Cerri CC, Steudler PA, Jerry M, Neill C, et al. Net nitrogen mineralization and net nitrification rates in soils following deforestation for pasture across the Southwestern Brazilian Amazon basin landscape. Oecologia. (1997) 110:243–52. doi: 10.1007/s004420050157
34. Varner RK. Experimentally induced root mortality increased nitrous oxide emission from tropical forest soils. Geophys Res Lett. (2003) 30:4–7. doi: 10.1029/2002GL016164
35. Savage K, Phillips R, Davidson E. High temporal frequency measurements of greenhouse gas emissions from soils. Biogeosciences. (2014) 11:2709–20. doi: 10.5194/bg-11-2709-2014
36. Soares JR, Cassman NA, Kielak AM, Pijl A, Carmo JB, Lourenço KS, et al. Nitrous oxide emission related to ammonia-oxidizing bacteria and mitigation options from N fertilization in a tropical soil. Sci Rep. (2016) 6:30349. doi: 10.1038/srep30349
37. Kaur-Bhambra J, Wardak DLR, Prosser JI, Gubry-Rangin C. Revisiting plant biological nitrification inhibition efficiency using multiple archaeal and bacterial ammonia-oxidising cultures. Biol Fertil Soils. (2021). doi: 10.1007/s00374-020-01533-1
38. Leininger S, Urich T, Schloter M, Schwark L, Qi J, Nicol GW, et al. Archaea predominate among ammonia-oxidizing prokaryotes in soils. Nature. (2006) 442:806–9. doi: 10.1038/nature04983
39. Caporaso JG, Lauber CL, Walters WA, Berg-Lyons D, Huntley J, Fierer N, et al. Ultra-high-throughput microbial community analysis on the Illumina HiSeq and MiSeq platforms. ISME J. (2012) 6:1621–4. doi: 10.1038/ismej.2012.8
40. Edgar RC. Search and clustering orders of magnitude faster than BLAST. Bioinformatics. (2010) 26:2460–1. doi: 10.1093/bioinformatics/btq461
41. Callahan BJ, McMurdie PJ, Rosen MJ, Han AW, Johnson AJA, Holmes SP. DADA2: high-resolution sample inference from Illumina amplicon data. Nat Methods. (2016) 13:581–3. doi: 10.1038/nmeth.3869
42. Wang Q, Garrity GM, Tiedje JM, Cole JR. Naïve bayesian classifier for rapid assignment of rRNA sequences into the new bacterial taxonomy. Appl Environ Microbiol. (2007) 73:5261–7. doi: 10.1128/AEM.00062-07
43. Caporaso JG, Bittinger K, Bushman FD, DeSantis TZ, Andersen GL, Knight R. PyNAST: a flexible tool for aligning sequences to a template alignment. Bioinformatics. (2010) 26:266–7. doi: 10.1093/bioinformatics/btp636
44. Price MN, Dehal PS, Arkin AP. FastTree 2 – approximately maximum-likelihood trees for large alignments. PLoS ONE. (2010) 5:e9490. doi: 10.1371/journal.pone.0009490
45. Mendiburu F. Statistical Procedures for Agricultural Research: Package “agricolae”. CRAN Repos (2016).
47. Oksanen J, Legendre P, O'Hara B, Stevens MHH, Oksanen MJ, Suggests M. Vegan: Community Ecology Package. R Package Version 2.2–0 (2007).
48. Storey JD, Bass AJ, Dabney A, Robinson D. qvalue: Q-Value Estimation for False Discovery Rate Control. R package version 2.0.0 (2020). Available online at: http://github.com/jdstorey/qvalue. Available at: http://qvalue.princeton.edu/%5Cnhttp://github.com/jdstorey/qvalue
49. McMurdie PJ, Holmes S. Phyloseq: an R package for reproducible interactive analysis and graphics of microbiome census data. PLoS ONE. (2013) 8:61217. doi: 10.1371/journal.pone.0061217
50. Nguyen NH, Song Z, Bates ST, Branco S, Tedersoo L, Menke J, et al. FUNGuild: an open annotation tool for parsing fungal community datasets by ecological guild. Fungal Ecol. (2016) 20:241–8. doi: 10.1016/j.funeco.2015.06.006
51. Kassambara A, Mundt F, Kassambara A, Mundt F.Factoextra: Extract and Visualize the Results of Multivariate Data Analyses. (2017). Available online at: http//www.sthda.com/english/rpkgs/factoextra~BugReports
52. Subbarao GV, Nakahara K, Hurtado MP, Ono H, Moreta DE, Salcedo F, et al. Evidence for biological nitrification inhibition in Brachiaria pastures. Proc Natl Acad Sci USA. (2009) 106:17302–7. doi: 10.1073/pnas.0903694106
53. Karwat H, Egenolf K, Nuñez J, Rao I, Rasche F, Arango J, et al. Low 15N natural abundance in shoot tissue of brachiaria humidicola is an indicator of reduced N losses due to biological nitrification inhibition (BNI). Front Microbiol. (2018) 9:2383. doi: 10.3389/fmicb.2018.02383
54. Simon PL, Dieckow J, Zanatta JA, Ramalho B, Ribeiro RH, van der Weerden T, et al. Does Brachiaria humidicola and dicyandiamide reduce nitrous oxide and ammonia emissions from cattle urine patches in the subtropics? Sci Total Environ. (2020) 720:137692. doi: 10.1016/j.scitotenv.2020.137692
55. Booth MS, Stark JM, Rastetter E. Controls on nitrogen cycling in terrestrial ecosystems: a synthetic analysis of literature data. Ecol Monogr. (2005) 75:139–57. doi: 10.1890/04-0988
56. Ouyang Y, Norton JM, Stark JM. Ammonium availability and temperature control contributions of ammonia oxidizing bacteria and archaea to nitrification in an agricultural soil. Soil Biol Biochem. (2017) 113:161–72. doi: 10.1016/j.soilbio.2017.06.010
57. O'Sullivan CA, Wakelin SA, Fillery IRP, Roper MM. Factors affecting ammonia-oxidising microorganisms and potential nitrification rates in southern Australian agricultural soils. Soil Res. (2013) 51:240–52. doi: 10.1071/SR13039
58. Clein JS, Schimel JP. Nitrogen turnover and availability during succession from alder to poplar in Alaskan taiga forests. Soil Biol Biochem. (1995) 27:743–52. doi: 10.1016/0038-0717(94)00232-P
59. Petters S, Groß V, Söllinger A, Pichler M, Reinhard A, Bengtsson MM, et al. The soil microbial food web revisited: predatory myxobacteria as keystone taxa? ISME J. (2021) 15:2665–75. doi: 10.1038/s41396-021-00958-2
60. Hungate BA, Marks JC, Power ME, Schwartz E, van Groenigen KJ, Blazewicz SJ, et al. The functional significance of bacterial predators. MBio. (2021) 12:1–10. doi: 10.1128/mBio.00466-21
61. Fracetto FJC, Fracetto GGM, Bertini SCB, Cerri CC, Feigl BJ, Siqueira Neto M. Effect of agricultural management on N2O emissions in the Brazilian sugarcane yield. Soil Biol Biochem. (2017) 109:205–13. doi: 10.1016/j.soilbio.2017.02.004
62. Gonzaga LC, Zotelli L, Do C, de Castro SGQ, de Oliveira BG, et al. Bordonal Implications of sugarcane straw removal for soil greenhouse gas emissions in São Paulo State, Brazil. Bioenergy Res. (2019) 12:843–57. doi: 10.1007/s12155-019-10006-9
63. Carvalho JLN, Raucci GS, Frazão LA, Cerri CEP, Bernoux M, Cerri CC. Crop-pasture rotation: a strategy to reduce soil greenhouse gas emissions in the Brazilian Cerrado. Agric Ecosyst Environ. (2014) 183:167–75. doi: 10.1016/j.agee.2013.11.014
64. Guardia G, Abalos D, García-Marco S, Quemada M, Alonso-Ayuso M, Cárdenas LM, et al. Effect of cover crops on greenhouse gas emissions in an irrigated field under integrated soil fertility management. Biogeosciences. (2016) 13:5245–57. doi: 10.5194/bg-13-5245-2016
65. Senbayram M, Well R, Bol R, Chadwick DR, Jones DL, Wu D. Interaction of straw amendment and soil NO3– content controls fungal denitrification and denitrification product stoichiometry in a sandy soil. Soil Biol Biochem. (2018) 126:204–12. doi: 10.1016/j.soilbio.2018.09.005
Keywords: intercropping, nitrous oxide-N2O, mineralization, nitrification, microbial community
Citation: Canisares LP, Poffenbarger H, Brodie EL, Sorensen PO, Karaoz U, Villegas DM, Arango J, Momesso L, Crusciol CAC and Cantarella H (2021) Legacy Effects of Intercropping and Nitrogen Fertilization on Soil N Cycling, Nitrous Oxide Emissions, and the Soil Microbial Community in Tropical Maize Production. Front. Soil Sci. 1:746433. doi: 10.3389/fsoil.2021.746433
Received: 23 July 2021; Accepted: 22 September 2021;
Published: 20 October 2021.
Edited by:
Abdallah Oukarroum, Mohammed VI Polytechnic University, MoroccoReviewed by:
Sajjad Raza, Nanjing University of Information Science and Technology, ChinaYaosheng Wang, Chinese Academy of Agricultural Sciences (CAAS), China
Copyright © 2021 Canisares, Poffenbarger, Brodie, Sorensen, Karaoz, Villegas, Arango, Momesso, Crusciol and Cantarella. This is an open-access article distributed under the terms of the Creative Commons Attribution License (CC BY). The use, distribution or reproduction in other forums is permitted, provided the original author(s) and the copyright owner(s) are credited and that the original publication in this journal is cited, in accordance with accepted academic practice. No use, distribution or reproduction is permitted which does not comply with these terms.
*Correspondence: Heitor Cantarella, Y2FudGFyZWxsYUBpYWMuc3AuZ292LmJy