 Xiaosong Lu1,2
 Dongsheng Yu
95% of researchers rate our articles as excellent or good
Learn more about the work of our research integrity team to safeguard the quality of each article we publish.
Find out more
ORIGINAL RESEARCH article
Front. Soil Sci. , 04 November 2021
Sec. Soil Management
Volume 1 - 2021 | https://doi.org/10.3389/fsoil.2021.745974
This article is part of the Research Topic Sustainable Land Management Practices to Alleviate Land Degradation in Changing Environment View all 4 articles
During the past three decades, a large amount of nitrogen (N) fertilizers has been applied in the rice and wheat rotation system in the Taihu Lake region of southern China to achieve high yield, resulting in low N use efficiency (NUE). China is implementing the national strategy “fertilizer reduction with efficiency increase” to solve the serious ecological problems caused by excessive fertilization. However, the effects of N fertilizer reduction on soil fertility and their integrated effect on NUE of rice–wheat rotation systems in the Taihu Lake region are not fully understood. In this study, test fields with different soil-fertility qualities were selected in typical rice–wheat areas in the Taihu Lake region to perform a 2-year rice–wheat N fertilizer effect test to obtain the comprehensive quantitative relationship among the integrated fertility index (IFI), nitrogen application level (NA), and NUE. Through the investigation and spatial analysis of NA and IFI in the study area in 2003 and 2017, the spatial and temporal variation characteristics of NA and IFI in the study area in the past 15-year period were obtained, and this information was spatially coupled with the comprehensive quantitative relationship model of NUE to reveal the variation characteristics and driving factors of NUE in the study area. The result shows that the wheat and rice NA in the study area in 2017 increased by 35.5 and 8.4%, respectively, compared with 2003. Due to excessive fertilization, the soil nitrogen, phosphorus, and potassium content of cultivated land in the study area in 2017 was greater than that in 2003, especially soil-available phosphorus and potassium contents, whereas soil organic matter (SOM) content was reduced. The cultivated land IFI of the study area as a whole increased by 7.2% in the 15-year period. The NUE of rice and wheat rotation increased by 5.8% in 2017 compared with that of 2003 due to the improvement in crop varieties and N fertilizer yield benefits. The increases of NA and IFI both have negative correlations with the NUE improvement, and the NA increase has a greater impact. In addition, the terrain, soil type, texture, and parent material also affect the soil nutrient-preserving capability and, thus, affect the spatial variation of IFI and NUE improvement. These factors have greater influence on NUE improvement of wheat than rice. This study provides a novel and effective method for analyzing the spatial-temporal variation characteristics of NUE in the rice–wheat system and is conducive to guide precise fertilization and N fertilizer reduction based on the spatial analysis of NA with IFI and NUE.
Rice and wheat rotation is a very important method of cultivation in China that is employed in up to 13 million hectares in China's Yangtze River basin (1). The Taihu Lake region located in the Yangtze River Delta is one of China's five main rice-producing areas, covering 3.65 million hectares (2). Some studies report that farmland in the Taihu Lake region has been overfertilized to achieve high grain yield for a long time, resulting in low N use efficiency (NUE) (fertilizer N recovery in crop aboveground biomass) (3). Low NUE not only inhibits the increase in grain yield, but also causes significant loss of nitrogen fertilizer and damage to the ecological environment (4). Since the beginning of the twentieth century, precise fertilization technology for soil testing and formula fertilization have been promoted in the Taihu lake region (5). Due to the lack of many factors, including effective management, convenient application of information technology, and research on fertilization accuracy at field scale, precision fertilization has not been adopted by most farmers (6). According to a survey on the adoption of precision fertilization by farmers in the Taihu Lake region of southern Jiangsu province, only about 30% of farmers have adopted precision fertilization technology, and most of them are agricultural cooperative farms (7). Therefore, it is of great significance to perform research on precise fertilization to achieve the dual goals of food security and ecological security in the Taihu Lake region (8, 9).
Precision fertilization is a modern agricultural technology based on soil nutrient status, crop fertilizer requirement, and target grain yield, regulating the fertilization mode of N, P, and K, to improve NUE and obtain the maximum crop yield as well as economic and ecological environmental benefits (10, 11). With the development of information technology, 3S technology, mainly including geographic information system (GIS), remote-sensing technology (RS), and global positioning system (GPS), has been widely used in the field of agricultural precision fertilization (12–14). Geographic information system technology has been widely applied to studies of regional cultivated land quantity and quality and fertilization management. Researchers mostly use GIS technology to characterize and analyze the spatial data of cultivated land quantity and quality at the regional scale to achieve precise fertilization and fertilizer management in different zones (15–18). Based on the research on the spatial distribution of cultivated land quality, the researchers used estimation models to predict the appropriate N application level and grain yield (19, 20). Ding et al. (21) and obtained the spatial distribution of soil production potential of rice based on the rice production potential estimation model obtained from field experiments in Shanghai of the Taihu lake region. Zhu and Zhang (22) establish a relationship model between various soil N indexes and the appropriate N application level of rice yield in Changshu in the Taihu Lake region through field experiments and coupled this model with the spatial distribution of soil N indexes in the study area to predict the spatial distribution characteristics of the appropriate N application level of rice yield in Changshu city.
In addition to the effect of cultivated land quality on NUE of crops, N application also has a significant effect on NUE. Studies show that the NUE of wheat and rice decreased significantly as N application increased (23, 24). Yan et al. (25) conducted continuous experiments in the Taihu Lake region from 2004 to 2006, demonstrating that the NUE of wheat decreased from 36.0 to 27.8% and that of rice decreased from 46.1 to 32.4% as the N application increased from 100 to 350 kg ha−1. In recent years, researchers have improved wheat and rice varieties through genetic and direct breeding to increase the potential of NUE of crops (26, 27). To improve crop yield, researchers typically select “high-nitrogen efficiency” crop varieties with yield growth potential under higher N fertilizer levels (28, 29). Compared with the past, the improved wheat and rice varieties exhibit improved N absorption and accumulation capacity and increased yield, NUE, and harvest indices (30).
According to the statistics, the amount of fertilizer used in Changshu of the Taihu Lake region was 25,800 t in 2003, and the amount of fertilizer decreased slightly to 24,400 t in 2017. However, the cultivated land area was significantly reduced, resulting in a continuous increase in the amount of fertilizer applied on the unit cultivated land area (31, 32). Xu et al. (33) confirm that, in the past 36 years, the amount of cultivated land in this region has decreased, and the soil fertility has also been significantly improved through the historical investigation and evaluation results of soil fertility of cultivated land in this region. Previous studies show that the improvement of soil N or integrated fertility increase the soil N dependence rate and decrease the N contribution rate of crops, indicated that crops in high-fertility farmland accumulate more N due to soil fertility but less N derived from N fertilizer compared with the crops in low-fertility farmland, which result in lower NUE (34, 35).
Although 3S technology has been widely used to characterize the spatial distribution of quantity and soil fertility of cultivated land as well as to predict crop yield and appropriate N application level, it has not been used in the analysis and prediction of NUE based on the spatial coupling of soil fertility and N application level. In addition, the temporal and spatial variation characteristics of rice and wheat NUE and their main driving factors during specific time periods remain unclear.
In this study, RS interpretation and GIS were used to obtain the spatial distribution characteristics of the integrated fertility index (IFI) calculated by multiple soil feature indices and NA in a typical area of the Taihu Lake region. Test fields with different integrated fertility were selected to perform NUE tests of rice–wheat rotation. The purpose of this study is to (1) construct comprehensive quantitative relationship models among IFI, nitrogen application level (NA), and NUE of rice and wheat; (2) reveal temporal and spatial variation characteristics of NUE in rice and wheat rotation during the recent 15 years; and (3) reveal the driving factors of temporal and spatial variation characteristics of NUE. This study hopes to propose a spatial-temporal coupling model of NUE variation on the county scale of the Taihu Lake region and its driving factors to provide a scientific basis for the realization of regional N fertilizer reduction and efficiency improvement.
Changshu city (31°33′-31°50′ N, 120°33′-121°3′ E) is located in the Yangtze River Delta region with a developed economy and drastic land use changes. The city has jurisdiction over eight towns, including Meili, Haiyu, Guri, Shajiabang, Zhitang, Dongbang, Shanghu, and Xinzhuang (Figure 1), and has a total area of 1,301.25 km2 (including the Yangtze River area) with a total population of 1.51 million. This region has a subtropical monsoon climate with four distinct seasons and a mild climate with an annual precipitation of 1601.1 mm and an average annual temperature of 17.1°C. In this area, except for Yushan, Gushan, Fushan, and other hills, the terrain is low and flat. In addition, the water network is interwoven, and the altitude is generally 3–7 m. The parent materials of the soil are mainly alluvial deposits of the Yangtze River, ancient alluvial loessal materials, lake sediments, quartz sandstone eluvial deposits, and slope deposits. The soil types mainly include paddy, alluvium, and yellow brown soils (36). According to the 2017 Statistical Yearbook of Changshu city, the planting area of crops in Changshu city was approximately 64,100 ha. Grain, vegetables, fruits, and oil crops account for 59.1, 37.4, and 2.0, respectively, and cereal accounted for 96% of the cultivated area of grain crops. The annual yield per unit area of grain crop was 6.75 t ha−1, whereas that of wheat and rice was 4.30 and 9.10 t, respectively. The total annual quantity of fertilizers, including nitrogen, phosphate, potassium, and their compound fertilizers, was approximately 23,700 t (converted into NPK elemental equivalents) (31).
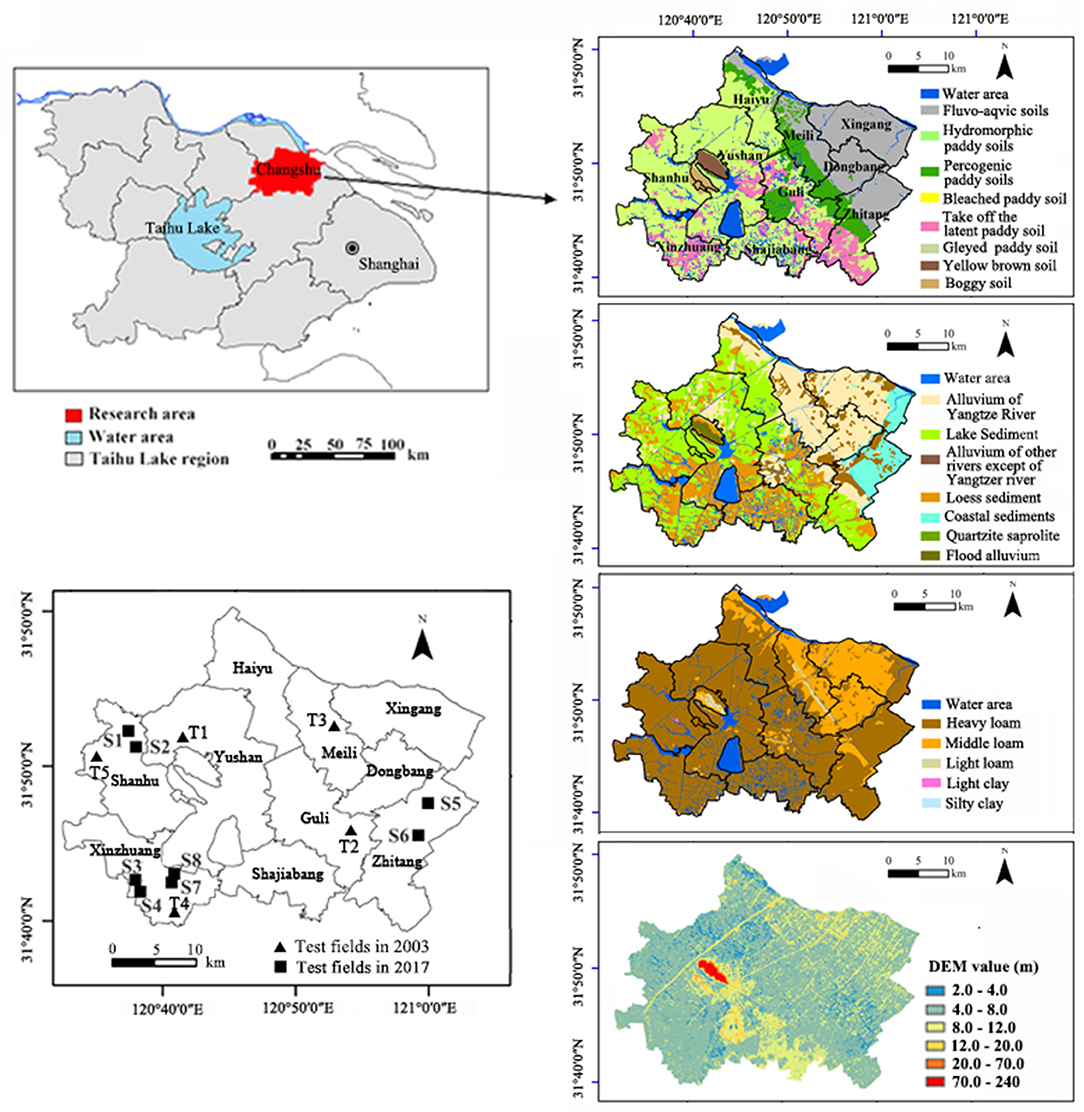
Figure 1. Location and soil properties of the research area.
Based on SPOT-4 satellite (20 × 20 m) images of the research area in 2003 and Gaofen-1 satellite (16 × 16 m) images of the research area in 2017, the RS interpretation method was used to obtain the number of different land use types in the research area in 2003 and 2017, including cultivated land, residential areas, industrial mines, garden plots, and forestland (Figure 2). The spots of cultivated land in 2003 and 2017 were selected as the units of IFI spatial analysis for the two periods, and the paddy lands in cultivated land were selected for the spatial analysis of NA and NUE.
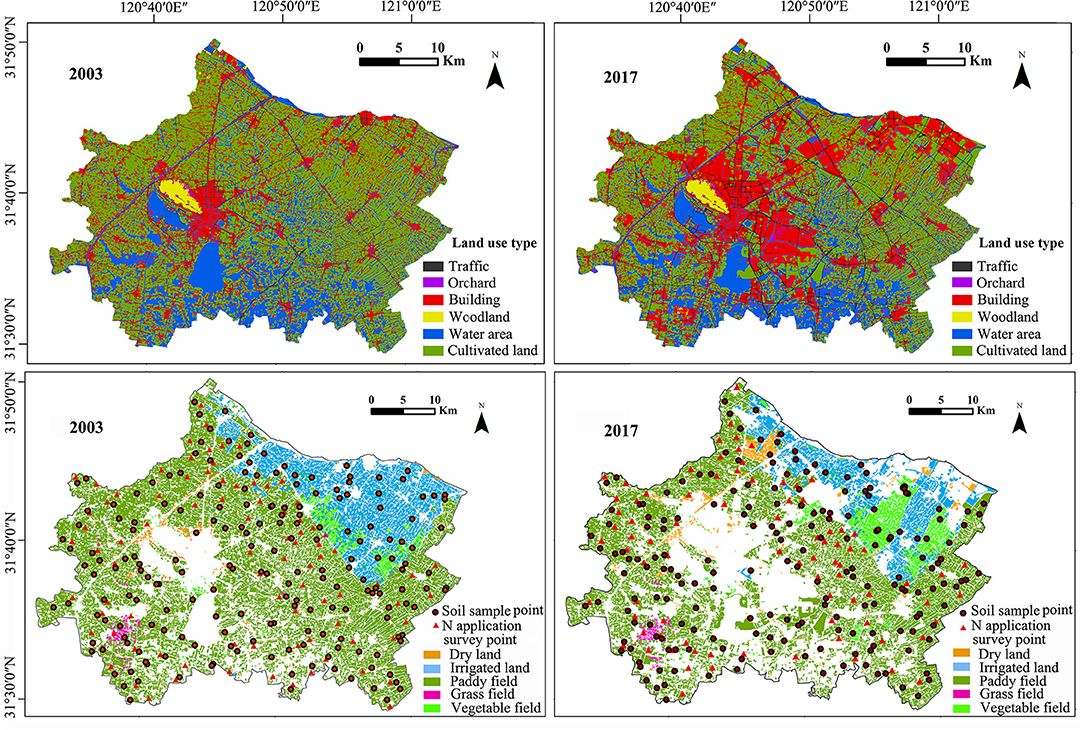
Figure 2. Spatial and temporal variation of land use and the cultivated land quantity of rice and wheat rotation in the research area in 2003 and 2017.
In May 2003 and October 2016, 195 and 199 surface soil samples were collected from cultivated fields of Changshu city considering all soil types, land use types, and the spatial uniformity of sampling points. The digitized soil-type map with a spatial resolution of 1:50,000 was superimposed with the cultivated land-type map in 2003 to obtain the patch unit of soil species and cultivated land. On this basis, soil-sampling points in 2003 were selected considering the uniformity of spatial distribution. The coordinates of soil-sampling points in 2017 should be as consistent as possible with those in 2003. Soil-sampling points that cannot be sampled due to changes in land-use types will be adjusted to nearby cultivated land. There were eight soil fertility evaluation indexes of soil samples in the two periods were determined, including soil organic matter (SOM), total nitrogen (TN), total potassium (TK), available potassium (AK), available phosphorus (AP), pH, clay content (CLAY), and sand content (SAND), and used to evaluate the IFI of cultivated land in 2003 and 2017. The Kjeldahl method was used to determine TN, sodium hydroxide melting and flame photometry were used to determine TK, electrothermal plate heating and potassium bichromate titration were used to determine SOM, sodium bicarbonate extraction and the molybdenum antimony anti-spectrophotometric method were used to determine AP, and ammonium acetate extraction and flame photometry were used to determine AK. The soil pH and texture were determined by potentiometric and wet screening methods (37).
The integrated index method is the most commonly used to quantitatively evaluation of soil fertility (38). According to different methods to determine the weight of indexes, IFI evaluation can be divided into the methods of Delphi, correlation, principal component analysis, Nemerov index, gray correlation analysis, and fuzzy membership degree (39). The fuzzy membership degree method was used to evaluate the integrated fertility of cultivated land in this study, and it includes the following basic steps (40). (1) The membership function and degree Fij of eight soil fertility evaluation indexes were given according to the existing research results and combined with the characteristics of the research area. (2) The correlation coefficient matrix is constructed using the correlation coefficient between evaluation indexes of IFI. Then, the average value of the correlation coefficient between a certain index and other indexes is calculated, and its weight wij is obtained through normalization. (3) Calculate the sum of the product of index weight wij and membership Fij of eight evaluation factors.
The formula used to calculate the IFI of cultivated soil is as follows:
Here, IFI (i) is the IFI of test fields, and i and j are the number of the test field and the soil feature index, respectively. The values of i ranged from one to eight, and the values of j ranged from one to eight. Wij and Fij are the weight and the fuzzy membership degree of the soil feature index j, respectively (Table 1).
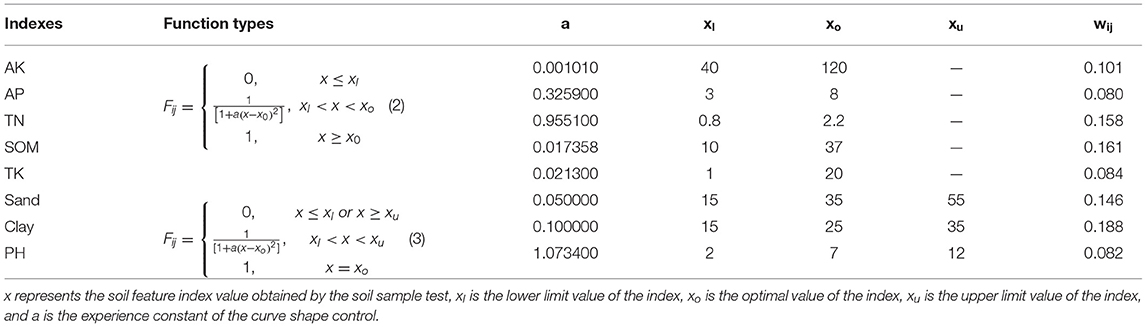
Table 1. Membership function type and related parameters (33).
The N application level of rice–wheat rotation in Changshu in 2003 and 2017 was provided by the Changshu Protection Station of Cultivated Land Quality. There were 92 survey points of N application in 2003 and 89 points in 2017. In each rice and wheat season, the Changshu Cultivated Land Quality Protection Station conducts assessments and provides statistics on the N application level of major grain production contractors in each town. We confirmed the validity of the data through interviews and telephone visits. Farmers in both 2003 and 2017 applied fertilizer by stages in the rice–wheat seasons. In 2003, fertilizers included ammonium bicarbonate (17% N), urea (46% N), and compound fertilizer (15%−20% N). In 2017, fertilizers included urea and compound fertilizers. The fertilizer applied in two time periods was reduced to the pure quantity of N, and the kriging method was used for spatial interpolation to obtain the spatial distribution characteristics of N applied in wheat and rice in two time periods.
From 2003 to 2006, Yan (41) performed field tests on the NUE of rice–wheat rotation in the research area, which included five fields with different soil types in Guli, Yushang, Meili, Shanghu, and Xinzhuang, separately (Table 2). The topsoil (0–0.2 m) samples were collected from all test plots before sowing and fertilization and determined using the same detection methods as in the integrated fertility survey. N application rates of 0, 100, 150, 200, 250, 300, and 350 kg ha−1 for wheat and rice were used in the field test. N fertilizer was split into three fertilizations of basal, jointing, and earing fertilizers at a ratio of 4:3:3, and 60 kg ha−1 P and 120 kg ha−1 potash fertilizers were applied as basal fertilizer once. N, P, and potash fertilizers were applied to test fields in the form of urea, Ca(H2PO4), and KCl, respectively. Four replicates of the field test were performed, and the area of each plot was 6 × 5 m. In each test field, wheat, rice straws, and grains above ground were harvested and measured. The straw and grain samples were dried to a constant weight in an oven at 75°C and then ground. The total N content of straw and grain samples was determined using the Kjeldahl method.
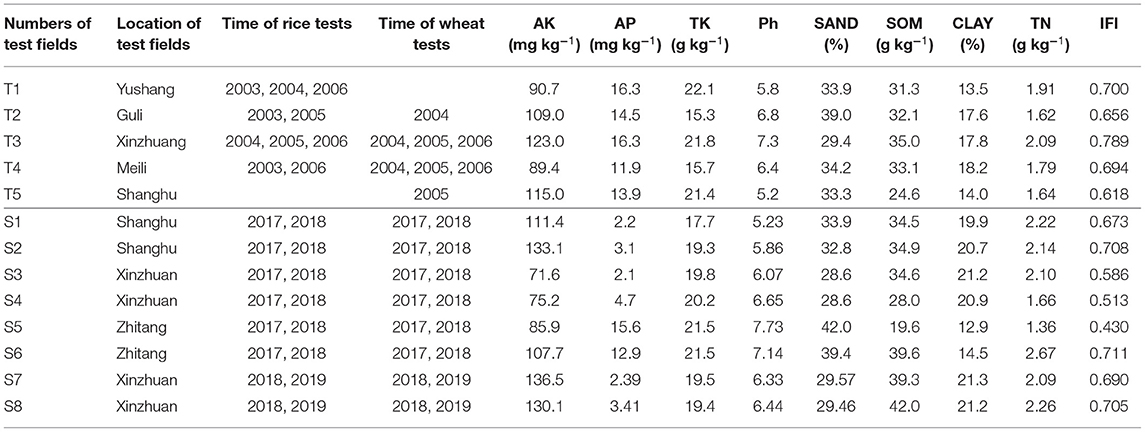
Table 2. The numbers, soil types, and properties of the test areas in 2003 and 2017 (41).
Based on different soil types and integrated fertility in Changshu, eight rice–wheat rotation test fields were selected from six natural villages in 2017–2019 (harvest time) (Figure 1). The topsoil samples of the test fields were collected before wheat sowing and fertilization in the first section. The sowing, fertilizing, and planting of wheat and rice were all carried out manually and were consistent with customary methods of local farmers. Before planting wheat and rice, the test fields were plowed mechanically. These tillage and fertilization managements were consistent with those of 2003 field test. The wheat was first sown and harvested in October 2016 and May 2017, respectively (Table 2). The rice was planted artificially 30 days after the wheat harvest. Here, 0, 100, 200, and 260 N kg ha−1, N fertilizer applied to wheat in each test field in 4:2:4 stages. The rice N application rates were 0, 100, 200, and 300 N kg ha−1. P fertilizer (P2O5) and potassium fertilizer (K2O) were applied as base fertilizers at a time of 60 kg·ha−1. Three repeated test plots were set for each N application treatment with an area of 2 × 10 m. The collection and treatment methods of wheat and rice samples were consistent with those employed for the 2003 tests.
The NUE of crop production reflects the recovery of N fertilizer in crop aboveground biomass and is defined as follows (25):
where UN is the plant N uptake (kg ha−1) measured in aboveground biomass at physiological maturity in a plot that received N at the rate of FN (kg ha−1), and U0 is the N uptake measured in aboveground biomass in a plot without the addition of fertilizer N.
The quantitative relationship models among NUE, NA, and IFI were fitted for wheat and rice. Based on the results of field tests in 2017, multiple regression analyses between the independent variables of NA and IFI and the dependent variables of NUE of wheat and rice were performed, respectively. The quantitative relationship models of wheat and rice NUE in 2003 were constructed by the same method, and the independent and dependent variables required for model fitting were obtained from the published literature (22, 41). To achieve the same dimensionless value as the IFI (ranging from zero to one), the NA was converted to the dimensionless value of the N application ratio (NR), calculating by dividing NA by the maximum N application levels in the field tests of wheat and rice in 2003 and 2017, respectively.
Among the primary, quadratic, and logarithmic polynomial models fitted, the polynomial with the highest determination coefficient R2 and the best-fitting effect (P-value) were selected as the comprehensive quantitative models of NUE, NA, and IFI of rice and wheat in 2 years. The fitting quantitative relationship models of NUE for 2003 and 2017 were coupled with the IFI of cultivated land and NA of rice and wheat, separately, in the two periods to obtain the spatial and temporal distribution of NUE.
ArcGIS software was used for RS image interpretation, spatial interpolation, stacking analysis, and drawing. The kriging method was used to draw spatial distribution maps of NA, IFI, and NUE. The natural break point classification method (Jenks) of ArcGIS was used to divide the IFI of two periods into four grades. R-studio version 3.4.3 (42) was used to construct quantitative relationship models of NUE, NR, and IFI and draw their three-dimensional surface diagrams. Pearson correlation coefficient analysis was used to obtain the correlation between NUE improvement and NA increase, IFI improvement, soil properties (soil type, texture, and parent material), and the digital elevation model (DEM) elevation to reveal the main influencing factors for NUE improvement of rice and wheat. Among them, the non-numerical data of soil type, texture, and parent material are first assigned with absolute values such as 0, 1, and 2, and then analyzed for their correlation.
According to the land-use maps of 2003 and 2017, the cultivated land of two periods (paddy field, dry land, and vegetable land) were selected. In 2017, the area of cultivated land was reduced by 11,796 ha, and the reduction proportion was 18.4% compared with that in 2003 (Figure 2). The main reason for the loss of cultivated land is the further expansion of industrial and mining lands in residential areas.
Among the eight IFI evaluation factors, soil AP in 2017 increased twofold compared with 2003 with the highest growth rate. The remaining three soil nutrient indexes TN, TK, and AK increased by 5.7, 32.3, and 37.1%, respectively (Table 3; Figure 3). In terms of spatial distribution, the content of TK, AK, and AP in the northeast of the study area was significantly increased compared with the southwest. According to the distribution of soil types, some areas of Xingang Town and Dongbang Town in the northeast of the study area are mainly alluvial soil with high soil SAND (Figure 3), which caused the planting area of rice and wheat to decrease constantly, whereas that of vegetables increased. Although the soil N, P, and K contents increased, the average SOM content decreased by 9.1% (Table 3; Figure 3).
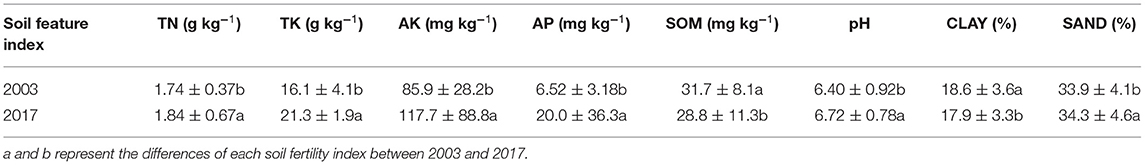
Table 3. Soil feature indexes in the study area in 2003 and 2017.
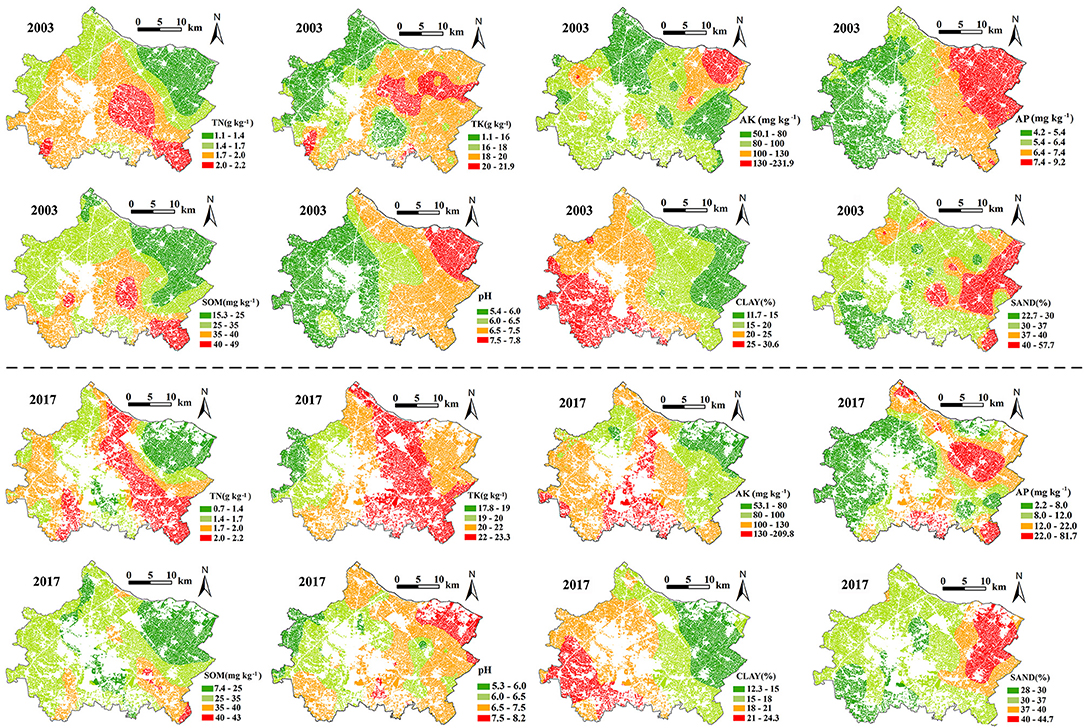
Figure 3. Spatial distribution of soil feature indexes in 2003 and 2017 in the research area.
In 2003 and 2017, the IFI of the research area showed similar spatial variation characteristics. The IFI of the cultivated land in the south was significantly higher than that of the cultivated land in the northeast (Figures 4A,B). The average IFI of cultivated land in the research area in 2003 and 2017 was 0.558 and 0.591, respectively, and the overall IFI of cultivated land in 2017 was 7.2% higher than that of 2003. Among them, the proportion of cultivated land area of grades I and II was significantly higher than that in 2003 (Table 4). Compared with 2003, the IFI of cultivated land in 2017 decreased mainly in the alluvial soil area in the northeast, accounting for 15.8%, whereas the IFI significantly increased mainly in the north and west, accounting for 20.6% (Table 3; Figure 4C).
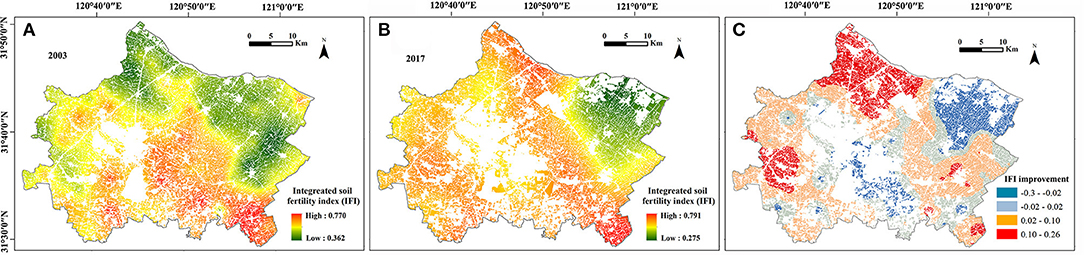
Figure 4. The spatial distribution of integrated soil fertility IFI of cultivated land in the research area. Panel (C) is based on the spatial analysis of the common part of the patch interpreted by RS in 2003 (A) and 2017 (B).
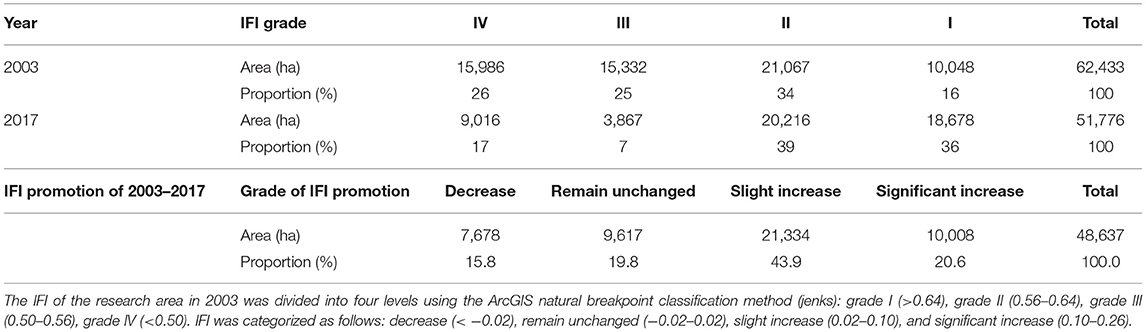
Table 4. Grade of IFI of cultivated land of 2003 and 2017.
In 2017, the NA of wheat and rice were significantly increased compared with 2003 with average increases of 35.5% for wheat and 8.4% for rice (Table 5). With the development of formula and optimal fertilization, rational fertilization according to fertility status and soil properties was advocated in the research area (43). The general suggestions in each town on fertilization were given to farmers through agricultural guidance centers and training of agricultural experts according to the soil types and properties. In addition, the fertilization amount was also affected by the fertilization habits of farmers. Therefore, the NA in the research area exhibited spatial distribution rules and variability.
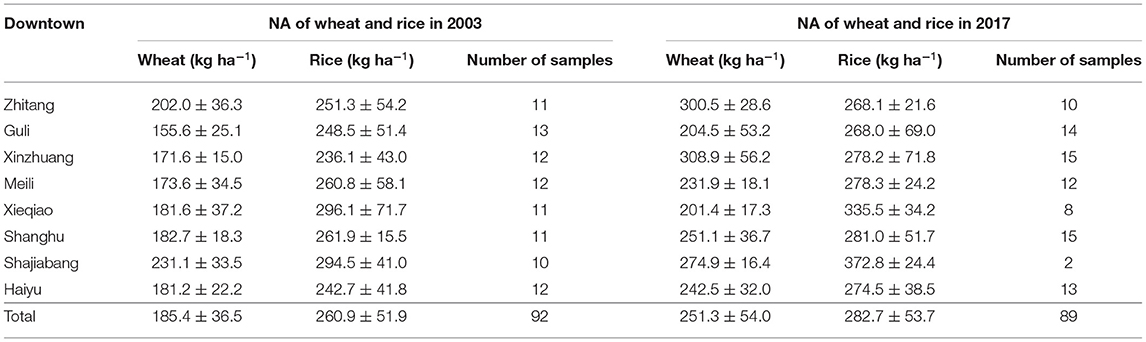
Table 5. NA survey results in each town in the research area.
By analyzing the spatial distribution of NA of wheat and rice in two periods, we found that the NA of wheat in 2003 and 2017 was generally increased in the southeast and southwest of the research area (Figures 5A,D). The areas with high NA were mainly concentrated around water areas in the central and northern research area (Figures 5B,E). In the past 15 years from 2003 to 2017, the changing trend of increased wheat NA in the research area was very obvious, presenting as a large increase in the southwest research area. The changing trend of rice NA revealed significant increases in the middle and northern areas (Figures 5G,H). In terms of rice–wheat rotation, the total NA was increased in the north of the research area in 2003 but increased in the southwest of the research area in 2017 (Figures 5C,F).
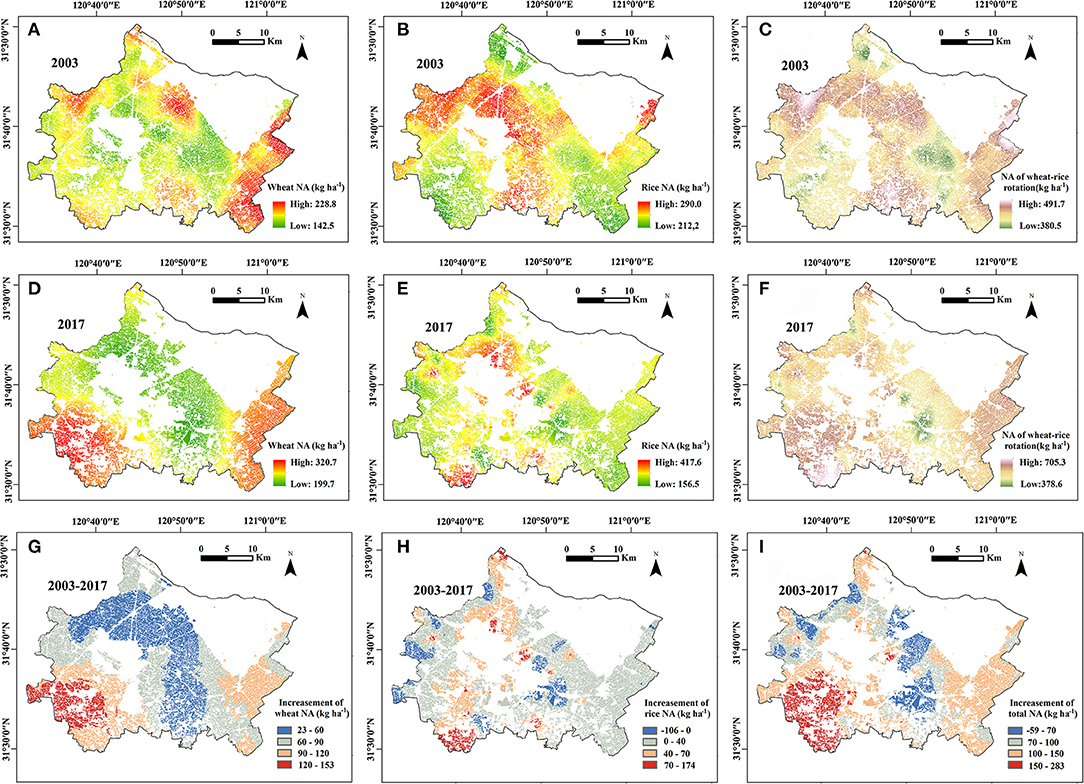
Figure 5. Spatial and temporal variation characteristics of NA in the research area in a recent 15-year period. Panels (G–I) used the common part of RS interpretation patches of cultivated land of rice–wheat rotation in 2003 (A–C) and 2017 (D–F) as the basis for spatial analysis.
The results of the field experiment showed that NUE of rice and wheat decreased as NA increased in both 2003 and 2017. In addition, the mean NUE of each N application treatment in 2017 was higher than that in 2003 (Figure 6). According to the results of the field test in 2017, comprehensive quantitative relationship models of NUE, NA, and IFI of wheat and rice were obtained using the multiple regression simulation method (Figures 7A,B). Among the primary, quadratic, and logarithmic polynomial models, the quadratic models exhibit the best-fitting effect and the highest determining coefficient R2 based on the results of field tests from 2003 to 2006. The same methods of integrated soil fertility evaluation and model construction were used to fit the quantitative relationship models of NUE of wheat and rice in 2003 (Figures 7C,D). According to the coefficients of the comprehensive quantitative relationship equation of NUE of wheat and rice, NA and IFI have negative quantitative relationships with NUE, indicating that increases in NA and IFI both inhibited NUE improvement.
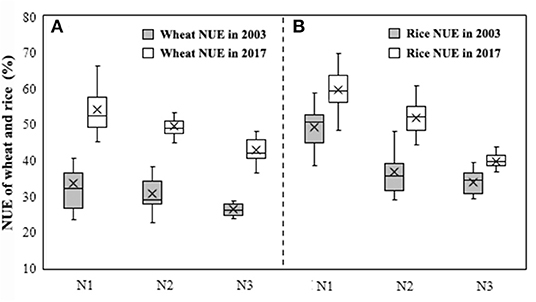
Figure 6. NUE of wheat and rice under different NA treatments conducted in 2003 (A) and 2017 (B).
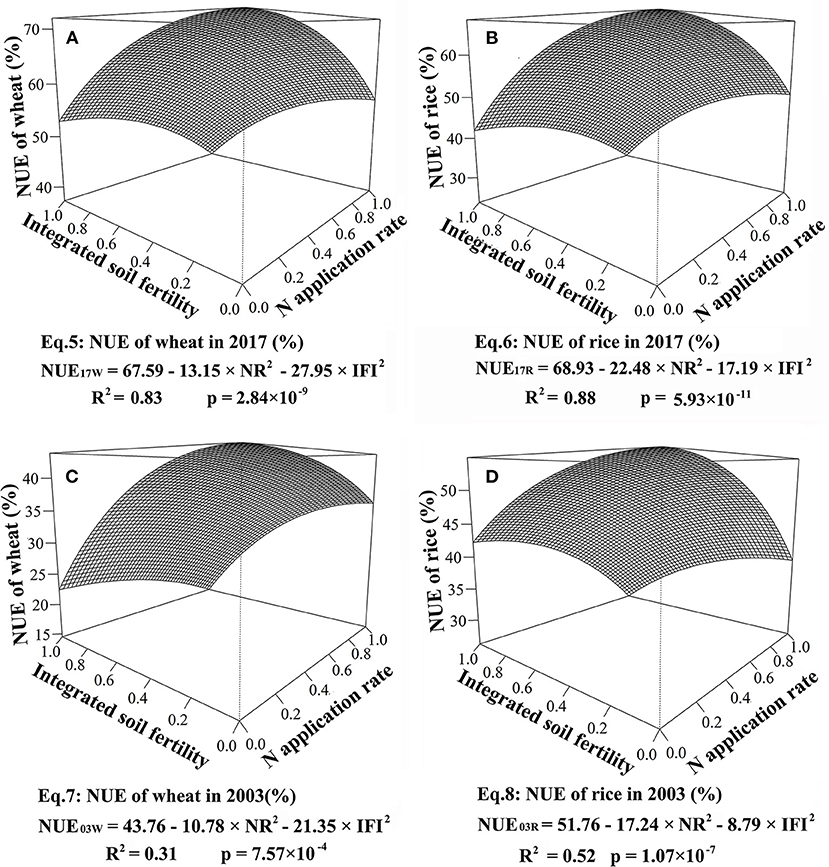
Figure 7. Fitting trend surfaces of NUE of wheat and rice with the IFI and NR. The equations are multiple regression models for these fitting trend surfaces. The NUE03W, NUE03R, NUE17W, and NUE17R were the N-use efficiency of wheat and rice in 2003 (C,D) and 2017 (A,B), respectively.
The quantitative regression model of rice and wheat NUE employed spatial coupling with the spatial distribution of IFI and NA of the two periods to obtain the spatial-temporal variation characteristics of wheat and rice NUE in the recent 15-year period. Spatial superposition analysis of NUE in the two periods showed that NUE of wheat and rice in 2003 and 2017 was significantly lower in the southwest compared with the middle and northeast (Figures 8A–D). N use efficiency of wheat and rice in the northeast study area was significantly improved in the 15-year period (Figure 8E). The NUE of wheat and rice increased by 9.7 and 2.5%, respectively, on average. The total NUE of rice and wheat was 5.8%. The area of NUE significantly increased (6.5%−15.6% improvement) in the research area, accounting for 41.3% of the total area and mainly concentrated near the central and northern waters. Due to the higher NA and IFI in Xinzhuang Town in the southwest of research area, the NUE increase slightly or even decreased in this area (Table 6).
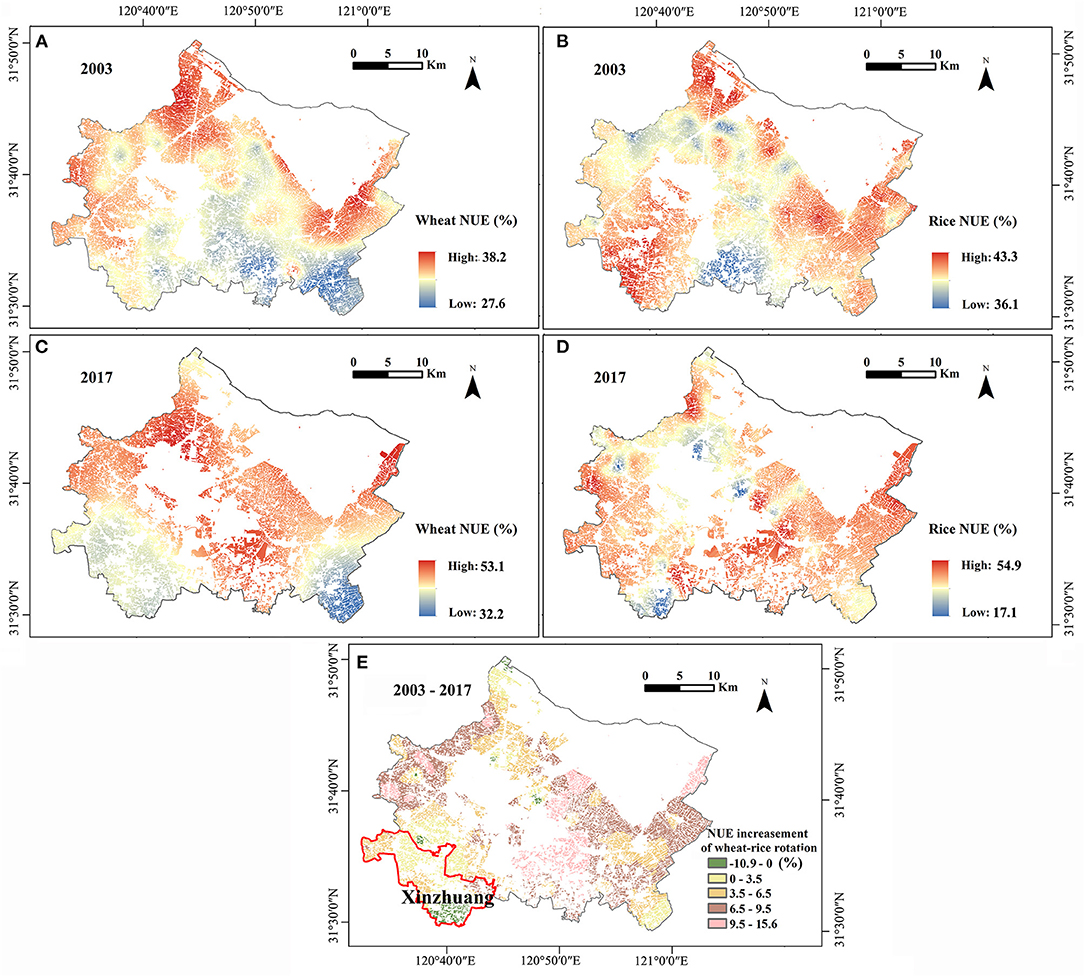
Figure 8. (A,B) Shows the proportion of NUE increase of wheat and rice in 2003. (C,D) Shows the proportion of NUE increase of wheat and rice in 2017. (E) Shows the proportion of NUE improvement of rice-wheat rotation. IFI improvement of various soil properties.
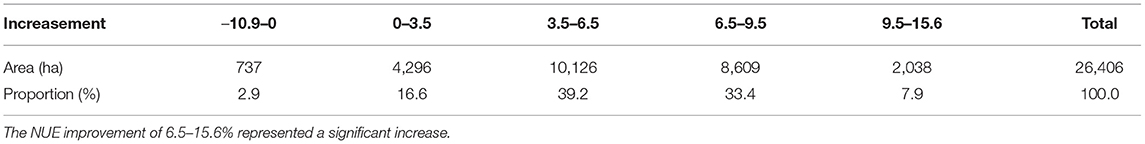
Table 6. The quantity and proportion of NUE improvement of rice and wheat rotation from 2003 to 2017.
The results of the correlation analysis show that NUE improvements in rice and wheat significantly correlated with increased NA and IFI (P < 0.01). The correlation coefficients of NUE improvement of rice–wheat rotation with NA and IFI increases were −0.885 and −0.545, respectively, indicating that the increase in NA has more influence on the spatial distribution of NUE improvement than IFI. The main reason is that NA in rice and wheat rotation in 2017 increased by 22.9% compared with that in 2003, and IFI increased by 7.2%. The spatial variability of the increase in NA was greater than that of IFI (Figures 4C, 5I).
Correlation analysis results show that the DEM in the research area has a significant correlation with IFI increase and NUE improvement. The main reason for this finding is that the southern part of the research area is low-lying and has better water and fertilizer pooling effects, which is more conducive to the improvement of IFI (33). In addition, the N application level in cultivated land near lakes and waters with small DEM in the study area tends to be higher. For example, N application in the rice season is increased compared with that in other regions, which may also be an important reason for the significant correlation between DEM and IFI (Figure 1).
The soil type, texture, and parent material also significantly influence NUE improvement of rice–wheat rotation (P < 0.05) (Table 7). Among the five soil parent materials in the research area, the IFI increase of soil formed by alluviums and sediments, such as the Yangtze River, other rivers and lakes were significantly increased compared with the soil formed by loessal sediments and coastal sediment (Figure 9A). Among the five soil textures in the research area, the IFI increase of light clay was the greatest, followed by medium and heavy soil (Figure 9B). The IFI of five paddy soils was significantly improved in the eight different soil types in the study area. Among them, the IFI increase of bleached and hydragric paddy soil was relatively large, which is increased compared with that of gray tide soil and yellow brown soil, respectively (Figure 9C).
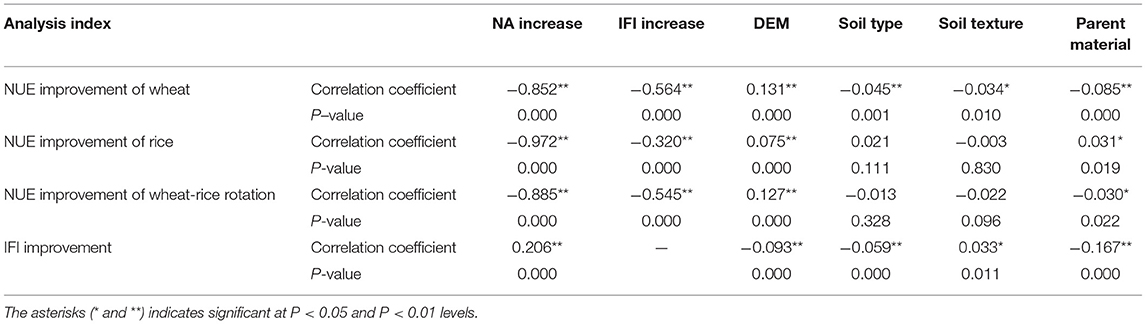
Table 7. Correlation analysis results of NUE improvement with various influencing factors on rice and wheat rotation in research area.
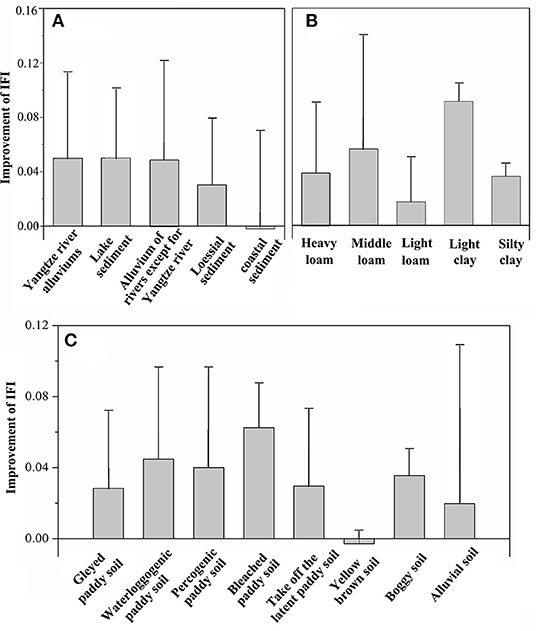
Figure 9. (A–C) Shows the NUE improvement of rice and wheat in different oil parent materials, textures, and types, respectively. Temporal and spatial variation of NUE of rice and wheat in the research area. In Figure 8E, the common part of RS interpretation patches of cultivated land of rice and wheat rotation in 2003 and 2017 served as the basis for the superposition analysis.
The results of this study show that the application of large amounts of fertilizers is the main reason for the improvement of soil fertility in study area. However, long-term application of fertilizers will result in the imbalance of soil nutrient proportion (44). Previous studies suggest the combination of organic and inorganic fertilizer is the best fertilization method to improve SOM content (45–47). Based on the investigation of N application in rice–wheat rotation farmland in the Taihu Lake Region in 2006 and 2011, Zhou et al. (48) found that the proportion of large-scale planting increased, and the contract management continuously expanded in this region. Thus, the N application exhibited a pattern of urea-dominated, increased high-concentration compound fertilizer, gradually reduced ammonium bicarbonate, and generally abandoned organic fertilizer. In 2006, the amount of organic fertilizer applied to rice and wheat accounted for 1.8 and 2.6% of the total amount of fertilizers, respectively. By 2011, the proportion of organic fertilizer applied to rice and wheat was zero. Hu et al. (49) noted that paddy soil in the plains of the middle-lower reaches of the Yangtze River has an approximate 18.3 g kg−1 of improvement space for SOM.
In addition, the expansion of vegetable planting area in the northeast of the study area resulted in a sharp increase in soil AP and AK contents. According to existing research, vegetables exhibit an increased demand for P fertilizer than crops. To pursue the higher yield and quality of vegetables, farmers often apply excessive P fertilizer, which may be the main reason that soil P contents in the vegetable fields are significantly increased compared with crop fields (50).
Some studies show that the improvement of rice and wheat varieties can improve their grain yield potential and the response to N fertilizer, which facilitates the effect of N fertilizer on grain yield and, thus, improves the NUE (4, 22, 51). In addition to variety, crop NUE was also significantly affected by factors, such as N application, soil fertility, tillage, and N fertilization management (52). In this study, the fertilization methods of wheat and rice field tests in 2017 and 2003 were all divided into three fertilizations, and the tillage management measures were also consistent. Therefore, tillage and N fertilization management were not the main causes of NUE changes in the two periods.
According to the comprehensive quantitative relationship models of NUE with NA and IFI in two periods of this study, NA and IFI were negatively correlated with NUE of wheat and rice. Almost all the existing research showed that the increase of NA results in the increase of N fertilizer loss through nitrification and denitrification, ammonia volatilization, leaching, and then reduce crop NUE (53, 54). In addition, some studies suggest that the increase of IFI results in the decrease of NUE. The main reason is that the improvement of soil fertility reduces the proportion of crop N accumulation to fertilizer N and increases the proportion of crop N accumulation to soil N [Patrick et al., (55, 56)]. In the context of the NA and IFI improvements noted above, if the comprehensive quantitative relationship models fitted by wheat and rice varieties and field test results in 2003 did not change, the NUE of wheat and rice would decrease by 3.3 and 2.6%, respectively, and the total NUE of wheat–rice rotation would decrease by 3.0%. However, due to the improvements in crop varieties, the maximum yield of wheat and rice increased from 4.39 and 8.08 t ha−1 in 2003 to 5.51 and 9.37 t ha−1 in 2017, respectively, total NUE of rice–wheat rotation increased by 5.8%. Therefore, the improvement in rice and wheat varieties and the effect of N fertilizer on grain yield are the main driving factors for the improvement of NUE in the recent 15-year period.
The results show that DEM, soil parent materials, textures, and types all had significant effects on the NUE improvement in rice–wheat rotation. Many studies have found that terrain and elevation have great influences on soil fertility. Shen et al. (57) use the method of geostatistics and integrated soil fertility evaluation to analyze the space distribution features of soil fertility in Changshu city, and the results show that the soil nutrient content and fertility in the area significantly correlated with terrain elevation. Due to the effect of water and fertilizer collection, soil fertility is increased in low-lying areas compared with other areas. The parent material is the material basis of soil formation. In the process of soil formation, soil inherits some properties from the parent material, which can directly affect soil mineral composition and particle composition and control soil physicochemical properties and soil productivity to a large extent. Soil texture affects soil particle size and is significantly related to soil nutrient accumulation and decomposition (58). Clayey soil exhibits an increased ability to combine with soil nutrients to form organo-inorganic complexes compared with sandy soil. Therefore, increased CLAY in soil was beneficial to decrease soil nutrient mineralization and increase soil nutrient accumulation. The CLAY of loam is between that of clayey and sandy soils, which also exhibits a good soil nutrient–preserving capability (59, 60). As for the soil types, there are significant differences in soil fertilizer retention capacity due to the different soil texture of paddy, aquic, and yellow brown soil in the study area. In addition, the development degree of five different paddy soil subspecies may lead to significant differences in the potential of soil fertility improvement.
These factors affect the soil nutrient–preserving capability and, thus, affect the spatial variation of IFI and NUE improvement and have greater influence on NUE improvement of wheat than rice. The digital maps of these drivers can help in fertilization management decisions and prediction of NUE improvement potential in study areas.
To achieve the dual goal of improving crop yield and NUE, researchers performed field tests on crops to obtain the appropriate N application level with the maximum yield and economic and environmental benefits based on different soil fertilities. Studies show that, with the improvement in soil-fertility quality, the appropriate N application level for crops decreases. For high-fertility farmland, the use of N fertilizer should be appropriately reduced, which is conducive to reducing the loss of N fertilizer and improving the NUE [Chen et al (20, 61–63)]. Therefore, establishing the quantitative relationship models between the appropriate N application and IFI by conducting N fertilizer effect tests, and coupling the models with the spatial distribution of IFI to guide precise fertilization at field scale will be critical to N fertilizer reduction with increased efficiency in this area. The accuracy and applicability of the quantitative relationship model of the appropriate N application rate could be improved by setting more test fields in each town of the study area, covering more soil fertility levels and soil types. The results of exciting N fertilizer effect tests in the study area can also be used as a supplement to establish the quantitative relationship model between appropriate N application rate and IFI (1, 64). In addition, the development of a fertilization-management information system and handheld mobile terminal system based on GIS technology can provide the appropriate N application amount at field scale, which can more conveniently guide farmers to carry out precise fertilization.
This study confirms that there was a significant increase on the soil fertility of cultivated land in Changshu City of the Taihu Lake region due to long-term fertilization from 2003 to 2017, which also resulted in the imbalance of soil nutrients, including the surge in soil AP and the decrease of SOM. The comprehensive quantitative relationship of NUE constructed by conducting rice–wheat N fertilizer effect test in 2003 and 2017 showed that the increases in NA and IFI both inhibited the NUE improvement. Although the NA and IFI in 2017 increased compared with those of 2003, the total NUE of rice–wheat rotation increased by 5.8%. The main driving factors of NUE improvement in different years in the study area were the improvement of crop varieties and the increase in N fertilizer yield benefit. Both NA and IFI in the study are important drivers for the spatial distribution of NUE, and NA exhibits a greater influence than IFI. In addition, the terrain, soil type, texture, and parent material also affect the soil nutrient-preserving capability and, thus, affect the spatial variation of IFI and NUE improvement. These factors have a greater influence on NUE improvement of wheat than rice. In future work, the quantitative relationship between the appropriate N application rate for rice and wheat and IFI constructed by conducting more field tests could be coupled with the spatial distribution of IFI to obtain the spatial distribution of the appropriate N application rate, which can serve as a new method for precise fertilization and N fertilizer reduction.
The original contributions presented in the study are included in the article/supplementary material, further inquiries can be directed to the corresponding author/s.
DY and XL contributed to conception and design of the study. XL wrote the first draft of the manuscript. LM and YC wrote sections of the manuscript. XL, YC, and XW contributed to the field test, data analysis, and modelling. All authors contributed to manuscript revision, read, and approved the submitted version.
This paper was supported by the Special project of the National Key Research and Development Program (No. 2016YFD0200301), the Natural Science Foundation of China (No. 41571206), and the Special project of the National Science and Technology basic work (No. 2015FY110700-S2).
The authors declare that the research was conducted in the absence of any commercial or financial relationships that could be construed as a potential conflict of interest.
All claims expressed in this article are solely those of the author and do not necessarily represent those of their affiliated organizations, or those of the publisher, the editors and the reviewers. Any product that may be evaluated in this article, or claim that may be made by its manufacturer, is not guaranteed or endorsed by the publisher.
1. Liu ZH, Xu SS, Zhang JW, Ding YF, Li GH, et al. Effect of continuous reduction of nitrogen application to a rice-wheat rotation system in the middle-lower Yangtze River region (2013-2015). Field Crop Res. (2016) 196:348–56. doi: 10.1016/j.fcr.2016.07.003
2. Yang WL, Que HL, Wang SW, Zhu AN, Zhang YJ, He Y, et al. High temporal resolution measurements of ammonia emissions following different nitrogen application rates from a rice field in the Taihu Lake Region of China. Environ Pollut. (2020) 257:113489. doi: 10.1016/j.envpol.2019.113489
3. Qiao J, Yang LZ, Yan TM, Xue F, Zhao D. Nitrogen fertilizer reduction in rice production for two consecutive years in the Taihu Lake area. Agr Ecosyst Environ. (2012) 146:103–12. doi: 10.1016/j.agee.2011.10.014
4. Snyder R, Tegeder M. Targeting nitrogen metabolism and transport processes to improve plant nitrogen use efficiency. Front Plant Sci. (2020) 11:2330. doi: 10.3389/fpls.2020.628366
5. Xie HL, Huang YQ, Choi YYR, Shi JY. Evaluating the sustainable intensification of cultivated land use based on emergy analysis. Technol Forecast Soc Change. (2021) 165:120449. doi: 10.1016/j.techfore.2020.120449
6. Liu LY, Zheng XQ, Peng CF, Li JY, Xu Y. Driving forces and future trends on total nitrogen loss of planting in China. Environ Pollut. (2020) 267:115660. doi: 10.1016/j.envpol.2020.115660
7. Luo XJ, Feng SY, Shi XP, Qu FT. Farm households' adoption behavior of environment friendly technology and the evaluation of their environmental and economic effects in taihu basin-taking formula fertilization by soil testing technology as an example. J Nat Resour. (2013) 28:1892–902. doi: 10.11849/zrzyxb.2013.11.006
8. Lin DX, Fan HX, Hu F, Zhao HT, Luo JF. Ammonia volatilization and nitrogen utilization efficiency in response to urea application in rice fields of the Taihu Lake Region, China. Pedosphere. (2007) 17:639–45. doi: 10.1016/S1002-0160(07)60076-9
9. Zhao X, Xie YX, Xiong ZQ, Yan XY, Xing GX, Zhu ZL. Nitrogen fate and environmental consequence in paddy soil under rice-wheat rotation in the Taihu Lake Region, China. Plant Soil. (2009) 319:225–34. doi: 10.1007/s11104-008-9865-0
10. Jovarauskas D, Steponaviius D, Kemzurait A, Zinkeviius R, Venslauskas K. Comparative analysis of the environmental impact of conventional and precision spring wheat fertilization under various meteorological conditions. J Environ Manage. (2021) 296:113150. doi: 10.1016/j.jenvman.2021.113150
11. Diacono M, Castrignanò A, Vitti C, Stellacci AM, Marino L, Cocozza C, et al. An approach for assessing the effects of site-specific fertilization on crop growth and yield of durum wheat in organic agriculture. Precis Agric. (2014) 15:479–98. doi: 10.1007/s11119-014-9347-8
12. Fabbri C, Mancini M, Marta A, Orlandini S, Napoli M. Integrating satellite data with a nitrogen nutrition curve for precision top-dress fertilization of durum wheat. Eur J Agron. (2020) 120:126148. doi: 10.1016/j.eja.2020.126148
13. Vizzari M, Santaga F, Benincasa P. Sentinel 2-based nitrogen VRT fertilization in wheat: comparison between traditional and simple precision practices. Agronomy. (2019) 9:278. doi: 10.3390/agronomy9060278
14. Xu SX, He LY, Lu MX, Huang W, Chen J. On grain safety and quality evalution of cultivated land in Jiangling county of Hebei province based on GIS. Res Agric Modern. (2006) 27:148–52. doi: 10.3969/j.issn.1000-0275.2006.02.016
15. Ng W, Husnain Anggria L, Siregar AF, Hartatik W, Sulaeman Y, et al. Developing a soil spectral library using a low-cost NIR spectrometer for precision fertilization in Indonesia. Geoderma Reg. (2020) 22:e00319. doi: 10.1016/j.geodrs.2020.e00319
16. Sela S, Van Es HM, Moebius-Clune BN, Marjerison R, Kneubuhler G. Dynamic model-based recommendations increase the precision and sustainability of N fertilization in midwestern US maize production. Comput Electron Agr. (2018) 153:256–65. doi: 10.1016/j.compag.2018.08.010
17. Serrano JM, Shahidian S, Marques J. Silva spatial variability and temporal stability of apparent soil electrical conductivity in a Mediterranean pasture. Precis Agric. (2017) 18:245–63. doi: 10.1007/s11119-016-9460-y
18. Prabakaran G, Vaithiyanathan D, Ganesan M. Fuzzy decision support system for improving the crop productivity and efficient use of fertilizers. Comput Electron Agr. (2018) 150:88–97. doi: 10.1016/j.compag.2018.03.030
19. Gourevitch JD, Keeler BL, Ricketts TH. Determining socially optimal rates of nitrogen fertilizer application. Agric Ecosyst Environ. (2018) 254:292–9. doi: 10.1016/j.agee.2017.12.002
20. Xiao EZ, Chen GF, Zhao S, Fu SW. Three-dimensional visualization of soil nutrient evolution in maize precision operation area based on ArcGIS. In: Li, D., Zhao, C, editors. Computer and Computing Technologies in Agriculture XI CCTA 2017. IFIP Advances in Information and Communication Technology. Vol. 546. Cham: Springer (2019). p. 119–26. doi: 10.1007/978-3-030-06179-1_13
21. Ding MH, Yang XW, Li XG, Xue ZP. Estimation model of rice productivity potential for precision agriculture based on GIS. Chin J Soil Sci. (2006) 37:56–60. doi: 10.1016/S1872-2032(06)60050-4
22. Zhu ZL, Zhang FS editors. Basic Research on Nitrogen Behavior and Efficient Utilization of Nitrogen Fertilizer in Main Farmland Ecosystem. Beijing: Science Press (2010).
23. Yin XG, Nicolas B, Fabien F, Bruno M, Strullu L, Chlebowski F, et al. Long-term modelling of soil N mineralization and N fate using STICS in a 34-year crop rotation experiment. Geoderma. (2020) 357:113956. doi: 10.1016/j.geoderma.2019.113956
24. Xue L, Yu Y, Yang L. Maintaining yields and reducing nitrogen loss in rice-wheat rotation system in Taihu Lake region with proper fertilizer management. Environ Res Lett. (2014) 9:115010. doi: 10.1088/1748-9326/9/11/115010
25. Yan XY, Ti C, Vitousek P, et al. Fertilizer nitrogen recovery efficiencies in crop production systems of China with and without consideration of the residual effect of nitrogen. Environ Res. Lett. (2014) 9:095002. doi: 10.1088/1748-9326/9/9/095002/meta
26. Kosala R, Ashraf EK, Satinder G, Bi YM, Rothstein SJ. AMT1;1 transgenic rice plants with enhanced NH4(+) permeability show superior growth and higher yield under optimal and suboptimal NH4(+) conditions. J Exp Bot. (2014) 65:965–79. doi: 10.1093/jxb/ert458
27. Araus V, Vidal EA, Puelma T, Alamos S, Mieulet D, Guiderdoni E, et al. Members of BTB gene family of scaffold proteins suppress nitrate uptake and nitrogen use efficiency. Plant Physiol. (2016) 171:1523–32. doi: 10.1104/pp.15.01731
28. Samonte OPB, Wilson LT, Medley JC, Shannon RMP, Anna MM, Joveno SL. Nitrogen utilization efficiency: relationships with grain yield, grain protein, and yield-related traits in rice. Agron J. (2006) 98:168–76. doi: 10.2134/agronj2005.0180
29. Cheng JF, Jiang HY, Liu YB, Dai TB, Cao WX. Methods on identification and screening of rice genotypes with high nitrogen efficiency. Rice Sci. (2011) 18:52–60. doi: 10.1016/S1672-6308(11)60018-8
30. Quezada C, Hernaiz S, Vidal I, Alvarado R, Yanez W. Selection of rice genotypes (Oryza sativa) with high nitrogen agronomic efficiency in an acuic durixererts soil, central-southern Chile. Cienc Investig Agrar. (2013) 40:375–86. doi: 10.4067/S0718-16202013000200012
31. Suzhou Municipal Bureau of Statistics (SMBS) editor. Suzhou Statistical Yearbook - 2017. Beijing: China Statistics Press (2018).
32. Suzhou Municipal Bureau of Statistics (SMBS) editor. Suzhou Statistical Yearbook - 2003.Beijing: China Statistics Press.
33. Xu ZC, Yu DS, Pan Y, Wang XY, Huang JJ, Sun B. Temporal characteristics of soil fertility of cropland requisition-compensation in the typical region of Yangtze River Delta, China. Chinese Chin J Appl Ecol. (2018) 29:617–25. doi: 10.13287/j.1001-9332.201802.014
34. Friesen PC, Cattani DJ. Nitrogen use efficiency and productivity of first year switchgrass and big bluestem from low to high soil nitrogen. Biomass Bioenergy. (2017) 107:317–25. doi: 10.1016/j.biombioe.2017.10.016
35. Zhou BY, Sun XF, Wang D, Ding ZS, Li CF, Ma W, et al. Integrated agronomic practice increases maize grain yield and nitrogen use efficiency under various soil fertility conditions. Crop J. (2019) 7:527–38. doi: 10.1016/j.cj.2018.12.005
36. SCOCC (Soils census office of Changshu County). Soil Records of Changshu City, Jiangsu Province. Suzhou: Soils Census Office of Changshu County (1983).
37. Lu RK. Analytical Methods for Soil and Agro-chemistry. Beijing: China Agricultural Science and Technology Press (2000).
38. Sharma KL, Mandal UK, Srinivas K, Vittal KPR, Mandal B, Gracea JK, et al. Long-term soil management effects on crop yields and soil quality in a dryland Alfisol. Soil Till Res. (2005) 83:246–59. doi: 10.1016/j.still.2004.08.002
39. Zhang Q, Geng X. Comprehensive evaluation of soil fertility in Yanzhou District based on principal component analysis. In: Li D, Zhao C, editors. Computer and Computing Technologies in Agriculture XI CCTA 2017. IFIP Advances in Information and Communication Technology 546, Cham: Springer (2019). p. 86–93. doi: 10.1007/978-3-030-06179-1_9
40. Braimoh AK, Vlek PLG, Stein A. Land evaluation for maize based on fuzzy set and interpolation. Environ Manage. (2004) 33:226–38. doi: 10.1007/s00267-003-0171-6
41. Juan Y, Bin Y, Shaolin Z. Studies on Optimum Nitrogen Application and Improving Fertilizer-N Use Efficiency in Rice-Wheat Rotation System in Tai Lake Region (Ph.D. Dissertation). Nanjing Agricultural University, Nanjing, China (2009).
42. R Development Core Team. R: A language and Environment for Statistical Computing. Vienna: The R Foundation for Statistical Computing (2017). Available online at: http://www.R-project.org/
43. Yang LH. Study on accurate nitrogen application technology for rice in Changshu city. Shanghai Agric Sci Technol. (2014) 2:88-89. doi: 10.3969/j.issn.1001-0106.2014.02.060
44. Frana AAD, Tucher SV, Schmidhalter U. Effects of combined application of acidified biogas slurry and chemical fertilizer on crop production and N soil fertility. Eur J Agron. (2021) 123:126224. doi: 10.1016/j.eja.2020.126224
45. Leithold G, Hülsbergen KJ, Brock C. Organic matter returns to soils must be higher under organic compared to conventional farming. J Plant Nutr Soil Sc. (2015) 178:4–12. doi: 10.1002/jpln.201400133
46. Mahal NK, Castellano MJ, Miguez FE, Poffenbarger HJ, Sawyer JE, Olk DC, et al. Nitrogen fertilizer suppresses mineralization of soil organic matter in maize agroecosystems. Front Ecol Evol. (2019) 7:59. doi: 10.3389/fevo.2019.00059
47. Xu YM, Liu H, Wang XHI, Xu MG, Zhang WJ, Jiang GY. Changes in organic carbon index of grey desert soil in northwest china after long-term fertilization. J Itegr Agr. (2014) 13:554–61. doi: 10.1016/S2095-3119(13)60712-1
48. Zhou Y, Si YB, Zhao X, Wang QQ, Xu HJ, Wang SQ, et al. Situation, problems and countermeasures in nitrogen fertilization in rice/wheat rotation paddy field of Taihu Lake Watershed, China. Soils. (2012) 44:510–4. doi: 10.3969/j.issn.0253-9829.2012.03.024
49. Hu JY, Kong XB, Zhang YZ. Strategies for soil fertility improvement of arable land in China. Strategic Study of CAE (2018) 20: 84–89. doi: 10.15302/J-SSCAE-2018.05.013
50. Wang R, Min J, Kronzucker HJ, Li YL, Shi WM. N and P runoff losses in China's vegetable production systems: loss characteristics, impact, and management practices. Sci Total Environ. (2019) 663:971–9. doi: 10.1016/j.scitotenv.2019.01.368
51. Wang W, Hu B., Yuan D. Y., Liu Y. Q., Che R. H., Hu Y. C., et al. (2018). Expression of the nitrate transporter gene OsNRT1.1A/OsNPF6.3 confers high yield and early maturation in rice. Plant Cell. 30:638–651. doi: 10.1105/tpc.17.00809
52. Pullens JWM, Sørensen P, Melander B, Olesen JE. Legacy effects of soil fertility management on cereal dry matter and nitrogen grain yield of organic arable cropping systems. Eur J Agron. (2021) 122:126–9. doi: 10.1016/j.eja.2020.126169
53. Khalsa SDS, Smart DR, Muhammad S, Armstrong CM, Brown PH. Intensive fertilizer use increases orchard N cycling and lowers net global warming potential. Sci Total Environ. (2020) 722:137889. doi: 10.1016/j.scitotenv.2020.137889
54. Brentrup F, Palliere C editors. Nitrogen Use Efficiency as an Agro-Environmental Indicator. OECD Workshop on Agri Environmental Indicators, Leysin (2010).
55. Patrick C, Friesen D, Cattani J. Nitrogen use efficiency and productivity of first year switchgrass and big bluestem from low to high soil nitrogen. Biomass Bioenerg (2017) 107:317–325.
56. Liao YL, Lu YH, Nie J, Xie J, Zhou X, Yang ZP. Effects of long-term fertilization on basic soil productivity and nutrient use efficiency in paddy soils. J Plant Nutr Fert. (2016) 22:1249–58. doi: 10.11674/zwyf.15325
57. Shen R, Wang C, Sun B. Soil related scientific and technological problems in implementing strategy of “Storing Grain in Land and Technology”. Bull Chinese Acad Sci. (2018) 33:135–144. doi: 10.16418/j.issn.1000-3045.2018.02.002
58. Badagliacca G, Petrovičovà B, Pathan SI, Roccotelli A, Romeo M, Monti M, et al. Use of solid anaerobic digestate and no-tillage practice for restoring the fertility status of two Mediterranean orchard soils with contrasting properties. Agr Ecosyst Environ. (2020). 300:107010. doi: 10.1016/j.agee.2020.107010
59. Hannu K, Laura A, Yrjö S, Timo P. Growth and yield of spring cereals during transition to zero tillage on clay soils. Eur J Agron. (2011) 34: 35–45. doi: 10.1016/j.eja.2010.10.002
60. Rittl TF, Canisares L, Sagrilo E, Butterbach-Bahl K, Cerri CEP. Temperature sensitivity of soil organic matter decomposition varies with biochar application and soil type. Pedosphere. (2020) 30:336–42. doi: 10.1016/S1002-0160(20)60013-3
61. Chen J, Huang Y, Tang YH. Quantifying economically and ecologically optimum nitrogen rates for rice production in south-eastern China. Agric Ecosyst Environ. (2011) 142:195–204.
62. Lu YH, Liao YL, Zhou X, Nie J, Xie J. Yang ZP. Effect of long-term fertilization on rice yield and basic soil productivity in red paddy soil under double-rice system. Acta Pedol Sin. (2015) 52:597–605. doi: 10.11674/zwyf.2014.0310
63. Si ZY, Zain M, Mehmood F, Wang GS, Gao Y, Duan AW. Effects of nitrogen application rate and irrigation regime on growth, yield, and water-nitrogen use efficiency of drip-irrigated winter wheat in the North China Plain. Agr Water Manage. (2020) 231:2348–54. doi: 10.1016/j.agwat.2020.106002
Keywords: rice–wheat rotation, paddy soil, nitrogen use efficiency, spatiotemporal variation, driving factors
Citation: Lu X, Ma L, Yu D, Chen Y and Wang X (2021) Spatiotemporal Variation Characteristics and Driving Factors of Nitrogen Use Efficiency of Wheat–Rice Rotation Systems in the Taihu Lake Region. Front. Soil Sci. 1:745974. doi: 10.3389/fsoil.2021.745974
Received: 23 July 2021; Accepted: 27 September 2021;
Published: 04 November 2021.
Edited by:
Xiaodong Gao, Northwest A&F University, ChinaReviewed by:
Patricia Lazicki, The University of Tennessee, Knoxville, United StatesCopyright © 2021 Lu, Ma, Yu, Chen and Wang. This is an open-access article distributed under the terms of the Creative Commons Attribution License (CC BY). The use, distribution or reproduction in other forums is permitted, provided the original author(s) and the copyright owner(s) are credited and that the original publication in this journal is cited, in accordance with accepted academic practice. No use, distribution or reproduction is permitted which does not comply with these terms.
*Correspondence: Dongsheng Yu, ZHNoeXVAaXNzYXMuYWMuY24=
Disclaimer: All claims expressed in this article are solely those of the authors and do not necessarily represent those of their affiliated organizations, or those of the publisher, the editors and the reviewers. Any product that may be evaluated in this article or claim that may be made by its manufacturer is not guaranteed or endorsed by the publisher.
Research integrity at Frontiers
Learn more about the work of our research integrity team to safeguard the quality of each article we publish.