 Qian Liu
 Peipei Wang1
 Zhijing Xue
 Shaoshan An
- 1School of Geography and Tourism, Shaanxi Normal University, Xi'an, China
- 2Institute of Soil and Water Conservation, Chinese Academy of Sciences and Ministry of Education, Yangling, China
Emerging consensus is that land-use change resulting through the “Grain for Green” project has had a significant impacted on soil organic carbon (SOC), thereby probably enhancing the carbon sequestration capacity of terrestrial ecosystems. However, it remains largely unknown whether a watershed acts as a source or sink of soil carbon during the later period of ecological restoration. This study comprehensively investigated the changes of SOC stock in 2005, 2010, and 2017 along different land-use types. It was aimed to evaluate the dynamics to SOC storage capacity over different vegetation restoration maturity in the Shanghuang Watershed, China. The results showed that restoration increased the accumulation of organic carbon pools in the early stage. Significant increases in SOC stock were observed in shrubland and grassland in comparison to that in other land uses, and these two land-use types represented the optimal combination for ecological restoration in the basin. The SOC stock did not increase indefinitely during the long-term vegetation restoration process, but rather first increased rapidly with vegetation planting and reached a peak, following which it declined slightly. Therefore, pure vegetation restoration cannot maintain a permanent soil carbon sink, some measures to maintain the stability of carbon and to prolong soil C persistence are essential to take.
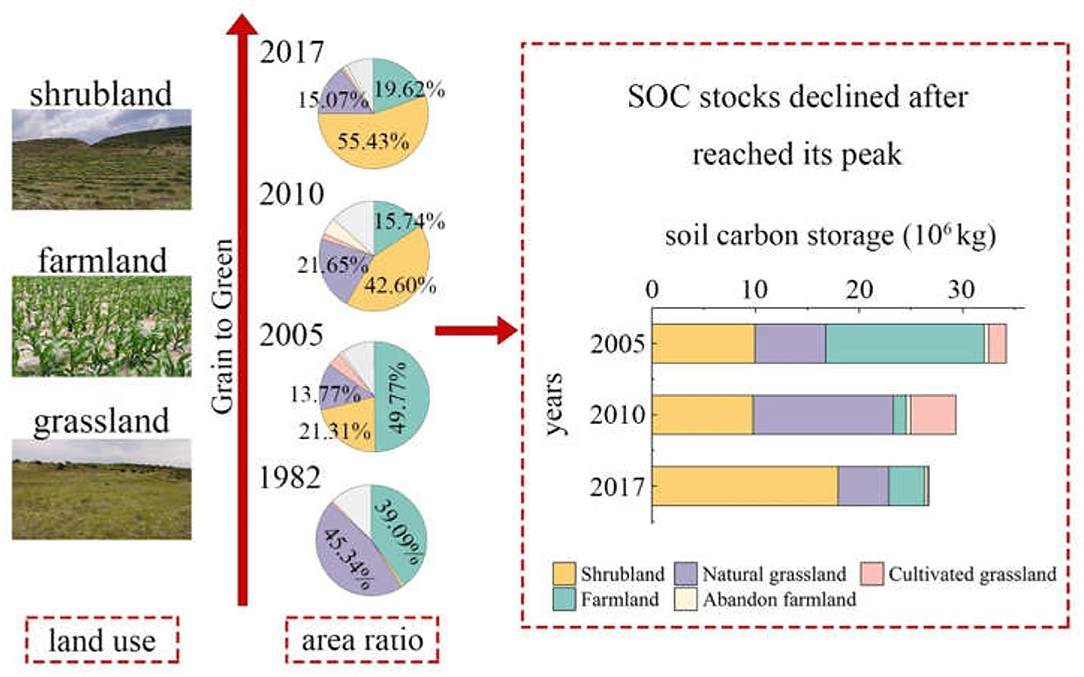
Graphical Abstract. This study comprehensively investigated the dynamics to SOC storage capacity over different vegetation restoration maturity in the Shanghuang Watershed, China. The results showed that restoration increased the accumulation of organic carbon pools in the early stage. The SOC stock did not increase indefinitely during the long-term vegetation restoration process, but rather first increased rapidly with vegetation planting and reached a peak, following which it declined slightly. Therefore, pure vegetation restoration cannot maintain a permanent soil carbon sink, some measures to maintain the stability of carbon and to prolong soil C persistence are essential to take.
Introduction
The soil carbon pool accounts for a large proportion of the total global carbon pool, and is equivalent to more than twice the terrestrial vegetation carbon pool (1, 2), and three times the size of the atmospheric carbon pool (3, 4). As a sink or source for atmospheric C, soil carbon plays an active role in maintaining the global C balance (5). The processes of soil organic carbon sequestration and decomposition are regulated by several biological factors, such as land use conversion, as well as non-biological factors (6). Wang et al. (7) reported that SOC was significantly increased at the patch scale through the transformation of farmland to shrubland and grassland. Thus, land-use conversion may directly affect the sequestration or release of carbon from soil (8, 9). Similar to the effect of land-use conversion, restoration has been shown to improve soil carbon storage and the carbon sequestration capacity of the terrestrial ecosystem (10, 11). Therefore, the question remains over whether SOC stock will continue to increase indefinitely as the maturation of vegetation restoration increases or whether an SOC capacity peak occurs. Thus, it is significant to accurately evaluate the contribution of carbon sequestration, according to the land-use conversion and vegetation restoration maturity. That is beneficial to the research of sustainable development of soil ecosystem and global climate change.
Land-use has a distinct influence on SOC storage (12), and it has been demonstrated that land-use change rather than changes to the climatic is the main reason for the increase in annual net primary production (NPP) (13). Differences in land use can result in differences in the soil ecosystem material cycling processes that affects the input and decomposition rate of soil organic matter (14), soil properties and the distribution of carbon stocks (15). A study by Fang et al. (16) suggested that the cumulative SOC contents of natural grassland and shrubland were significantly higher than those of other land uses. After reviewing 33 related publications, Laganière et al. (17) found that the conversion of cropland to plantations resulted in a 26% increase in SOC stocks. Although past studies have shown land-use changes do had critical contribution to SOC sequestrations, the subsequent effects of vegetation restoration on soil carbon sequestration remains unclear.
Similarly, the maturity of vegetation restoration also greatly influences soil C stocks (10). Several studies have found that restoration improves soil carbon sequestration and increases soil nutrients (18, 19). Vegetation restoration projects in some region have been lasted many years and improve soil carbon sequestration. For example, Cheng et al. (20) found that SOC stocks increased with the shrub–dominated revegetation time which the higher SOC stocks in 26-year-old shrubland than 16-year-old shrubland. Vegetation patches can reduce the removal of litter, and the resulting accumulation of litter results in a concurrent accumulation of soil organic carbon (21). Nevertheless, the rapid growth of vegetation may lead to the depletion of soil nutrients through the action of soil microorganisms and root uptake, resulting in the deterioration of soil quality, or even the conversion of carbon sinks into carbon sources (22). Cao et al. (22) found that the amount of litter decreases with stand age, thus reducing the amount of nutrients released into the soil. Therefore, an accurate and reliable assessment of soil carbon storage during the later stage of vegetation restoration is required to facilitate rational planning of future plantation management (23).
A change to agricultural management in the Loess Plateau, China was required during the 1950s due to increasing population pressure. A series of ecological rehabilitation projects were practiced in small watersheds to prevent further deterioration of natural ecosystems (24). For example, the “Grain for Green” project has taken the lead in the conversion of all cropland with a slope >15° to green land in Shanghuang (25) and in the planting of large areas of shrubland in study area of the current study since the 1970s (7). Several studies have since been conducted to clarify the impact of land-use change and revegetation on soil C reserves. Various studies have examined SOC stocks under grassland and shrubland at different recovery times, with results showing either increases (26, 27), reductions (28), or no changes (29). Liu et al. (30) demonstrated an increase in the average percentage of the soil C pool from 20.59 to 32.24% along a 30-year grassland restoration chronosequence. Deng et al. (31) subsequently found that soil carbon stock decreased by 2 Mg ha−1 from the mature stage (~35 years) to the post-mature stage (~45 years). However, Liu et al. (29) found no relationship between plantation age and the dynamics of SOC stocks after afforestation. Thus, the estimation of the changes to SOC storage under different land uses during the later stage of vegetation restoration is required to evaluate the sustainability of the “Grain to Green” project and to maintain soil carbon sequestration.
The present study aimed to examine the dynamics of soil carbon storage resulting from land-use changes through vegetation restoration over a period of 50 years in the Shanghuang Watershed of the Loess Plateau. With consideration of previous research results, the current study had the following objectives: (1) identify the response of the soil organic carbon stock to land-use conversion and the optimal combination of land use for C storage; (2) determine whether the increase in SOC storage with increasing maturity of vegetation restoration results in a peak, and if so, whether SOC storage subsequently stabilizes or gradually declines.
To test these hypotheses, the current study investigated the status of soil C under different land-use types from 2005 to 2017. The results of the present study can provide information for determining whether soil carbon storage can continue to increase and can give an indication of the sustainability of the “Grain to Green” project during the later stages ofvegetation restoration in small watersheds on the Loess Plateau.
Materials and Methods
Study Area
The Shanghuang Watershed is a small watershed experience nearly 50 years comprehensive management, that located in the hilly-gully region on the Loess Plateau, Guyuan, Ningxia Province (106°26′-106°30′ E, 35°59′-36°02′ N). The watershed covers an area of 8.19 km2, with an elevation ranging from 1,530 m to 1,822 m. The study area has a semi-arid climate with an average annual temperature of ~6.9°C. The annual mean precipitation of the watershed measured from 1982 to 2002 is 419 mm, of which 24% occurs in August, with the rainy season starting in July and continuing until October. The dominant soil type in the study area is classified as Loessal Cambisol by the Chinese Soil Taxonomy Research Group (32). A survey in 1982 found that the research area is characterized by broken topography, a degraded ecological environment and lagging agricultural productively (Figure 1). The loessal soil of the study area has weak cohesion, with slope runoff during the rainy season resulting in serious soil loss through water erosion (33). Soil and water conservation and vegetation restoration efforts have been conducted in the watershed since the 1970s (34), with the former achieved through land reclamation dedicated tocontrolling soil erosion and improving land quality. Since 90% of the watershed comprises of hilly land and the elevation of 51% of the watershed falls between 153.3 and 1,822.0 m, and watershed is closely dissected and sharp-edged with steep slopes (24, 35). Therefore, the land reclamation program relocated farmland situated on high slopes (>25° slope) to areas with lower slopes to facilitate the establishment of shrubland and grassland. The implementation of the “Grain for Green” program over 40 years resulted in the study area being transformed to such a degree as to be an example of successful land reclamation and comprehensive management. A field investigation in 2017 along with the study of satellite and remote sensing images determined the main land uses and vegetation species to include shrubland (Caragana korshinskii), cultivated grassland (Medicago sativa L.), and natural grassland (Artemisia gmelinii, Stipa bungeana, Artemisia scoparia, Artemisia stelleriana, Stipa grandis, Thyme, and Potentilla chinensis) (Figure 1). The presence of different land-use types is advantageous for ecological rehabilitation by improving the environment, soil and water conservation and the standard of living of the local inhabitants (35).
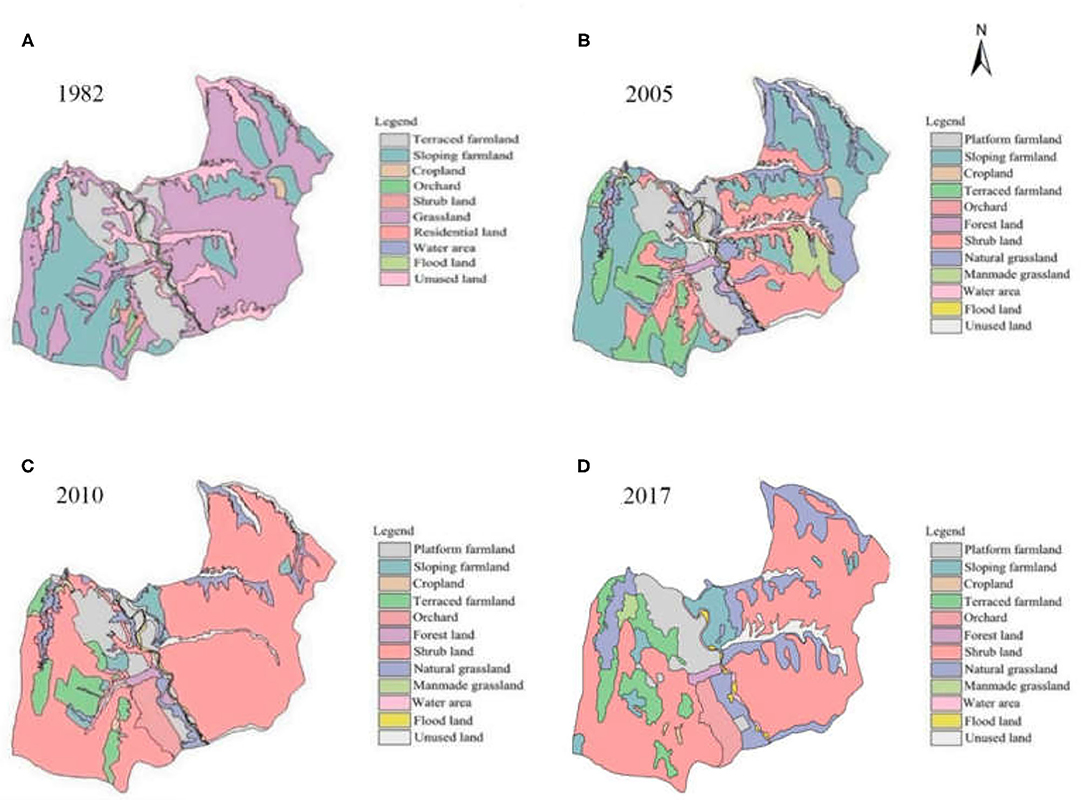
Figure 1. Land uses conversion in Shanghuang watershed from 1982 to 2017. (A) in 1982; (B) in 2005; (C) in 2010; (D) in 2017.
Analysis of land-use change was conducted in ArcGIS, with land-use data derived from digitized 1:10,000 scale topographic maps from 1982, color infrared photographs taken in 1990 and orthophotos of 2005 and land-use field studies conducted in 2010 (36). Landsat 8 remote sensing images, including Landsat bands 5, 4, and 3, were used for a precise validation of land-cover categorization for 2017. The identification of land use was improved through the use of sky map data (http://www.tianditu.gov.cn/) for comparison and supplementation. A land-use classification system was used to introduce uniformity and comparability in the study, with the primary categories including: (1) Shrubland; (2) cultivated grassland; (3) natural grassland; (4) farmland and; (5) abandoned farmland.
Soil Sampling and Laboratory Analysis
SOC data were collected by the same research team during 1987, 2005, and 2010 (Table 1). However, the sampling depths implemented differed among the different sampling periods due to differences in research aims. A total of 35 samples were collected from natural grassland in 1987, with a sampling depth of only 0–10 cm. Samples were collected at two soil depths of 0–20 cm and 20–40 cm in 2005. The sampling depths were 0–10 cm, 10–30 cm, and 30–60 cm in 2010 (42). A total of 36 samples were collected in the study area during July 2017 according to the different land use classes, with the number of samples determined by the proportion of the total area accounted for by each land use. As shown in Figure 1, most farmland was transformed to abandoned farmland with a sporadic distribution, as the distribution of shrubland was abroad. The number of samples taken from shrubland exceeded that taken from other land uses (Figure 2). Information on the location (sampling site coordinates) was recorded using a portable global positioning system (GPS) (Figure 2), with the basic information including land use, vegetation type and dominant vegetation species. A non-equidistant irregular grid method was used to collect samples, and 6–7 replicates were taken for each site using a 20 × 5 cm soil auger. A sampling depth of 0–40 cm was implemented, with the total depth divided into three layers, namely 0–5, 5–20, and 20–40 cm. Each fresh soil (1.5–2.0 kg) sample was placed into a plastic bag for laboratory analysis.
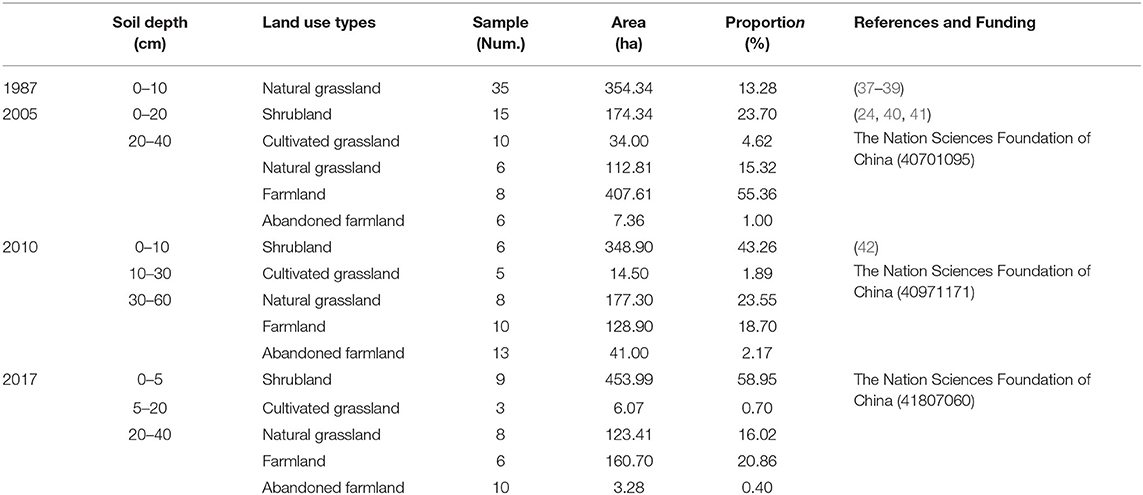
Table 1. Sampling strategies from 1987 to 2017.

Figure 2. Location of the study area and distribution of sample sites. (A) 2010; (B) 2017.
All soil samples were passed through a 2 mm sieve after air dried at room temperature. The SOC content was measured by the potassium dichromate volumetric method (43). Soil bulk density in each layer was measured by applying the core ring method to 2–3 replicates using a stainless steel cutter with dimensions of 5.0 cm in diameter and 5.0 cm in length.
Statistical Analyses
The study analyzed the variances in the effects of the different land-use types and the maturity of vegetation restoration on SOC content using one-way analysis of variance (ANOVA) (33). A significant difference level of p < 0.05 was used. In this paper, repeated sampling was conducted according to the number of sampling during statistical analysis. The mean of organic carbon content and its standard error were calculated in the sampling results. The least-significant difference (LSD) test was used to conduct multiple comparisons of SOC among the different land-use types and vegetation restoration when a significant difference was observed. All statistical analyses were performed using the software program SPSS ver. 20.0 (SPSS Inc., Chicago, IL, USA). Since the study was not able to compare non-uniform SOC data, the indices of total quantity of SOC were compared to spatial SOC values, which can eliminate the influence of different sample numbers. At the same time, the two parameters in the equation, Hi and n, eliminated the effect on the soil depth and soil layers.
Therefore, the study selected SOC density (Dsoc) and SOC storage (Ssoc) for the analysis of the storage of SOC among the five land-use types. In general, Dsoc refers to the mass of SOC contained in soil per unit area at a specific depth, which can be calculated as (26):
In Equation (1), Dsoc is soil organic carbon density (kg m−2), Ci is the gravel content on layer i (particle size >2 mm, volume%), Biis the soil bulk density in layer i (g cm−3), SOCiis the content of soil organic carbon in soil layer i (g kg−1), Hiis the thickness of the soil layer (cm), n is the number of total soil layers (cm).
Since there are non-uniform soil depth of SOC data, in order to make SOC density of 2010 comparable at the same sample depth, it is necessary to adjust the original SOC density to the top 40 cm using the depth functions. Specifically, the SOC density decreases with soil depth and the changes can be described by a function Equation (2). It could be converted to the Dsoc in the top 40 cm from the original Dsoc using Equation (3) (44, 45).
In Equations (2) and (3), γ is the cumulative proportion of the SOC density from the soil surface to the depth d (cm), β is the relative reduction rate of decrease of the SOC density with soil depth which were adopted to calculate the value of 0.9786 (44), SOC40 is the SOC density adjusted to 0–40 cm soil layer (g m−2), d0 is the original soil depth available in 2010 (cm), SOCd0 is the original soil C density (g m−2).
Ssoc refers to the total SOC stock within the region (46). To assess the Ssoc of an area with a specific land use, the following formula was applied:
In Equation (4), Ssoc represents soil organic carbon storage (kg), Si is the area of land use and Dsoci represents soil organic carbon density (kg m−2).
Result
Land-Use/Cover Change
There were considerable changes to land use in the Shanghuang Watershed from 1982 to 2017. The dynamics of land use over the entire study period could be divided into three stages (36). The land-use structure of this watershed remained relatively simple prior to 1982, with natural grassland and cultivated land being the primary land uses, cumulatively accounting for 84.42% of the total area of the main land-use types and with the area of natural grassland being the largest (Figure 3). Cultivated land occupied the dominant position between 1982 and 2005, during which the area of cultivated land increased rapidly due to increasing population pressure (42), with the area of cultivated land reaching a maximum in nearly 40 years. The establishment of a scientific research base at the same time facilitated a long-term positioning experiment to be conducted, and as vegetation was gradually restored, the area of shrubland increased sharply at a rate of 12.09 ha per year (Figure 3). The increases in the areas of farmland and shrubland were mainly at the expense of natural grassland (36). As time progressed, the area of shrubland continued to increase whereas the areas of arable land and grassland decreased significantly from 2005 to 2010. The area of shrubland increased by a factor of 1.3 from 348.90 to 453.99 ha, whereas the area of natural grassland decreased by 30.39%. Shrubland became the major land use from 2010 to 2017 (Figure 3). The area of farmland increased by 24.67% during this period, whereas there were no significant changes in the areas of the other land uses, and the landscape pattern basically stabilized as a whole (36).
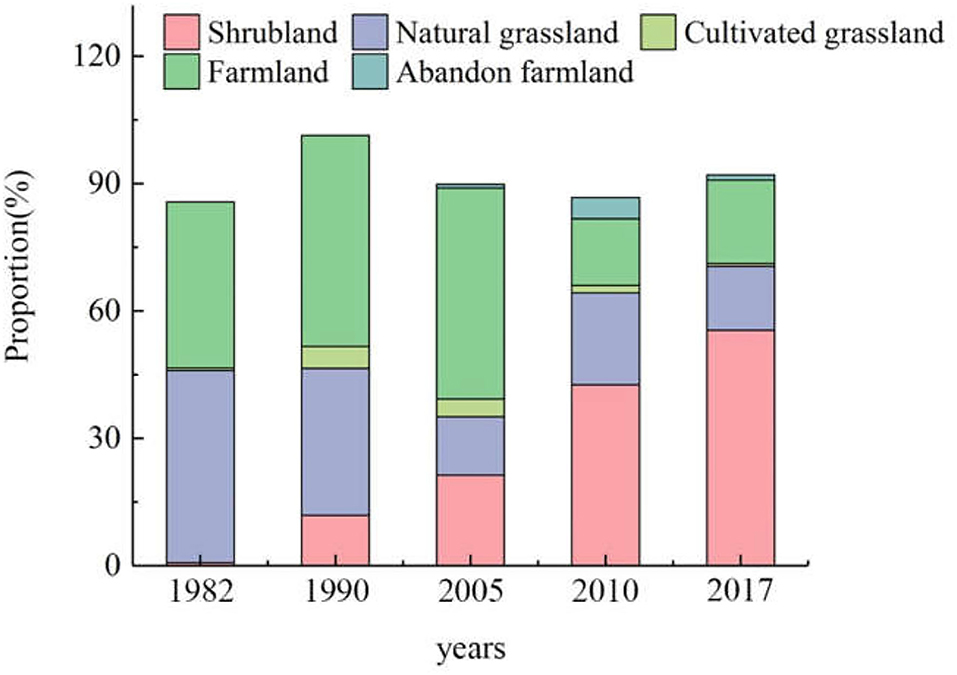
Figure 3. Change of land use structure.
Soil Organic Carbon Content and Analysis
The rank of land-use types in terms of mean SOC content was roughly (Table 2): natural grassland > shrubland > cultivated grassland > abandoned farmland > farmland. The one-way ANOVA showed that the SOC content in natural grassland and shrubland were significantly higher than those of farmland and abandoned farmland (p < 0.05). The SOC content decreased as soil depth increased among the different land-use types (p < 0.05). The highest SOC content of each soil layer occurred under the same land use. Shrubland and natural grassland showed the highest SOC content in the different soil layers in the topsoil compared with other land-use types.
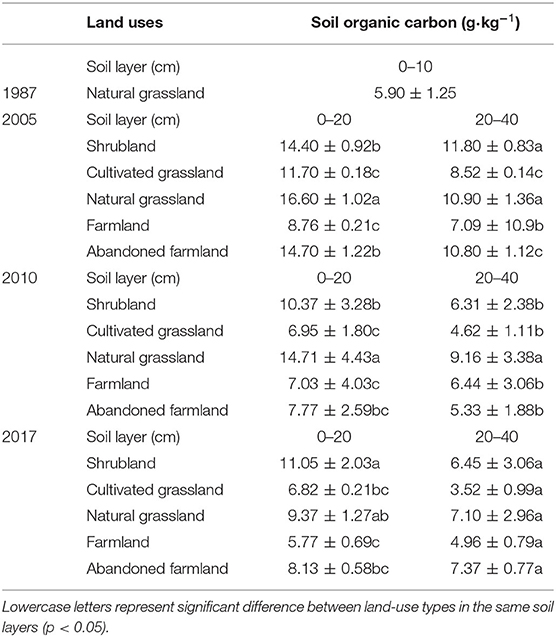
Table 2. Content of SOC in 1987, 2005, 2010, and 2017.
Soil Organic Carbon Density and Analysis
As shown in Figure 4, DSOC showed a trend of decreasing with increasing depth among maturing stages. The highest values of DSOC were found in natural grassland, shrubland and abandoned farmland in the early stages of vegetation restoration (Figure 4). Farmland showed the lowest DSOC, whereas cultivated grassland had a moderate DSOC. The change in DSOC from the surface soil to the deep soil layer was not significant, besides for natural grassland in 2010. Natural grassland showed the highest decrease in DSOC from 3.39 kg m−2 in the surface soil (0–20 cm) to 2.14 kg m−2 in the soil layer (20–40 cm), followed by shrubland, cultivated grassland, abandoned farmland, and farmland. Meanwhile, besides for natural grassland, the change in DSOC among the various land uses was also not significant. However, there were smaller differences in DSOC values among the various land uses in 2017 compared to those in 2005 and 2010.
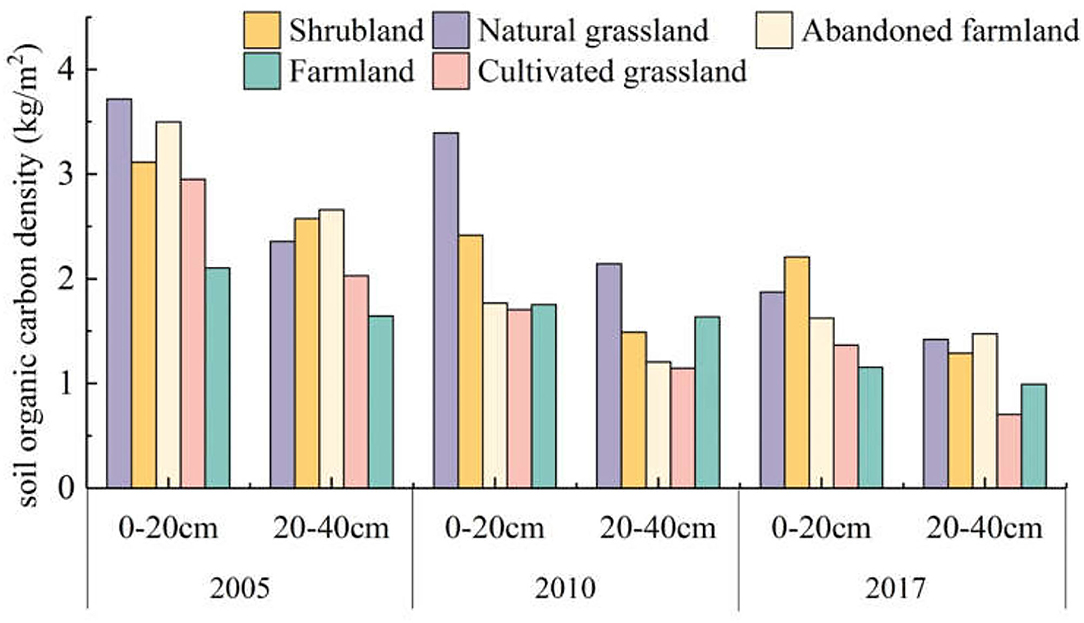
Figure 4. Soil organic carbon density among the different land-use types in 2005–2017.
Soil Organic Carbon Storage
The study further investigated the SOC storage responses among different land-use types and maturity of vegetation restoration, with the results of the analysis shown in Figure 5. The greatest changes in SOC stock occurred during the earliest stage of artificial restoration due to extensive planting of cultivated grassland and shrubbery. The SOC stock of farmland showed a decreasing trend over a cultivation period exceeding 50 years. SOC stock slightly decreased with increasing plantation period from 34.20 × 10⁶ to 29.34 × 10⁶ kg between 2005 and 2010 (Figure 5B). Nonetheless, following afforestation, the increases in SOC stock did not continue indefinitely. This result demonstrated that the SOC stock was 26,443 t in 2017, indicating a loss in C from 2010 to 2017.
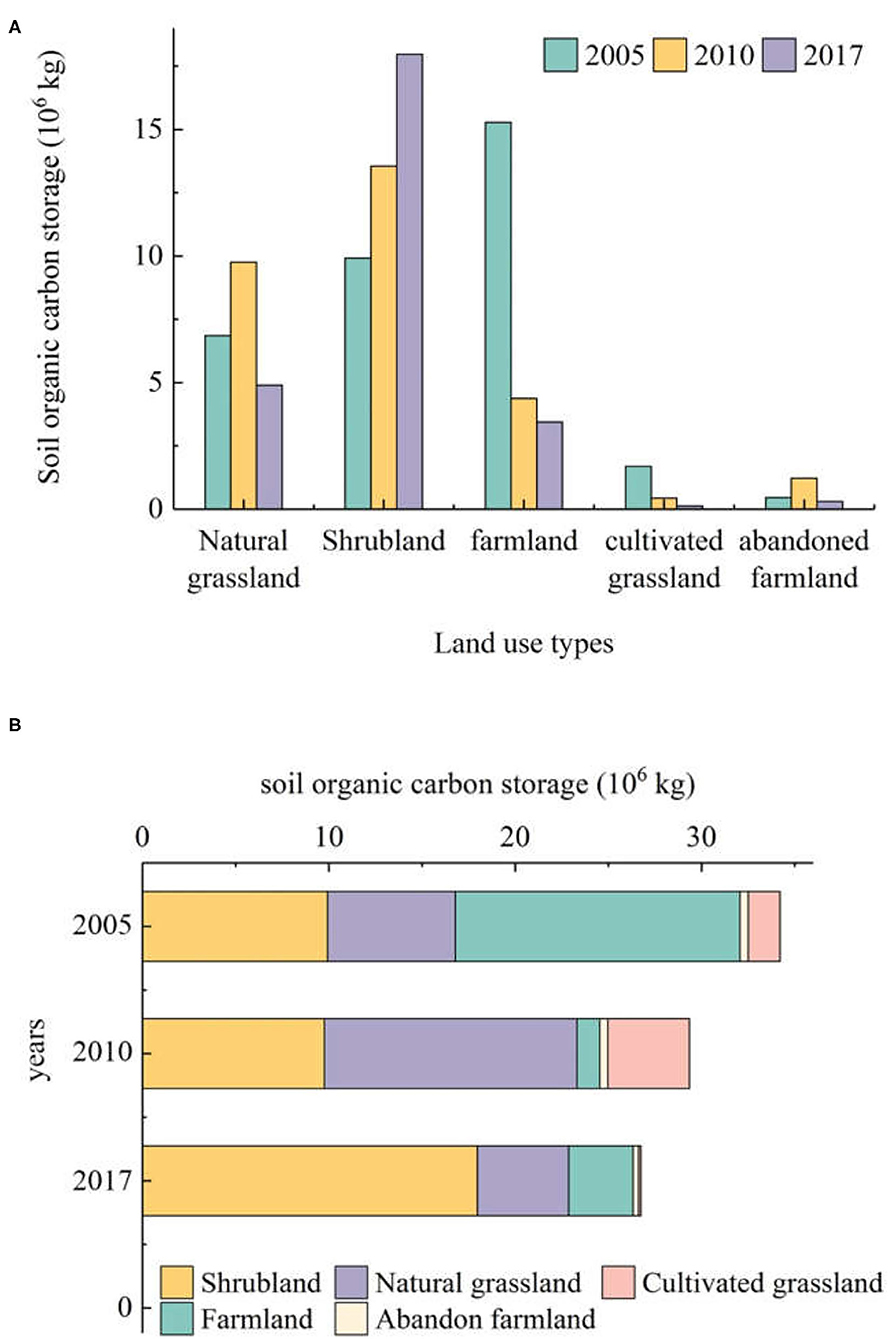
Figure 5. (A,B) Soil carbon storage of different land use types in 2005, 2010, and 2017.
Discussion
Changes to Land-Use Coverage
Changes to land uses can occur through a conversion from one land use type to another or by increase or decrease in area within single land-use types (47). This study found that land use in the Shanghuang Watershed changed, with increases in the areas of shrubland and grassland due to artificial planting and natural restoration, whereas the area of farmland decreased due to the conversion resulting from the “Grain for Green” project.
The primary land uses was natural grassland before 1982 (Figure 1A). But, growing exploitation of farmland resources due to population growth over the last century in combination with poor land management practices has resulted in environmental challenges such as deforestation, overgrazing and over reclamation (48). A net loss rate of 32.05% of its natural grassland area for the periods 1982–2005, resulting in the serious soil erosion and accelerated nutrient loss (35). Considering the size lost by natural grassland, the total loss during 1987–2005 was estimated to be 1,062 t·yr−1 for the top 0–10 cm soil depth (Tables 1, 2). In order to solve the problem of soil erosion, Shanghuang Watershed constituted a pioneering experiment in starting large-scale cropland abandonment and vegetation restoration in the early 1970s, and established a research station in 1982 with support from the Chinese Government.
When the problem of soil erosion was solved, researchers began to focus on ecological benefits using carbon stocks as an evaluation system (17, 49). Numerous studies have shown that grassland and shrubland added more carbon to soil, while farmland caused more soil C loss to soil due to harvesting and plowing (50, 51). So after 2010, the land use pattern dominated by grassland and shrub land was gradually stabilized in Shanghuang Watershed (Figure 3). It can be concluded that the change in land-use types in Shanghuang was not only related to natural disasters, but also closely related to economy and policy and ecosystem restoration status. It is recommended that long-term monitoring using remote sensing and UAV technology can be used to strengthen monitoring and to establish a corresponding evaluation system (36, 47).
Spatial and Temporal Variation in SOC Storage
SOC content depends on the balance between carbon inputs and carbon mineralization. Different microclimates, soil changes and organic matter inputs exist among different land uses, which affect SOC decomposition (35). Soil acts either as a carbon source or as a carbon sink (52).
In this study determined that SOC content was highest in shrubland and natural grassland among all the studied land-use types (16). This finding is consistent with those of previous studies (20, 53), which showed that SOC increased with the increasing maturity of shrubland and grassland. This result can probably be attributed to aboveground biomass and fine root density of shrubland being significantly greater than those of other land-use types (10, 48). Carbon is fixed through the aboveground leaves via photosynthesis, following which C is transferred to soil via litter input, root turnover and soil microbial decomposition, which contributes to the accumulation of C in the soil (20). Conventional tillage results in loose soil that is vulnerable to water erosion, thereby resulting in serious soil erosion and carbon loss. In addition, harvesting of crops resulted in a large proportion of the carbon content of crops not being returned to the soil. These factors all result in reduced SOC stocks in cropland. Thus, soil acts as a C sink during restoration when farmland is converted to shrubland and natural grassland (10). Therefore, natural grassland and shrubland are optimal land-use types for ecological restoration in the Shanghuang Watershed (23).
A number of studies have shown that vegetation restoration can have a major effect on the soil C pool following afforestation (54, 55). Nevertheless, field studies have shown that carbon stocks respond differently depending on the maturity of vegetation restoration, with carbon stocks either increasing (19), decreasing (56), or remaining unchanged (57) with increasing maturity of vegetation restoration. The results of this study showed that since the initiation of the returning farmland into shrublands and grasslands 45 years ago, soil carbon stocks showed an initial increasing trend (35), followed by a decreasing trend after ~30 years (Figure 5B), thereby supporting the primary hypothesis of the present study. The frequently observed initial soil carbon sequestration following afforestation has been primarily attributed to reduced loss of soil C through reducing soil erosion (23, 58). Vegetation restoration also increases soil aggregate stability to reducing soil C losses and increases litter and roots input to improving soil C stocks (17, 21, 59, 60). An examination of the consumption of soil carbon by older plantations has shown that the large amount of carbon released from the soil may even offset the carbon supply of vegetation (28). Some studies have found that afforestation does not necessarily increase SOC stocks, but instead decreases SOC stocks during the later stages of succession (61). Similar findings were reported by a study on a shrub plantation situated on the Loess Plateau, China, during which SOC stocks decreased by almost 25% over a period of afforestation succession of 10–30 years (62). Moreover, a previous study has shown that although forests sequester C in the long term, the soil C stocks of shrubland and grassland had decreased significantly 30 years after having been converted from cropland (63). The results of our study showed that the soil carbon stocks of more mature vegetation restoration (>30 years) decreased slightly after reaching a peak, indicating a decreased vegetation productivity, a higher consumption of C through microbial decomposition, and relatively stable microclimate conditions in more mature vegetation restoration. A study by Peng et al. (64) revealed that depletion of SOC could also result from the restriction of drought conditions within restored vegetation older than 20 years, resulting in a reduction in the growth of forest and grassland, a decrease in soil organic matter content, and ultimately a reduction in soil carbon storage in the Loess Plateau. However, it is worth noting that further research should monitor the duration of the C reduction state and should determine whether subsequent plant diversity is likely to promote the absorption and storage of C in the ecosystem and soil (61).
Implications for Sustainability of Afforestation
The maturities of ecological restoration projects in some countries and regions have exceeded 20 years and have achieved enormous ecological benefits (22). The results of our study suggested that about 30 years of planting, the trend of increasing soil carbon pool was not sustained, and SOC stock decreased slightly as a saturated C state was reached (54). Moreover, previous studies have confirmed that a slight soil carbon stock loss due to a water deficit occurred in some shrublands (62). Meanwhile, a previous study found that the SOC of mature restored grassland generated by root and litter decomposition was insufficient to meet the needs of cultivated grassland microorganism, which led to an increased in the SOC consume in grassland soil (35). This result indicates that the improvement in land quality through revegetation is not permanent and that more attention should be focused on the sustainability of revegetation (13). As soil nutrients and water are limiting resources, nutrient should be supplied or vegetation should be harvested during the later stage of planting to maintain the sustainable development of the “Grain to Green” project in the Loess Plateau and other semi-arid or water-limited areas (20).
Conclusions
The return of farmland to shrubland and grassland can increase the accumulation of organic carbon pools. In particular, grassland and shrubland are the optimal land-use types for this purpose. Nonetheless, the results of this study showed that benefits were not maintained over the long term (>40 years). Thus, afforestation cannot maintain a permanent soil carbon sink, and more focus should be placed on identifying measures to prolong the persistence and stability of carbon in soil.
Data Availability Statement
The original contributions presented in the study are included in the article/supplementary material, further inquiries can be directed to the corresponding author.
Author Contributions
QL was mainly responsible for acquising and interpreting the data and drafting the paper. PW contributed for data processing and drawing. ZX was substantial contributions to design paper framework and revising draft critically for important intellectual content. ZZ supported the funding. JL helped to revise the draft. SA with final approval of the version to be published. All authors contributed to the article and approved the submitted version.
Funding
This study was supported by the National Natural Sciences Foundation of China (41807060, 41977061, 41571260) and the Fundamental Research Funds For the Central Universities (Grant Nos. GK202001003, 2020CSLZ006).
Conflict of Interest
The authors declare that the research was conducted in the absence of any commercial or financial relationships that could be construed as a potential conflict of interest.
Publisher's Note
All claims expressed in this article are solely those of the authors and do not necessarily represent those of their affiliated organizations, or those of the publisher, the editors and the reviewers. Any product that may be evaluated in this article, or claim that may be made by its manufacturer, is not guaranteed or endorsed by the publisher.
References
1. Batjes NH. Total carbon and nitrogen in the soils of the world. Eur J Soil Sci. (1986) 47:151–63. doi: 10.1111/j.1365-2389.1996.tb01386.x
2. Eswaran H, Berg VD, Evert Reich P. Organic carbon in soils of the world. Soil Sci Soc Am J. (1993) 57:269–73. doi: 10.2136/sssaj1993.03615995005700010034x
3. Diaz-Hernandez JL. Is soil carbon storage underestimated? Chemosphere. (2010) 80:346–9. doi: 10.1016/j.chemosphere.2010.04.038
4. Trumbore S. Radiocarbon and soil carbon dynamics. Annu Rev Earth Planet Sci. (2009) 37:47–66. doi: 10.1146/annurev.earth.36.031207.124300
5. Deng L, Zhu G-y, Tang Z-s, Shangguan Z-p. Global patterns of the effects of land-use changes on soil carbon stocks. Glob Ecol Conserv. (2016) 5:127–38. doi: 10.1016/j.gecco.2015.12.004
6. Yu X, Zhou W, Wang Y, Cheng P, Hou Y, Xiong X, et al. Effects of land use and cultivation time on soil organic and inorganic carbon storage in deep soils. J Geograph Sci. (2020) 30:921–34. doi: 10.1007/s11442-020-1762-3
7. Wang Y, Fu B, Lü Y, Chen L. Effects of vegetation restoration on soil organic carbon sequestration at multiple scales in semi-arid Loess Plateau, China. Catena. (2011) 85:58–66. doi: 10.1016/j.catena.2010.12.003
8. Bowden RD, Deem L, Plante AF, Peltre C, Nadelhoffer K, Lajtha K. Litter input controls on soil carbon in a temperate deciduous forest. Soil Sci Soc Am J. (2014) 78:S66–75. doi: 10.2136/sssaj2013.09.0413nafsc
9. Xu L, Yu G, He N. Increased soil organic carbon storage in Chinese terrestrial ecosystems from the 1980s to the (2010s). J Geograph Sci. (2019) 29:49–66. doi: 10.1007/s11442-019-1583-4
10. Deng L, Wang K-B, Chen M-L, Shangguan Z–P, Sweeney S. Soil organic carbon storage capacity positively related to forest succession on the Loess Plateau, China. Catena. (2013) 110:1–7. doi: 10.1016/j.catena.2013.06.016
11. Yang Y, Dou Y, Cheng H, An S. Plant functional diversity drives carbon storage following vegetation restoration in Loess Plateau, China. J Environ Manage. (2019) 246:668–78. doi: 10.1016/j.jenvman.2019.06.054
12. Deng L, Shangguan ZP, Sweeney S. “Grain for Green” driven land use change and carbon sequestration on the Loess Plateau, China. Sci Rep. (2014) 4:7039. doi: 10.1038/srep07039
13. Feng X, Fu B, Piao S, Wang S, Ciais P, Zeng Z, et al. Revegetation in China's Loess Plateau is approaching sustainable water resource limits. Nat Clim Chang. (2016) 6:1019–22. doi: 10.1038/nclimate3092
14. Ali S, Begum F, Hayat R, Bohannan BJM. Variation in soil organic carbon stock in different land uses and altitudes in Bagrot Valley, Northern Karakoram. Acta Agric Scand B Soil Plant Sci. (2017) 67:551–61. doi: 10.1080/09064710.2017.1317829
15. Zhang Y, Guo S, Liu Q. Responses of soil respiration to land use conversions in degraded ecosystem of the semi-arid Loess Plateau. Ecol Eng. (2015) 74:196–205. doi: 10.1016/j.ecoleng.2014.10.003
16. Fang X, Xue Z, Li B, An S. Soil organic carbon distribution in relation to land use and its storage in a small watershed of the Loess Plateau, China. Catena. (2012) 88:6–13. doi: 10.1016/j.catena.2011.07.012
17. Laganière J, Angers DA, Pare D. Carbon accumulation in agricultural soils after afforestation: a meta-analysis. Glob Chang Biol. (2010) 16:439–53. doi: 10.1111/j.1365-2486.2009.01930.x
18. Don A, Schumacher J, Freibauer A. Impact of tropical land-use change on soil organic carbon stocks - a meta-analysis. Glob Chang Biol. (2011) 17:1658–70. doi: 10.1111/j.1365-2486.2010.02336.x
19. Garcia-Franco N, Wiesmeier M, Goberna M, Martínez-Mena M, Albaladejo J. Carbon dynamics after afforestation of semiarid shrublands: implications of site preparation techniques. For Ecol Manage. (2014) 319:107–15. doi: 10.1016/j.foreco.2014.01.043
20. Cheng M, Xue Z, Xiang Y, Darboux F, An S. Soil organic carbon sequestration in relation to revegetation on the Loess Plateau, China. Plant Soil. (2015) 397:31–42. doi: 10.1007/s11104-015-2486-5
21. Yan Y, Xin X, Xu X, Wang X, Yan R, Murray PJ. Vegetation patches increase wind-blown litter accumulation in a semi-arid steppe of northern China. Environ Res Lett. (2016) 11:124008. doi: 10.1088/1748-9326/11/12/124008
22. Cao J, Gong Y, Adamowski JF, Deo RC, Zhu G, Dong X, et al. Effects of stand age on carbon storage in dragon spruce forest ecosystems in the upper reaches of the Bailongjiang River basin, China. Sci Rep. (2019) 9:3005. doi: 10.1038/s41598-019-39626-z
23. Gao G, Tuo D, Han X, Jiao L, Li J, Fu B. Effects of land-use patterns on soil carbon and nitrogen variations along revegetated hillslopes in the Chinese Loess Plateau. Sci Total Environ. (2020) 746:14156. doi: 10.1016/j.scitotenv.2020.141156
24. An SS, Huang YM, Liu MY. Soil organic carbon density and land restoration: example of southern mountain area of Ningxia Province, Northwest China. Commun Soil Sci Plant Anal. (2010) 41:181–9. doi: 10.1080/00103620903429976
25. Chen LD, Gong J, Fu BJ, Huang ZL, Huang YL, Gui LD. Effect of land use conversion on soil organic carbon sequestration in the loess hilly area, loess plateau of China. Ecol Res. (2006) 22:641–8. doi: 10.1007/s11284-006-0065-1
26. Chen Y, Zhang Z, Zhao Y, Hu Y, Zhang D. Soil carbon storage along a 46-year revegetation chronosequence in a desert area of northern China. Geoderma. (2018) 325:28–36. doi: 10.1016/j.geoderma.2018.03.024
27. Neumann-Cosel L, Zimmermann B, Hall JS, van Breugel M, Elsenbeer H. Soil carbon dynamics under young tropical secondary forests on former pastures—a case study from Panama. For Ecol Manage. (2011) 261:1625–33. doi: 10.1016/j.foreco.2010.07.023
28. Hartley IP, Garnett MH, Sommerkorn M, Hopkins DW, Fletcher BJ, Sloan VL, et al. A potential loss of carbon associated with greater plant growth in the European Arctic. Nat Clim Chang. (2012) 2:875–9. doi: 10.1038/nclimate1575
29. Liu X, Yang T, Wang Q, Huang F, Li L. Dynamics of soil carbon and nitrogen stocks after afforestation in arid and semi-arid regions: a meta-analysis. Sci Total Environ. (2018) 618:1658–64. doi: 10.1016/j.scitotenv.2017.10.009
30. Liu Y, Dang ZQ, Tian FP, Wang D, Wu GL. Soil organic carbon and inorganic carbon accumulation along a 30-year grassland restoration chronosequence in semi-arid regions (China). Land Degr Dev. (2016) 28:189–98. doi: 10.1002/ldr.2632
31. Deng L, Han Q-s, Zhang C, Tang Z-s, Shangguan Z. Above-ground and below-ground ecosystem biomass accumulation and carbon sequestration with Caragana korshinskii Kom plantation development. Land Degr Dev. (2017) 28:906–17. doi: 10.1002/ldr.2642
32. World Reference Base for Soil Resources 2014 update 2015 International Soil Classification System for Naming Soils and Creating Legends for Soil Maps. World Soil Resources Reports No. 106. Rome: FAO (2015).
33. Shi P, Zhang Y, Li P, Li Z, Yu K, Ren Z, et al. Distribution of soil organic carbon impacted by land-use changes in a hilly watershed of the Loess Plateau, China. Sci Total Env. (2019) 652:505–12. doi: 10.1016/j.scitotenv.2018.10.172
34. Zhou P, Liu G. The change in values for ecological footprint indices following land-use change in a Loess Plateau watershed in China. Environ Earth Sci. (2009) 59:529–36. doi: 10.1007/s12665-009-0050-4
35. Xue ZJ, An SS. Changes in soil organic carbon and total nitrogen at a small watershed scale as the result of land use conversion on the loess plateau. Sustainability. (2018) 10:4757. doi: 10.3390/su10124757
36. Liu DL, Li BC, Liu XZ, Warrington DN. Monitoring land use change at a small watershed scale on the Loess Plateau, China: applications of landscape metrics, remote sensing and GIS. Environ Earth Sci. (2011) 64:2229–39. doi: 10.1007/s12665-011-1051-7
37. Jia H. The improvement of soil physicochemical property of grassland on Loess Plateau. Mem. NISWC Acad Sin. (1987) 2:22–6.
38. Jia H, Chen P. The assessment of soil resources and its improvement and utilization Shanghuang village of Guyuan county. Mem. NISWC Acad. Sin. (1987) 5:45–56.
39. Jia H, Chen P. The soil association of land types and the change of soil nutrient on way of use. Res Soil Water Conserv. (1990) 11:64–70.
40. Li Y, Wang Q, Du M, Zhao L, Xu S, Tang Y, et al. A study on replenishment and decomposition of organic matter in and mat-cryic cambisols CO2 Flux between vegetation and atmosphere. Acta Agrestia Sin. (2006) 14:165–9.
41. Liu M, An S, Chang Q. Features of soil organic carbon under different land use in mountain area of Southern Ningxia. Res Soil Water Conserv. (2005) 12:47–49.
42. Xue Z, Cheng M, An S. Soil nitrogen distributions for different land uses and landscape positions in a small watershed on Loess Plateau, China. Ecol Eng. (2013) 60:204–13. doi: 10.1016/j.ecoleng.2013.07.045
43. Nelson DW. Total carbon, organic carbon, organic matter. Methods Soil Anal. (1996) 9:961–1010. doi: 10.2136/sssabookser5.3.c34
44. Li D, Niu S, Luo Y. Global patterns of the dynamics of soil carbon and nitrogen stocks following afforestation: a meta-analysis. New Phytol. (2012) 195:172–81. doi: 10.1111/j.1469-8137.2012.04150.x
45. Shi S, Peng C, Wang M, Zhu Q, Yang G, Yang Y, et al. A global meta-analysis of changes in soil carbon, nitrogen, phosphorus and sulfur, and stoichiometric shifts after forestation. Plant Soil. (2016) 407:323–40. doi: 10.1007/s11104-016-2889-y
46. Yang Y, Chen Y, Li Z, Chen Y. Land-use/cover conversion affects soil organic-carbon stocks: a case study along the main channel of the Tarim River, China. PLoS ONE. (2018) 13:e0206903. doi: 10.1371/journal.pone.0206903
47. Zhao G, Ye S, Li G, Yu X, McClellan SA. Soil organic carbon storage changes in coastal wetlands of the Liaohe Delta, China, based on landscape patterns. Estuaries Coasts. (2016) 40:967. doi: 10.1007/s12237-016-0194-x
48. Fu B, Liu Y, Lu Y. Assessing the soil erosion control service of ecosystems change in the Loess Plateau of China. Ecol Complex. (2011) 8:284–93. doi: 10.1016/j.ecocom.2011.07.003
49. Jia XX, Yang Y, Zhang CC, Shao MA, Huang LM. A state-space analysis of soil organic carbon in China's Loess Plateau. Land Degr Dev. (2017) 28:983–93. doi: 10.1002/ldr.2675
50. Lozano-Garcia B, Munoz-Rojas M, Parras-Alcantara L. Climate and land use changes effects on soil organic carbon stocks in a Mediterranean semi-natural area. Sci Total Environ. (2017) 579:1249–59. doi: 10.1016/j.scitotenv.2016.11.111
51. Meena VS, Mondal T, Pandey BM, Mukherjee A, Yadav RP, Choudhary M, et al. Land use changes: strategies to improve soil carbon and nitrogen storage pattern in the mid-Himalaya ecosystem, India. Geoderma. (2018) 321:69–78. doi: 10.1016/j.geoderma.2018.02.002
52. Guo L, Gifford R. Soil carbon stocks and land use change_ a meta analysis. Glob Chang Biol. (2002) 8:345–60. doi: 10.1046/j.1354-1013.2002.00486.x
53. Lenka NK, Choudhury PR, Sudhishri S, Dass A, Patnaik US. Soil aggregation, carbon build up and root zone soil moisture in degraded sloping lands under selected agroforestry based rehabilitation systems in eastern India. Agric Ecosyst Environ. (2012) 150:54–62. doi: 10.1016/j.agee.2012.01.003
54. Lu F, Hu H, Sun W, Zhu J, Liu G, Zhou W, et al. Effects of national ecological restoration projects on carbon sequestration in China from 2001 to (2010). Proc Natl Acad Sci USA. (2018) 115:4039–44. doi: 10.1073/pnas.1700294115
55. Perez-Quezada JF, Delpiano CA, Snyder KA, Johnson DA, Franck N. Carbon pools in an arid shrubland in Chile under natural and afforested conditions. J Arid Environ. (2011) 75:29–37. doi: 10.1016/j.jaridenv.2010.08.003
56. Karhu K, Wall A, Vanhala P, Liski J, Esala M, Regina K. Effects of afforestation and deforestation on boreal soil carbon stocks—Comparison of measured C stocks with Yasso07 model results. Geoderma. (2011) 164:33–45. doi: 10.1016/j.geoderma.2011.05.008
57. Yang Y, Luo Y, Finzi AC. Carbon and nitrogen dynamics during forest stand development: a global synthesis. New Phytol. (2011) 190:977–89. doi: 10.1111/j.1469-8137.2011.03645.x
58. Kirkels FMSA, Cammeraat LH, Kuhn NJ. The fate of soil organic carbon upon erosion, transport and deposition in agricultural landscapes — a review of different concepts. Geomorphology. (2014) 226:94–105. doi: 10.1016/j.geomorph.2014.07.023
59. An SS, Darboux F, Cheng M. Revegetation as an efficient means of increasing soil aggregate stability on the Loess Plateau (China). Geoderma. (2013) 209–210:75–85. doi: 10.1016/j.geoderma.2013.05.020
60. Chaplot V, Dlamini P, Chivenge P. Potential of grassland rehabilitation through high density-short duration grazing to sequester atmospheric carbon. Geoderma. (2016) 271:10–7. doi: 10.1016/j.geoderma.2016.02.010
61. Gao B, Taylor AR, Searle EB, Kumar P, Ma Z, Hume AM, et al. Carbon storage declines in old boreal forests irrespective of succession pathway. Ecosystems. (2017) 21:1168–82. doi: 10.1007/s10021-017-0210-4
62. Chai Q, Ma Z, An Q, Wu GL, Chang X, Zheng J, et al. Does Caragana korshinskii plantation increase soil carbon continuously in a water-limited landscape on the Loess Plateau, China? Land Degr Dev. (2019) 30:1691–8. doi: 10.1002/ldr.3373
63. Chang R, Fu B, Liu G. Soil carbon sequestration potential for “grain for green” project in Loess Plateau, China. Environ Manage. (2011) 48:1158–72. doi: 10.1007/s00267-011-9682-8
Keywords: vegetation restoration, land use conversion, soil organic carbon, sustainable, land management
Citation: Liu Q, Wang P, Xue Z, Zhou Z, Liu J and An S (2021) Is the Change of Soil Carbon Capacity Persistence Rising or Remain Stable With Maturity of Vegetation Restoration? Front. Soil Sci. 1:663910. doi: 10.3389/fsoil.2021.663910
Received: 04 February 2021; Accepted: 28 July 2021;
Published: 31 August 2021.
Edited by:
Xiaodong Gao, Northwest A and F University, ChinaReviewed by:
Songchao Chen, Institut National de recherche pour l'agriculture, l'alimentation et l'environnement (INRAE), FranceKaibo Wang, Institute of Earth Environment, Chinese Academy of Sciences, China
Copyright © 2021 Liu, Wang, Xue, Zhou, Liu and An. This is an open-access article distributed under the terms of the Creative Commons Attribution License (CC BY). The use, distribution or reproduction in other forums is permitted, provided the original author(s) and the copyright owner(s) are credited and that the original publication in this journal is cited, in accordance with accepted academic practice. No use, distribution or reproduction is permitted which does not comply with these terms.
*Correspondence: Zhijing Xue, eHVlMTk4NkBzbm51LmVkdS5jbg==