 Hannah M. Hartge
 Eckhard Flöter2
 Thomas A. Vilgis
94% of researchers rate our articles as excellent or good
Learn more about the work of our research integrity team to safeguard the quality of each article we publish.
Find out more
ORIGINAL RESEARCH article
Front. Soft Matter, 04 February 2025
Sec. Food and Soft Materials
Volume 5 - 2025 | https://doi.org/10.3389/frsfm.2025.1527707
Hard particle dispersions are abundant in food as well as technical applications. In particular, the production of many candies like fondants, crystalline sugars or creamed honeys involves agitation of concentrated suspensions of microscopic crystals in saturated solutions. However, the complex rheological behavior of such non-colloidal suspensions with poly-disperse, irregular particles is not fully understood. This work investigates different sucrose suspensions with a particle volume fraction of about 50%. After detailed image analysis of the varying particle size distributions and shapes, the flow properties are investigated by oscillatory rheology. Amplitude sweeps, frequency sweeps and thixotropy tests show the dependency of rheological behavior on the microstructure of the suspensions. In particular, all samples show characteristic strain softening with subsequent strain hardening that indicates jamming at large strains. This is observed irrespective of specifics in the particle shape and material, suggesting universal behavior due to the high particle volume fraction. They also show significant time-dependent behavior. However, sedimentation rates are higher and structure rebuilding is lower for larger particle sizes and dispersity. The observed strain softening and structure rebuilding are explained by rearrangement of the crystals: Under moderate strain amplitudes, friction and collisions are minimized, with a larger optimization potential for larger dispersities. When oscillations are reduced again, mainly small particles re-arrange in an arbitrary order over time, leading to an increase in loss and storage modulus and thus thixotropic behavior. This time-dependent process needs to be taken into account when measuring or processing concentrated crystal suspensions. Our findings contribute to a better understanding of concentrated suspensions simple in composition, but complex in their flow properties. The observed behavior strongly depends on the particle-particle interactions. Thus, our findings can be transferred to other areas involving concentrated, non-Brownian frictional suspensions of compact hard particles, as they are often found in food, technical applications or geology.
In sucrose production and confectionery, crystal-syrup suspensions are abundant. While present in many applications like seeding slurries, crystalline honey or fondants, they also present interesting model systems: Dispersions of pure sucrose and water are simple and well-defined in composition, but can undergo complex thermodynamic and mechanic processes that resemble those in fondant production, slurry processing, and other concentrated hard-particle suspensions.
These suspensions are capable of containing considerable quantities of crystalline material. In poured fondant, a sugar paste or glaze consisting of precipitated microscopic crystals dispersed in saturated sucrose solution, the particle volume fraction will typically be between 30% and 70%. This equals a total mass fraction of only 20%–8% water in the whole system (Hartel, 2001; Lees, 1965). For these products, the texture will range from silky smooth to grainy depending on the crystal size, as well as from viscous fluids to soft solids mainly depending on water content and thus final crystal volume fraction.
The presence of high particle volume fractions exceeding 30% makes such suspensions challenging yet fascinating systems to study from a physical viewpoint. While analytical models mostly describe suspensions of low particle concentrations (Einstein, 1906; Einstein, 1911), higher concentrations are usually described by semi-empirical models like the Dougherty-Krieger model (Krieger and Dougherty, 1959; Tadros, 2010; Coussot, 1997).
Here, typically the intrinsic viscosity or shape-dependent factors like the maximum packing fraction have to be known in order to predict viscosities. In experimental model studies, on the other hand, usually suspensions with either polymers or symmetrical particles like spheres, platelets or rodlets are considered, often with rather homogeneous size distribution (Hyun et al., 2002; Toda and Furuse, 2006; Pal, 2015; Guazzelli and Pouliquen, 2018; Tanner, 2018; Lemaire et al., 2023). In the case of commonly produced crystalline sucrose suspensions though, particles are often far from homogeneous in size and with close-to-cuboid or irregular shape, making it difficult to predict their behavior by common models.
Although products like fondants are widely used and similar systems are found in other industrial crystallization processes, literature on their fundamental rheological properties is lacking. Two previous works provided insights into the crystallization dynamics and complex flow properties during the preparation process (Hartge et al., 2023; Hartge et al., 2024), but the final suspensions after crystallization were not studied in detail.
Most work on rheological properties of sucrose dispersions focuses on homogeneous sucrose solutions (see, for example, Quintas et al., 2006; Telis et al., 2007). These are found to be Newtonian liquids over a wide range of concentrations, with even high amounts of supersaturation showing no significant sign of deviation from this behavior. However, the presence of significant amounts of particles changes the flow properties in a suspension to that of a visco-elastic material (Tadros, 2010; Hartge et al., 2024).
Rheological properties of crystalline sucrose suspensions are studied in few publications (De Souza et al., 2010; Blanc et al., 2018; Ozcan et al., 2019; Burke and Hartel, 2021), but these mainly focus on viscosity or other limited aspects of rheology. For example, De Souza et al. (2010) show the proposed dependency of viscosity on differently sized crystals, with particle volume fractions up to 40%. They describe the behavior observed via a propeller-type rheometer as Newtonian, and confirm a good match with semi-empirical models by Krieger and Dougherty (1959) as well as Mooney (1951).
However, simple propeller-type rotational mixing lacks observation of rheological properties other than apparent viscosity, so that no deeper insights into the microstructure and dynamics can be gained. Instead, oscillatory measurements of a similar sucrose suspension with a plate-plate rheometer showed rheological behavior that was clearly non-Newtonian: In a prior study (Hartge et al., 2024), we investigated the changes in rheological properties during crystallization of a highly concentrated sucrose dispersion containing 81% sucrose by weight, resembling production of a coarse fluid fondant. While the system started as a Newtonian liquid when no crystals were present, the sample underwent major changes to a visco-elastic fluid during crystallization. With increasing crystal volume fraction up to 36% and decreasing solute concentration in the liquid phase, the storage modulus went up and loss modulus went down. This finally lead to a sample that showed prominent visco-elastic properties and significant shear-thinning behavior at parallel shear, contradicting the findings of De Souza et al.
With this work, we aim to fill the existing literature gap concerning non-colloidal, concentrated and polydisperse crystal suspensions. We thus present investigations on samples resembling simple model fondants, all consisting of the same crystal volume fraction close to 50% dispersed in a saturated sucrose solution, but prepared at different temperatures so that the final crystal size distribution differs. With mean crystal sizes between 8 and 34 µm equivalent radius, one of four samples would classify as a “good” fondant due to its particles’ diameters below 20 µm (Hartel, 2001). The samples containing larger crystals represent grainy suspensions similar to coarse fondant or crystallized honey, and were chosen in order to make differences depending on particle size obvious.
In Section 3.1, we provide a thorough study on the differences in size distribution and particle shapes depending on the preparation temperature, which provides the basis for the rheological studies in the subsequent sections. After discussing temporal stability of the sample in the experimental setup in Section 3.2, we study the sample response in oscillatory shear rheology over strain amplitude and frequency in Sections 3.3 and 3.4. Lastly, we study thixotropic properties of the samples in Section 3.5. Figure 1 highlights some of the results by showing the microstructure of a studied sample and its effect on a dynamic strain sweep measurement.

Figure 1. Graphical abstract of the present study, showing a microscopic image of a sample prepared at 25°C, its particle size distribution, roughly to-scale sketches of the microstructure showing zero, moderate and large oscillatory strain, and the resulting modulus under a dynamic strain sweep.
These observations allow a better understanding of not only sucrose suspensions, but highly concentrated hard particle suspensions of compact irregular shapes and significant dispersity in general. A comparison with an amplitude sweep of a glass bead suspension as well as two different sucrose particle suspensions emphasizes the transferability of our observations to different systems.
Sample preparation and image analysis follow the methods described by Hartge et al. (2023) and Hartge et al. (2024) previously, where more details can be found.
All samples were made with crystalline white sucrose (extra fine) supplied by Südzucker AG (Mannheim, Germany). Water underwent filtration and de-ionization through a Milli-Q® water purification system. Milled and sieved sucrose particles for comparison in Section 3.3 were obtained from commercial pure powdered sucrose purchased in a local supermarket (Südzucker AG, Mannheim, Germany) and sieved manually (see below). Glass beads used in the same section were acid washed 75 µm soda-lime glass beads by Sigma-Aldrich (Merck KGaA, Darmstadt, Germany).
Samples of the same composition were prepared at different temperatures to achieve different crystal size distributions with the same particle volume fraction. For each sample, 399.54 g of sucrose was combined with 99.80 g of de-ionized water in a pot and covered with aluminum foil. The mixture was placed on a heating plate and stirred at 100 rpm with a heating temperature of 300°C to ensure complete and fast dissolution. As soon as no more crystals were visible at about 110°C, the cover was removed and the water was allowed to evaporate. The sample was repeatedly weighed until enough water was evaporated to reach a concentration of 85% sucrose by weight. This was ususally the case at a final sample temperature of about 114.5°C.
The syrup was then poured into a metal dish to induce quick cooling and thus avoid premature crystallization. As soon as the sample showed a temperature of 5°C above the chosen preparation temperature, it was transferred into the kneading cell of an IKAVISC Measuring Kneader MKD 0,6 - H60 (IKA Werke GmbH and Co. KG, Staufen, Germany) for high viscosity samples. The trough of the kneader was tempered using a water circulation system. Kneading was set to the maximum possible stirring speed of 62 rpm. Torque data were collected via an in-house datalogger and own software. As soon as the torque showed a characteristic peak (see Hartge et al. (2023) for more details), tempering water was switched to room temperature in order to induce homogeneous cooling during agitation prior to further analysis.
Kneading duration was adjusted individually for each sample such that total kneading time was
70 g of sucrose were combined with 30 g of distilled water in a glass beaker to prepare saturated sucrose solution. The mixture was covered with Parafilm® and agitated at 400 rpm overnight. The dispersion was then centrifuged at 15,000 g for 30 min at 25°C in two tubes containing about 47 g each.
Only the saturated solution from the top was extracted with a pipette for further applications. The sucrose sediment at the bottom was retained in the tubes to maintain continuous saturation.
For the sample containing milled sucrose particles of limited size distribution discussed in Section 3.3, milled powdered sucrose was sieved using Corning Sterile Cell Strainers purchased from Fisher Scientific GmbH (Schwerte, Germany). After dry sieving through a 100 µm strainer, the smaller particles that successfully passed through the sieve were collected. They were then wet sieved through a 70 µm strainer by use of acetone until the filtrate was clear. The wet residue containing sucrose particles mainly in the range of 70–100 µm was then dried under vacuum over night (Heraeus vacuum oven, Thermo Scientific, Langenselbold, Germany). After drying, 5.39 g of sieved sucrose were mixed with 4.61 g of saturated sucrose solution for 90 s by hand with a flexible spatula. The mass fraction was chosen to yield the same nominal volume fraction of 49.4% as calculated for the precipitated suspensions.
The mixture was then placed in a 30 mL sample cup, directly covered with plastic wrap, and the sample cup was sealed with a lid and Parafilm. It was then stored in the climate chamber at 25°C for 30 min to ensure equilibrium between solution saturation and sucrose crystals.
For the glass bead suspension, the mass fraction was calculated accordingly based on a density value of 2.5 g cm−3 of the glass beads. 3.24 g of glass beads were mixed with 1.76 g of saturated sucrose solution and mixed with a spatula. Due to the insolubility of the glass and the liquid nature of the suspension, this sample was placed in the rheometer directly after mixing.
After 1 day of rest, a small amount of sample was mixed with saturated sucrose solution at a ratio of about 1:40 by weight with a flexible spatula. Two drops of 15 µL were pipetted onto a microscope slide and each carefully covered with a cover slip. The slide was then placed in a Zeiss AxioScope.A1 (Carl Zeiss AG, Oberkochen, Germany) in bright field transmission mode at 20x magnification. Three typical images per sample were taken via digital camera for further analysis.
Each image was analyzed with the help of Cellpose software (Stringer et al., 2021). This open-source, deep learning-based segmentation software allowed a combination of automated as well as manual labeling. The Cellpose model “cyto2” was used for automated pre-segmentation, and the labeled image then corrected manually. Manual correction was necessary due to the broad size distribution, irregular shapes, and inhomogeneous shadings. In cases of very broad size distributions, small and large particles were segmented individually and the resulting masks later combined, similar in principle to the process described by Krom et al. (2024). Fiji software (Schindelin et al., 2012) with the plugin LabelsToROIs (Waisman et al., 2021) was then used for further analysis of the labeled images and the results processed via Python.
Each sample was prepared in triplicate using new batches each time. Mean value and standard deviation of the plotted parameters represent mean and standard deviation between three full replications.
A Discovery HR-3 rheometer (TA Instruments, New Castle, Delaware) was used for characterization of visco-elastic properties. As the geometry, 25 mm parallel plates were chosen. A medium-grit (P100) waterproof silicon carbide sandpaper (Starcke GmbH and Co. KG, Melle, Germany) was attached to the plates by use of double-sided tape to achieve a rough surface.
In order to minimize disturbance of the highly concentrated suspension during loading into the rheometer and to achieve a homogeneous sample thickness, the lower plate was enclosed in a PTFE mold greased with silicone oil yielding a height of 3 mm above the metal plate surface. The sample was stirred manually for about 15 s with a spatula before applying it onto the lower plate and into the mold. The surface was smoothed and directly covered with plastic wrap. The sample was then allowed to rest in a closed Petri dish for 30 min at 25°C in the climate chamber prior to loading to the rheometer.
After 30 min, the plastic wrap and PTFE mold were removed and the plate with the sample was mounted to the rheometer. The gap was adjusted manually such that the upper plate just had full contact with the sample. In order to disturb the sample as little as possible, limits of 0.5 N for axial force and 100 μm s−1 for closure velocity were set during lowering of the upper plate. After trimming the sample with a spatula, the gap was lowered by an additional 5% for optimal sample geometry and to ensure equal conditions prior to the measurements. Additionally, a resting time of 60 s was set before the measurements started for the amplitude sweeps, frequency sweeps, and thixotropy tests.
In preliminary studies it was established that the effect of water evaporation is significant in long term rheological experiments. This is visible in Supplementary Figure S5. This is to be expected, since the equilibrium relative humidity of saturated sucrose solution is reported to be about 84% (Galmarini et al., 2008). Thus silicone oil was carefully applied to the outside of the sample, and a cover with attached wetted paper strips was used for all experiments to increase air humidity and thus mitigate sample drying. Since evaporation obviously occurs from the liquid solution, it is assumed that evaporation effects are independent of the respective crystal size.
The following oscillatory measurements were conducted:
1. Small amplitude shear was applied with
2. For medium amplitude shear, the shear strain at which the storage modulus showed a minimum in the amplitude sweep was chosen (about 5%), and applied for 120 s.
3. Small amplitude shear was applied again with
All rheological measurements were conducted in triplicate and at a temperature of 25°C. A new sample cup was used for each measurement, and a newly prepared batch was used for each replication. Values represent geometric mean and geometric standard deviation of three full replications.
In the case of the frequency sweeps, data points are only shown for frequencies up to
To check the true final concentrations in the samples, sucrose content was calculated from their respective refractive index. Two measurements were performed:
First, the total sucrose concentration in the suspension was measured. In order to yield a transparent fluid, (10.000
Second, the sucrose content dissolved in the disperse liquid phase was measured. Here, each sample was centrifuged at 15,000 g for 30 min at 25°C. Liquid from the supernatant was then pipetted directly onto the refractometer and the sucrose calculated from the refractive index accordingly.
Automatic calculation of sucrose content depending on the refractive index was performed by data by the International Commission for Uniform Methods of Sugar Analysis (2019). For each solution, the measurement was conducted three times and the mean calculated.
For an in-depth analysis of the sample structures, particle sizes and shapes were characterized using image analysis of microscopy images. Figure 2 shows typical microscopy images of the diluted samples.
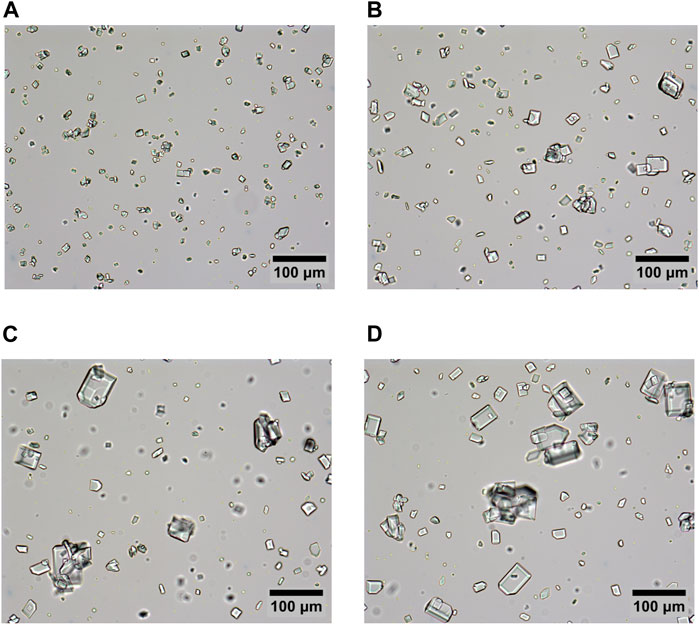
Figure 2. Typical microscopy images of samples (A) “r8”, crystallized at 25°C, (B) “r13”, crystallized at 40°C, (C) “r28”, crystallized at 55°C, and (D) “r34”, crystallized at 70°C. All samples diluted 1:40 by weight with saturated sucrose solution to allow clear distinction of individual particles.
All samples show crystals with a nearly rectangular shape that is typical for sucrose crystals (VanHook, 1983; Faria et al., 2003; Ferreira et al., 2011). Besides these more regularly shaped particles, many conglomerates, poly-crystals, or fractured particles are observed in all samples.
These irregularities are caused by different factors: First, high supersaturation levels are known to promote formation of conglomerates (Vaccari and Mantovani, 1995). With supersaturation levels of 2.5 for the sample prepared at 70°C to 5.5 for the sample prepared at 25°C (Hartge et al., 2023; Peres and Macedo, 1996), formation of conglomerates is thus expected. Second, the applied agitation and frequent collisions make crystals grow together on the one hand, but also break apart or face attrition under the high shear forces on the other hand. Third, secondary nucleation can be expected, meaning that nuclei form on preexisting solid material (Mullin, 2001). All of these processes lead to numerous irregularities in the crystal morphologies of all samples.
However, differences in the mean particle sizes are obvious. As expected, particles grow larger in samples that are agitated at higher temperature
For preparing high-quality fondants, it is essential to control the temperature and supersaturation to achieve a small crystal size of less than 20 µm in diameter. This ensures that the fondant has a smooth texture and a consistency that is free from any grainy or unpleasant mouthfeel (Lees, 1965; Hartel, 2001). Thus, the observations fit well to known principles in crystal growth and candy manufacture, and demonstrate the importance of the interplay of temperature and supersaturation in quality control.
However, more parameters are necessary to describe the size distributions that might influence rheological properties, but are less obvious to the eye. Several parameters from quantitative image analysis are shown in Figure 3.
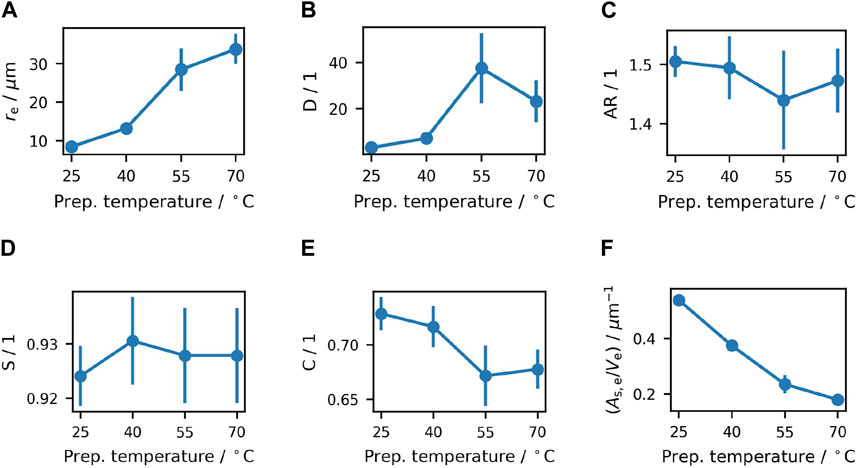
Figure 3. Values of (A) mean equivalent radius, (B) dispersity of particle sizes, (C) mean aspect ratio, (D) mean solidity of particles with
All mean values are calculated as volume weighted averages. For this purpose, the equivalent radius of a particle is calculated as the radius of a circle with the same area,
As discussed before qualitatively, the mean radius grows significantly with increasing preparation temperature. Particle size is considered to influence rheological properties of a sample (Tadros, 2010), so
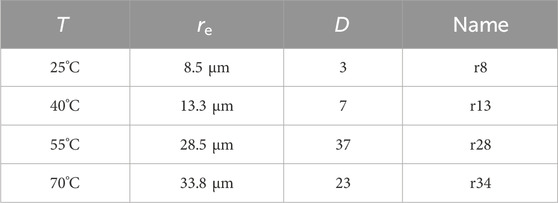
Table 1. Preparation temperature, resulting mean equivalent particle radius, Dispersity, and sample name used in the subsequent sections.
To account for changes not only in mean size, but also in the width of size distribution (Luckham and Ukeje, 1999), dispersity
It should be noted that samples prepared at higher temperatures undergo significant crystallization when cooled to 25°C. This is explained by the fact that after crystallization at higher temperatures, the difference in sucrose solubility during agitation in comparison to that at room temperature is much higher. The objective is to cool the samples while they remain in motion in the kneader by reducing the temperature of the cooling water after the peak in torque has been reached. This process is employed to ensure a more uniform temperature decrease and prevent crystals from growing together during the cooling phase. However, the high supersaturation that is imposed by the last cooling step leads to a high driving force to form new crystals. This is more pronounced for the sample prepared at 70°C than for the sample at 40°C, and with practically no difference in equilibrium saturation for the sample at 25°C which shows a low dispersity.
To compare differences in surface and shape critical to rheological properties (Lemaire et al., 2023), the aspect ratio and solidity (as calculated by the Fiji software) was compared. The aspect ratio is defined as the ratio of the major axis to the minor axis of a fitted ellipse, and considered to influence hydrodynamic interactions. The results displayed in Figure 3C confirm a rather compact shape, but do not show significant differences between the samples. Solidity is calculated as the ratio of the area of the convex hull of a particle to its actual measured area
With overlapping error bars and no obvious trend, no significant relation between solidity and preparation temperature can be found, as for the aspect ratio. This means that over all, crystals show a similar amount of irregularity in particle shapes among all samples. With a solidity value of roughly 0.928, all samples show some amount of twinning, conglomeration, poly-crystallinity or fracture, which all lead to shapes deviating from perfect convexity. However, in all samples a high amount of particles do show a shape resembling either an ideal individual sucrose crystal or a crystal rounded by attrition, both leading to a high solidity value close to one.
Circularity as calculated by the Fiji software is considered as an additional shape descriptor. With Circularity being defined as
Given the similar particle volume fraction and solidity, but notable differences in size and dispersity, it is important to ascertain the total particle surface area within the samples. As drag and friction increase with larger contact area between particle and fluid as well as between touching particles, this is a crucial factor for rheological properties (Papadopoulou et al., 2020). Thus for each particle, the surface area was approximated as an equivalent surface area
Figure 3F shows a strong dependency of mean specific surface area on preparation temperature, with a higher temperature leading to a significantly lower total particle surface. As the same crystal volume fraction is present in all samples, the mean surface area per volume unit is directly proportional to the total particle area within the sample. Thus, the sample prepared at 70°C shows only about 30% of the particle surface area as the sample prepared at 25°C, with nearly linear decrease in between.
It is assumed that all samples will complete the crystallization process of the excess sucrose within a 1-day resting period. This is confirmed by measuring the sucrose concentration in the liquid phase after centrifuging, which is found to be in the range of
In order to study the temporal stability of the samples during measurements, time sweeps were performed at a small strain of
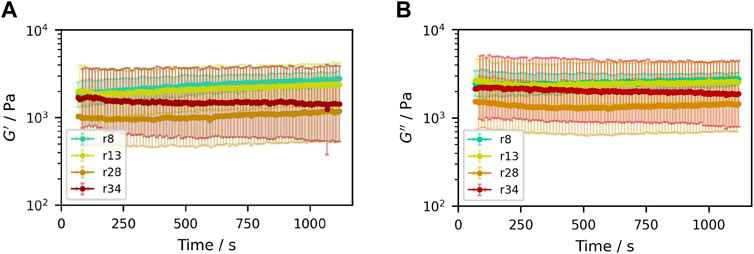
Figure 4. Time sweeps of samples containing (50.3±0.3)% (V/V) sucrose crystals with different particle size distributions, shown for the time range relevant for subsequent measurements. (A) Storage modulus G′, (B) loss modulus G″.
Because of the high volume fraction of about 50% hard particles dispersed in a Newtonian liquid,
Both moduli show large standard deviations among three repetitions. Large scatterment of rheological data has also been found for other concentrated suspensions, for example by Gadala-Maria and Acrivos (1980) or Heymann et al. (2002). This can be explained by the fact that for such highly concentrated non-Brownian suspensions, small-strain measurements are dependent on the arrangement of the microstructure, which in turn is path-dependent. Here, where no Brownian motion is present that would ensure a state of equilibrium, the sample’s state depends on the entire history. Additionally, the high particle concentration with many contacts results in a significant dependence of small-strain measurements on the arrangements of the crystals.
Over the course of 1,100 s, the graphs show no significant changes, and no significant trend among the different samples considering the large standard deviations. Thus, the sample stability in the chosen setup was considered sufficient for the subsequent measurements: A cover with wet paper strips for humidity and a resting time of 60 s prior to any further measurement were employed in all cases.
However, if the moduli and the loss factor
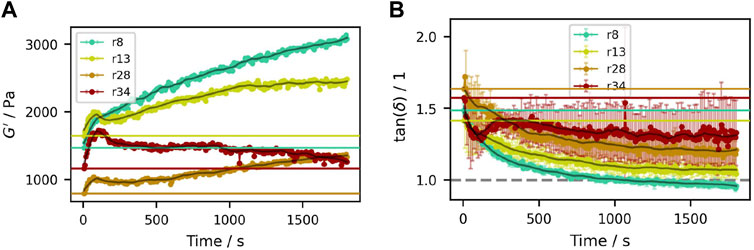
Figure 5. Time sweeps of samples containing (50.3±0.3)% (V/V) sucrose crystals with different particle size distributions. (A) Storage modulus
The observed initial peaks in
Over longer periods of time, the system seems to approach an equilibrium at higher moduli and lower loss factor. Long term moisture loss was excluded as a cause by preliminary experiments (see also Supplementary Figure S5).
One explanation might be agglomeration at rest. For sucrose crystals in aqueous sucrose solution, the main attractive force that could act between the particles is van der Waals force (Israelachvili, 2011). However, in the given case, the typical van der Waals forces can be approximated to be in the order of 10−12 N or less (Israelachvili, 2011) (see Section 2 in the Supplementary Material for more details). In comparison, the imposed shear results in average forces in the order of 10−11 N to 10−9 N for a typical particle. Thus, even at the small strains given, the shear forces would destroy any significant agglomerates with each oscillation, and they can not explain a measured increase over time.
A second explanation is diffusion driven structure rebuilding (Martone et al., 2020) by reorientation of crystals after initial compression between the plates and subsequent oscillations. Such a process is expected to be dependent on size distribution. While the sample preparation in molds with a fixed height and appropriate relaxation times were chosen to mitigate effects of squeeze flow during closing of the measurement geometry (Heymann et al., 2002), effects of compression could not be fully avoided. Time or oscillation-cycle dependent relaxation after mechanic deformation is confirmed for these samples and discussed in more detail for the thixotropy tests in Section 3.5, which also show the expected dependency on size distribution. At the same time no significant change in the normal force was observed during the time sweeps, indicating that compression was already relaxed and changes in the moduli result from small reorientation of the crystals.
These effects have to be kept in mind when interpreting the results in the following sections, and will be discussed accordingly.
Amplitude sweeps of the different sucrose suspensions were performed. Because storage modulus
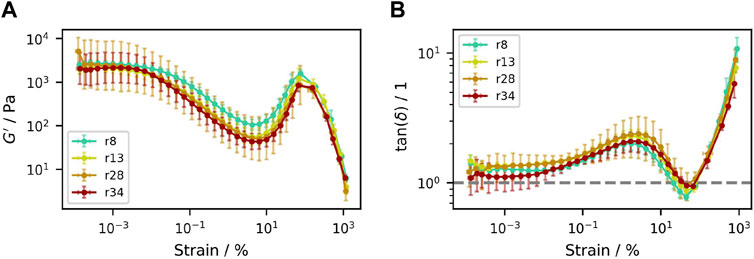
Figure 6. Amplitude sweeps of samples containing (50.3±0.3)% (V/V) sucrose crystals with different particle size distributions. (A) Storage modulus
An examination of the progression of the
This effect can be attributed to a rearrangement of the crystals: At very small oscillation strains, the particles can vibrate at their respective location, without significant translational or rotational displacement. This leads to a constant value of the moduli, with the sample response to shear resulting from the hard particle contacts as well as the surrounding liquid phase. With a particle volume fraction of about 50%, the viscous response slightly dominates over the elastic part, which results in a
When oscillation amplitudes become larger than about
Once the minimum value of
This becomes clear when the inter-particle distance is estimated. Liu et al. (1999) and Liu et al. (2001) derived an expression that allows to estimate the expected surface-to-surface distance for poly-disperse particles that follow a log-normal size distribution. Fitting the unweighted particle sizes of r8 to a log-normal distribution gives an expected particle distance of 2.3 µm, which is only about 27% of the mean particle radius. Thus for mean particles in different shear bands, where the shear bands are about one
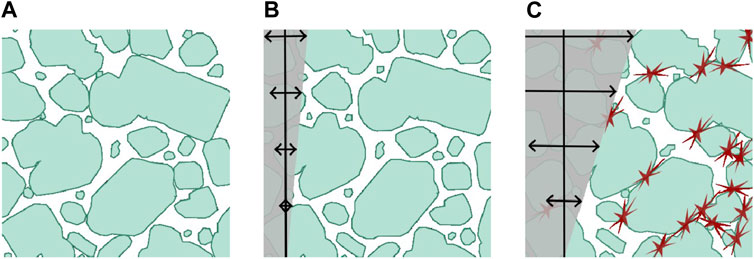
Figure 7. Sketches of the microstructure of a sample at three different oscillatory strain amplitudes. Particle shapes taken from microscopy of a diluted r8 sample, with roughly to-scale inter-particle distances. Shown for (A)
Ultimately, shear jamming (Liu and Nagel, 2010; Morris, 2023) is to be expected and its beginning indicated by the prominent increase of the storage modulus with simultaneous decrease of
Strain softening or strain thinning, as observed in the first part, is said to be common among many complex fluids, like polymer melts and suspensions. This is attributed to alignment of the micro-structure (Hyun et al., 2002). However, the local minimum and maximum in the curve do not match any one of the four archetypes of behavior that were proposed by Hyun et al. (2002) for large amplitude oscillatory shear (LAOS) measurements on complex fluids. These archetypes were based on extensive literature review, but mainly included polymer melts, solutions, emulsions, or colloidal suspensions. Instead, the curves measured here for non-colloidal, concentrated crystal suspensions seem to resemble a combination of strain thinning and strain overshoot.
Similar behavior was also observed before in different systems. Among these are suspensions of 40–55 vol% PMMA spheres in PDMS (Heymann et al., 2002), aqueous PEO-PPO-PEO triblock copolymer solutions of 20 wt% in an intermediate soft gel state (Hyun et al., 2006), suspensions of 47 vol% PVC in PB (Carreau et al., 1999), suspensions of 1 mg mL−1 epidermal keratin intermediate filaments (Ma et al., 1999), silty clay of broad size distribution and concentrations between 50 and 60 wt% (Wang et al., 2023), and other mud sediments (Shakeel et al., 2020).
While Heymann et al. (2002) and Hyun et al. (2006) both attribute the minimum to a change of the particle network into a flow-optimized structure, Hyun et al. (2006) explain the maximum by polymer clusters that first aggregate and then break apart with increasing shear. Carreau et al. (1999) suggest either crowding or steric effects as the cause of the strain hardening in PVC/PB suspensions. Shakeel et al. (2020) mainly point to a two-stress yielding caused by the flocculated micro-structure of mud that contains organic matter, and mention the possibility of jamming in a sidenote.
Our measurements, however, show that the described behavior is also observed for hard particles that do not form agglomerates and show now steric effects (see also Section 3.5 and the comparative measurements below). It is thus concluded to mainly stem from the high particle concentration present in the suspension, independent of material or details in shape. The proposed jamming behavior is also in agreement with previous research on strain thickening in concentrated suspension (Lemaire et al., 2023).
For example, shear reversal experiments on faceted sugar particles in oil were used to deduct their jamming packing fraction. Depending on the exerted shear stress, it was calculated to be in the range of 43%–50% (Blanc et al., 2018). As the suspensions in our study contain about 50% particles, this strengthens our argument of jamming behavior. Similarly, Hafid et al. (2016) measured the jamming packing fraction for suspensions of rough sand particles with an aspect ratio of 1.5 to be of the order of 45%. Again, both aspect ratio and jamming particle fraction are close to the samples of the present study.
More generally, the oscillatory strain sweeps presented here show similarities to results from various studies on shear rate-dependent viscosity of concentrated non-Brownian suspensions (Pal, 2024). These are known to display shear thinning with subsequent shear thickening under rotational shear. Recent studies showed that this behavior is explained by the transition from a lubricated to a friction-dominated state that increases significantly with increasing friction coefficient and particle irregularity (Lemaire et al., 2023; Pal, 2024). While such monotonic rotational shear induces considerably different processes than oscillatory shear (Blanc et al., 2018; Martone et al., 2020), together they allow a clearer picture of the processes at hand.
Although significant deviations among repetitions are observed for each sample and thus error bars overlap throughout the measurements, some trends among the mean values are visible. It is striking that there is no significant difference in
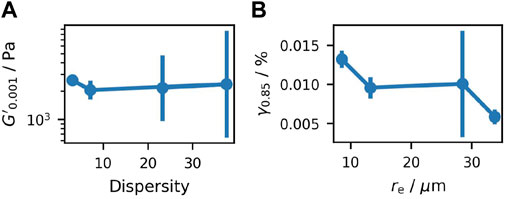
Figure 8. Analysis of the amplitude sweeps, showing (A) the value of
The limit of the linear visco-elastic region is often conventionally defined as the strain where a deviation in
Figure 8B shows the mean values of
Given the lack of precision in determining the LVE region, a strain of
The strain at which
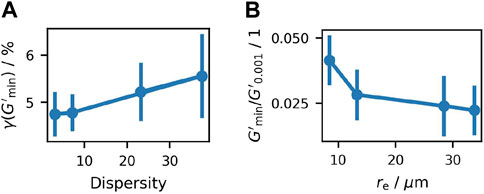
Figure 9. Analysis of the amplitude sweeps, showing (A) the value of
At its local minimum, the value of
To better understand the influence of particle shapes vs sizes, additional amplitude sweeps were performed using different suspensions for comparison: First, glass beads with a mean radius of 45 µm were used. Second, milled sucrose was wet-sieved to achieve a low dispersity with particle radii ranging from 35 to 50 µm. Both were mixed with saturated sucrose solution at the same volume fraction of about 50% as calculated for the samples prepared by crystallization. Third, data from a former publication by Hartge et al. (2024) are compared, where a similar amplitude sweep was performed with a crystallized suspension containing a calculated particle volume fraction of 36.2% (see the Supporting Information of the publication, where the measurement was performed with serrated plates). The latter particles are calculated to have a mean radius of about 25 µm.
Microscopy images as well as results of the image analysis of these suspension are shown in Section 3 of the Supplementary Material. There, the results are plotted next to values of samples r28 and r34 for comparability. The results of the amplitude sweeps are shown in Figure 10.

Figure 10. Amplitude sweeps of samples containing (50.3±0.3)% (V/V) of sucrose crystals with large dispersity (“r34”), 49.4% (V/V) milled sucrose with low dispersity, 49.4% (V/V) glass beads with low dispersity, and a sample containing
As can be readily observed, all curves exhibit the same local minimum and maximum in both the storage modulus and loss factor as for the sucrose suspensions discussed above. This is despite the fact that the glass beads in particular exhibit significant differences in terms of their size distribution, shape, and material composition. This confirms the universality of this behavior for hard particle suspensions of rather compact particle shapes and volume fractions between 30% and 50% in a Newtonian solution under oscillatory shear. Nevertheless, at comparable volume fraction and size, the glass bead suspension exhibits a storage modulus that is two orders of magnitude smaller than that of the fondant samples. In contrast, the loss factor is markedly larger for the glass bead suspension, with the milled sucrose suspension exhibiting a value intermediate to the two.
Both differences can be explained by the rounded shape of the milled sucrose and nearly ideal spherical shape of the glass beads. The smoother spherical surface of these particles results in reduced friction (Lemaire et al., 2023) and also prevents them from becoming trapped in the interstitial spaces of other particles with irregular shapes and rough surfaces. Spherical particles were thus also shown to require larger packing fractions for jamming (Hafid et al., 2016), corresponding to the shift of the minimum to higher strain values. Furthermore, at an equivalent particle volume fraction, a lesser volume of liquid is “lost” within the cavities, and the surface area for smooth, spherical particles is reduced. All together, these points lead to much smaller resistance to shear forces by the suspension and smaller storage and loss moduli. Additionally, because of reduced inter-particle interaction, the loss factor
These observations suggest that surface roughness has a greater influence on the resulting moduli than either total surface area or mean particle size alone. This is also consistent with previous research. Lemaire et al. (2023) show in their recent compilation of experimental and numerical results on concentrated, non-Brownian suspensions that viscosity, shear thinning, and shear thickening are dependent on the contact forces and friction coefficient of suspended particles. It was also found by a numerical study that inter-particle contact contributions were dominant over hydrodynamic contributions for particle volume fractions higher than 40% if frictional particles were considered, but for volume fractions exceeding 50% if particles were frictionless (Lemaire et al., 2023; Gallier et al., 2018).
Similar observations as discussed before can be made for the sample containing a smaller volume fraction of sucrose crystals, but for different reasons. With irregular shapes, high dispersity, and high surface area per particle volume similar to r28 and r34, a reduced modulus and higher loss factor is expected simply because of the higher liquid fraction and less particle contacts. Similarly, the shift of the strain softening to higher stains is expected due to the concentration dependency of the critical strain amplitude for irreversible particle reorganization (Pine et al., 2005).
The decreasing value of
In order to get a better picture of the interactions on different time scales, frequency sweeps were performed. Storage moduli
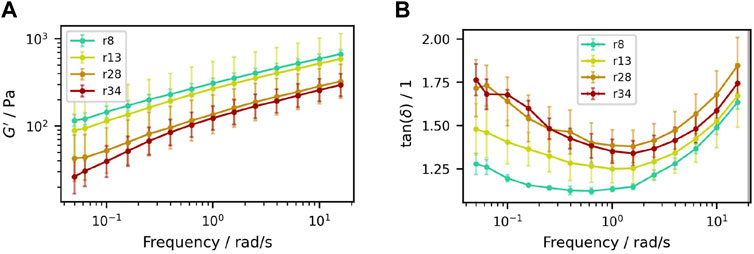
Figure 11. Frequency sweeps of samples containing (50.3±0.3)% (V/V) sucrose crystals with different particle size distributions. (A) Storage modulus
The curves of
Nevertheless, it is also observed that the mean moduli are lower and the loss factor is higher for larger particle size and dispersity, with an increasing discrepancy at low frequencies. This follows the expectation that there is an effect of particle size on time scale dependent dynamics. Such effects are often associated with sedimentation processes in suspensions: If the fluid behavior dominates over the solid interactions for frequencies approaching equilibrium state, sedimentation can occur. Given that
Simple sedimentation experiments were therefore carried out for comparison. 10 mL of each sample were placed in sealed scaled test tubes and kept in a climate chamber at 25°C for 1 month. The photographs of these tubes can be found in Section 4 of the Supplementary Material. They show that by eyesight, none of the samples sedimented after 1 day, which confirms stability over the course of the rheological measurements. While the two samples with the smallest particles, r8 and r13, remained stable even after 1 week, the two samples with the largest particles and dispersity, r28 and r34, show varying degrees of phase separation within 3 days. After 1 month, all samples showed a significant liquid fraction on top and a clearly stronger sedimentation for larger particles. The rather slow sedimentation with significant dependency on the particle size distribution thus confirms the observations from the frequency sweeps.
Following the observations from the time sweeps in Section 3.2, the interpretation above was validated by correcting for the measured changes over time. This was done in two ways to account for both possible moisture loss and relaxation effects: First, it was assumed the sample is least affected by the measurement at
The plotted results can be found in the Supplementary Figure S6. Corrections with respect to the starting value at
Thixotropy tests were conducted with the objective of acquiring a more profound comprehension of the structural formation, reversibility, and relaxation times of the samples. The results are shown in Figure 12.
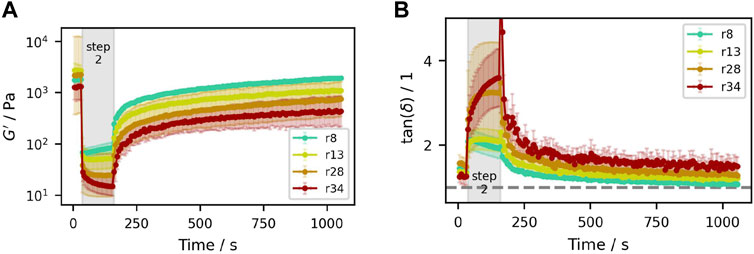
Figure 12. Thixotropy tests of samples containing (50.3±0.3)% (V/V) particles with different size distributions. (A) Storage modulus
The tests were performed by three consecutive steps: First, small amplitude oscillations at
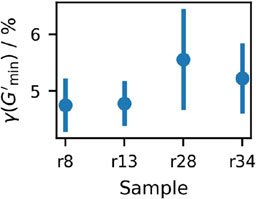
Figure 13. Strain at which
All of the studied suspensions show clear thixotropic behavior, with a pronounced drop in both moduli in step two at larger strain, and significant structure rebuilding in step three at close-to static conditions. In accordance with the amplitude sweeps, the samples show a minimum in
The destruction and rebuilding of aggregates is sometimes discussed as a possible cause of thixotropic behavior in suspensions (Mewis and Wagner, 2012; Shakeel et al., 2020). As already discussed in Section 3.2 though, the attractive inter-particle forces are too weak to withstand the shear forces even at the low strains of
Here, the minimum is the result of collision-induced self-organization also found in concentrated suspensions of hard spheres (Corté et al., 2008; Metzger and Butler, 2012). It is also observed that the slope of the curve becomes steeper with larger particle size and dispersity, and it takes longer for these samples until an equilibrium is reached. That is because smaller particles are much faster aligned in a friction minimizing way at the same strain amplitude, while optimal arrangement of the larger particles takes more oscillations and thus longer.
For a better picture of what the dynamics in this step might look like, an in situ video on a similar sample provided with an earlier study (Hartge et al., 2024) might be instructive. The video shows oscillations in a crystallizing sample with
In the third step, when the strain is set back to
However, with
Again, the described dynamics might be illustrated by a video found in the Supplementary Material to this article. Here, a freshly prepared r28 sample was placed under the microscope and recorded at static conditions over night. This video clearly shows how small particles rearrange over time even without imposed shear, while larger ones remain unchanged.
In all, the thixotropy tests confirm clear thixotropy of all samples, with a significant dependency on size distribution. Even if the changes observed in the time sweeps of Section 3.2 are taken into account (see Section 5 of the Supplementary Material), these relations do not change, proving that they are distinct processes.
However, these findings explain the changes that were observed in the time sweeps. There, before the start of the measurement, the samples were compressed. While this imposes different forces within the sample than parallel shear, it can be expected to have a similar effect on the particle arrangement considering the chosen parameters: The samples were compressed by 5% in height prior to the measurements, which by coincidence is of a similar value as the strain amplitudes for which the minimum in the moduli occurs at parallel oscillations. The observed increase in the time sweeps are thus expected to result from similar random rearrangements of the crystals as in the thixotropy tests. However, the effect is much smaller in the time sweep. This is because the compression is only a one-time displacement, while the thixotropy tests clearly show stronger moduli decrease with more oscillations.
This particular form of thixotropy is also observed in other concentrated suspensions, such as clay (Boswell, 1951). While for clay, electrolytes may contribute to the phenomenon, the particle shape and mechanical reorganization is believed to play a significant role in the time dependency of the observed shear thinning and relaxation.
The investigation of concentrated, hard-particle, non-colloidal suspensions provides interesting results but challenging non-equilibrium conditions. Because the particle sizes are of the order of ten micro meters, Brownian motion and thermal relaxation mechanisms are negligible. Additionally, with a particle volume fraction of about 50%, these suspensions show properties similar to both soft matter and granular materials. Specifically, the systems are highly path-dependent, and each state of the system is a result of the previous history.
It can be concluded that the results observed in the aforementioned measurements are contingent upon the selected sample preparation and experimental methodology. While interesting conclusions can be drawn from the observations which help understand the complex kinetics in such suspensions, it is important to keep in mind that the exact experimental results are context dependent.
The strain accumulation in the system that comes with the oscillatory measurements will thus lead to different results depending on the chosen procedure. This is especially visible in the presented thixotropy tests and, to a lesser extent, in the time sweeps.
Thus during all rheological measurements, time and oscillation-cycle dependent effects have to be taken into account. While the chosen geometry of parallel plates allows detailed studies even at the given large viscosities and particle sizes, the sample is slightly compressed when loaded between the plates, resulting in thixotropic relaxation processes. Additionally, the open set-up can lead to artifacts resulting from hygroscopy at high air humidity or drying processes at low air humidity. This combination presents challenges when interpreting measurements of model fondants.
However, it is shown that by working with conditioned air (increased humidity), drying effects are substantially reduced. The remaining temporal changes observed in our study are concluded to mainly result from relaxation after compression, where accumulated oscillation cycles lead to arbitrary reorientation. Since these effects are small compared to the strain amplitude or frequency dependent changes, they do not affect the conclusions drawn from the respective measurements. However, such processes must be carefully considered when choosing setup and measurement times, and the effects have to be included in the interpretation of results depending on the selected geometry.
The formation of highly concentrated suspensions of sucrose crystals in a saturated sucrose solution bears resemblance to a number of products that are widely used in both the confectionery industry and sugar production, including fondants and slurries. Furthermore, they present a simple yet fascinating model system of concentrated hard particle suspensions with irregular particles distributed in a Newtonian liquid for fundamental research.
This work presents a study of rheological properties of such suspensions in combination with a thorough analysis of size and shape characteristics of the contained particles. We were able to show that at particle volume fractions of about 50%, all suspensions show a characteristic course of storage and loss moduli in the amplitude sweep. The occurrence of a local minimum and subsequent local maximum in both moduli are independent of the exact concentration, width of size distribution, mean size, and shape.
This investigation thus complements previous research on systems like polymer bead suspension or mud, indicating a universal behavior of such concentrated suspensions. At the same particle volume fraction, differences in rheological properties depend mainly on width of the size distribution and shape next to particle size. Even though mean particle radii ranged from about 8 μm to 34 µm and dispersity varies from 3 to 37, storage and loss modulus do not show significant differences at small strains.
However, strain softening starts earlier for samples with larger mean size and larger dispersity, and the local minimum is more pronounced. Similar observations are made in thixotropy tests, where samples with larger size and dispersity reach their minimum in
Frequency sweeps showed parallel, nearly linear courses of the moduli, with no crossing-point of
These samples also showed less build-up of storage and loss modulus after moderate shear in the thixotropy tests. This is explained by lower degrees of freedom for these samples at small oscillations, since large particles are moved less due to their bigger inertia. Consequently, the microstructure of samples with larger particles is changed less at small strains. Thus the new state of equilibrium (which depends on the strain amplitude) is closer to the previous optimized state, and this equilibrium is reached more quickly compared to samples with smaller particles. However, thixotropy is observed for all suspensions under study.
With these results, we provide deeper insights into the rheology of concentrated suspensions of irregular hard particles that are often encountered in crystal production, confectionery industry, or similar applications. In combination with image analysis, we were able to draw relations between microscopic properties of the samples to macroscopic, rheological behavior.
The chosen samples also present model systems simple in composition that allow the results to be transferred to other areas, like processing of mineral slurries and pastes. Our findings even demonstrate universality in the visco-elastic behavior of concentrated suspensions containing hard particles with compact shapes.
The raw data supporting the conclusions of this article will be made available by the authors, without undue reservation.
HH: Conceptualization, Data curation, Formal Analysis, Investigation, Methodology, Project administration, Software, Validation, Visualization, Writing–original draft, Writing–review and editing. EF: Conceptualization, Methodology, Supervision, Writing–review and editing. TV: Conceptualization, Methodology, Project administration, Resources, Supervision, Writing–review and editing.
The author(s) declare that no financial support was received for the research, authorship, and/or publication of this article.
We wish to acknowledge the support of Südzucker AG (Mannheim, Germany) who provided the sucrose and laboratory kneader used for sample preparations. We thank the referees for their helpful and constructive criticism, which allowed improvement of the manuscript.
The authors declare that the research was conducted in the absence of any commercial or financial relationships that could be construed as a potential conflict of interest.
The author(s) declared that they were an editorial board member of Frontiers, at the time of submission. This had no impact on the peer review process and the final decision.
The author(s) declare that no Generative AI was used in the creation of this manuscript.
All claims expressed in this article are solely those of the authors and do not necessarily represent those of their affiliated organizations, or those of the publisher, the editors and the reviewers. Any product that may be evaluated in this article, or claim that may be made by its manufacturer, is not guaranteed or endorsed by the publisher.
The Supplementary Material for this article can be found online at: https://www.frontiersin.org/articles/10.3389/frsfm.2025.1527707/full#supplementary-material
Blanc, F., D’Ambrosio, E., Lobry, L., Peters, F., and Lemaire, E. (2018). Universal scaling law in frictional non-Brownian suspensions. Phys. Rev. Fluids 3, 114303. doi:10.1103/PhysRevFluids.3.114303
Boswell, P. G. H. (1951). The determination of the thixotropic limits of sediments. Geol. J. 1, 1–22. doi:10.1002/gj.3350010102
Burke, J., and Hartel, R. (2021). Stickiness of sugar syrups with and without particles. J. Food Eng. 290, 110222. doi:10.1016/j.jfoodeng.2020.110222
Carreau, P., Lavoie, P., and Yziquel, F. (1999). Rheological properties of concentrated suspensions. Rheol. Ser. (Elsevier) 8, 1299–1345. doi:10.1016/S0169-3107(99)80019-7
Corté, L., Chaikin, P. M., Gollub, J. P., and Pine, D. J. (2008). Random organization in periodically driven systems. Nat. Phys. 4, 420–424. doi:10.1038/nphys891
Coussot, P. (1997). “Mudflow rheology and dynamics,” in IAHR/AIRH monograph series. Rotterdam: A.A. Balkema.
De Souza, A. C., Telis-Romero, J., and Telis, V. R. N. (2010). Rheological characterization of suspensions of sucrose crystals in saturated sucrose solutions. J. Food Process Eng. 33, 992–1009. doi:10.1111/j.1745-4530.2008.00320.x
De Yoreo, J. J., and Vekilov, P. G. (2018). “Principles of crystal nucleation and growth,” in Biomineralization. Editors P. M. Dove, J. J. De Yoreo, and S. Weiner (Berlin, Boston: De Gruyter), 57–94.
Einstein, A. (1906). Eine neue Bestimmung der Moleküldimensionen. Ann. Phys. 324, 289–306. doi:10.1002/andp.19063240204
Einstein, A. (1911). Berichtigung zu meiner Arbeit:, Eine neue Bestimmung der Moleküldimensionen. Ann. Phys. 34, 591–592. doi:10.1002/andp.19113390313
Ewoldt, R. H., Johnston, M. T., and Caretta, L. M. (2015). Experimental challenges of shear rheology: how to avoid bad data. Biol. Med. Phys. Biomed. Eng., 207–241. doi:10.1007/978-1-4939-2065-5_6
Faria, N., Pons, M. N., Feyo de Azevedo, S., Rocha, F. A., and Vivier, H. (2003). Quantification of the morphology of sucrose crystals by image analysis. Powder Technol. 133, 54–67. doi:10.1016/S0032-5910(03)00078-0
Ferreira, A., Faria, N., and Rocha, F. (2008). Roughness effect on the overall growth rate of sucrose crystals. J. Cryst. Growth 310, 442–451. doi:10.1016/j.jcrysgro.2007.11.031
Ferreira, A., Faria, N., Rocha, F., and Teixeira, J. (2011). Using an online image analysis technique to characterize sucrose crystal morphology during a crystallization run. Industrial and Eng. Chem. Res. 50, 6990–7002. doi:10.1021/ie2001499
Gadala-Maria, F., and Acrivos, A. (1980). Shear-induced structure in a concentrated suspension of solid spheres. J. Rheology 24, 799–814. doi:10.1122/1.549584
Gallier, S., Peters, F., and Lobry, L. (2018). Simulations of sheared dense noncolloidal suspensions: evaluation of the role of long-range hydrodynamics. Phys. Rev. Fluids 3, 042301. doi:10.1103/PhysRevFluids.3.042301
Galmarini, M., Chirife, J., Zamora, M., and Pérez, A. (2008). Determination and correlation of the water activity of unsaturated, supersaturated and saturated trehalose solutions. LWT - Food Sci. Technol. 41, 628–631. doi:10.1016/j.lwt.2007.04.007
Guazzelli, É., and Pouliquen, O. (2018). Rheology of dense granular suspensions. J. Fluid Mech. 852, P1. doi:10.1017/jfm.2018.548
Hafid, H., Ovarlez, G., Toussaint, F., Jezequel, P., and Roussel, N. (2016). Effect of particle morphological parameters on sand grains packing properties and rheology of model mortars. Cem. Concr. Res. 80, 44–51. doi:10.1016/j.cemconres.2015.11.002
Hartge, H. M., Flöter, E., and Vilgis, T. A. (2023). Crystallization in highly supersaturated, agitated sucrose solutions. Phys. Fluids 35, 064120. doi:10.1063/5.0150227
Hartge, H. M., Flöter, E., and Vilgis, T. A. (2024). Rheo-microscopy and flow properties of crystallizing agitated sucrose dispersions. Phys. Fluids 36, 013330. doi:10.1063/5.0185587
Heymann, L., Peukert, S., and Aksel, N. (2002). Investigation of the solid–liquid transition of highly concentrated suspensions in oscillatory amplitude sweeps. J. Rheology 46, 93–112. doi:10.1122/1.1423314
Hyun, K., Kim, S. H., Ahn, K. H., and Lee, S. J. (2002). Large amplitude oscillatory shear as a way to classify the complex fluids. J. Newt. Fluid Mech. 107, 51–65. doi:10.1016/S0377-0257(02)00141-6
Hyun, K., Nam, J. G., Wilhellm, M., Ahn, K. H., and Lee, S. J. (2006). Large amplitude oscillatory shear behavior of PEO-PPO-PEO triblock copolymer solutions. Rheol. Acta 45, 239–249. doi:10.1007/s00397-005-0014-x
International Commission for Uniform Methods of Sugar Analysis (2019). ICUMSA methods book 2019. Berlin, Germany: Dr. Albert Bartens KG.
Israelachvili, J. N. (2011). Intermolecular and surface forces. 3rd ed edn. (Burlington (Mass.): Academic Press.
Krieger, I. M., and Dougherty, T. J. (1959). A mechanism for non-Newtonian flow in suspensions of rigid spheres. Trans. Soc. Rheology 3, 137–152. doi:10.1122/1.548848
Krom, J., Meister, K., and Vilgis, T. A. (2024). Simple method to assess foam structure and stability using hydrophobin and BSA as model systems. ChemPhysChem 25, e202400050. doi:10.1002/cphc.202400050
Lees, R. (1965). Factors affecting crystallization in boiled sweets, fondants and other confectionery. No. 42 in Scientific and Technical Surveys (Leatherhead, Surrey: The British Food Manufacturing Industries Research Association)
Lemaire, E., Blanc, F., Claudet, C., Gallier, S., Lobry, L., and Peters, F. (2023). Rheology of non-Brownian suspensions: a rough contact story. Rheol. Acta 62, 253–268. doi:10.1007/s00397-023-01394-z
Liu, A. J., and Nagel, S. R. (2010). The jamming transition and the marginally jammed solid. Annu. Rev. Condens. Matter Phys. 1, 347–369. doi:10.1146/annurev-conmatphys-070909-104045
Liu, Z., Li, Y., and Kowk, K. (2001). Mean interparticle distances between hard particles in one to three dimensions. Polymer 42, 2701–2706. doi:10.1016/S0032-3861(00)00635-2
Liu, Z. H., Li, R. K. Y., Tjong, S. C., Choy, C. L., Zhu, X. G., Qi, Z. N., et al. (1999). Influence of particle dispersion on the matrix ligament thickness of polymer blends. Polymer 40, 2903–2915. doi:10.1016/S0032-3861(98)00533-3
Luckham, P. F., and Ukeje, M. A. (1999). Effect of particle size distribution on the rheology of dispersed systems. J. Colloid Interface Sci. 220, 347–356. doi:10.1006/jcis.1999.6515
Ma, L., Xu, J., Coulombe, P. A., and Wirtz, D. (1999). Keratin filament suspensions show unique micromechanical properties. J. Biol. Chem. 274, 19145–19151. doi:10.1074/jbc.274.27.19145
Martone, R., Carotenuto, C., and Minale, M. (2020). Non-Brownian Newtonian suspensions may be rate dependent in time sweep oscillatory shear flow. J. Rheology 64, 1075–1085. doi:10.1122/8.0000077
Metzger, B., and Butler, J. E. (2012). Clouds of particles in a periodic shear flow. Phys. Fluids 24, 021703. doi:10.1063/1.3685537
Mewis, J., and Wagner, N. J. (2012). Colloidal suspension rheology. 1 edn. Cambridge University Press. doi:10.1017/CBO9780511977978
Mezger, T. G. (2014). Handbook of rheology: for users of rotational and oscillatory rheometers. Hanover, Germany: Vincentz Network GmbH and Co KG.
Mooney, M. (1951). The viscosity of a concentrated suspension of spherical particles. J. Colloid Sci. 6, 162–170. doi:10.1016/0095-8522(51)90036-0
Morris, J. F. (2023). Progress and challenges in suspension rheology. Rheol. Acta 62, 617–629. doi:10.1007/s00397-023-01421-z
Ozcan, O., Yildirim, R. M., Toker, O. S., Akbas, N., Ozulku, G., and Yaman, M. (2019). The effect of invertase concentration on quality parameters of fondant. J. Food Sci. Technol. 56, 4242–4250. doi:10.1007/s13197-019-03894-4
Pal, R. (2015). Rheology of suspensions of solid particles in power-law fluids. Can. J. Chem. Eng. 93, 166–173. doi:10.1002/cjce.22114
Pal, R. (2024). Non-Newtonian behaviour of suspensions and emulsions: review of different mechanisms. Adv. Colloid Interface Sci. 333, 103299. doi:10.1016/j.cis.2024.103299
Papadopoulou, A., Gillissen, J. J. J., Tiwari, M. K., and Balabani, S. (2020). Effect of particle specific surface area on the rheology of non-brownian silica suspensions. Materials 13, 4628. doi:10.3390/ma13204628
Peres, A. M., and Macedo, E. A. (1996). Thermodynamic properties of sugars in aqueous solutions: correlation and prediction using a modified UNIQUAC model. Fluid Phase Equilibria 123, 71–95. doi:10.1016/S0378-3812(96)90013-8
Pine, D. J., Gollub, J. P., Brady, J. F., and Leshansky, A. M. (2005). Chaos and threshold for irreversibility in sheared suspensions. Nature 438, 997–1000. doi:10.1038/nature04380
Quintas, M., Brandão, T. R. S., Silva, C. L. M., and Cunha, R. L. (2006). Rheology of supersaturated sucrose solutions. J. Food Eng. 77, 844–852. doi:10.1016/j.jfoodeng.2005.08.011
Schindelin, J., Arganda-Carreras, I., Frise, E., Kaynig, V., Longair, M., Pietzsch, T., et al. (2012). Fiji: an open-source platform for biological-image analysis. Nat. Methods 9, 676–682. doi:10.1038/nmeth.2019
Shakeel, A., Kirichek, A., and Chassagne, C. (2020). Effect of pre-shearing on the steady and dynamic rheological properties of mud sediments. Mar. Petroleum Geol. 116, 104338. doi:10.1016/j.marpetgeo.2020.104338
Stringer, C., Wang, T., Michaelos, M., and Pachitariu, M. (2021). Cellpose: a generalist algorithm for cellular segmentation. Nat. Methods 18, 100–106. doi:10.1038/s41592-020-01018-x
Tadros, T. F. (2010). Rheology of dispersions: principles and applications. Weinheim, Germany: Wiley-VCH Verlag GmbH and Co. KGaA. doi:10.1002/9783527631568
Tanner, R. I. (2018). Review Article: aspects of non-colloidal suspension rheology. Phys. Fluids 30, 101301. doi:10.1063/1.5047535
Telis, V., Telis-Romero, J., Mazzotti, H., and Gabas, A. (2007). Viscosity of aqueous carbohydrate solutions at different temperatures and concentrations. Int. J. Food Prop. 10, 185–195. doi:10.1080/10942910600673636
Toda, K., and Furuse, H. (2006). Extension of Einstein’s viscosity equation to that for concentrated dispersions of solutes and particles. J. Biosci. Bioeng. 102, 524–528. doi:10.1263/jbb.102.524
Vaccari, G., and Mantovani, G. (1995). “Sucrose crystallization,” in Sucrose: properties and applications. Editors M. Mathlouthi, and P. Reiser (Boston, MA: Springer US), 33–74. doi:10.1007/978-1-4615-2676-6
VanHook, A. (1983). Habit modifications of sucrose crystals: a lecture. J. Am. Soc. Sugar Beet Technol. 22, 60–72. doi:10.5274/jsbr.22.1.60
Waisman, A., Norris, A. M., Elías Costa, M., and Kopinke, D. (2021). Automatic and unbiased segmentation and quantification of myofibers in skeletal muscle. Sci. Rep. 11, 11793. doi:10.1038/s41598-021-91191-6
Keywords: rheology, fondant, strain softening, strain hardening, thixotropy, crystal suspension, sucrose
Citation: Hartge HM, Flöter E and Vilgis TA (2025) Rheology of concentrated crystal suspensions: sucrose fondants as hard particles in soft matter. Front. Soft Matter 5:1527707. doi: 10.3389/frsfm.2025.1527707
Received: 13 November 2024; Accepted: 06 January 2025;
Published: 04 February 2025.
Edited by:
Christophe Schmitt, Nestlé Research, SwitzerlandReviewed by:
Adam Stewart Burbidge, Nestec SA, SwitzerlandCopyright © 2025 Hartge, Flöter and Vilgis. This is an open-access article distributed under the terms of the Creative Commons Attribution License (CC BY). The use, distribution or reproduction in other forums is permitted, provided the original author(s) and the copyright owner(s) are credited and that the original publication in this journal is cited, in accordance with accepted academic practice. No use, distribution or reproduction is permitted which does not comply with these terms.
*Correspondence: Hannah M. Hartge, aGFydGdlQG1waXAtbWFpbnoubXBnLmRl; Thomas A. Vilgis, dmlsZ2lzQG1waXAtbWFpbnoubXBnLmRl
Disclaimer: All claims expressed in this article are solely those of the authors and do not necessarily represent those of their affiliated organizations, or those of the publisher, the editors and the reviewers. Any product that may be evaluated in this article or claim that may be made by its manufacturer is not guaranteed or endorsed by the publisher.
Research integrity at Frontiers
Learn more about the work of our research integrity team to safeguard the quality of each article we publish.