- 1Hathaway Brown High School, Case Western Reserve University, Cleveland, OH, United States
- 2Department of Biomedical Engineering, Case Western Reserve University, Cleveland, OH, United States
Affinity-mediated drug delivery utilizes electrostatic, hydrophobic, or other non-covalent interactions between molecules and a polymer to extend the timeframe of drug release. Cyclodextrin polymers exhibit affinity interaction, however, experimentally testing drug candidates for affinity is time-consuming, making computational predictions more effective. One option, docking programs, provide predictions of affinity, but lack reliability, as their accuracy with cyclodextrin remains unverified experimentally. Alternatively, quantitative structure-activity relationship models (QSARs), which analyze statistical relationships between molecular properties, appear more promising. Previously constructed QSARs for cyclodextrin are not publicly available, necessitating an openly accessible model. Around 600 experimental affinities between cyclodextrin and guest molecules were cleaned and imported from published research. The software PaDEL-Descriptor calculated over 1,000 chemical descriptors for each molecule, which were then analyzed with R to create several QSARs with different statistical methods. These QSARs proved highly time efficient, calculating in minutes what docking programs could accomplish in hours. Additionally, on test sets, QSARs reached R2 values of around 0.7–0.8. The speed, accuracy, and accessibility of these QSARs improve evaluation of individual drugs and facilitate screening of large datasets for potential candidates in cyclodextrin affinity-based delivery systems. An app was built to rapidly access model predictions for end users using the Shiny library. To demonstrate the usability for drug release planning, the QSAR predictions were coupled with a mechanistic model of diffusion within the app. Integrating new modules should provide an accessible approach to use other cheminformatic tools in the field of drug delivery.
1 Introduction
Affinity delivery, which relies on interactions between a drug delivery system and drug molecules, improves effectiveness of medication by extending the duration of drug release and thereby lengthening the duration of the treatment (Rivera-Delgado et al., 2016). Mathematical modeling of these affinity systems has shown that the strength of the affinity interaction, the ratio of host binding sites to guest ligands, and the molecular path length of diffusion influence the transport of molecules out of the system. Of these physical forces, the affinity strength plays an important role in the classification of the system and the timescale of drug release (Fu et al., 2011). Affinity interaction can be associated with a variety of physical properties, including charge, hydrophobicity, Van der Waals forces, etc. In the fields of biomaterials and drug delivery, affinity delivery has been used with small molecule drugs (Wang and von Recum, 2011), proteins (Rivera-Delgado et al., 2016), cytokines, and antibodies (Ortiz et al., 2011).
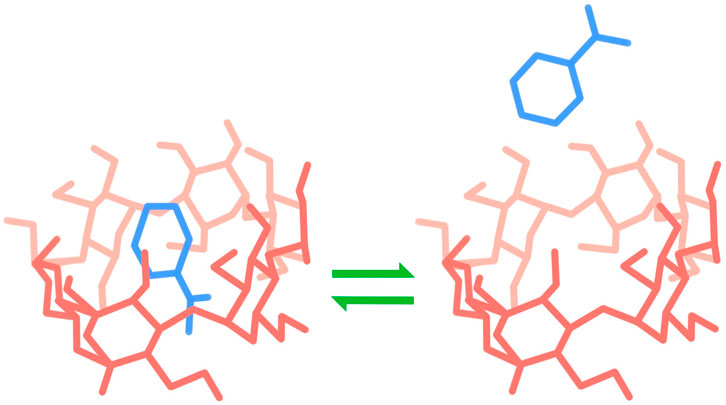
Our lab tests rings of glucose molecules as affinity hosts called cyclodextrins, which are particularly promising affinity drug delivery hosts due to their structural properties, biocompatibility and versatility. The most common cyclodextrin are composed of a ring 6, 7, or 8 glucose molecules (α, β, and γ-cyclodextrin, respectively), and the conformation of the hydroxyl groups of the ring create a basket-like structure with a hydrophobic interior and hydrophilic interior, allowing for complexation with drug molecules (Figure 1). Additionally, cyclodextrin can be polymerized into a variety of materials, including microparticles, viscous gels, and solid films. Unfortunately, experiments to confirm sustained release from the affinity guest-host system often takes weeks, making testing large numbers of potential candidates for cyclodextrin release systems impractical.
As an alternative to experimental testing, candidate molecules can be analyzed computationally. Predicting the binding affinity between cyclodextrin and drug molecules allows for the processing of molecules on the scale of minutes rather than weeks. There are two major methods for predicting molecular interaction: docking models and QSARs. Docking models use molecular force fields, which simulate interactions and potential energy between atoms. Force field parameters may be derived from experiments, calculations from quantum mechanics, or both (Jacob et al., 2012). In addition to providing a numeric estimate for binding affinity, docking programs produce visualizations of how molecules interact. QSARs, or Quantitative Structure-Activity Relationship models, statistically predict molecular interactions using molecular descriptors. Molecular descriptors are certain physical or chemical characteristics of molecules that can be evaluated numerically (for example, the number of hydrogen atoms or the length of the longest bond chain). Many different types of regression models and statistical learning methods can be used as QSARs, ranging in complexity from linear models to artificial neural networks (Dehmer et al., 2012).
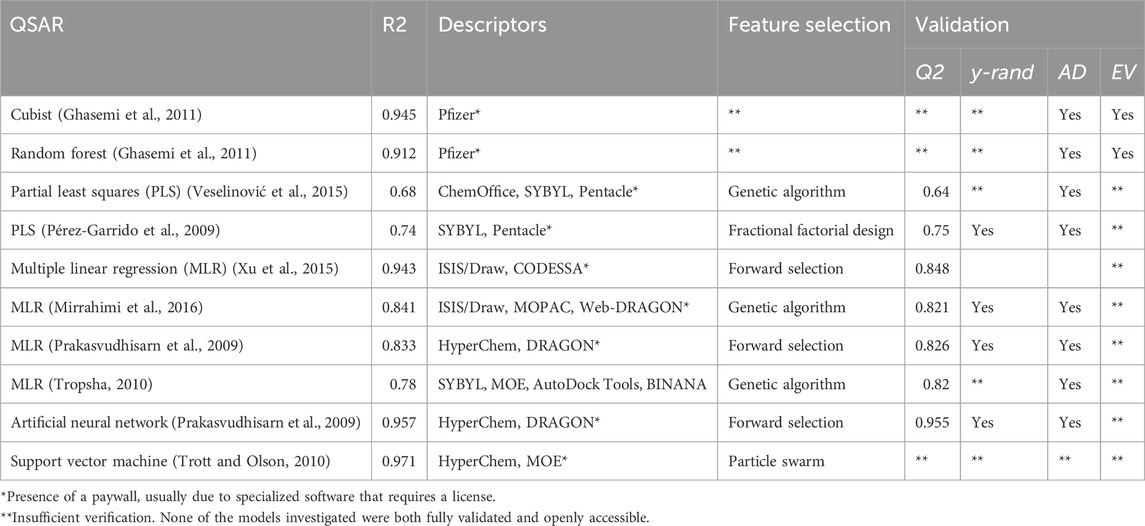
Previous investigations have been made on the accuracy of both docking and QSARs in predicting cyclodextrin affinity, but examining a sample of these papers reveals several concerns (Table 1). Notably, all of the investigated models used software hidden behind a paywall or only available with a license (Pérez-Garrido et al., 2009; Prakasvudhisarn et al., 2009; Ghasemi et al., 2011; Merzlikine et al., 2011; Ahmadi and Ghasemi, 2014; Veselinović et al., 2015; Xu et al., 2015; Mirrahimi et al., 2016). Additionally, many models lacked proper verification. Following Tropsha’s publication detailing best practices for QSAR development, a completely verified model should undergo leave-one-out cross-validation (LOO-CV) (reported as Q2), y-randomization, pass a variety of internal accuracy tests, and be analyzed for applicability domain. Additionally, models should be evaluated on multiple test sets as well as a hold-out external validation set (Tropsha, 2010). Of the papers investigated, none contained the full set of verification strategies.
In this study, the accuracy and usability of docking and QSARs were compared in order to establish an appropriate framework for the computational design of cyclodextrin based affinity delivery devices. Autodock VINA, an open-source docking program developed by Trott, was used to investigate docking methods (Trott and Olson, 2010). A variety of statistical methods presented in previous cyclodextrin QSARs were also investigated. The performance of QSARs was evaluated on both a standard test set as well as an external validation set to confirm accuracy. Properly evaluating the use of docking and QSARs should improve selection of possible guests for cyclodextrin, reducing the rejection of good candidates (Type II error) and limiting experimental investigation of bad candidates (Type I error).
Finally, though the coded models could be made freely available, understanding the raw script remained a significant obstacle for new users. Additionally, users would have to download multiple files and programs to their own computers, creating potential issues with device compatibility, storage restrictions, processor limitations, etc. To overcome these obstacles and improve accessibility, the models were then integrated into a web application built with the R library “shiny” and then uploaded online. To demonstrate the ease of extendability of the app and its value in planning drug delivery strategies the results from the QSAR studies were then integrated into a mechanistic model of drug release.
2 Materials and methods
In order to be accessible, the models use only open-source software. Importing experimental data, cleaning data, and creating QSAR models were performed using R in RStudio. Both the coding language and the IDE are freely downloadable and easily accessible on Windows, Mac OS, and Linux. Descriptors were generated with PaDEL, also freely downloadable and open-source. Only the original observations of cyclodextrin complexation energies remain inaccessible to the public, but this does not have any effect on using the models for new predictions.
2.1 Dataset
Many of the models in Table 1 work from the same data source, a compilation of α- and β-CD affinities published by Suzuki in 2001 (Suzuki, 2001) [additionally, the sources that cite a different paper by Katritzky ultimately use this same data, as the Katritzky paper cites Suzuki for observations (Katritzky et al., 2004)]. In addition to Suzuki, we also compiled complexes of α- and β-CD Rekharsky and Inoue and Suzuki (Rekharsky and Inoue, 1998). Complexes of γ-CD, missing from the Suzuki dataset and sparse in the Rekharsky and Inoue data, were collected from Connors (Connors, 1995). Once compiled, the data were cleaned for reliable information, one-to-one cyclodextrin complexes, a temperature of 298 ± 2 K, and a solvent of water with pH 7. To obtain structure-data files (SDFs) of the ligands, the names of the guest molecules were passed through the Chemical Identifier Resolver, a web interface provided by the National Cancer Institute’s Computer-Aided Drug Design Group (NCI/CADD). To handle the data, the R packages tidyverse, data. table, XML, RCurl, and Matrix were used (Bates et al., 2017; Dowle et al., 2017; Wickham, 2017; Duncan Temple Lang and the CRAN T and eam, 2018a; Duncan Temple Lang and the CRAN Team, 2018b).
Dataset splitting was performed using the R package caret (Kuhn and Quinlan, 2018). First, the cleaned data was split between α-, β-, and γ-CD. Structural and activity outliers in each category were removed. Structural outliers were detected using a statistical method relying on standard deviations of molecular descriptors (Roy et al., 2015). For activity outliers, molecules with reported ΔG values greater than 2.5 standard deviations from the mean were removed. Though traditional practice advises classifies outliers as values more than only two standard deviations away, in this case, retaining data points remained a priority and a larger margin was allowed. There were 9, 21, and 11 α-, β-, and γ-CD outliers, respectively. After removal, around 200, 250, and 100 α-, β-, and γ-CD observations remained.
The data was then split into training, testing data and external validation. For each separate cyclodextrin, an external validation set was created from a random 15% subset of the data. To create multiple training and test sets, the remaining modeling data was split with representative resampling of ΔG values into ten different 75:25 train to test data partitions. Though not as advanced as maximum dissimilarity algorithms, this method proved more practical due to the large number of descriptors (over 1,000) generated for each guest molecule. Furthermore, maximum dissimilarity algorithms, when implemented in this instance, had the unfortunate tendency to select highly similar training and test sets, defeating the purpose of creating multiple sets in the first place.
2.2 Docking calculations
The process of docking is based on two processes: sampling and scoring (Jacob et al., 2012). Sampling refers to the capacity to search an active site on a protein, macromolecule or, in this case, affinity host. This can be performed with distance matrices, matching algorithms or incremental construction, multiple copy simultaneous searching, stochastic methods, or any combination of the aforementioned strategies. Scoring calculates the final binding affinity between the guest and host and can be dependent on force-field, empirical, or knowledge-based calculations. Docking generally involves the use of a host and a guest molecule which can be either rigid or flexible. Three types of conformation exist: rigid-rigid, rigid-flexible and flexible-flexible. In this paper we use AutoDock Vina, a version of AutoDock that uses Monte Carlo stochastic sampling coupled with a force field based scoring function from a resample of a drug like database to derive its weighted parameters. Vina in particular uses a flexible drug guest and a rigid cyclodextrin host, although it allows side chain mobility when docking ligands onto proteins.
The PyRx Virtual Screening Tool provides a variety of services, including molecular energy minimization, docking calculation, and visualization of molecules. PyRx version 0.8 was used here, as further editions require purchase (Dallakyan and J, 2015). Ostensibly, the source code of newer versions of PyRx is freely available, but actually implementing the code requires fairly advanced knowledge of Python, making public usage difficult. To begin, all guest molecules went through energy minimization to determine the most likely atomic configurations. AutoDock Vina, integrated within PyRx, calculated the change in Gibbs free energy (kcal/mol). We tested the effect on the docking process of changes in the search space, search exhaustiveness, and scoring force field type.
2.3 Descriptor generation
The open source software PaDEL-Descriptor calculated over 1,000 descriptors for the remaining molecules, including fingerprints, structural details, and physical properties (Yap, 2011). Additionally, PaDEL-Descriptor removed salts and minimized the energy of inputted files using an MM2 force field. To improve model interpretability, more abstract predictors, such as those related to eigenvalues for molecular matrices or autocorrelation, were excluded from calculation. The elimination of these descriptors did not produce any noticeable effect on final model accuracy and made feature selection less resource intensive.
2.4 Feature selection
Recursive feature elimination (RFE), implemented with caret, was used to subset the predictors used for model-building (Kuhn 2018). Using this method, a random forest model is created using all available descriptors. Once trained, the relative importances of the predictors are calculated and differently sized subsets (defined by the user) of variables are selected to create and evaluate new models. The best combination of predictors is then returned by the model. RFE was performed on each of the ten train-test splits. The predictors determined to be useful for all folds were saved and used for tuning and training the models. This resulted in 13 variables for ⍺-CD, 16 variables for β-CD, and 39 variables for γ-CD.
2.5 QSAR development
We investigated the accuracy of several models that appeared in previous attempts at cyclodextrin QSARS (Table 1), including Cubist models, generalized linear models (GLM or GLMNet), random forests, partial least squares models, and support vector machines. Additionally, two QSAR methods not previously published for cyclodextrin—multivariate adaptive regression splines (MARS) and gradient-boosted models—were created and evaluated. Model building was accomplished with R-packages Cubist, glmnet, randomForest, pls, e1071, earth, and gbm, respectively (Cutler and Wiener, 2015; Mevik and Liland, 2016; Friedman et al., 2017; Kuhn et al., 2017; Meyer et al., 2017).
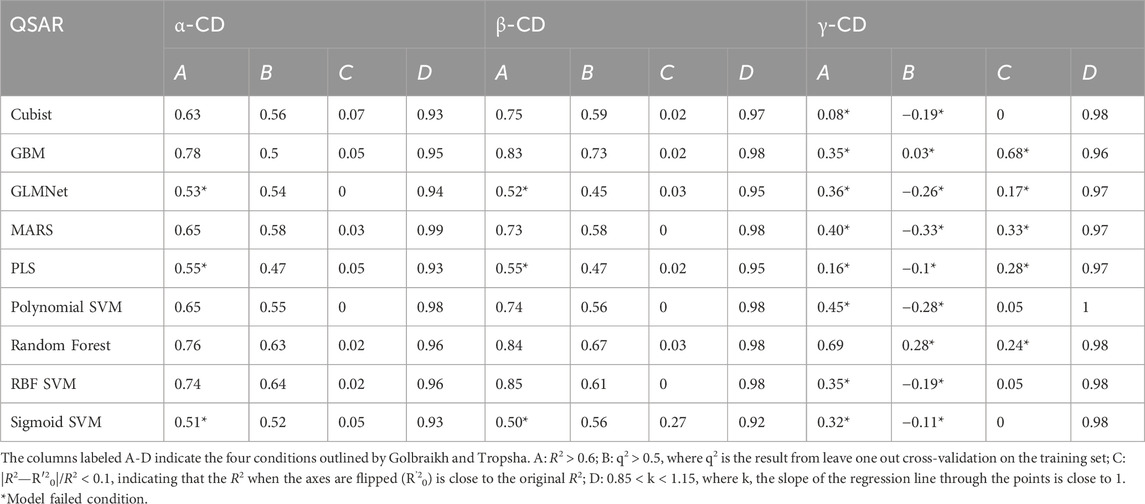
Cross-validation was used to determine ideal tuning parameters for each QSAR. For faster QSARs—such as generalized linear models (GLM) and partial least squares (PLS)—tuning was performed using 10-fold cross validation. For more resource-intensive models or models with large parameter spaces—such as random forests, Cubist and support vector machines (SVM)– only five folds were used. Optimized models, QSARs built with the tuned parameters and trained on the entire training set, were used to predict the test for each combination of test and training set. Further fine tuning was also performed at this step. The model that produced the lowest root-mean square error (RMSE) and highest R2 (or an otherwise most ideal combination) on all the test sets became the final model, i.e., the model saved for future use. Furthermore, the models were evaluated according to Tropsha and Golbraikh standards for QSARs (Golbraikh and Tropsha, 2002). Although R2 and RMSE can be useful for generalizing predictive capacity, they may be misleading in certain cases, necessitating stricter additional standards of evaluation. As an additional test of reproducibility, the final models were used in ensemble to predict the values of the external validation set. Because this dataset was withheld from the entire model training process, the external validation set served to simulate model performance on new data.
2.6 Applicability domain
Applicability domain describes the range of molecules where the model can be expected to generate reliable predictions. A new molecule outside of the applicability domain is structurally quite different from the set of data the model was trained on, and thus a prediction will rely on extrapolation and may not be accurate. The applicability domain of the models was determined with the same method used to detect outliers when cleaning the dataset (Roy et al., 2015).
2.7 Y-randomization
Y-randomization was used to further verify the significance of the results. Many advanced QSAR methods are powerful enough to model data off of noise, so y-randomization ensures that the modelling process produces results significantly more accurate than what could be obtained by chance. Randomization can be achieved by permutation (randomly changing the positions of observed values) or random number generation (replacing observed values with completely new data). Different combinations of permutation and/or random generation yields five different modes of y-randomization to investigate: 1) original ΔG values vs randomly generated descriptors, 2) permuted ΔG vs original descriptors, 3) random ΔG vs original descriptors, 4) random ΔG vs random descriptors, and 5) permuted ΔG vs random descriptors. (Combinations including permutation of descriptors are not included because the large number of predictors in QSARs renders the effects of such a process virtually indistinguishable from random number generation.) However, because the y-randomization process is extremely resource-intensive (as each mode requires that several randomized iterations undergo the modeling process), only mode 1, the most common interpretation of y-randomization, was investigated (Rücker et al., 2007). The observed ΔG values were randomly assigned to guest molecules, and the entire model refitting process was re-done, from feature selection to external validation.
2.8 Creating an app
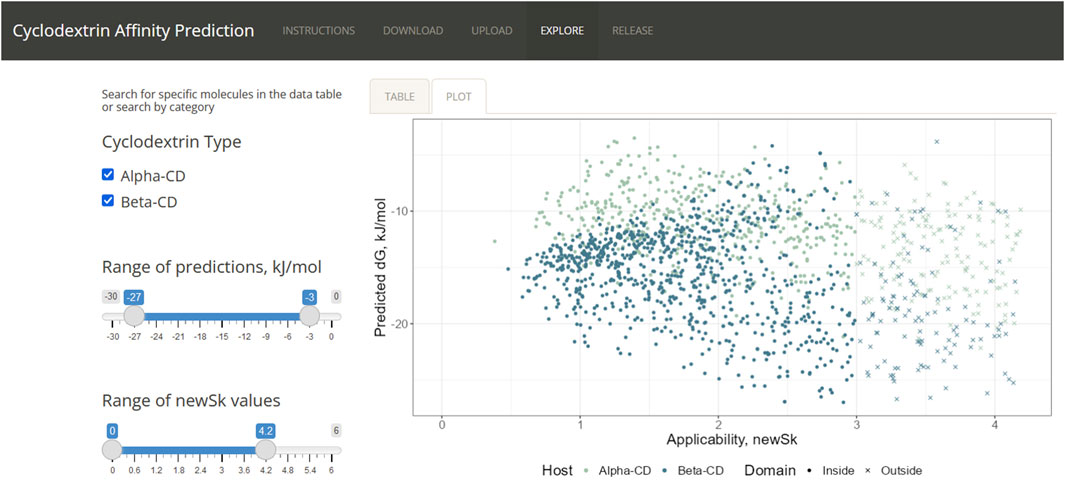
Using R’s “shiny” package, most of the process of running the QSAR could be implemented in a web app. The app was split into three main pages: Download, Upload, and Explore. “Download” accesses Chemical Identifier Resolver and obtain SDFs. The page also draws the obtained molecule using the package “ChemmineR,” allowing the user to check that the SDF is accurate. “Upload” implements the QSARs after the user provides the app with a CSV of the descriptors from PaDEL-descriptor. After calculating the affinity and analyzing the applicability domain of the molecules, the user is provided with both a graph and a table of the results. The third page “Explore,” stores the results of using the ensemble on FDA-approved drugs, as obtained from the annual publication “Orange Book: Approved Drug Products with Therapeutic Equivalence Evaluations.” (Food and Drug Administration, 2019)
2.9 Modeling release curves
Partial differential equations that model drug diffusion were solved using the R package deSolve (Soetaert et al., 2018) using the method of lines as previously done by Fu et al. (2011). In the model, the release media was assumed to be water and the delivery system was assumed to be flat, thin circular cyclodextrin disc. The boundary condition between the polymer and the media was approached as described by Wang and von Recum (2011). Diffusivities of drug molecules were calculated from molecular weight and viscosity using a modified Stokes-Einstein-Sutherland equation, as done by Vulic et al. (2015).
3 Results and discussion
3.1 Performance of docking
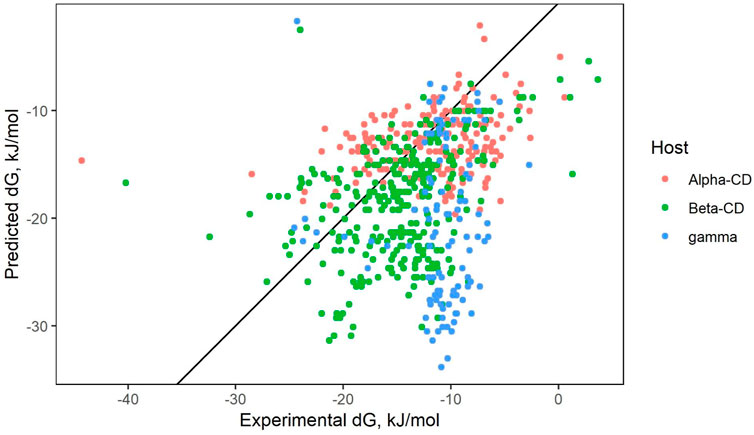
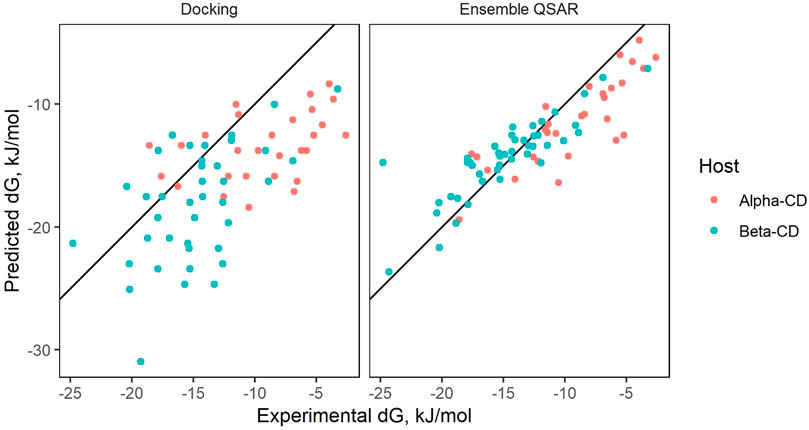
When predicting on the entire cleaned dataset (all modeling data, which includes the training, testing, and external validation set), AutoDock Vina yielded an R2 of 0.18 and a RMSE of 5.00 kJ/mol (Figure 2). Of the 547 cleaned complexes, docking provided calculations for 458, failing to provide data on 89 complexes. Adjusting settings in Vina, such as the minimization algorithm size of the steps in the calculation, did not yield significant differences in accuracy. In comparison, the affinity of only around 40 cleaned molecules could not be obtained by the ensemble QSAR. In these cases, the withheld molecules were determined to be outliers, and the actual QSAR model could still be used to predict a value.
3.2 Performance of QSARs
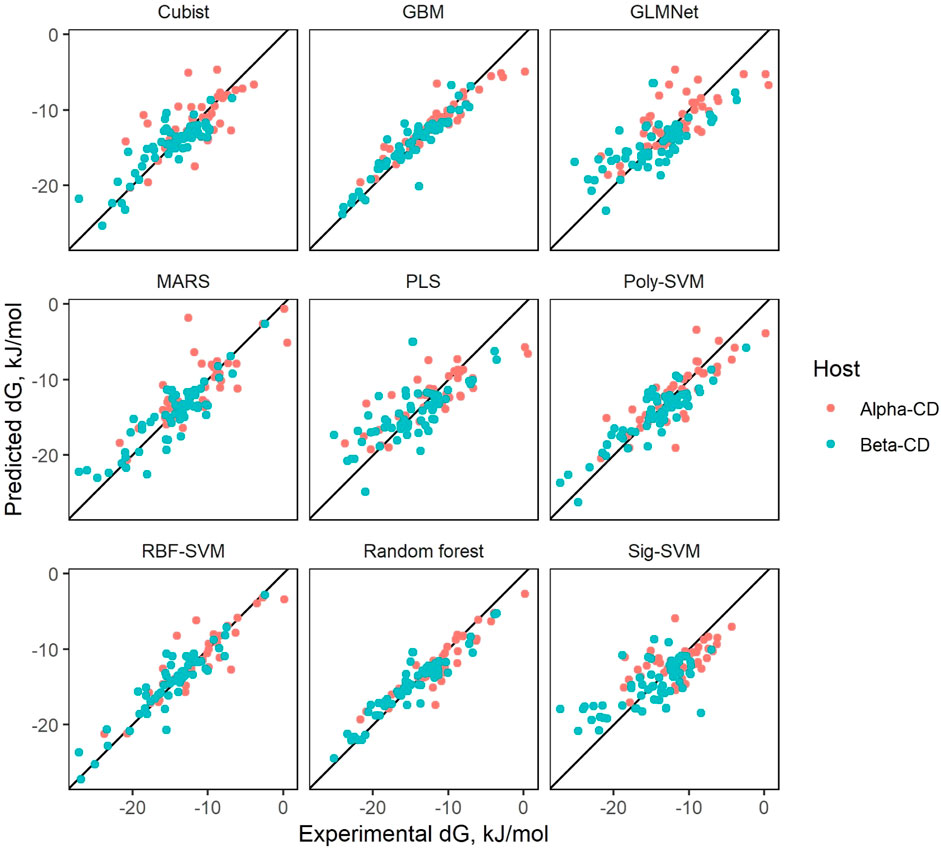
The results of predicting on the test data for each QSAR and cyclodextrin type are markedly higher than docking (with the exception of γ-CD), reaching an R2 of around 0.5 to 0.7, as seen in Table 2 and Figure 3. The reported R2 for each QSAR type is calculated from an average of the performance of the model on all test splits. Additionally, Table 2 contains information on verification of all the QSAR types (3-VII Validation methods). Of the types investigated, only PLS and GLMNet failed to pass the salvo of verification criteria, both falling short of attaining an R2 of 0.6.
In terms of reliability, most models were able to handle the available data well, providing calculations for all provided molecules. Only the Random Forest and Cubist models failed to calculate the affinity of some molecules, possibly due to being based around decision-trees. The algorithm underlying both models attempts to draw predictions by categorizing entries based on their features. If they encounter a molecules entirely different from the data they trained on, the models may fail to create a prediction. Advantageously for our approach, the failure to calculate some values becomes less important where models are combined in an ensemble where the final prediction is averaged over many models.
The results of ensemble prediction (averaging the results of many different QSARs) can be seen in Figure 4. While ⍺- and β-CD models managed to reach moderately high predictive performance metrics, unfortunately, all γ-CD models lacked useable predictive power.
The models passing the verification in Table 2 were further verified using y-randomization. To ensure accuracy was not the result of the models building off of noise, 25 different permutations of ΔG values were created. All Q2 values of the models created from the original data were calculated to lie well outside 3 standard deviations of the mean Q2 of the randomized data. Additionally, the R2 values of the ensemble QSARs were significantly greater than the R2 values obtained from the ensemble models created from permuted data (means of 0.021 and 0.027 and standard deviations of 0.011 and 0.016 for ⍺- and β-CD, respectively).
3.3 Variable importance
Interpretability of a model provides a rough check if a model is calculating off of random noise or if the model is drawing logical calculations from physical properties to molecular behavior. Each model, due to differences in statistical algorithms and approaches, has differing levels of interpretability. GLM, being similar to linear models, have easily accessible coefficients associated with each predictor, so the relative impact of each factor can be compared with reasonable confidence. Cubist models, on the other hand, tend to be difficult to interpret as variables are processed through multiple levels of decision trees.
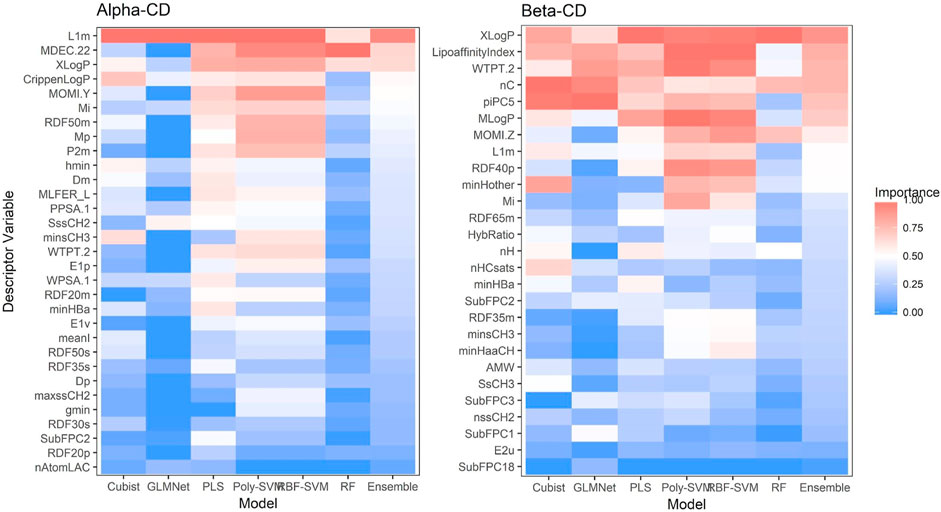
Evaluation for the relative importance of variables are shown in Figure 5. Random forest was the only QSAR type with a pre-packaged importance function for variable analysis. PLS variables were analyzed using a function obtainable from Mevik et al. (2007). Max Kuhn’s caret package was used to evaluate GLMNet, the two SVM kernels, and Cubist. Unfortunately, caret was unable to process the final models for GLMNet and SVM, and the reported variable importance values were actually derived from models created within caret’s “train” function, and are thus slightly different from the models saved in the ensemble. To determine importance, the “train” function removes a variable, rebuilds the model, and analyzes the effect on accuracy. The more important a variable, the larger the drop in accuracy. After each variable has been tested, the function can then rank the importance of the descriptors.
For β-CD, XLogP, a measure of lipophilicity, appears to be important for all models, consistent with how the structure of cyclodextrin allows for easier complexation with small hydrophobic drugs. The same reasoning can be extended to LipoAffinityIndex and MLogP, additional approaches to quantifying lipophilicity. The number of carbons, nC, is also consistently important, possibly due to a relationship with molecule size. WTPT-2 is the PaDEL weighted path descriptor divided by the number of atoms, and also may be important due to encoding information on molecular size.
However, not all the variables can be linked to set chemical properties. SpMax and SpMin relates to eigenvalues of a modified connectivity matrix, a numerical representation of atomic and molecular bonds, and may not be associated with any interpretable physical property (the same analysis can also be used for GATS predictors). To aid interpretability, building a model with predictors easily attributed to physical or chemical properties may be advised. The extent to which interpretability should trade off with accuracy remains in question. Our findings go in accordance to those in the general literature were lipophilicity tends to highly influence model output.
3.4 Web application and FDA database
After collecting a list of FDA-approved drugs and drug combinations from the Orange Book, an annual publication listing all approved pharmaceuticals, the names were cleaned for individual active compounds. In total, 1,401 unique molecules could be extracted. Of these, 1,116 could be downloaded from Cactus and 1,031 could be processed by PaDEL. Many of the molecules that could not be analyzed by PaDEL would have proven impractical for cyclodextrin delivery, such as simple ionic salts (e.g., potassium chloride), or large molecules made of more than 100 atoms. Running the remaining guests through applicability domain analysis yielded 638 molecules, 45.5% of the original set. While less than half of FDA-approved drugs could pass through the model, the 600 available guests spans a wide range of properties and uses, allowing the page to be useful for candidate selection (Figure 6).
Though the app could be uploaded online through shinyapps. io, server time limitations on the account hosting the app make it impractical for usage by a large number of individuals simultaneously. In order to run the app for more than a few hours, such as with screening a large dataset of molecules, the code would have to be downloaded through GitHub. In addition, the user would need to download the R libraries and the IDE RStudio, potentially negating the goal of creating an accessible, intuitive interface. The “Explore” page partially alleviates this obstacle, as it allows the user to perform a quick search of a pre-predicted affinity rather than spend time downloading the structure file, launching PaDEL, and running the QSAR.
3.5 Drug release module
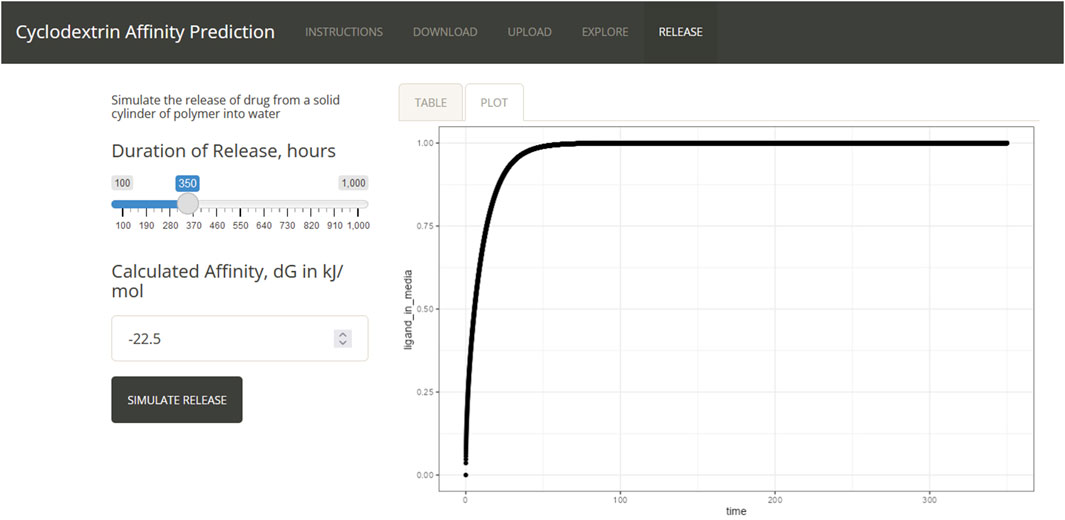
To demonstrate the extensibility of the shiny app and its value in the design of drug delivery strategies the results of the QSAR predictions can be fed into a mechanistic model of drug delivery (Figure 7). The results demonstrate the ranges of values expected from the strongest affinity binding predictions and from the weakest. As expected, strong predictions produce much slower release profiles and weak predictions produce faster release profiles. Conservation of mass was verified as the sum of all mass within the system from the polymer and media compartment across all times as a test of the implementation. Notably, the implementation in R required a modification of the method of lines for appropriate modeling of the polymer to liquid media interface. (Linge and Langtangen, 2016). Future efforts in creating new modules could explore substructure searching to identify alternative strategies for weak binders or drugs that demonstrate unsuitable release profiles. It is expected that not all drugs will follow this simplistic model of drug release. For those cases our lab has built a whole suite of approaches to alter elution rates such as a wide range of formulations, supramolecular interactions, Schiff-base formation and multi-arm PEG substitutions.
4 Conclusion
In predicting the binding affinity of cyclodextrin with small drug molecules, QSARS such as Cubist, GBM, MARS, random forest, and SVM models can be created using accessible open-source software. These models outperform available docking software in both accuracy and time consumption and pass statistical verification of reliability. The additional accuracy afforded by QSARs can be integrated into the previously published mechanistic model for predicting drug release curves for candidate molecules. This would both help narrow down candidates for cyclodextrin affinity-based drug delivery as well as help advise which molecules are most appropriate to tailor the release rate from a delivery system for a given biomedical application. Furthermore, the QSAR models can be used to evaluate existing marketed pharmaceutical formulations for their small molecule interaction with cyclodextrin to better understand the extent that the strength of binding between the cyclodextrin and the drug is of importance for the marketed product formulation (Braga, 2023; Puskás et al., 2023). Both of these goals can be achieved by any reader interested in the current work by accessing the github repository for this manuscript (https://github.com/awqx/qsar-app). The current model is limited to predictions in the experimental space of the training data and applications outside its applicability, for example, at low or very high pH, should be employed with caution and tested experimentally.
The integration of these machine learning models in combination with the mechanistic models of drug delivery all within a web application allows for a novel framework to plan drug delivery strategies. The application allows for a “design before you build” approach where others can bring their library of small molecules and determine which ones make the best candidates for an affinity release strategy. The mechanistic models of other geometries or drug delivery forms such as microparticles and injectable polymers can be readily included in the application to further extend the capabilities for other biomedical applications.
Data availability statement
The datasets presented in this study can be found in online repositories. The names of the repository/repositories and accession number(s) can be found below: QSAR model building package repository https://github.com/awqx/qsarr Drug Release Module Code https://github.com/eriveradelgado/ODE_Practice/blob/master/09_ODE-drug-release.Rmd QSAR Application https://github.com/awqx/qsar-app Walkthrough on how to use the models https://github.com/awqx/qsar-app Enter subfile process. Rmd.
Author contributions
AX: Investigation, Software, Writing—original draft, Data curation. ER-D: Conceptualization, Supervision, Investigation, Software, Writing—original draft. HR: Conceptualization, Funding acquisition, Supervision, Writing—review and editing.
Funding
The author(s) declare that no financial support was received for the research, authorship, and/or publication of this article.
Conflict of interest
The authors declare that the research was conducted in the absence of any commercial or financial relationships that could be construed as a potential conflict of interest.
Publisher’s note
All claims expressed in this article are solely those of the authors and do not necessarily represent those of their affiliated organizations, or those of the publisher, the editors and the reviewers. Any product that may be evaluated in this article, or claim that may be made by its manufacturer, is not guaranteed or endorsed by the publisher.
References
Ahmadi, P., and Ghasemi, J. B. (2014). 3D-QSAR and docking studies of the stability constants of different guest molecules with beta-cyclodextrin. J. Incl. Phenom. Macrocycl. Chem. 79, 401–413. doi:10.1007/s10847-013-0363-5
Bates, D., Maechler, M., Davis, T. A., Amd, C., Oehlschlägel, J., Riedy, J., et al. (2017). Matrix: sparse and dense matrix classes and methods. Available at: https://cran.r-project.org/web/packages/Matrix/index.html.
Braga, S. S. (2023). Molecular mind games: the medicinal action of cyclodextrins in neurodegenerative diseases. Biomolecules 13 (4), 666. doi:10.3390/biom13040666
Connors, K. A. (1995). Population characteristics of cyclodextrin complex stabilities in aqueous solution. J. Pharm. Sci. 84, 843–848. doi:10.1002/jps.2600840712
Cutler, F., and Wiener, R. (2015). randomForest: Breiman and Cutler’s random forests for classification and regression. Available at: https://cran.r-project.org/web/packages/randomForest/index.html.
Dallakyan, S., and J, Olson A. (2015). Small-molecule library screening by docking with PyRx. Methods Mol. Biol. (Clifton, NJ) 1263, 243–250. doi:10.1007/978-1-4939-2269-7_19
Dehmer, M., Varmuza, K., and Bonchev, D. (2012). Statistical modelling of molecular descriptors in QSAR/QSPR. John Wiley and Sons.
Dowle, M., Srinivasan, A., Gorecki, J., Short, T., Lianoglou, S., and Antonyan, E. (2017). data.table: extension of “data.frame”. Available at: https://cran.r-project.org/web/packages/data.table/index.html.
Duncan Temple Lang and the CRAN Team (2018a). RCurl: general network (HTTP/FTP/…) client interface for R. Available at: https://cran.r-project.org/web/packages/RCurl/index.html.
Duncan Temple Lang and the CRAN Team (2018b). XML: tools for parsing and generating XML within R and S-plus. Available at: https://cran.r-project.org/web/packages/XML/index.html.
Food and Drug Administration (2019). Approved drug products with therapeutic equivalence evaluations. Available at: https://www.fda.gov/media/71474/download (Accessed May 31, 2019).
Friedman, J., Hastie, T., Simon, N., Qian, J., and Tibshirani, R. (2017). Glmnet: lasso and elastic-net regularized generalized linear models. Available at: https://cran.r-project.org/web/packages/glmnet/index.html.
Fu, A. S., Thatiparti, T. R., Saidel, G. M., and von Recum, H. A. (2011). Experimental studies and modeling of drug release from a tunable affinity-based drug delivery platform. Ann. Biomed. Eng. 39, 2466–2475. doi:10.1007/s10439-011-0336-z
Ghasemi, J. B., Salahinejad, M., and Rofouei, M. K. (2011). An alignment independent 3D-QSAR study for predicting the stability constants of structurally diverse compounds with β-cyclodextrin. J. Incl. Phenom. Macrocycl. Chem. 71, 195–206. doi:10.1007/s10847-011-9927-4
Golbraikh, A., and Tropsha, A. (2002). Beware of q2!. J. Mol. Graph. Model. 20, 269–276. doi:10.1016/S1093-3263(01)00123-1
Jacob, R. B., Andersen, T., and McDougal, O. M. (2012). Accessible high-throughput virtual screening molecular docking software for students and educators. PLOS Comput. Biol. 8, e1002499. doi:10.1371/journal.pcbi.1002499
Katritzky, A. R., Fara, D. C., Yang, H., Karelson, M., Suzuki, T., Solov’ev, V. P., et al. (2004). Quantitative Structure−Property relationship modeling of β-cyclodextrin complexation free energies. J. Chem. Inf. Comput. Sci. 44, 529–541. doi:10.1021/ci034190j
Kuhn, M., and Quinlan, R. (2018). Caret: classification and regression training. Available at: https://CRAN.R-project.org/package=caret.
Kuhn, M., Steve, W., Chris, K., Nathan, C., and Quinlan, R. (2017). Cubist: rule- and instance-based regression modeling. Available at: https://cran.r-project.org/web/packages/Cubist/index.html.
Linge, S., and Langtangen, H. P. (2016) “Texts in computational science and engineering,” in Programming for computations - Python. doi:10.1007/978-3-319-32428-9
Merzlikine, A., Abramov, Y. A., Kowsz, S. J., Thomas, V. H., and Mano, T. (2011). Development of machine learning models of β-cyclodextrin and sulfobutylether-β-cyclodextrin complexation free energies. Int. J. Pharm. 418, 207–216. doi:10.1016/j.ijpharm.2011.03.065
Mevik, B.-H. (2007). VIP.R: implementation of VIP (variable importance in projection) (*) for the “pls” package. Available at: http://mevik.net/work/software/VIP.R.
Mevik, B.-H., and Liland, R. W. (2016). Pls: partial least squares and principal component regression. Available at: https://cran.r-project.org/web/packages/pls/index.html.
Meyer, D., Dimitriadou, E., Hornik, K., Weingessel, A., and Leisch, F. (2017) e1071: Misc Functions of the Department of Statistics, Probability Theory Group (Formerly: E1071) TU Wien. Available at: https://cran.r-project.org/web/packages/e1071/index.html.
Mirrahimi, F., Salahinejad, M., and Ghasemi, J. B. (2016). QSPR approaches to elucidate the stability constants between β-cyclodextrin and some organic compounds: docking based 3D conformer. J. Mol. Liq. 219, 1036–1043. doi:10.1016/j.molliq.2016.04.037
Ortiz, M., Fragoso, A., and O’Sullivan, C. K. (2011). Amperometric detection of antibodies in serum: performance of self-assembled cyclodextrin/cellulose polymer interfaces as antigen carriers. Org. Biomol. Chem. 9, 4770–4773. doi:10.1039/C1OB05473B
Pérez-Garrido, A., Helguera, A. M., Guillén, A. A., Cordeiro, MNDS, and Escudero, A. G. (2009). Convenient QSAR model for predicting the complexation of structurally diverse compounds with β-cyclodextrins. Bioorg. Med. Chem. 17, 896–904. doi:10.1016/j.bmc.2008.11.040
Prakasvudhisarn, C., Wolschann, P., and Lawtrakul, L. (2009). Predicting complexation thermodynamic parameters of β-cyclodextrin with chiral guests by using swarm intelligence and support vector machines. Int. J. Mol. Sci. 10, 2107–2121. doi:10.3390/ijms10052107
Puskás, I., Szente, L., Szőcs, L., and Fenyvesi, E. (2023). Recent list of cyclodextrin-containing drug products. Period. Polytech. Chem. Eng. 67 (1), 11–17. doi:10.3311/ppch.21222
Rekharsky, M. V., and Inoue, Y. (1998). Complexation thermodynamics of cyclodextrins. Chem. Rev. 98, 1875–1918. doi:10.1021/cr970015o
Rivera-Delgado, E., Ward, E., and von Recum, H. A. (2016). Providing sustained transgene induction through affinity-based drug delivery. J. Biomed. Mater Res. 104, 1135–1142. doi:10.1002/jbm.a.35643
Roy, K., Kar, S., and Ambure, P. (2015). On a simple approach for determining applicability domain of QSAR models. Chemom. Intelligent Laboratory Syst. 145, 22–29. doi:10.1016/j.chemolab.2015.04.013
Rücker, C., Rücker, G., and Meringer, M. (2007). y-Randomization and its Variants in QSPR/QSAR. J. Chem. Inf. Model 47, 2345–2357. doi:10.1021/ci700157b
Soetaert, K., Petzoldt, T., and Setzer, R. W. (2018). deSolve: solvers for initial value problems of differential equations (“ODE”, “DAE”, “DDE”). Available at: https://CRAN.R-project.org/package=deSolve.
Suzuki, T. (2001). A nonlinear group contribution method for predicting the free energies of inclusion complexation of organic molecules with α- and β-cyclodextrins. J. Chem. Inf. Comput. Sci. 41, 1266–1273. doi:10.1021/ci010295f
Tropsha, A. (2010). Best practices for QSAR model development, validation, and exploitation. Mol. Inf. 29, 476–488. doi:10.1002/minf.201000061
Trott, O., and Olson, A. J. (2010). AutoDock Vina: improving the speed and accuracy of docking with a new scoring function, efficient optimization, and multithreading. J. Comput. Chem. 31, 455–461. doi:10.1002/jcc.21334
Veselinović, A. M., Veselinović, J. B., Toropov, A. A., Toropova, A. P., and Nikolić, G. M. (2015). In silico prediction of the β-cyclodextrin complexation based on Monte Carlo method. Int. J. Pharm. 495, 404–409. doi:10.1016/j.ijpharm.2015.08.078
Vulic, K., Pakulska, M. M., Sonthalia, R., Ramachandran, A., and Shoichet, M. S. (2015). Mathematical model accurately predicts protein release from an affinity-based delivery system. J. Control. Release 197, 69–77. doi:10.1016/j.jconrel.2014.10.032
Wang, N. X., and von Recum, H. A. (2011). Affinity-based drug delivery. Macromol. Biosci. 11, 321–332. doi:10.1002/mabi.201000206
Xu, Q., Wei, C., Liu, R., Gu, S., and Xu, J. (2015). Quantitative structure–property relationship study of β-cyclodextrin complexation free energies of organic compounds. Chemom. Intelligent Laboratory Syst. 146, 313–321. doi:10.1016/j.chemolab.2015.06.001
Keywords: QSPR (quantitative structure properties relationship), drug delivery, cyclodextrin, machine learning (ML), small molecules, ODE (ordinary differential equation)
Citation: Xin AW, Rivera-Delgado E and von Recum HA (2024) Using QSAR to predict polymer-drug interactions for drug delivery. Front. Soft Matter 4:1402702. doi: 10.3389/frsfm.2024.1402702
Received: 18 March 2024; Accepted: 20 June 2024;
Published: 29 July 2024.
Edited by:
Ali Miserez, Nanyang Technological University, SingaporeReviewed by:
Animesh Pan, University of Rhode Island, United StatesFrank Alexis, Universidad San Francisco de Quito, Ecuador
Copyright © 2024 Xin, Rivera-Delgado and von Recum. This is an open-access article distributed under the terms of the Creative Commons Attribution License (CC BY). The use, distribution or reproduction in other forums is permitted, provided the original author(s) and the copyright owner(s) are credited and that the original publication in this journal is cited, in accordance with accepted academic practice. No use, distribution or reproduction is permitted which does not comply with these terms.
*Correspondence: Horst A. von Recum, aG9yc3Qudm9ucmVjdW1AY2FzZS5lZHU=
†These authors have contributed equally to this work and share first authorship
 Alison W. Xin1†
 Horst A. von Recum