 Luka Sturtewagen1
 Arjen Bot
 Erik van der Linden
94% of researchers rate our articles as excellent or good
Learn more about the work of our research integrity team to safeguard the quality of each article we publish.
Find out more
ORIGINAL RESEARCH article
Front. Soft Matter, 23 January 2024
Sec. Food and Soft Materials
Volume 3 - 2023 | https://doi.org/10.3389/frsfm.2023.1328180
This article is part of the Research Topic1st Galapagos Soft Matter Conference - Research TopicView all 11 articles
In this article, we study the phase behavior of two polydisperse hydrocolloids: dextran and polyethylene oxide. We combine the data on the experimental osmometric virial coefficients of the pure components with the experimental critical point of their aqueous mixture and the size distribution of each component from a previously published study in order to predict the phase boundary, spinodal, and fractionation upon demixing of the polydisperse mixture. We compare the results of our calculation to the experimental phase diagram. Our method reveals a better correspondence with the experimental binary phase behavior than modeling each component as monodisperse. The polydispersity of the hydrocolloids causes the phase separation boundary to shift to lower concentrations and the miscibility region to decrease and change its shape from a rotated U-shape to a W-shape.
A solution may gel when assemblies of molecules in that solution span the solution. The properties of the assemblies and their mutual interactions determine the concentration range above which the gel forms and the properties of the gel. For example, in the case of fibrillar assemblies from protein-derived peptides, gelation occurs already at low concentrations of the building blocks of the fibril (van der Linden, 2012). Notably, such fibrils exhibit interesting collective properties at higher concentrations, such as their arrangement in an anisotropic manner like that of (nematic) liquid crystals (Bagnani et al., 2019).
The molecular assembly may reflect an equilibrium state, but, for most practically relevant systems, in particular for gelling systems, it more often reflects a non-equilibrium state. The structure of such a state depends on the specific spatial–temporal path through equilibrium and unstable regions in the phase diagram that are followed during the preparation of the system and on the rate of change of the thermodynamic conditions. As such, the equilibrium phase diagram plays an important role in predicting the characteristics of the structures within and the concomitant properties of the gel systems. This importance of phase diagrams holds for systems of any number of components. We will discuss a few examples of the above in simple systems in this Introduction section to set the scene, before addressing phase behavior in multicomponent mixtures in more detail in the next section.
As a first example, we choose a system composed of one component in water. We choose gelatin, which forms random coils at high temperatures and is a liquid, while below a critical temperature, its molecules form triple helices and its system shows gelation at sufficiently large concentrations. The work of Chatellier et al. (1985) demonstrates that a critical concentration of helices exists, below which no gel forms. Joly-Duhamel et al. (2002a, 2002b), in addition, have clearly shown that the liquid–gel transition is, in fact, a percolation transition, with the concentration of triple helices being the control parameter. We have shown that the critical concentration of helices, below which the system gels, can be deduced from the structural characteristics of the triple helices, i.e., their persistence length and thickness (van der Linden and Parker, 2005). The helices can, in fact, be viewed as fibrils. Furthermore, the value of gel elasticity at low concentrations of helices can be solely deduced from entropy arguments (van der Linden, 2012), and this also holds for the elasticity value at higher concentrations (apart from the fact that one requires one adjustable fitting parameter which is predicted to be of order 1, as confirmed by fitting) (van der Linden, 2012). The elasticity over time is determined by the final temperature of the system and the rate at which this occurs (Normand et al., 2000; Normand and Parker, 2003). We clearly have a non-equilibrium gel state. Despite this non-equilibrium state, one can always predict elasticity solely on the basis of the helix concentration, which is a separately accessible observation of Joly-Duhamel et al. (2002a, 2002b).
For another case of fibrillar assembly under non-equilibrium conditions, Nguyen and Vaikuntanathan (2016) simulated the fibrilization of two components A and B for a given initial excess chemical potential of each type of monomer. This situation can be experimentally realized, for example, in a supersaturated solution of both types of monomers. The excess chemical potentials were assumed to be equal for both types. The interactions between the likewise species are also assumed to be equal. The fibrils were found to consist of blocks composed of A, connected to blocks composed of B. The less favorable the unlike particle interaction becomes, the longer the blocks become. If one now increases the initial excess chemical potential of the two types of monomers, the length of the blocks becomes smaller. As such, the structural diversity within a fibril increases upon increasing the initial excess chemical potential of the monomers, i.e., upon increasing the distance to the transition point. This in turn will affect the interactions and flexibility of the fibril and thus the properties of the gel it forms.
Another example of a “one-component” system, for which the equilibrium phase behavior is important in understanding the non-equilibrium gel state, consists of oil droplets in water, for which the interaction can be tuned by the temperature (Poulin et al., 1999). Above a sufficiently large enough attraction between the droplets, the authors find a transition, known as spinodal decomposition. This occurs in the region of the phase diagram that is referred to as the instability region. One finds a bi-continuous structure, with one of its parts being mostly droplets that are packed with a fractal dimension, df. This df can get as low as 1.7 at sufficiently high attraction, forming a gel state, while for lower attractions, one finds a df of approximately 3, indicating a fluid state, resulting in the end in a two-phase (de-mixed) system.
In order to better understand gelled systems made from multicomponent mixtures, the above urges us to investigate the phase diagrams of multicomponent mixtures. Hereto, we currently report on the recent theoretical and experimental results obtained to explain the experimental phase diagram for a multicomponent system in water containing differently sized coil-like polymers of dextran (D) and polyethylene oxide (PEO). Mixtures of such polydisperse bio-polymeric ingredients are ubiquitous and therefore bear relevance to many practical situations. An important example is the understanding of functionality in food formulations of a variety of multicomponent mixtures that consist of minimally refined plant-based ingredients. This understanding facilitates the adaptation to use different ingredient sources, thereby supporting the development of a more sustainable food supply.
Aqueous mixtures of polymers such as polyethylene oxide and dextran form liquid–liquid two-phase systems at certain concentrations. These systems are often used as a model system for the phase behavior of macromolecules in solution because they show a clear macroscopic phase separation (Kang and Sandler, 1988; Edelman et al., 2003; Dewi et al., 2020). They also have practical applications, as they are often used to aid in the partitioning of biological materials such as proteins and cell materials (Johansson et al., 1998; Johansson and Walter, 1999).
For the prediction of their phase behavior, the polymers are often considered monodisperse. Experimental work by Edelman et al. (2003), however, has shown that upon demixing, considerable fractionation in the molecular weight occurs for both PEO and dextran. Not only is there an effect of the polydispersity of each component on fractionation but also the concentration in the parent phase plays a role. At lower total polymer concentrations in the parent phase, the depleted colloids have a broader distribution, i.e., there is less pronounced fractionation. The changes in the distribution are mainly prevalent in the depleted phase. The average molar mass in the enriched phase does not change considerably. The changes in the amount of fractionation, depending on the concentration along a dilution line, were also reported by Zhao et al. (2016). Furthermore, Gaube et al. (1993) showed that polydispersity plays a role in phase behavior and phase composition. They compared mixtures of PEO and dextran with various molecular sizes and found that for each polymer, the short-chain molecules preferentially partition to the phase enriched in the other polymer.
There has been some effort in incorporating the polydispersity of these polymers in the prediction of their phase behavior. Using a universal quasi-chemical (UNIQUAC) model, Kang and Sandler (1988) incorporated polydispersity in their prediction and found that polydispersity of the polymers enlarged the two-phase region considerably near the critical point and resulted in smaller miscibility regions far from the critical point. They also found significant fractionation, and the difference in the average molecular weight of the components in each phase increased with larger polydispersity.
Most often, when the phase behavior of a binary mixture is studied experimentally, one or more dilution lines are used to obtain the concentration of each component in each phase. These concentrations are then used to construct the binodal (Albertsson, 1970). However, this approach does not shed light on polydispersity nor does it give an insight into the demixing in the metastable region, where a system de-mixes into multiple phases, but that is outside of the unstable (spinodal) region. It is also difficult to quantify the impact of polydispersity and its corresponding distribution on phase behavior (Dos Santos et al., 2004). In order to get more insights into the transition between one and two phases, Larsson and Mattiasson (1988) determined the experimental phase boundary for polydisperse PEO and dextran. They found a significant broadening of the phase boundary compared to the approach of Albertsson (1970). The broadening increased with increasing polydispersity at the depleted side of the said polydisperse component (Larsson and Mattiasson, 1992).
In a previous numerical work, we predicted the phase behavior of a polydisperse binary mixture of hard spheres in solution using the virial coefficient approach (Sturtewagen and van der Linden, 2021; Sturtewagen and van der Linden, 2022), based on the theory of McMillan and Mayer (1945). Polydispersity was incorporated into the system by means of sub-components. The spheres had an asymmetric size ratio to aid in demixing (Dijkstra et al., 1999). Polydispersity of the largest component caused significant changes to the phase diagram. With an increase in polydispersity, the critical point shifted to higher concentrations, while also at the same time, the miscible region decreased. Not only polydispersity plays a role but also the type of distribution has an influence. We found that the largest components of the distribution impacted the phase diagram the most. De-mixed mixtures also showed significant fractionation. The smallest sub-components of the large polydisperse components favored the top phase that was enriched in the small monodisperse component.
In recent works, the experimental phase diagram for the macromolecules of PEO and dextran was theoretically reconstructed using osmotic virial coefficients as obtained from the fitting experimental data from an earlier published work (Dewi et al., 2020) and the experimentally obtained critical point of the binary mixture (Dewi et al., 2020). However, some aspects of the experimental phase diagram remained unexplained by the theoretically constructed one. Mainly, at low concentrations of dextran, the experimental system showed thermodynamic incompatibility and demixing into two phases, while the theory predicted a homogeneous mixture for these concentrations. We hypothesize that this discrepancy is due to the polydispersity of the macromolecules.
In this article, we take the polydispersity of both these components into account (by subdividing each polymer into sub-components of different sizes) when predicting the phase diagram based on the experimental data from Dewi et al. (2020). We study the position of the spinodal and binodal. We model the interactions between the different polydisperse sub-components using the second virial coefficient, where we assume that the polydisperse sub-components act as non-additive hard spheres. We start with describing the underlying theoretical background in Section 2. In Section 3, we describe the materials and methods. In Section 4, we discuss the results and compare it with that of other works in the area of multicomponent mixtures.
To describe phase separation in a system containing particles of different diameters and of different types, we choose a framework that accounts for terms up to quadratic terms in concentration, i.e., including up to the second-order virial coefficients that are experimentally or theoretically accessible. We start from the Helmholtz free energy
where
In our case, the interactions between the particles are assumed to follow the non-additive hard sphere model (Sturtewagen and van der Linden, 2022), where the non-additivity refers to either an attractive or repulsive extra interaction on top of the excluded volume interaction. For such non-additive hard spheres, the virial coefficients for a system of two compounds,
where
where
The first aspect is the occurrence of instability. In a two-component mixture, one refers to the boundary of this instability as the spinodal, which is a curve. To analyze the local stability of the mixture against phase separation, it is convenient to introduce the so-called Hessian matrix
The second aspect to consider is the critical point. In a binary mixture, the critical point is a stable point which lies on the stability limit (spinodal) (Heidemann and Khalil, 1980) and where the phase boundary and spinodal coincide. In mixtures with more than two components, these critical points are also called plait points.
Critical points and plait points are, in general, concentrations at which two or more phases are in equilibrium and become indistinguishable (Heidemann, 1994).
There are two criteria that have to be fulfilled to find the plait points. The first one is det(M1) = 0, which is the equation for the spinodal. The other criterion is based on the fact that at the critical point, the third derivative of free energy should also be zero. For a multicomponent system, this criterion can be reformulated using Legendre transforms as det(M2) = 0 (Beegle et al., 1974; Reid and Beegle, 1977), where
and matrix M2 is matrix M1 with one of the rows (in this case the lowest row) being replaced by the partial derivatives of the determinant of matrix M1. Note that it does not matter which row of the matrix is replaced.
The third aspect is the coexistence region. This is characterized by the equilibrium composition of the phases for N components, which is in turn characterized by a manifold (for two components, this becomes the binodal or coexistence curve). For a system that separates into two different phases, this manifold is found by simultaneously solving Eqs 7, 8:
For a mixture containing
where
The solutions for the two-component mixtures are discussed elsewhere (Ersch et al., 2016; Dewi et al., 2020; Dewi et al., 2021; Bot et al., 2021a; Bot et al., 2021b). Eqs. 7–(9) allow for the determination of the concentration of each component in each of the phases along with the phase volume of each phase for any given parent concentration, given that the mixture will separate into two phases.
Size exclusion chromatography with multi-angle laser light scattering (SEC-MALLS) for both polyethylene oxide (PEO35) and dextran (D100) was performed by NIZO food research to obtain the molar mass and size distribution (size distributions are shown in Figure 1). The SEC-MALLS molar mass plots can be found in the Supplementary Materials. The experimental critical point and osmotic virial coefficients for the pure components PEO35 and D100 were taken from Dewi et al. (2020) (see Table I). The cross-virial coefficients used in the calculations are the result of a fitting that includes polydispersity as follows.
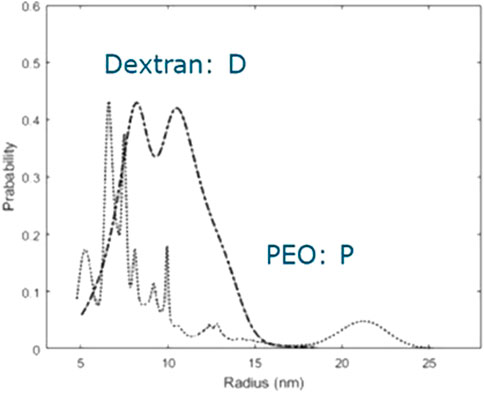
FIGURE 1. Size distribution of the polydisperse samples that have been used to determine the phase diagram.
Both components exhibited polydispersity (see Figure 1). The size distributions for both components were binned [the number of bins (N = NPEO + ND) was NPEO = 1, 2, and 5 for PEO and ND = 1, 2, and 10 for dextran]. The obtained radii and fractions were taken as the starting point for the fit of the theoretical polydisperse virial coefficients to the experimentally obtained ones. The cross-interactions between the sub-components of PEO and the sub-components of dextran were also considered the same for all sizes (∆PD). For each bin size, one can calculate a virial coefficient and the corresponding cross-virial coefficients with the other “components”. Each virial coefficient resulted from a non-additive hard sphere interaction according to Eq. 3 for Bij, where i can refer to D100 and PEO35 and j can refer to D100 and PEO35. In addition, we assume that for the “components,” the values for
Subsequently, one calculates a number-averaged virial coefficient for dextran and PEO, BD100 and BPEO35, respectively, and the cross-virial coefficient, BPD, for the size distribution. These calculated expressions still contain the unknown values for the respective parameters,

TABLE 1. Virial coefficients of polyethylene oxide (PEO35) and dextran (D100) and the critical point for their mixture obtained from experiments by Dewi et al. (2020), which were used in the fitting for the polydisperse virial-coefficient matrix.
From Figure 1, we conclude that both PEO and dextran show significant polydispersity. The distribution for PEO is relatively narrow, is slightly bimodal, and has a small tail, while the distribution for dextran has more peaks and a considerably fat tail. Based on the research we did on the effect of polydispersity on the phase behavior of a binary mixture of non-additive hard spheres (Sturtewagen and van der Linden, 2022), we hypothesize that especially the larger components of dextran modify the phase behavior. The osmometric number-averaged virial coefficient of PEO is considerably larger than the number-averaged virial coefficient of dextran (Table 1), even though the radius of the PEO molecules is not larger. This indicates that the repulsive depletion interaction between PEO molecules is larger than the repulsive interaction between dextran molecules.
To determine which effect has the largest influence on the phase behavior (the large size difference between dextran molecules or the higher repulsive interaction between PEO molecules), we have stepwise introduced more polydispersity into our theoretical calculations of the phase diagram. We have compared the calculations to the experimental phase diagram from Dewi et al. (2020). We performed analyses for three cases. First, we introduced polydispersity only for PEO (Supplementary Materials), subsequently we introduced polydispersity only for dextran (Supplementary Materials), and third, we introduced polydispersity for both PEO and dextran (Supplementary Materials). We have compared the different binning strategies as shown in Figure 2; in the main text, we show the result that best fits all the three cases of the experimental coexistence and instability lines. This best fit was obtained using polydispersity of dextran as modeled by the means of 10 bins of equal width, and polyethylene oxide being modeled as monodisperse.
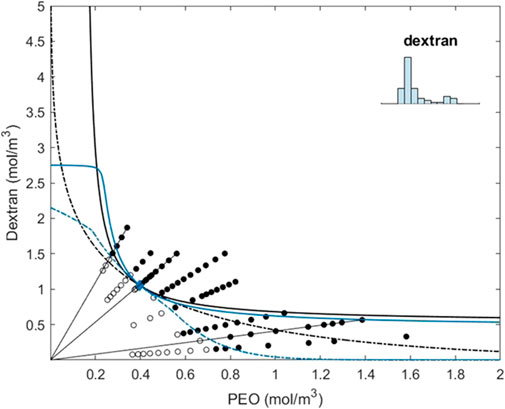
FIGURE 2. Coexistence line (black dotted) and instability line (black) for the two-component system of PEO and dextran obtained from solving Eqs 7–9 while substituting the three experimentally determined virial coefficients, as determined by osmometry (see also Dewi et al., 2020). The blue dotted line and the blue line represent the solutions of Eqs.(7)–(9) while using the binning strategy for PEO and dextran, as indicated in the inset of the figure and further described in the text. In fact, PEO is used as monodisperse in the specific strategy depicted here. The circular open symbols represent the experimentally determined one-phase systems and the circular closed symbols represent the two-phase systems.
From Figure 2, we can conclude that the incorporation of polydispersity draws the (apparent) spinodal more toward the horizontal axis and a typical W-form emerges. We note that the term (apparent) spinodal stems from the fact that we plot the concentrations as determined experimentally, effectively hiding the polydispersity of the two polymers, which, if polydispersity would have been included, would, in fact, lead to a multi-dimensional phase diagram instead of a two-dimensional phase diagram.
When subdividing dextran into 10 bins of equal bin width, we capture the details of polydispersity in our fitting. This causes the spinodal to bend toward the vertical axis at higher dextran concentrations, indicating that at higher concentrations of dextran, the mixture can de-mix into two phases of dextran. The binodal of the mixture with this fitting also changes quite drastically. At the dextran-enriched side, the phase boundary first shifts toward higher PEO concentrations and then bends toward the axis with increasing dextran concentrations. The curve has a noticeable nod. This indicates a regime change in demixing. At the PEO-depleted side of the curve, two-phase demixing is with a phase enriched in PEO and a phase enriched in dextran, but it has a phase enriched in the smaller components of dextran and a phase enriched in the larger components of dextran, similar to that described for PEO above. At the PEO-enriched side of the curve, the binodal shifts toward lower concentrations of dextran while asymptotically approaching the horizontal axis. Furthermore, the components with this pairwise interaction can de-mix into more than two phases; however, just as in the previous cases, the concentrations required for multi-phase demixing are unattainable with this particle distribution. The fitting captures more of the experimentally phase-separated samples with low dextran concentrations (filled circles in the plot) compared to the previous fittings. This indicates that our hypothesis that the polydispersity of dextran would be a driving factor in the demixing of these samples is valid.
Döbert et al. (1995) constructed a consistent osmotic virial equation to predict the phase behavior of a different type of polydisperse dextran and monodisperse PEO. They obtained an average molecular weight osmotic virial coefficient for the different polymer chains and compared their results to the predictions, assuming a binary monodisperse system. They report a better fit when polydispersity is taken into account. When predicting phase separation for mixtures close to the phase boundary, they also report that the binodal shifts closer to the axis in the dextran-depleted side of the binodal. They report a strong influence of the volume fraction of the phase enriched in dextran on the shape of the phase boundary and the fractionation of polydisperse dextran.
Regarding the validity of the virial approach up to the second order, we like to remark that we determine the second virial coefficients from the slope of the reduced osmotic pressure,
Predicting the phase behavior of multiple components has been of interest in the literature for some time. One approach that has been put forward recently builds on a convenient parameterization that leads to a set of equations that are much more easily analyzed than applying numerical methods to solve all equations (Bot et al., 2023). We briefly summarize this work in the following paragraph.
First, consider for simplicity the binodal of a two-component system. Two coexisting phases, named I and II, are represented by two molar concentration coordinates
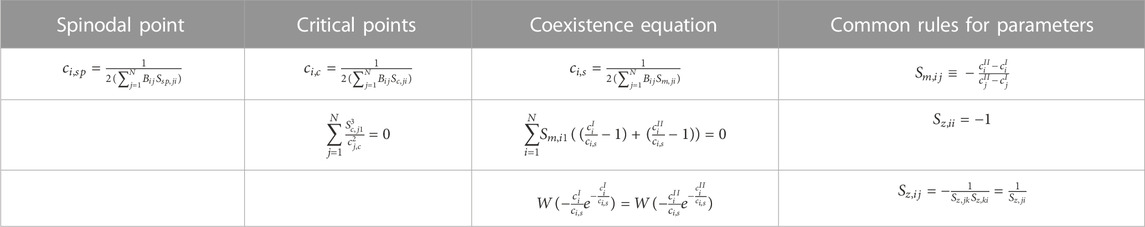
TABLE 2. Expressions for the spinodal, critical, and binodal manifolds for an arbitrary number of components N ≥ 2 in a common solvent, in terms of the parameters
This random matrix theory has been put forward in the context of phase behavior two decades ago by Sear and Cuesta (2003) as an alternative approach to handle the complexity of mixtures with many components, as a utilization of the general work by Wigner (1967). Setting details aside, this method allows for calculating the spinodal curve of complex mixtures using only averages and standard deviations of the second virial coefficients of the molecules in the mixture. This simplifies the calculations considerably. The RMT uses essentially the same expression for free energy as shown in Eq. 1. Additionally, it makes use of the large number of components and accordingly the large number of second virial coefficients. Instead of finding solutions for the spinodal manifold (with the result shown in the left column of Table 2), Sear and Cuesta (2003) calculated a point on the spinodal along the line
The equilibrium phase behavior of multicomponent systems is relevant for understanding gelation of such mixtures. Controlling the gel properties can be attained via controlling the structures being formed during the non-equilibrium processes taking place during gel formation, while crossing equilibrium phase boundaries.
We have described the theoretical (numerical) work on predicting the equilibrium phase behavior of a multicomponent system consisting of polydisperse polymers and compared this to the experimental data on the phase diagram. Taking into account the polydispersity helps to more accurately predict the particular form of the spinodal and binodal.
Polydispersity plays an important role in the phase behavior of the polydisperse polymers PEO and dextran. The components with a larger-than-average molecular weight govern the transition between one and two phases close to the phase boundary in their respective depleted concentration ranges. This causes a decrease in miscibility and a shift of the phase boundary to lower concentrations. This causes drastic changes to the shape of the phase boundary. When both components are polydisperse, the phase boundary drastically changes shape, and changes from a U-shape to a W-shape. It is not only the phase boundary that changes shape, but the spinodal curve also has different boundaries depending on the polydispersity. Even though multi-phase separations for mixtures with the fitted interactions are possible, the existing particle size distributions of PEO and dextran make concentrations resulting in multi-phase systems unattainable.
Upon demixing, the distribution of polydisperse components changes in each phase (Supplementary Materials). This fractionation is dependent on the parent distribution, the pair-wise interaction between the components of the same type, the pair-wise interaction of the components of a different type, and the concentration of both components in the parent mixture.
Our method of incorporating polydispersity allows for a more precise prediction of the phase boundary compared to assuming monodispersity, especially in the metastable region. Next to that, our method allows for prediction of the concentration and fractionation of each component in each phase depending on the parent concentration and the volume fraction of the said phases.
The best fit with the available data to the experimental data was when dextran was polydisperse and PEO was monodisperse.
The raw data supporting the conclusion of this article will be made available by the authors, without undue reservation.
LS: conceptualization, investigation, methodology, manuscript writing—review and editing, data curation, software, and visualization. BPCD: investigation, methodology, visualization, manuscript writing—review and editing, and funding acquisition. AB: conceptualization, formal analysis, investigation, methodology, and manuscript writing—review and editing. PV: conceptualization, formal analysis, investigation, methodology, software, supervision, and manuscript writing—review and editing. EvL: conceptualization, funding acquisition, investigation, methodology, project administration, supervision, manuscript writing—original draft, review, and editing.
The author(s) declare financial support was received for the research, authorship, and/or publication of this article. BPCD acknowledges funding from the Indonesia Endowment Fund for Education (LPDP—Lembaga Pengelola Dana Pendidikan) scholarship, Ministry of Finance, The Republic of Indonesia.
Author AB was employed by Unilever.
The remaining authors declare that the research was conducted in the absence of any commercial or financial relationships that could be construed as a potential conflict of interest.
All claims expressed in this article are solely those of the authors and do not necessarily represent those of their affiliated organizations, or those of the publisher, editors, and reviewers. Any product that may be evaluated in this article, or claim that may be made by its manufacturer, is not guaranteed or endorsed by the publisher.
The Supplementary Material for this article can be found online at: https://www.frontiersin.org/articles/10.3389/frsfm.2023.1328180/full#supplementary-material
Albertsson, P.-Å. (1970). Partition of cell particles and macromolecules in polymer two-phase systems. Adv. Protein Chem. 24, 309–341. doi:10.1016/s0065-3233(08)60244-2
Bagnani, M., Nyström, G., De Michele, C., and Mezzenga, R. (2019). Amyloid fibrils length controls shape and structure of nematic and cholesteric tactoids. ACS Nano 13 (1), 591–600. doi:10.1021/acsnano.8b07557
Beegle, B. L., Modell, M., and Reid, R. C. (1974). Thermodynamic stability criterion for pure substances and mixtures. AIChE J. 20 (6), 1200–1206. doi:10.1002/aic.690200621
Bot, A., Dewi, B. P. C., and Venema, P. (2021a). Addition to “phase-separating binary polymer mixtures: the degeneracy of the virial coefficients and their extraction from phase diagrams”. ACS Omega 6 (30), 20086–20087. doi:10.1021/acsomega.1c03331
Bot, A., Dewi, B. P. C., and Venema, P. (2021b). Phase-separating binary polymer mixtures: the degeneracy of the virial coefficients and their extraction from phase diagrams. ACS Omega 6 (11), 7862–7878. doi:10.1021/acsomega.1c00450
Bot, A., van der Linden, E., and Venema, P. (2023). Phase separation in complex mixtures with many components: analytical expressions for spinodal manifolds. Arxiv 2306.17600. Available at: https://doi.org/10.48550/arXiv.2306.17600.
Bot, A., and Venema, P. (2023). Phase behavior of ternary polymer mixtures in a common solvent. ACS Omega 8 (31), 28387–28408. doi:10.1021/acsomega.3c02604
Chatellier, J. Y., Durand, D., and Emery, J. R. (1985). Critical helix content in gelatin gels. Int. J. Biol. Macromol. 7 (5), 311–314. doi:10.1016/0141-8130(85)90030-3
Corless, R. M., Gonnet, G. H., Hare, D. E. G., Jeffrey, D. J., and Knuth, D. E. (1996). On the LambertW function. Adv. Comput. Math. 5 (1), 329–359. doi:10.1007/bf02124750
Dewi, B. P. C., van der Linden, E., Bot, A., and Venema, P. (2020). Second order virial coefficients from phase diagrams. Food Hydrocoll. 101, 105546. doi:10.1016/j.foodhyd.2019.105546
Dewi, B. P. C., van der Linden, E., Bot, A., and Venema, P. (2021). Corrigendum to “second order virial coefficients from phase diagrams.”[Food Hydrocolloids 101 (2020) 105546]. Food Hydrocoll. 112, 106324. doi:10.1016/j.foodhyd.2020.106324
Dijkstra, M., Brader, J. M., and Evans, R. (1999). Phase behaviour and structure of model colloid-polymer mixtures. J. Phys. Condens. Matter 11, 10079–10106. doi:10.1088/0953-8984/11/50/304
Döbert, F., Pfennig, A., and Stumpf, M. (1995). Derivation of the consistent osmotic virial equation and its application to aqueous poly(ethylene glycol)–dextran two-phase systems. Macromolecules 28 (23), 7860–7868. doi:10.1021/ma00127a037
Dos Santos, T. E., Loh, W., and Pessôa-Filho, P. D. A. (2004). Phase equilibrium in aqueous two-phase systems containing ethylene oxide-propylene oxide block copolymers and dextran. Fluid Phase Equilibria 218 (2), 221–228. doi:10.1016/j.fluid.2004.01.001
Edelman, M. W., Tromp, R. H., and van der Linden, E. (2003). Phase-separation-induced fractionation in molar mass in aqueous mixtures of gelatin and dextran. Phys. Rev. E 67 (2), 021404. doi:10.1103/physreve.67.021404
Ersch, C., Meijvogel, L. L. C., van der Linden, E., Martin, A., and Venema, P. (2016). Interactions in protein mixtures. Part I: second virial coefficients from osmometry. Food Hydrocoll. 52, 982–990. doi:10.1016/j.foodhyd.2015.07.020
Gaube, J., Höchemer, R., Keil, B., and Pfennig, A. (1993). Polydispersity effects in the system poly(ethylene glycol) + dextran + water. J. Chem. Eng. Data 38 (2), 207–210. doi:10.1021/je00010a005
Heidemann, R. A., and Khalil, A. M. (1980). The calculation of critical points. AIChE J. 26 (5), 769–779. doi:10.1002/aic.690260510
Jacobs, W. M. (2023). Theory and simulation of multiphase coexistence in biomolecular mixtures. J. Chem. Theory Comput. 19, 3429–3445. doi:10.1021/acs.jctc.3c00198
Johansson, G., and Walter, H. (1999). Partitioning and concentrating biomaterials in aqueous phase systems. Int. Rev. Cytol. 192 (1896), 33–60. doi:10.1016/s0074-7696(08)60521-5
Johansson, H. O., Karlström, G., Tjerneld, F., and Haynes, C. A. (1998). Driving forces for phase separation and partitioning in aqueous two-phase systems. J. Chromatogr. B Biomed. Appl. 711 (1-2), 3–17. doi:10.1016/s0378-4347(97)00585-9
Joly-Duhamel, C., Hellio, D., Ajdari, A., and Djabourov, M. (2002a). All gelatin networks: 2. The master curve for elasticity. Langmuir. 18 (19), 7158–7166. doi:10.1021/la020190m
Joly-Duhamel, C., Hellio, D., and Djabourov, M. (2002b). All gelatin networks: 1. Biodiversity and physical chemistry. Langmuir. 18 (19), 7208–7217. doi:10.1021/la020189n
Kang, C. H., and Sandler, S. I. (1988). Effects of polydispersivity on the phase behavior of the aqueous two-phase polymer systems. Macromolecules 21 (10), 3088–3095. doi:10.1021/ma00188a029
Larsson, M., and Mattiasson, B. (1988). Characterization of aqueous two-phase systems based on polydisperse phase forming polymers: enzymatic hydrolysis of starch in a PEG–starch aqueous two-phase system. Biotechnol. Bioeng. 31 (9), 979–983. doi:10.1002/bit.260310910
Larsson, M., and Mattiasson, B. (1992). Molecular weight distribution analysis of water-soluble polymers using aqueous two-phase systems. Ann. N. Y. Acad. Sci. 672 (1), 649–656. doi:10.1111/j.1749-6632.1992.tb32741.x
McMillan, W. G., and Mayer, J. E. (1945). The statistical thermodynamics of multicomponent systems. J. Chem. Phys. 13 (7), 276–305. doi:10.1063/1.1724036
Nguyen, M., and Vaikuntanathan, S. (2016). Design principles for nonequilibrium self-assembly. Proc. Natl. Acad. Sci. U. S. A. 113 (50), 14231–14236. doi:10.1073/pnas.1609983113
Normand, V., Muller, S., Ravey, J.-C., and Parker, A. (2000). Gelation kinetics of gelatin: A master curve and network modeling. Macromolecules. 33 (3), 1063–1071. doi:10.1021/ma9909455
Normand, V., and Parker, A. (2003). “Scaling in the dynamics of gelatin gels,” in Proceedings of the third International Symposium on Food Rheology and Structure Lappersdorf, Germany, 2003 (Kerschensteiner Verlag).
Poulin, P., Bibette, J., and Weitz, D. A. (1999). From colloidal aggregation to spinodal decomposition in sticky emulsions. Eur. Phys. J. B. Condensed. Matter. Complex. Systems. 7 (2), 277–281. doi:10.1007/s100510050614
Reid, R. C., and Beegle, B. L. (1977). Critical point criteria in legendre transform notation. AIChE J. 23 (5), 726–732. doi:10.1002/aic.690230515
Sear, R. P., and Cuesta, J. A. (2003). Instabilities in complex mixtures with a large number of components. Phys. Rev. Lett. 91 (24), 245701. doi:10.1103/physrevlett.91.245701
Sturtewagen, L. (2020). Predicting phase behavior of multi-component and polydisperse aqueous mixtures using a virial approach. PhD Thesis. Wageningen: Wageningen University.
Sturtewagen, L., and van der Linden, E. (2021). Effects of polydispersity on the phase behavior of additive hard spheres in solution. Molecules 26 (6), 1543. doi:10.3390/molecules26061543
Sturtewagen, L., and van der Linden, E. (2022). Towards predicting partitioning of Enzymes between macromolecular phases: effects of polydispersity on the phase behavior of nonadditive hard spheres in solution. Molecules 27 (19), 6354. doi:10.3390/molecules27196354
Sturtewagen, L., and van der Linden, E. (2023). Ternary mixtures of hard spheres and their multiple separated phases. Molecules 28 (23), 7817. doi:10.3390/molecules28237817
Thewes, F. C., Krüger, M., and Sollich, P. (2023). Composition dependent instabilities in mixtures with many components. Phys. Rev. Lett. 131 (5), 058401. doi:10.1103/physrevlett.131.058401
van der Linden, E. (2012). From peptides and proteins to micro-structure mechanics and rheological properties of fibril systems. Food Hydrocoll. 26 (2), 421–426. doi:10.1016/j.foodhyd.2010.11.019
van der Linden, E., and Parker, A. (2005). Elasticity due to semiflexible protein assemblies near the critical gel concentration and beyond. Langmuir. 21 (21), 9792–9794. doi:10.1021/la051312o
Keywords: assembly, gelation, non-equilibrium, configurational entropy, phase behavior, complexity, multicomponent, random matrix theory
Citation: Sturtewagen L, Dewi BPC, Bot A, Venema P and van der Linden E (2024) Phase behavior in multicomponent mixtures. Front. Soft Matter 3:1328180. doi: 10.3389/frsfm.2023.1328180
Received: 26 October 2023; Accepted: 11 December 2023;
Published: 23 January 2024.
Edited by:
Raffaele Mezzenga, ETH Zürich, SwitzerlandReviewed by:
Alejandro D. Rey, McGill University, CanadaCopyright © 2024 Sturtewagen, Dewi, Bot, Venema and van der Linden. This is an open-access article distributed under the terms of the Creative Commons Attribution License (CC BY). The use, distribution or reproduction in other forums is permitted, provided the original author(s) and the copyright owner(s) are credited and that the original publication in this journal is cited, in accordance with accepted academic practice. No use, distribution or reproduction is permitted which does not comply with these terms.
*Correspondence: Erik van der Linden, ZXJpay52YW5kZXJsaW5kZW5Ad3VyLm5s
†ORCID ID: Arjen Bot, orcid.org/0000-0002-2065-8964
Disclaimer: All claims expressed in this article are solely those of the authors and do not necessarily represent those of their affiliated organizations, or those of the publisher, the editors and the reviewers. Any product that may be evaluated in this article or claim that may be made by its manufacturer is not guaranteed or endorsed by the publisher.
Research integrity at Frontiers
Learn more about the work of our research integrity team to safeguard the quality of each article we publish.