 A. P. Santos
 Ishan Srivastava
 Leonardo E. Silbert
 Jeremy B. Lechman4
 Gary S. Grest
- 1AMA Inc., Thermal Protection Materials Branch, NASA Ames Research Center, Moffett Field, CA, United States
- 2Center for Computational Sciences and Engineering, Lawrence Berkeley National Laboratory, Berkeley, CA, United States
- 3School of Math, Science and Engineering, Central New Mexico Community College, Albuquerque, NM, United States
- 4Sandia National Laboratories, Albuquerque, NM, United States
Granular matter takes many paths to pack in natural and industrial processes. The path influences the packing microstructure, particularly for frictional grains. We perform discrete element modeling simulations of different paths to construct packings of frictional spheres. Specifically, we explore four stress-controlled protocols implementing packing expansions and compressions in various combinations thereof. We characterize the eventual packed states through their dependence of the packing fraction and coordination number on packing pressure, identifying non-monotonicities with pressure that correlate with the fraction of frictional contacts. These stress-controlled, bulk-like particle simulations access very low-pressure packings, namely, the marginally stable limit, and demonstrate the strong protocol dependence of frictional granular matter.
1 Introduction
Packings of granular materials are relevant to many industrial processes and natural phenomena. The prediction and control of particle packing in industrial processes for particulate materials significantly impact property repeatability, such as additive manufactured part strength assurance (Snow et al., 2019; Wischeropp et al., 2019). Packings formed by natural forces, from hydrological (Gerhard and Reich, 2000) to astronomical (Watanabe et al., 2019), or animal (Weiner et al., 2020; Buarque de Macedo et al., 2021), rarely follow single, straight-forward protocols, which leads to variable, or in some cases optimized, properties. Understanding the complex response of these far-from-equilibrium granular packings is critical to developing more efficient and effective means of controlling them.
Simulations use access to particle-scale information, such as particle–particle forces, to study the effect of packing protocol in ideal and realistic materials. Simulations have shown that frictionless sphere packings approach the maximally random jammed state volume fraction (Torquato et al., 2000) and the coordination number set by isostaticity (O’Hern et al., 2003) for many different packing protocols. However, the jamming point depends on material-specific contact mechanics and protocol (Luding, 2016; Santos et al., 2020). Frictionless particle packings can lead to various packing fractions by protocol changes in isotropic compression (Chaudhuri et al., 2010) or by applying shear strains (Bertrand et al., 2016; Srivastava et al., 2022). Real granular particles have friction and can form looser packings than frictionless spheres (Onoda and Liniger, 1990; Silbert, 2010; Santos et al., 2020). Frictional particles access a greater range of packing fractions depending on the protocol and the particle friction coefficient. Song et al. (2008) attributed the range of packing fractions to sampling an ensemble of jammed states in a statistical mechanical definition of jamming. Friction also modulates the coordination number—the average number of particles each particle is in contact with—Z, which decreases gradually from the frictionless value of Z = 6 to the frictional isostatic value of Z = 4 as the coefficient of friction increases (Silbert et al., 2002; Shundyak et al., 2007; Somfai et al., 2007; Song et al., 2008; Silbert, 2010; Santos et al., 2020). The coordination number and packing volume fraction ϕ—defined as the ratio of the volume occupied by all the particles to that of the container volume—of stable packings of particles with a specific friction coefficient can depend on the protocol (Silbert et al., 2002; Somfai et al., 2007; Bi et al., 2011).
Bililign et al. (2019) observed protocol dependence in experiments of two-dimensional packings under various protocols, for example, uni- and bi-axial compression. A common method to create dense particle packings is by isotropic compression. Volume-controlled compression can be achieved by randomly distributing point particles in a simulation cell and increasing the diameter (Lubachevsky and Stillinger, 1990; Shundyak et al., 2007) or by decreasing the simulation cell density of an over-compressed system while minimizing the conformational energy (O’Hern et al., 2002; Charbonneau et al., 2012). Flowing particles coming to a stop is another way for them to pack, for example, from flowing down an incline (Silbert et al., 2002) or by applying shear stresses (Bi et al., 2011; Srivastava et al., 2019; 2022). Disrupting or re-packing already packed systems is also one of the common methods to modulate the packing fraction, such as tapping or cyclical shear strains. These repetitive processes generally lead to denser packings (Kohlrausch, 1854; Williams and Watts, 1970; Knight et al., 1995; Philippe and Bideau, 2002; Richard et al., 2005; Rosato et al., 2010; Kumar and Luding, 2016).
Simulation packing methods often control the volume, not the stress. Achieving zero-stress stable packings is difficult for such methods. Previous jamming studies of particles with sliding friction as a function of pressure demonstrated that the packing fraction and coordination number decrease monotonically with decreasing pressure (Shundyak et al., 2007; Silbert, 2010). In this article, a constant pressure in all directions allows the simulation cell to adjust the edge length, and constant zero shear stresses allow the simulation cell to adopt triclinic configurations. The final packings repeatably and rigorously satisfy those stress conditions. Dagois-Bohy et al. (2012) and Smith et al. (2014) showed that packings formed by controlling the pressure are more stable to shear deformation than volume-controlled methods. Furthermore, very low pressures are accessible to this protocol without extrapolation, unlike previous protocols (Silbert, 2010). Similar protocols have been applied to 2D frictionless (Dagois-Bohy et al., 2012), 3D frictionless (Smith et al., 2014), 2D frictional (Shundyak et al., 2007; Somfai et al., 2007), and 3D frictional (Santos et al., 2020) granular particles.
This work studies how the protocols available to stress-controlled packing simulations change packing properties. Details on the equations of motion for the stress-controlled simulations are explained in Section 2.1. Specifically, in this study, a volume-controlled over-compression method is compared to four stress-controlled methods, including over-compression and release, gentle under-compression, and cyclical compression and release, which is defined in Section 2.2. With zero initial kinetic energy, most of the protocols show similar behavior, as shown in Section 3.1. A cyclically compressed and expanded packing method has a distinct, non-monotonic dependence with respect to the number of cycles and pressure. Section 3.2 aims to understand the non-monotonic pressure dependence by analyzing the distribution of contact forces. In addition, the non-monotonic pressure dependence in the other protocols is investigated by varying protocol parameters like drag and the initial pressure given in Section 3.2.
2 Methodology
2.1 Constant stress simulations and particle modeling
Granular particles are modeled as spheres of diameter d and mass m, which only interact when in contact through a Hookean spring–dashpot–slider interaction potential (Cundall and Strack, 1979). The normal (n) and tangential (s) particle spring (k) and damping (γ) parameters are set equal to each other kn = ks = 1 and γn = γs = 0.5τ−1, where
Discrete element method (DEM) simulations were performed using LAMMPS (Thompson et al., 2022). The inter-particle forces Fi and torques τi are used to integrate the equations of motion and update particle positions and orientations. To simulate granular particles under constant stress, the equations of motion include the degrees of freedom for a deforming simulation cell. The granular particles are placed within a periodic three-dimensional simulation cell that maintains an applied stress tensor by allowing triclinic cell deformations. In particular, the Shinoda et al. (2004) formulation of a barostat was used to integrate the positions and momenta of the particles and to maintain an applied pressure tensor by varying the simulation cell. This formulation combines the hydrostatic equations of Martyna et al. with the strain energy proposed by Parrinello and Rahman (1981) (Martyna et al., 1994).
Here, the degrees of freedom Nf = 3N, N is the number of particles, and ri and pi are the position and momentum vectors of the ith particle, respectively. A “cell” subscript refers to the simulation cell mass and momentum. The simulation cell “momentum” is modularly invariant and has
The triclinic deformations are captured by the simulation cell matrix h. The hΣhT term comes from the Parrinello–Rahman formulation (Parrinello and Rahman, 1981) and represents the external applied stress, defined by the reference matrix h0, where
At jamming, Pint = Pa within numerical precision. The left-hand term in Eq. 2 is the kinetic energy contribution to pressure Pkinetic. A computational, unitless drag factor kdrag scales the simulation cell acceleration:
where Δt is the time step and fdrag is a non-negative, unitless input parameter2. The simulation cell drag factor can mimic experimental packing protocols or ensure stability flow simulations.
2.2 Packing methodology
For each applied pressure, protocol, and friction simulated, six packings of N = 104 monodisperse particles were generated. Property uncertainties were calculated as the standard deviation from the six different packings. Simulations were initialized with particles at random positions and low volume fraction ϕ0 = 0.05. The initial volume fraction ϕ0 did not affect the properties of the final packing studied here so long as ϕ0 was well below the jamming volume fraction (ϕ0 < ϕjam − 0.3). Initial translational and rotational velocities were set to zero, except when otherwise noted, in which case velocities sample a Gaussian distribution with a mean of 0 and a standard deviation to produce an applied initial kinetic energy. The simulation time step was set to Δt = 0.02τ. A time step Δt = 0.002τ was also tested and did not change the results for the pressures studied within the uncertainties. After initialization, the particles were isotropically compressed. Although the precise initial state of the particles did not impact the packings, the path to the final state had a large impact. Protocol dependence is expected for granular particles because the system is dissipative and far from equilibrium. To sample the possible pathways to pack with a stress tensor control, particles are compressed using one of the following five methods: method I: slow compression from a dilute state; method II: slow expansion from a dense state; method III: repetitive compressions and expansions; method IV: pressure-controlled progressive de-compression from a dense state; and method V: volume-controlled progressive de-compression from a dense state. The initial dilute state for all methods was ϕ0 = 0.05. Method I applies a constant pressure Pa,f at t = 0 until the system jams. In method II, first, the system jams at an initial pressure Pa,0, and then, the applied pressure is instantaneously changed to Pa,f. Method III repeats method II Ncycle times, where the system jams after each Pa,0 and Pa,f is applied. The applied pressure is step-wise decreased in method IV after the system jams at an initial, high pressure Pa,0 > Pa,f, by a fraction of Pa,0 − Pa,f, re-jamming at each step until the system reaches Pa,f. Method V is the same as method IV, but the volume changes, not pressure, similar to a method used in previous simulations (Silbert, 2010). Protocols I–IV are schematically shown in Figure 1.
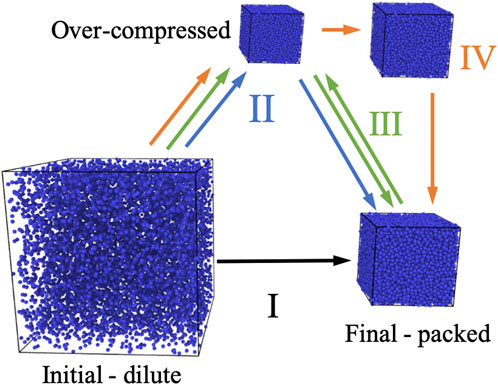
FIGURE 1. Schematic representation of the pressure-controlled isotropic compression methods used in simulations. Procedures are shown as arrows for methods I (black), II (blue), III (green), and IV (orange) and are described in the text.
Beyond the effect of the packing protocol and method, the stress tensor can be constrained in different ways. Triaxial compression tests are a close experimental equivalent to the simulation constraints on the stress tensor for isotropic compression (Reddy et al., 1992). However, the presented simulations use periodic boundary conditions instead of walls. We simulate three cases of applied symmetric stress tensors σa: i) Pa = σa,xx = σa,yy = σa,zz and σa,xy = σa,xz = σa,yz = 0, ii) Pa = (σa,xx + σa,yy + σa,zz)/3 and σa,xy = σa,xz = σa,yz = 0, and iii) Pa = σa,xx = σa,yy = σa,zz, while σa,xy, σa,xz and σa,yz are unspecified and the cell remains rectilinear3. During packing in all these simulations, the final stress tensor equals the applied stress tensor. The differences in the stress tensor of the final packings highlight the importance of understanding the choice of the applied stress tensor.
All of the stress tensor constraints form mechanically stable, jammed configurations. However, the final stress tensors differ. Figures 2A, B show the six components of the diagonal and off-diagonal components of the stress tensor, respectively, using method I. The off-diagonal stress components show the largest differences; see Figure 2B. Simulation cells that are not allowed to tilt, where σa,xy, σa,xz, σa,yz are unspecified, had nonzero, albeit small, values of off-diagonal stress at jamming. Those non-zero shear stresses could lead to different yield stresses (Dagois-Bohy et al., 2012). Simulation cells that are allowed to tilt have off-diagonal stress values that decay to zero and average angles off the orthorombic box of 90° ± 0.003° for all the frictions and pressures tested. The diagonal components of stress σa,xx, σa,yy, and σa,zz are less affected by the constraints. Unless noted otherwise, simulations in Section 3 set diagonal members of the applied stress tensor to the pressure, Pa = σa,xx = σa,yy = σa,zz, and off-diagonal members to zero, i.e., σa,xy = σa,xz = σa,yz = 0. Such precise control of stress is usually unattainable for experimental packing schemes. However, the differences in final states demonstrate the importance of knowing the relevant stress and volume controls in experimental and simulation protocols.
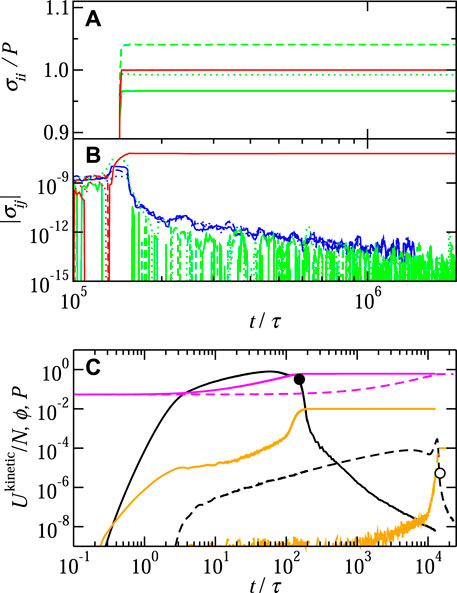
FIGURE 2. (A) Diagonal and (B) off-diagonal components of the measured stress tensor for Pa = 10–5. Three applied stress tensor constraints are plotted: Pa = σa,xx = σa,yy = σa,zz, σa,xy = σa,xz = σa,yz = 0 (blue), Pa = (σa,xx + σa,yy + σa,zz)/3, σa,xy = σa,xz = σa,yz = 0 (green), and Pa = σa,xx = σa,yy = σa,zz, with unspecified values of σa,xy, σa,xz and σa,yz (red) using packing method I. The different components of the stress tensor are plotted as different line types: xx, xy (solid); yy, xz (dashed); and zz, yz (dotted). The off-diagonal components of the stress tensor are shown as averages over 10 time steps for clarity. The red lines lie on top of the blue lines because they have the same diagonal applied stress components in (A). (C) Kinetic energy (black), measured pressure (orange), and volume fraction (magenta) as a function of time for Pa = 10–2 (solid lines) and Pa = 10–4 (dashed lines) using method I. The applied stress tensor is Pa = σa,xx = σa,yy = σa,zz and σa,xy = σa,xz = σa,yz = 0. The jamming time tjam, determined as the inflection point of the kinetic energy for t > Pdamp, is plotted as black circles for Pa = 10–2 (filled) and Pa = 10–4 (open). For (A–C), the simulation cell parameters are Pdamp = 2 and fdrag = 0.1, and the friction state is μs = 0.2.
Using method I and the stress constraint defined as case (i), a representative simulation time progression of the kinetic energy, volume fraction, and pressure are shown in Figure 2C. At t = 0, the kinetic energy and pressure are zero, except for cases with a defined initial pressure, discussed in Section 3.2, at the initial volume fraction ϕ = 0.05. As the simulation cell volume decreases and picks up momentum, the particle velocities increase due to affine motion, and the kinetic energy and pressure increase. At t ≃ Pdamp, the Parrinello–Rahman algorithm starts to control the pressure and the simulation cell momentum, and the kinetic energy decreases. Near jamming, the kinetic energy decreases by several orders of magnitude, and the volume fraction plateaus. The pressure jumps to the applied value as contacts form, with the full applied stress tensor satisfied by the constraints. The near-jamming behavior was similar for all systems studied. However, there are differences at earlier time steps based on the barostat parameters and initial configuration. Lower values of drag approach the applied pressure faster but with more oscillations.
The volume fraction ϕ and coordination number Z are the key parameters calculated in this study. Both ϕ and Z are calculated without “rattlers,” particles that have too few contacts to contribute to the mechanical stability of the packings. Rattlers are identified if Zi < 4 for frictional particles (μs > 0.01) and Zi < 6 for frictionless particles, where Zi is the number of contacts of particle i. The critical friction value μs = 0.01 was chosen because it is the point where friction has an appreciable impact on ϕ and Z (Santos et al., 2020). Rattlers are identified iteratively so that the number of contacts per particle decreases based on the number of rattlers in contact with the particle. If the number of contacts decreases enough to constitute a rattler, by removing neighboring rattlers, it is counted as such. The fraction of rattlers ranges from 0.1% to 10%, correlates with Z, and depends on μs and P.
All of the packings generated were taken from the final simulation configuration after the simulation was run for at least twice the jamming time. The time to jam depends on the method, particle, and barostat parameters, and therefore, some simulations ran longer than others. The inflection point of the kinetic energy, plotted as symbols in Figure 2C, corresponds well with the point where the volume fraction stops changing and is a good estimate of the time to jam. However, the volume fraction is not strictly constant once the simulation cell stops moving and increases slowly for a longer time. To allow for these changes, we run t/τ = 106 for Pa = 10–4, fdrag = 0.0, and Pdamp = 2.25, which is well above the time to jam tjam ∼ 1.5 × 10⁴τ. The inflection point in kinetic energy defines tjam (see Figure 2). The time to jam is inversely proportional to the applied pressure,
3 Results
3.1 Packing method dependence
To explore different routes for frictional particle packing (Silbert et al., 2002; Shundyak et al., 2007; Silbert, 2010), we applied various isotropic compression methods to particles with sliding friction. In this subsection, the packings were formed at different applied pressures Pa, where the internal pressure of the mechanically stable packing was Pint = Pa, with sliding friction μs = 0.2. The packing volume fraction is between the frictionless and high-friction limits at μs = 0.2, where μs = 0.2 is in the middle of the experimentally observed material friction range (Farrell et al., 2010). The low-pressure range can be jammed stably at a low computational cost. The packing behavior generated by pressure-controlled compression methods I–V is shown in Figure 3 and detailed in Section 2.2.
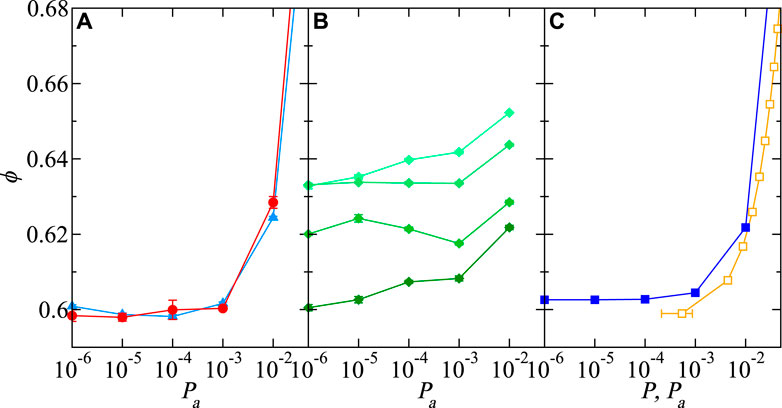
FIGURE 3. (A) Method I (red circles) packing fraction as a function of pressure ϕ(Pa) is compared with method II (light blue triangles), where Pa,0 = 10–4 and Pa,f = Pa. (B) Method III, akin to tapping, is shown after a different number of compressions Ncompress = 1 (dark green diamonds), 10, 100, and 1,000 (light green diamonds). The packings are compressed to Pa,0 = 10–1 in between relaxations. (C) Progressive compression methods with stress (IV, blue squares) and volume (V, orange squares) control show different ranges of pressure. The initial large stress for method IV is Pa,0 = 10–1. Method V volume step changes were constant Δϕ = 0.01. Particles are frictional μs = 0.2 and are packed with simulation cell parameters Pdamp = 2.25 and fdrag = 0. Uncertainties are similar to the symbol size.
Figure 3A shows methods I and II, which are the under- and over-compression methods. Method I applies a pressure at t = 0 to a dilute packing; a lower pressure translates to slower compression. Method II follows method I at first, where an initial pressure Pa,0 is applied to a dilute system (ϕ = 0.05) to form a mechanically stable packing. A lower pressure Pa,f is applied to the packing formed at Pa,0 to form a new mechanically stable packing. The pressure on the x-axis of the left panel of Figure 3 is Pa,f for method II. The Supporting Material includes method II packing fractions with other initial pressures Pa,0. As expected (O’Hern et al., 2003; Silbert, 2010), ϕ from method I decreases monotonically. Although the absolute values between methods I and II are similar, method II has a minimum pressure. The non-monotonic pressure dependence is analyzed in Section 3.2.
Like method II, method III can lead to monotonic or non-monotonic ϕ(Pa). Method III, essentially, cyclically repeats method II. The first cycle in method III, Ncycle = 1, is the same as in method II with the Pa,0 = 10–1, at which point there is no minimum in ϕ(Pa), as shown in Figure 3B. The minimum in ϕ(Pa) appears after a few cycles (5 < Ncycle < 100) and disappears at higher cycles (Ncycle > 100).
The non-monotonic ϕ(Pa) behavior, seen in Figure 3B, occurs over a range of Ncycle, shown in Figure 4. For each Pa, ϕ(Pa, Ncycle) increases monotonically with Ncycle. Lower pressures Pa < 10–4 compact at a faster rate with respect to Ncycle and saturate as Ncycle → ∞. The lower Pa packing fractions crossing the higher Pa values, around Ncycle = 5 and Ncycle = 70, provide the same result as the non-monotonicity observed in ϕ(Pa); see Figure 3B. Yet, since the lower Pa packings have compaction asymptotes at fewer Ncycle, higher Pa packings are denser, and ϕ(Pa) is monotonic at higher Ncycle. The lower pressures have a larger difference with Pa,0, which allows more time to pack and re-form contacts to build more compact networks with fewer Ncycle. At higher Ncycle, method III forms denser packings with more predictable monotonic ϕ(Pa) behavior.
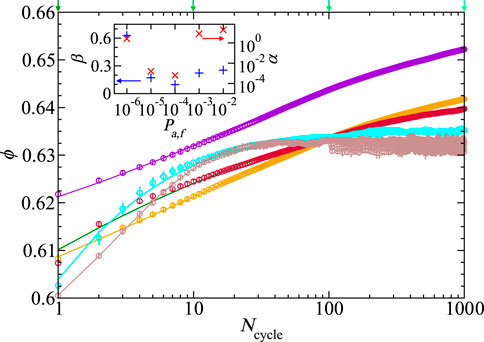
FIGURE 4. Volume fraction ϕ increases monotonically with Ncycle using method III by cycling from Pa,0 = 10–1 to different low-pressure compression values Pa,f = 10–2 (magenta), 10–3 (orange), 10–4 (dark red), 10–5 (cyan), and 10–6 (brown). Lines drawn are stretched-exponential fits to simulation data (see Eq. 4). The KWW fit parameters α (red crosses, right inset axis) and β (blue pluses, left inset axis) are plotted in the inset as a function of the applied pressure Pa. The shades of the green arrows at the top of the graph indicate the number of compressions that correspond with the ϕ(P) data shown in Figure 3B. Uncertainties are similar to the symbol size.
The behavior observed in ϕ(Ncycle) is captured by fits to a Kohlrausch–Williams–Watts (KWW) law (Kohlrausch, 1854; Williams and Watts, 1970):
where the fitting parameters are ϕ∞, ϕ0, α, and β. The intercept ϕ0 and asymptote ϕ∞ values are monotonic, inferred by the low and high Ncycle curve values in Figure 4. Figure 4 inset shows that the parameters α and β are non-monotonic with pressure. The KWW fit parameters α and β quantify the trends in ϕ(Ncycle, Pa) and show different behavioral patterns above and below Pa = 10–4.
The KWW and logarithmic heuristic (Knight et al., 1995) fits have been applied to experimentally tapped packings. The KWW fit had consistently lower residual standard deviations compared to the logarithmic heuristic fit for the presented data, as shown by Richard et al. (2005). Method III is considerably different from the experimental tapping protocols (Knight et al., 1995; Philippe and Bideau, 2002), which are compressed in all directions, have no walls, have varying peak tap accelerations, but not the pressure, and lead to denser volume fractions ϕ > 0.64. The KWW fits to experimental data (Knight et al., 1995; Philippe and Bideau, 2002) parameters range from 1 < α < 500 and 0.14 < β < 0.65. Simulation and experimental exponential KWW β fit parameters are in the same range. The α fit parameters have a different meaning in experiments, which track ϕ(t), not ϕ(Ncycle), in which case α is a rate. However, both experiments and simulations found that β increases and α decreases with increasing packing intensity. However, the DEM simulations showed that, like experimental tapping, “loose” packings are compact with tapping (Knight et al., 1995; Rosato et al., 2010). Kumar and Luding (2016) observed similar behaviors and found that the memory of the deformation theory could explain the denser-than-experiment volume fractions.
Methods IV and V, shown in Figure 3C, differ from method II by gradually, instead of instantaneously, decreasing the applied target pressure at each step, allowing the particles to pack after expansion. Method IV uses pressure-controlled compression, like in methods I–III, and in method V, the volume is decreased by Δϕ = 0.01. Smaller volumetric decreases can lead to looser packings (Silbert, 2010). Neither method IV nor V has a minimum in ϕ(Pa), as observed in method II. The absence of a minimum is likely because the volume change is not large enough to break the majority of the contact network. Stable packings could not be formed with method V for ϕ < 0.599 and P < 5 × 10⁻⁴. Silbert (2010) observed similar volume-controlled packing limits. Ramped-pressure compression simulations of cohesive, frictional grains have exhibited a strong history and protocol dependence (Nan and Hoy, 2023). These methods show that stable packings of the same model frictional particles with the same stress state can have a wide range of volume fractions and are protocol-dependent.
3.2 Non-monotonic volume fraction pressure dependence
Depending on the packing protocol, the final packing volume fraction can increase with decreasing pressure. The minimum in ϕ(Pa) shown in Figures 3A, B for packing methods II and III showcases the protocol-dependent nature of the packing process. A minimum is not observed in the coordination number, which is relatively insensitive to the packing protocol. This leads to the possibility of two packings with the same volume fraction but different coordination numbers. The initial kinetic energy, drag coefficient, and friction are varied to observe the scale protocol parameter impacts on the non-monotonic behavior.
The initial pressure and kinetic energy are important contributions to the packing microstructure. Packings in Figures 3, 4 were initiated with zero initial kinetic energy and pressure. Increasing the average initial particle translational kinetic energy causes a volume fraction minimum using packing method I. Figure 5A shows the role of initial kinetic energy contribution to pressure
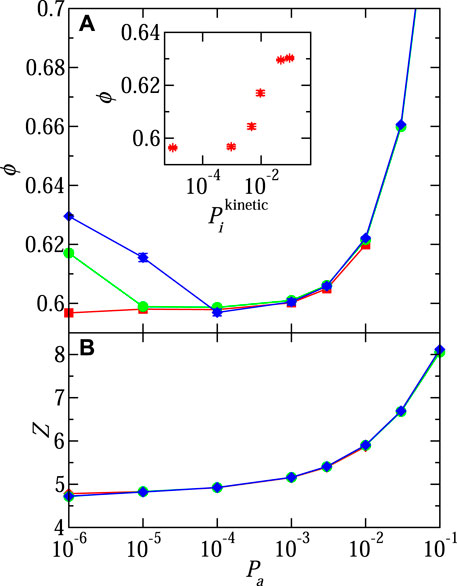
FIGURE 5. (A) Packing fraction ϕ and (B) average coordination number Z without rattlers as a function of the pressure Pa. Packings were generated with method I, Pdamp = 2.25, fdrag = 0, and varied amounts of initial total translational kinetic energy contribution to pressure
The minimum value of ϕ in Figure 5A occurs at Pa = 10–4, comparable to the lowest pressures (for intermediate to high μs) accessible in volume-controlled studies [see Figure 3C and references (Shundyak et al., 2007; Silbert, 2010)]. The behaviors of the cyclical packings, generated with method III, also transition at Pa = 10–4, specifically the KWW fit parameters α and β in the inset in Figure 4. Experimental and simulation tapping studies observed a minimum in ϕ with the number of cycles (Pugnaloni et al., 2010; Carlevaro and Pugnaloni, 2011).
Particle friction is known to lower the packing fraction and coordination number but also changes the ϕ(Pa) minima. Packing fractions in Figures 3–5 are from particles with intermediate friction μs = 0.2. The non-monotonicity in ϕ(Pa) affects the friction dependence of ϕ(μs), as shown in Figure 6. The general form of ϕ(μs) is similar to previous studies of packing with sliding friction (Shundyak et al., 2007; Santos et al., 2020); however, the initial pressure and drag change the pressure dependence.
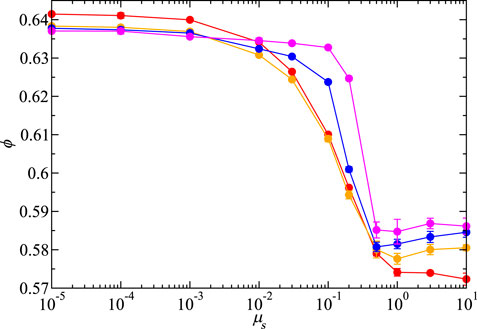
FIGURE 6. Packing fraction ϕ as a function of the sliding friction coefficient μs with non-zero initial kinetic energy contribution to pressure
For Pa < 10–3, frictionless particles approach the hard-sphere limit and ϕ approaches the μs = 0 maximally jammed state. The non-monotonicity with pressure occurs for frictions μs > 10–3, where the different pressure curves cross. Lowering the pressure narrows the low-to-high μs transition, when initialized with non-zero pressure. Although it seems that ϕ(μs) tends to a step function as Pa → 0, this behavior depends on the protocol. Going to lower pressures to see if a step function arises is computationally difficult because the time to jam the system scales inversely with the applied pressure. The ϕ(μs) behavior, as does ϕ(Pa), highlights the interdependence of particle interaction and control parameters. The larger pressure, Pa > 10–3, behavior of ϕ(μs) is shown in the Supporting Material.
Applying drag in simulations (Delaney et al., 2011; Hoy and Kröger, 2020) or placing particles in density-match fluid in experiments (Farrell et al., 2010) slows the packing and contact formation processes and forms low-density packings. In simulations, drag, which scales the simulation cell acceleration by fdrag, also slows the processes. Like the initial kinetic energy contribution to pressure, drag can have a significant effect on the final packing fraction. Figure 6 shows data for packings generated with the drag, while packings in Figures 3A, B have no drag. Figure 7 shows that although the drag can change the volume fraction, a minimum in ϕ(Pa) is present for all values of fdrag packed using method I with non-zero initial pressure. For a lower pressure, Pa < 10–4, the ϕ(Pa) minimum is more narrow for a larger drag fdrag. A limiting value of ϕ(Pa → 0) ≃ 0.63 is the same with all simulation cell drags. The inset in Figure 7 shows that drag has a small effect on packings when initialized with zero pressure. The ϕ(Pa) dependence on fdrag demonstrates another of many components of protocol design that impact the final packing of frictional particles.
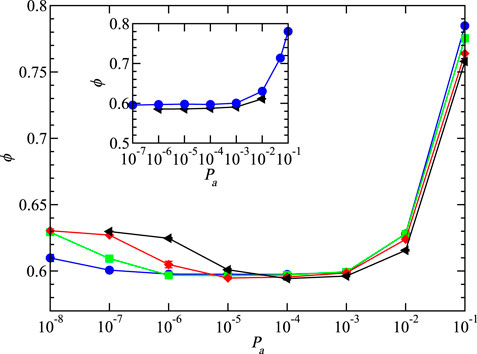
FIGURE 7. Packing fraction as a function of the pressure ϕ(Pa) with particle friction μs = 0.2. Initial kinetic energy contribution to pressure
The distribution of contact forces at jamming offers an explanation for the non-monotonicity of volume fraction with pressure. The distributions Fs/μsFn, where Fs and Fn are the magnitudes of the tangential and normal forces, respectively, are shown in Figure 8 for the zero and non-zero initial kinetic contribution to pressure cases. As shown in Figure 5, the non-monotonicity in ϕ(Pa) occurs when there is a non-zero initial kinetic contribution to pressure
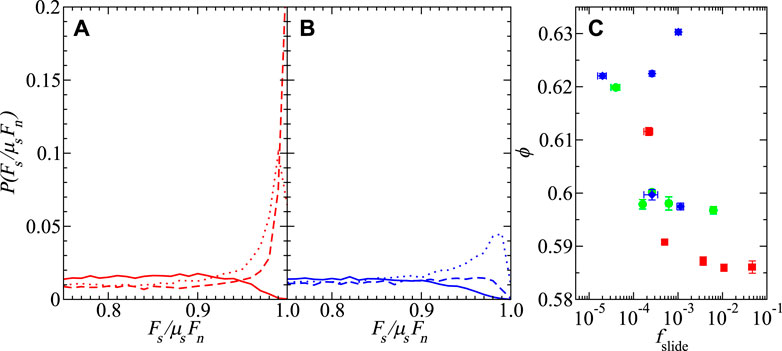
FIGURE 8. Probability distribution of the tangential force Fs normalized by the maximum, μsFn, for different pressures: Pa = 10–2 (solid lines), 10–4 (dotted lines), and 10–6 (dashed lines).
The peak location of P(Fs/μsFn) is another manifestation of the non-monotonic ϕ(Pa) behavior. The peak in P(Fs/μsFn) is shifted below Fs/μsFn = 1 for Pa ≤ 10–4 if
4 Conclusion
Simulations of three-dimensional frictional granular spheres were packed into mechanically stable configurations using pressure-controlled protocols to study the protocol dependence of jamming. The protocols modeled bulk-like packings, with periodic boundary conditions and precisely defined internal states of stress. Five packing protocols were studied: I) slow compression from a dilute state, II) slow expansion from a dense state, III) repetitive compressions and expansions, IV) pressure-controlled progressive de-compression from a dense state, and V) volume-controlled progressive de-compression from a dense state.
Non-monotonic packing fraction dependence on pressure was observed in multiple protocols. This led to configurations packed with the same contact mechanics and the same packing fraction but up to one average contact less per particle. If dilute initial particle configurations are initialized with non-zero velocities or pressure, the packing fraction has a minimum with respect to decreasing pressure. Regardless of the initial kinetic energy, the coordination number decreased monotonically with pressure. For the cyclical protocol, method III, non-monotonic packing fraction pressure dependence occurred for an intermediate number of packing cycles. The volume fraction evolution with the number of cycles ϕ(Ncycles) changed qualitatively with pressure. The parameters for fits to ϕ(Ncycles) transitioned at intermediate pressure p = 10–4. Packings at high pressures compacted continuously with Ncycles, but low pressures stopped compacting after Ncycles = 30. Future study of the progression of particle correlation and force distribution in these two types of cyclical packings could help model the parameters in the fits to ϕ(Ncycles, P).
The tangential force distributions and fraction of frictional contacts were calculated. Low-pressure force distributions were found to be protocol-dependent. Low initial kinetic energy, and therefore volume fraction, packings had fewer contacts at and near the Coulomb criteria. The inverse correlation between the volume fraction and the fraction of contacts near the sliding friction Coulomb criterion suggests that lower volume fractions are supported by a higher fraction of frictional contacts. The coordination number and packing fraction are often insufficient to define the packing state. The fraction of frictional contacts, shown in this study, the fabric (Srivastava et al., 2022) and/or the stress tensor state (Pugnaloni et al., 2010) may be required to define a packing state. These behaviors disappear for low, but significant enough, frictions μs < 10–2, at least in method I. Packings initiated with non-zero initial kinetic energy also result in a sharper packing fraction transition with respect to the friction coefficient from frictionless to high-frictional behavior.
Stress-controlled packing protocol dependence likely reaches beyond the properties studied here. Further analysis at the microstructural level, such as properties of the contact network, possibly with the dynamical matrix and fabric tensor, along with a macroscopic approach, such as analysis of the static structure factor and elastic moduli, may further characterize the existence of states with high volume fractions and low coordination numbers. Particles with more restraints on contacts, those with rolling friction, cohesion, or non-spherical packing, will also depend on the packing protocol, likely in pronounced ways. The protocols presented can be applied to deformation geometries beyond isotropic, such as shear- and extension-jamming. Studies on packing protocol support applying conclusions from well-defined packing protocols to more complex industrial and natural packings.
Data availability statement
The raw data supporting the conclusion of this article will be made available by the authors, without undue reservation.
Author contributions
AS: conceptualization, investigation, methodology, writing–original draft, and writing–review and editing. IS: conceptualization and writing–review and editing. LS: conceptualization and writing–review and editing. JL: conceptualization, funding acquisition, project administration, and writing–review and editing. GG: conceptualization, funding acquisition, project administration, writing–review and editing, and supervision.
Funding
The author(s) declare financial support was received for the research, authorship, and/or publication of this article. AS acknowledges this work was supported, in part, by funding from the NASA Game Changing Development Program. IS acknowledges support from the U.S. Department of Energy (DOE), Office of Science, Office of Advanced Scientific Computing Research, Applied Mathematics Program, under Contract No. DE-AC02-05CH11231.
Licenses and permissions
This work was performed, in part, at the Center for Integrated Nanotechnologies, an Office of Science User Facility operated by the U.S. Department of Energy (DOE) Office of Science. Sandia National Laboratories is a multi-mission laboratory managed and operated by the National Technology and Engineering Solutions of Sandia, LLC., a wholly owned subsidiary of Honeywell International, Inc., for the U.S. DOE’s National Nuclear Security Administration under Contract No. DE-NA-0003525.
Conflict of interest
Author AS was employed by AMA Inc. JL and GG are employees of Sandia National Laboratories.
The remaining authors declare that the research was conducted in the absence of any commercial or financial relationships that could be construed as a potential conflict of interest.
Publisher’s note
All claims expressed in this article are solely those of the authors and do not necessarily represent those of their affiliated organizations, or those of the publisher, the editors, and the reviewers. Any product that may be evaluated in this article, or claim that may be made by its manufacturer, is not guaranteed or endorsed by the publisher.
Author disclaimer
The views expressed in the article do not necessarily represent the views of the U.S. DOE or the United States Government.
Supplementary material
The Supplementary Material for this article can be found online at: https://www.frontiersin.org/articles/10.3389/frsfm.2023.1326756/full#supplementary-material
Footnotes
1To exclude thermostat chain and options in LAMMPS (Thompson et al., 2022), add pchain 0 ptemp 1 to the fix nph/sphere barostat options.
2Add drag fdrag to the fix nph/sphere options to apply drag on the barostat in LAMMPS (Thompson et al., 2022).
3To apply those symmetric stress tensors in LAMMPS (Thompson et al., 2022), use fix nph/sphere with the following options: i) xy 0 0 1 xz 0 0 1 yz 0 0 1 and ii) xy 0 0 1 xz 0 0 1 yz 0 0 1 couple xyz. Case iii) does not need additional options. See LAMMPS documentation for more details.
References
Bertrand, T., Behringer, R. P., Chakraborty, B., O’Hern, C. S., and Shattuck, M. D. (2016). Phys. Rev. E 93, 1–7. doi:10.1103/PhysRevE.93.012901
Bi, D., Zhang, J., Chakraborty, B., and Behringer, R. P. (2011). Jamming by shear. Nature 480, 355–358. doi:10.1038/nature10667
Bililign, E. S., Kollmer, J. E., and Daniels, K. E. (2019). Phys. Rev. Lett. 122, 38001. doi:10.1103/PhysRevLett.122.038001
Buarque de Macedo, R., Andò, E., Joy, S., Viggiani, G., Pal, R. K., Parker, J., et al. (2021). Unearthing real-time 3D ant tunneling mechanics. Proc. Natl. Acad. Sci. 118, e2102267118. doi:10.1073/pnas.2102267118
Carlevaro, C. M., and Pugnaloni, L. A. (2011). Steady state of tapped granular polygons. J. Stat. Mech. 2011, P01007. doi:10.1088/1742-5468/2011/01/p01007
Charbonneau, P., Corwin, E. I., Parisi, G., and Zamponi, F. (2012). Universal microstructure and mechanical stability of jammed packings. Phys. Rev. Lett. 109, 205501. doi:10.1103/physrevlett.109.205501
Chaudhuri, P., Berthier, L., and Sastry, S. (2010). Jamming transitions in amorphous packings of frictionless spheres occur over a continuous range of volume fractions. Phys. Rev. Lett. 104, 165701. doi:10.1103/physrevlett.104.165701
Cundall, P. A., and Strack, O. D. L. (1979). A discrete numerical model for granular assemblies. Geotechnique 29, 47–65. doi:10.1680/geot.1979.29.1.47
Dagois-Bohy, S., Tighe, B. P., Simon, J., Henkes, S., and Van Hecke, M. (2012). Phys. Rev. Lett. 109, 1–5. doi:10.1103/PhysRevLett.109.095703
Delaney, G. W., Hilton, J. E., and Cleary, P. W. (2011). Defining random loose packing for nonspherical grains. Phys. Rev. E 83, 051305. doi:10.1103/physreve.83.051305
Farrell, G. R., Martini, K. M., and Menon, N. (2010). Loose packings of frictional spheres. Soft Matter 6, 2925–2930. doi:10.1039/c0sm00038h
Gerhard, M., and Reich, M. (2000). Restoration of streams with large wood: effects of accumulated and built-in wood on channel morphology, habitat diversity and aquatic fauna. Int. Rev. Hydrobiology 85, 123–137. doi:10.1002/(sici)1522-2632(200003)85:1<123::aid-iroh123>3.0.co;2-t
Hoy, R. S., and Kröger, M. (2020). Unified analytic expressions for the entanglement length, tube diameter, and plateau modulus of polymer melts. Phys. Rev. Lett. 124, 147801. doi:10.1103/physrevlett.124.147801
Knight, J. B., Fandrich, C. G., Ning Lau, C., Jaeger, H. M., and Nagel, S. R. (1995). Density relaxation in a vibrated granular material. Phys. Rev. E 51, 3957–3963. doi:10.1103/physreve.51.3957
Kumar, N., and Luding, S. (2016). Memory of jamming–multiscale models for soft and granular matter. Granul. Matter 18, 58. doi:10.1007/s10035-016-0624-2
Lubachevsky, B. D., and Stillinger, F. H. (1990). Geometric properties of random disk packings. J. Stat. Phys. 60, 561–583. doi:10.1007/bf01025983
Martyna, G. J., Tobias, D. J., and Klein, M. L. (1994). Constant pressure molecular dynamics algorithms. J. Chem. Phys. 101, 4177–4189. doi:10.1063/1.467468
Nan, K., and Hoy, R. S. (2023). Ultraslow settling kinetics of frictional cohesive powders. Phys. Rev. Lett. 130, 166102. doi:10.1103/physrevlett.130.166102
O’Hern, C. S., Langer, S. A., Liu, A. J., and Nagel, S. R. (2002). Random packings of frictionless particles. Phys. Rev. Lett. 88, 075507. doi:10.1103/physrevlett.88.075507
O’Hern, C. S., Silbert, L. E., Liu, A. J., and Nagel, S. R. (2003). Phys. Rev. E 68, 1–19. doi:10.1103/PhysRevE.68.011306
Onoda, G. Y., and Liniger, E. G. (1990). Random loose packings of uniform spheres and the dilatancy onset. Phys. Rev. Lett. 64, 2727–2730. doi:10.1103/physrevlett.64.2727
Parrinello, M., and Rahman, A. (1981). Polymorphic transitions in single crystals: a new molecular dynamics method. J. Appl. Phys. 52, 7182–7190. doi:10.1063/1.328693
Philippe, P., and Bideau, D. (2002). Compaction dynamics of a granular medium under vertical tapping. Euro. Phys. Lett. 60, 677–683. doi:10.1209/epl/i2002-00362-7
Pugnaloni, L. A., Sánchez, I., Gago, P. A., Damas, J., Zuriguel, I., and Maza, D. (2010). Towards a relevant set of state variables to describe static granular packings. Phys. Rev. E 82, 050301. doi:10.1103/physreve.82.050301
Reddy, K. R., Saxena, S. K., and Budiman, J. S. (1992). Development of a true triaxial testing apparatus. Geotech. Test. J. 15, 89–105. doi:10.1520/gtj10231j
Richard, P., Nicodemi, M., Delannay, R., Ribière, P., and Bideau, D. (2005). Slow relaxation and compaction of granular systems. Nat. Mater. 4, 121–128. doi:10.1038/nmat1300
Rosato, A. D., Dybenko, O., Horntrop, D. J., Ratnaswamy, V., Kondic, L., and Carlo, M. (2010). Microstructure evolution in density relaxation by tapping. Phys. Rev. E 81, 061301. doi:10.1103/physreve.81.061301
Santos, A. P., Bolintineanu, D. S., Grest, G. S., Lechman, J. B., Plimpton, S. J., Srivastava, I., et al. (2020). Granular packings with sliding, rolling, and twisting friction. Phys. Rev. E 102, 032903. doi:10.1103/physreve.102.032903
Shinoda, W., Shiga, M., and Mikami, M. (2004). Phys. Rev. B 69, 16–18. doi:10.1103/PhysRevB.69.134103
Shundyak, K., Van Hecke, M., and Van Saarloos, W. (2007). Force mobilization and generalized isostaticity in jammed packings of frictional grains. Phys. Rev. E 75, 010301. doi:10.1103/physreve.75.010301
Silbert, L. E. (2010). Jamming of frictional spheres and random loose packing. Soft Matter 6, 2918–2924. doi:10.1039/c001973a
Silbert, L. E., Ertaş, D., Grest, G. S., Halsey, T. C., and Levine, D. (2002). Phys. Rev. E 65, 1–6. doi:10.1103/PhysRevE.65.031304
Smith, K. C., Srivastava, I., Fisher, T. S., and Alam, M. (2014). Variable-cell method for stress-controlled jamming of athermal, frictionless grains. Phys. Rev. E 89, 042203. doi:10.1103/physreve.89.042203
Snow, Z., Martukanitz, R., and Joshi, S. (2019). On the development of powder spreadability metrics and feedstock requirements for powder bed fusion additive manufacturing. Addit. Manuf. 28, 78–86. doi:10.1016/j.addma.2019.04.017
Somfai, E., Van Hecke, M., Ellenbroek, W. G., Shundyak, K., and Van Saarloos, W. (2007). Critical and noncritical jamming of frictional grains. Phys. Rev. E 75, 020301. doi:10.1103/physreve.75.020301
Song, C., Wang, P., and Makse, H. A. (2008). A phase diagram for jammed matter. Nature 453, 629–632. doi:10.1038/nature06981
Srivastava, I., Silbert, L. E., Grest, G. S., and Lechman, J. B. (2019). Phys. Rev. Lett. 122, 48003. doi:10.1103/PhysRevLett.122.048003
Srivastava, I., Silbert, L. E., Lechman, J. B., and Grest, G. S. (2022). Flow and arrest in stressed granular materials. Soft Matter 18, 735–743. doi:10.1039/d1sm01344k
Thompson, A. P., Aktulga, H. M., Berger, R., Bolintineanu, D. S., Brown, W. M., Crozier, P. S., et al. (2022). LAMMPS - a flexible simulation tool for particle-based materials modeling at the atomic, meso, and continuum scales. Comput. Phys. Commun. 271, 108171. doi:10.1016/j.cpc.2021.108171
Torquato, S., Truskett, T. M., and Debenedetti, P. G. (2000). Phys. Rev. Lett. 84, 2064–2067. doi:10.1103/physrevlett.84.2064
Watanabe, S., Hirabayashi, M., Hirata, N., Hirata, Na., Noguchi, R., Shimaki, Y., et al. (2019). Hayabusa2 arrives at the carbonaceous asteroid 162173 Ryugu—a spinning top–shaped rubble pile. Science 364, 268–272. doi:10.1126/science.aav8032
Weiner, N., Bhosale, Y., Gazzola, M., and King, H. (2020). Mechanics of randomly packed filaments—the “bird nest” as meta-material. J. Appl. Phys. 127, 050902. doi:10.1063/1.5132809
Williams, G., and Watts, D. C. (1970). Non-symmetrical dielectric relaxation behaviour arising from a simple empirical decay function. Trans. Faraday Soc. 66, 80–85. doi:10.1039/tf9706600080
Keywords: discrete element modeling, granular, packing, friction, LAMMPS, protocol, jamming
Citation: Santos AP, Srivastava I, Silbert LE, Lechman JB and Grest GS (2024) Protocol-dependent frictional granular jamming simulations: cyclical, compression, and expansion. Front. Soft Matter 3:1326756. doi: 10.3389/frsfm.2023.1326756
Received: 23 October 2023; Accepted: 28 December 2023;
Published: 29 January 2024.
Edited by:
Carlos Manuel Carlevaro, National Scientific and Technical Research Council (CONICET), ArgentinaReviewed by:
Luis Pugnaloni, National Scientific and Technical Research Council (CONICET), ArgentinaJosé Ramón Darias, Simón Bolívar University, Venezuela
Copyright © 2024 Santos, Srivastava, Silbert, Lechman and Grest. This is an open-access article distributed under the terms of the Creative Commons Attribution License (CC BY). The use, distribution or reproduction in other forums is permitted, provided the original author(s) and the copyright owner(s) are credited and that the original publication in this journal is cited, in accordance with accepted academic practice. No use, distribution or reproduction is permitted which does not comply with these terms.
*Correspondence: A. P. Santos, YW5kcmV3LnAuc2FudG9zQG5hc2EuZ292