 Roberto Arévalo1,2*
- 1CIRCE—Technology Center, Parque Empresarial Dinamiza, Zaragoza, Spain
- 2STEAM, Universidad Europea de Valencia, Valencia, Spain
Predicting the mixing or segregation of granular of dense materials is difficult due to their athermal nature and lack of general theories. The goal of this research is to improve the design (diameter of the cylinder) and operation (rotational frequency of the screw conveyor) of the stirrer to attain good mixing. We characterize the mixing by some macroscopic measures and relate its behavior with the design parameters. Afterward, we compute some microscopic measurements that characterize the movement of the spheres and relate them with the operating conditions. The quality of mixing is found to depend on the rotation frequency of the screw conveyor and the gap between the latter and the enclosing cylinder. Besides, some relationships between micro- and macroscopic measures are drawn. This approach can provide guidance on the design or operation of devices to handle granular media when their microscopic behavior is previously known.
1 Introduction
Granular materials are justly famous for being difficult to mix. Because of their intrinsic out-of-equilibrium nature, they display anti-intuitive behaviors like the increase in order due to segregation (Zuriguel et al., 2006). Since granular materials do not naturally diffuse (their effective temperature is zero), an input of energy is required to start movement. This is usually done by vibrating, tapping, or rotating a recipient full of grains. Segregation under agitation (the Brazil nut effect) is one of the most studied problems in dense granular matter (Rosato et al., 1987; Liffman et al., 2001; Nahmad-Molinari et al., 2003; Gajjar et al., 2021). Granular particles also segregate under rotation in a cylindrical tumbler (Oyama, 1939; Oyama, 1940; Hill and Kakalios, 1995; Rapaport, 2002; Fiedor and Ottino, 2003; Naji and Stannarius, 2009; Rietz and Stannarius, 2012) or a rotating drum (Prigozhin and Kalman, 1998). Other surprising behaviors include the horizontal segregation under vertical vibrations (Levanon and Rapaport, 2001; Rapaport, 2001), the reversal of segregation (Breu et al., 2003), and even pattern formation (Aoki and Akiyama, 1996). In all cases, the differences in the particles’ size, mass, or density are the subject of a mechanism that leads to the separation of the particles according to their nature. The segregation of a massive intruder can be caused by inertia (Huerta and Ruiz-Suárez, 2004) under tapping or by Archimedean sinking under vibration (Jing et al., 2020); under similar conditions, a large intruder will be segregated due to steric effects (Duran et al., 1993; Dippel and Luding, 1995). In large-enough containers, convection currents are the leading mechanism (Knight et al., 1993). Similar processes are at play in tumblers along with new processes like avalanching and waves. The cause can also have a more subtle origin like a difference in the friction coefficient (Ciamarra et al., 2006; Gillemot et al., 2017). For dilute to moderately dense media, the kinetic theory can be used to explain segregation and mixing using a granular temperature proportional to the fluctuations of the velocities, as shown in García-Chamorro et al. (2022).
In addition to its scientific interest, segregation has important practical consequences (Simons et al., 2013). In many production processes, it is necessary to mix particles, e.g., to produce cement (Pinzón-Moreno et al., 2020), create drugs (Côté and Abatzoglou, 2006; Jaklič et al., 2015), and handle foodstuffs (Cullen, 2009). Procedures for sorting require the opposite (Meier et al., 2007). Thus, understanding the causes and mechanisms of segregation will lead to optimized industrial processes. Regarding mixing, in the 1950s, it was thought that practice was the best source of knowledge on techniques and apparatuses to mix solids (Weidenbaum, 1958). However, soon the necessity to conduct the basic theoretical work was recognized (Bourne, 1964; Hersey, 1975). It was pointed out that the deduction of rheological properties on simple geometries would be helpful in understanding the behavior of particulated solids in complex mixers. This idea rooted in the field, and in the next years, studies that analyzed the diffusion of particles in mixers emerged (Cahn et al., 1966; Cahn and Fuerstenau, 1969; Bridgewater, 1976). These were complemented with the definition of phenomenological quantities, like the mixing index. This is just an adimensional quantity defined to take values between 0 and 1, the former corresponding to a segregated state and the latter to a well-mixed state. Several definitions have been put forward (Lacey, 1954; Bridgewater, 1976; Schofield, 1976; Poux et al., 1991; Julián et al., 2016; Jin et al., 2022). With the advancement of computational resources, the first numerical studies grew to full-scale simulations. The literature is abundant. DEM studies on apparatuses similar to the apparatus studied here can be found in Stewart et al. (2001), Basinskas and Sakai (2016), Simons et al. (2016), Chandratilleke et al. (2018), Halidan et al. (2018), Gao et al. (2019), and Tsugeno et al. (2021). Researchers have also resorted to simulations using different methods, e.g., (Nguyen et al., 2014; Bai et al., 2017).
In the aforementioned studies, one wishes to mix particles with different properties. However, a pertinent question arises: what happens when all particles are identical? In this case, we can still speak of mixing because we can put a label in each particle and follow its trajectory. It is possible to define measures of mixing that will tell us whether particles that were close at the initial instant remain close after a certain amount of time. The mixing of identical grains under vertical vibration was experimentally studied in Zik and Stavans (1991), concluding that it is a self-diffusive process. Computational studies of beds of identical grains under shear (Savage and Dai, 1993; Campbell, 1997) were also found to be diffusive processes. In Barker and Mehta (1993), two regimes were identified (flow and voidage) depending on the density of the bed. The influence of flow parameters on self-diffusion in a vibrated granular bed was studied by simulation and experiment in Yang and Hsiau (2001). The crossover from a ballistic to diffusional regime was investigated experimentally in Wildman et al. (1999) using image processing technology to measure the self-diffusion coefficients of hard disks in a vertical vibrated bed. Simulating granular convection (Aoki and Akiyama, 1998) measured a self-diffusion coefficient and characterized the underlying physics as a phenomenon of mass diffusion induced by energy injection. In a different system, Utter and Behringer (2004) analyzed shearing experimentally and modeled it by a random walk, confirming the diffusive nature of the flow. More recently, Artoni et al. (2021; 2022) measured the self-diffusion coefficients in discrete numerical simulations of steady, homogeneous, collisional shearing flows of nearly identical, frictional, and inelastic spheres. They considered homogeneous and inhomogeneous flows and modeled their results by a random walk, confirming the diffusional nature of the process.
In this work, we analyze the mixing of identical granular particles with the aim of optimizing mixing. Our motivation is a practical application: mixing heated particles to homogenize an applied temperature. The system chosen is a screw conveyor enclosed in a cylindrical case, as shown in Figure 1. The process starts by filling the mixer with ≃2000 balls. After they reach equilibrium at the bottom of the mixer, the screw conveyor starts rotating at a fixed velocity, causing the particles to move upward. The design of the screw conveyor is such that the particles accumulate close to the pole and fall by the sides. This pattern of movement should produce a homogeneous mixing and facilitate the even distribution of the applied temperature.
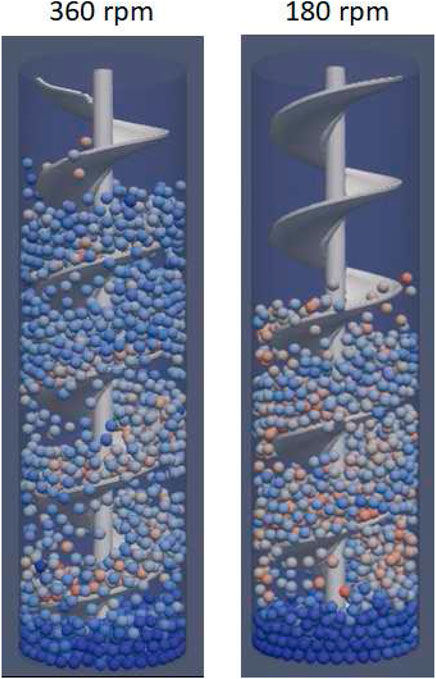
FIGURE 1. Two snapshots of the stirrer in the stationary state at different rotating velocities.
We run several simulations in which we change the rotational frequency of the screw conveyor, the diameter of the enclosing cylinder, and the size of the particles. In each case, the performance of the apparatus is assessed and analyzed as a function under the operating conditions. Next, we characterize the microscopic variables, such as the mean-squared displacement, and try to find a connection between the global performance of the mixer and the microscopic description of the medium. The aim is to predict whether a given granular material will mix well based only on known diffusive behaviors or to choose (or restrict the range of choices) the best granular material for given mixing application before having to make costly and time-consuming experiments.
2 Materials and methods
2.1 Numerical method
We perform simulations using the well-known discrete element method (DEM) (Rapaport, 2004). LIGGGHTS software (Kloss et al., 2012) is used to implement them. This is free and open-source software based on LAMMPS (Thompson et al., 2022), which incorporates many models specific to the simulation of granular materials. It is parallelized and optimized allowing to run fast simulations. The diameters of the particles are d = 12 mm for the reference case and 15 and 9 mm for the additional cases, which we also refer to as big and small particles. The diameter of the screw conveyor inside the stirrer is Ds = 128.23 mm and is fixed for all simulations. The diameter of the enclosing cylinder is variable. We used D = 20, 18, 17, and 16 cm for d = 12 mm, D = 28, 24, 20, and 18 cm for d = 15 mm, and D = 22, 20, 18, and 16 cm for d = 9 mm. To rationalize all these measures, we define the adimensional gap λ = (D − Ds)/2d, which gives the number of particles that fit between the border of the screw conveyor and the wall of the cylinder. The length of the cylinder is Lc = 55 cm and is fixed for all simulations. The horizontal coordinates are X and Z, while Y is the vertical coordinate.
We consider only contact forces. Given the size of the particles and the material (SiC), we do not expect that attractive forces develop. Two particles are in contact whenever their distance is less than the sum of their radii rij < 0.5 (di + dj). The contact model consists of two forces, one normal to the surfaces in contact, i.e., along the line that joins the centers of the particles, and a tangential force perpendicular to the first, which are given by
In the first equation, the spring force is proportional to the overlap
The mixed variables are defined as follows:
For this research, all particles in a given simulation are identical, with radii as mentioned previously. The other parameters have values Y = 5 × 10⁸ Pa, ν = 0.2, e = 0.9, and μ = 0.5, and the mass is fixed by setting the density ρ = 3600 kg/m3. These are typical magnitudes given by the manufacturers (Kyocera, 2023; Qualitymaterial, 2023). The value of gravity is set to g = 9.8 m/s2, and the integration time step is δt = 10–6 s. We have checked that this set of values gives rise to a realistic granular behavior; e.g., in Figure 2A, the average overlap between spheres is well below 1%, and increasing the Young’s modulus does not make a difference.
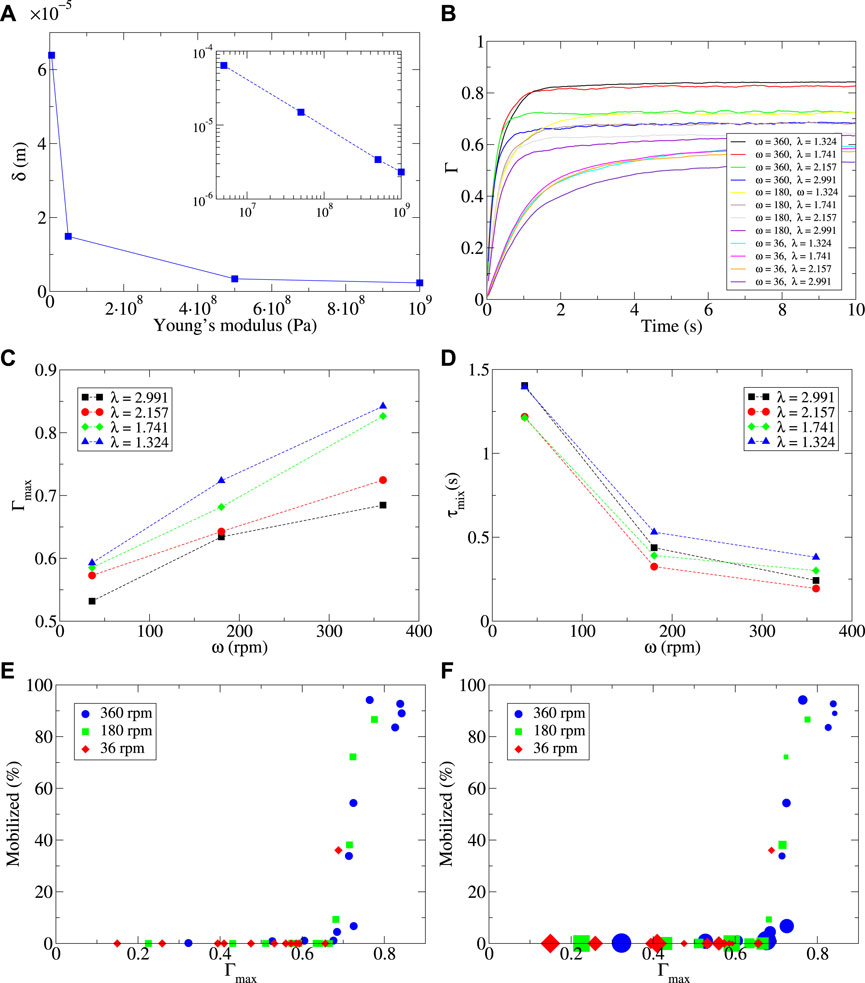
FIGURE 2. (A) Average overlap vs Young’s modulus. (B) Mixing index as a function of time (d = 12 mm). (C) Maximum mixing index as a function of the frequency of the screw conveyor (d = 12 mm). The dotted lines are only guides to the eye. (D) Mixing time as a function of the frequency of the screw conveyor (d = 12 mm). The dotted lines are only guides to the eye. (E) Mobilized particles as a function of the maximum mixing index (for all d values). (F) Mobilized particles as a function of the maximum mixing degree. The size of the symbols is proportional to λ (for all d values).
The collision of a particle with a wall is treated in the same way as particle–particle collisions, but assuming that the second particle has infinite mass and radius (flat wall limit). The properties of the second particle are identical to the particles of the granular medium.
2.2 Simulation protocol
A simulation starts with an empty stirrer which is filled by a rain of particles released from the top. The number of particles is fixed for design reasons to 2,060. During this phase, the screw conveyor is not moving. When all particles have been released, they are allowed to settle until their kinetic energy drops to
During a simulation, we store frames of the particles’ positions, velocities, forces, and other parameters at intervals of 0.2 and, sometimes, 0.1 s. These are later used for analysis.
3 Results
3.1 Macroscopic measures
The first result we focus on is the mixing index. As mentioned in Introduction, this adimensional quantity takes values between 0 (segregated state) and 1 (mixed state). Among the several definitions available in the literature, for this work, we choose the index proposed in Siiriä and Yliruusi (2009). This index is defined as follows:
Here, rij is the distance between particles i and j at time t = 0 and rt,ij is the distance at time t. The parameter R is a dimensionless quantity which can be chosen between 0 and 1. According to the results in Siiriä and Yliruusi (2009), we set it to R = 0.87. The quantity g is a scaling factor of dimensions length−1. We set its value to g = 1/Lc. As shown in Figure 2B, we see that this definition with these parameters allows distinguishing between the different scenarios during the run by changing the frequency of the screw conveyor and the parameter λ.
The mixing index starts at zero, as defined by Eqs 12, 13, and increases relatively fast up to a stationary value that remains fixed after a few seconds. The stationary value is higher for higher frequencies and exhibits lower values of λ. Not only the maximum Γ but the increasing speed also depends on the frequency and, to a lesser degree, on λ, with analogous trends. In Figures 2C, D, we can see this more clearly. The maximum Γmax increases approximately linearly with the frequency and λ. The mixing time τmix is calculated by fitting the data to the following equation:
As a function of the frequency, the mixing time decreases as the former increases. The decrease is not linear, being much faster for lower frequencies than for larger frequencies. Regarding λ, the mixing time does not change monotonously, and we observe that the curves in Figure 2D cross at some points.
An visual inspection of videos of the mixing process reveals two facts that explain those results. For the lowest frequency, the screw conveyor is not able to lift the spheres to a significant height. In this case, the bed remains rather dense and close to the bottom. When the frequency is increased, the particles acquire enough energy to climb up the screw conveyor. At this point, λ starts to matter. For relatively high values, the spheres fall from the screw conveyor since there is a wide gap available and, again, do not attain very high altitudes. Instead when λ is small, it is more difficult for the spheres to fall before reaching the upper part, and consequently, Γ increases.
We introduce the variable height by defining mobilized spheres: a sphere which reaches a height greater than 1/2Lc at some instant during the mixing process. In Figure 2E, we plot the percentage of mobilized spheres as a function of the maximum mixing index. It is worth noting that the values of Γmax = 0.7 can be reached with a small percent of mobilized particles. This means that most particles remain in the lower part of the stirrer, so the mixing is not actually effective as the beads do not increase and are exposed to the source of heat (not within the scope of this study). Most of these cases correspond to the lowest frequency, but cases with the highest frequency are also observed.
We can clarify the previous figure by adding the variable λ to the plot. As shown in Figure 2F, the size of the symbols is proportional to the adimensional gap λ. We can now observe that the low values of mixing index and mobilization are mostly associated with the large values of λ. The steep increase in mobilization at approximately Γmax = 0.7 corresponds to scenarios with low values of the adimensional gap. As mentioned previously, this is due to the fact that spheres fall easily if there is space available. So, in order to have a good mixing, we need a stirrer with high frequency and small gap, slightly above 1.
3.2 Microscopic variables
After studying the macroscopic measures that describe the mixing behavior, we turn to microscopic quantities that characterize the mobility of the spheres. In Figure 3A, we plot the mean-squared displacement of the spheres as a function of time for each coordinate and for the total displacement. We first note that in all cases, the displacement is superdiffusive, i.e., is a power law with an exponent larger than 1. Comparing with the reference line given, we note that it is actually larger than 1.5. This is not surprising since we are giving energy to the spheres. Before one second has elapsed, the MSD turns almost flat, which corresponds to the approaching of the maximum mixing index.
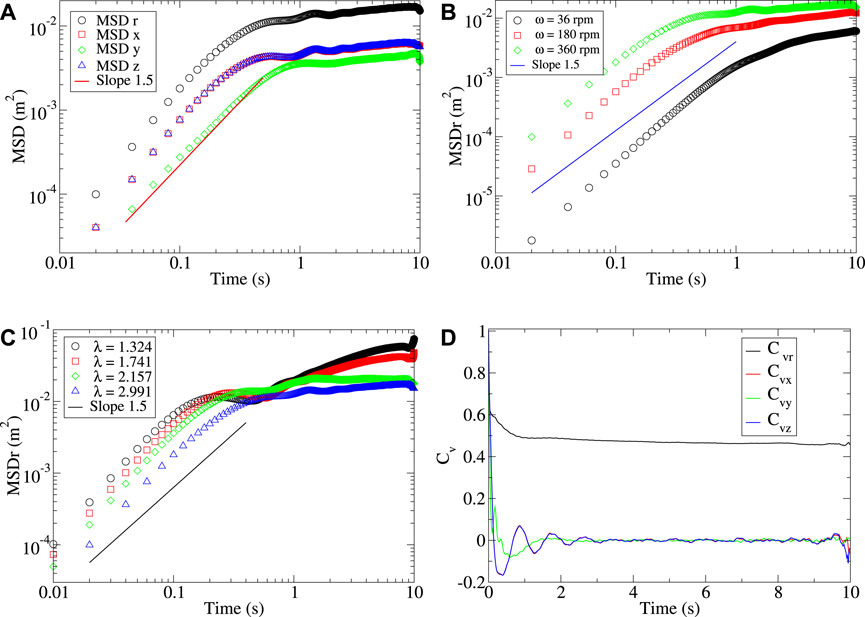
FIGURE 3. (A) Mean-squared displacements for the case d = 12 mm and D = 10 cm, ω = 360 rpm. (B) Total mean-squared displacements as a function of frequency for the case d = 12 mm and D = 10 cm. (C) Total mean-squared displacements as a function of λ for the case d = 12 mm and D = 10 cm. (D) Velocity autocorrelation function for the case d = 12 mm and D = 10 cm, ω = 360 rpm.
The magnitude of the total MSD increases with frequency, as shown in Figure 3B. As more energy is injected in the system, the spheres become more mobile. Note that the power law for the total MSD seems larger than 1.5. In addition to the quantitative differences, the qualitative behavior of this measure is quite similar in the three cases.
Plotted as a function of λ, as shown in Figure 3C, the total MSD increases in magnitude as the former decreases. This is consistent with the discussion in section 3.1. Since particles tend to fall from the screw conveyor in systems with large λ, the total displacement does not reach large values. So in this case, we see that a microscopic measure of the behavior of the medium seems correlated with the macroscopic behavior.
Finally, we show the velocity correlation function in Figure 3D. The velocities in each component decorrelate very fast, reaching Cv = 0 in split seconds. Afterward, the horizontal components alternate weak correlations and anticorrelations until
To obtain more insights into these results, we fit the first part of the total mean-squared displacement (MSDr) to the following expression:
The value of the exponent, as shown in Figure 4A, Figures 4C, E, follows a descending trend with λ. The trend is noisy in some cases, but one can see that it is roughly linear for intermediate and large values of the adimensional gap. Instead, for values close to λ = 1, the trend flattens as it approaches an exponent equal to 2. The descending trend is understandable in terms of the role of λ discussed in previous sections. When λ decreases, the trend flattens as the exponent tends to the limiting value 2, which would indicate a ballistic regime. Large values of λ correspond to particles falling early from the screw conveyor, and these trajectories are very short and have a low weight in the computation of the MSD. This is the reason why we do not see a large value of a for low λ. Only the trajectories of spheres falling from a high altitude have an important enough weight to increase the exponent to near-ballistic values.
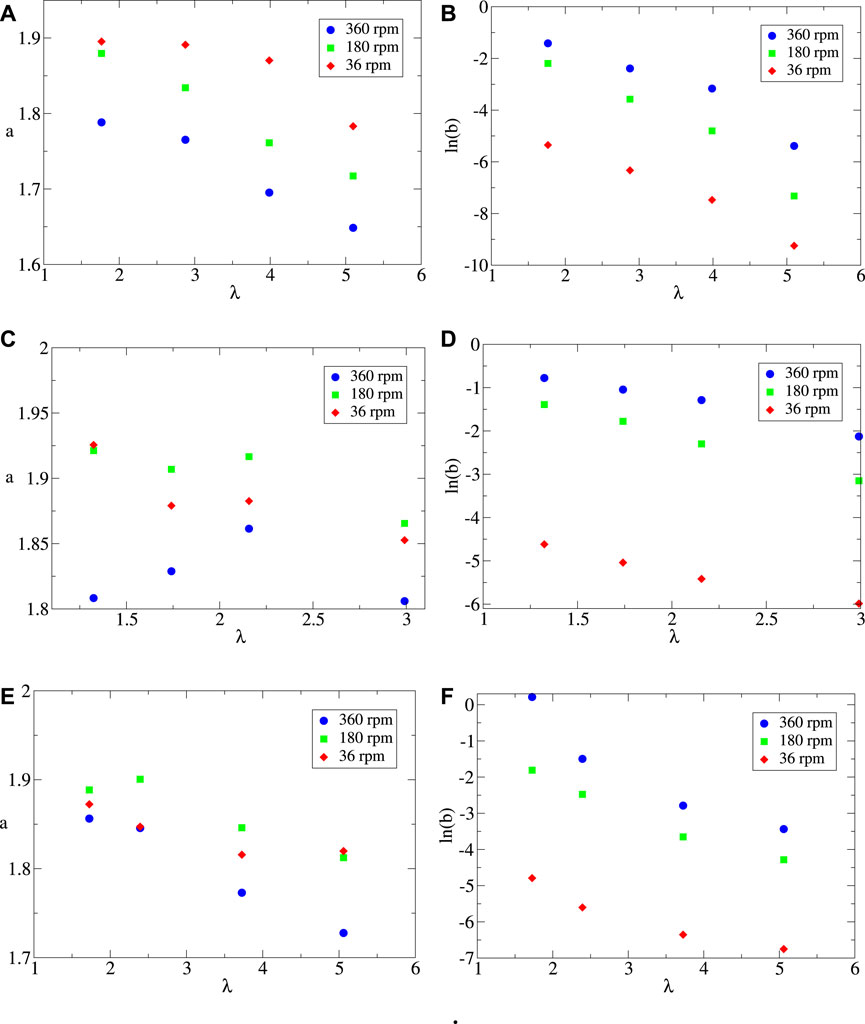
FIGURE 4. (A) Exponent of MSDr for d = 9 mm. (B) Prefactor of MSDr for d = 9 mm. (C) Exponent of MSDr for d = 12 mm. (D) Prefactor of MSDr for d = 12 mm. (E) Exponent of MSDr for d = 15 mm. (F) Prefactor of MSDr for d = 15 mm.
The natural logarithm of the prefactor is shown in Figures 4B, D, F. The linear trend indicates that b decays exponentially with λ. As could have been anticipated, the prefactor increases with the frequency of the screw conveyor. For all large values of λ obtained for d = 9 mm, there seems to be a flattening of the trend. This can be compared with Figure 2C, where the second part of the curve becomes more horizontal as the value of λ increases.
3.3 Correlation between micro- and macroscopic variables
Finally, we would like to know whether there exists some simple correlation between the macroscopic and microscopic variables studied. There are many possible combinations. In Figure 5A, we plot the maximum mixing index as a function of the natural logarithm of the prefactor of the total MSD for all scenarios. This relationship is linear, with some dispersion, indicating that the mixing increases with the logarithm of the mean-squared displacement, since we have seen that the prefactor sets the magnitude of the MSD. A relationship between Γmax and b should exist that could have been anticipated intuitively, but the precise nature of the relationship is not obvious.
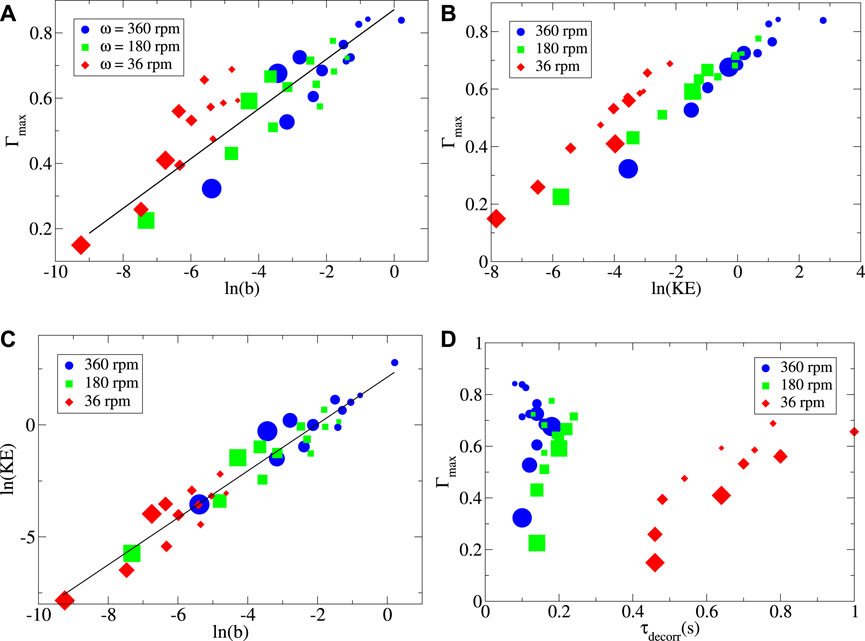
FIGURE 5. (A) Maximum mixing index vs the prefactor of the total MSD for all d values. (B) Maximum mixing index vs the logarithm of the total kinetic energy for all d values. (C) Logarithm of the total kinetic energy vs the logarithm of the prefactor of the total MSD for all d values. (D) Maximum mixing index vs the decorrelation time for all d values. In all plots, the size of the symbols is proportional to λ.
The results shown in previous sections and intuition suggest that there should be a relationship between the maximum mixing index and the kinetic energy imparted to the spheres by the screw conveyor. In Figure 5B, we observe that Γmax increases linearly with the natural logarithm of the total kinetic energy. Hence, the relationship shown in Figure 5C indicates that the total kinetic energy and the mean-squared displacement are proportional (the plot is clearer on a logarithmic scale). The kinetic energy is measured in the steady state when the mixing index attains its maximum value. In this state, the total kinetic energy of the spheres has a well-defined average with small fluctuations.
In Figure 5D, we plot the maximum mixing index as a function of the decorrelation time τdecorr. The latter is defined from the velocity autocorrelation function for the X component, as the time needed for this function to reach the zero value for the first time
For the lowest frequency, we find a wide range of values of τdecorr, ranging from 0.45 to 1 s. For this frequency, the mixing degree increases with the decorrelation time, following a saturating curve. As in the case of the large frequencies, there is no systematic dependence on λ since we can find small and large symbols in very different values of the decorrelation time. From Figure 5D, one can infer that τdecorr depends on the frequency of the screw conveyor, strongly for low frequencies and very weakly for the larger frequencies. However, more data for intermediate frequencies would be needed to clarify the relationship between both quantities.
Finally, let us mention that plots of τdecorr versus frequency or even λ (not shown) show the same vertical organization. So in this case, we can conclude that τdecorr is not a useful variable to distinguish the different cases and discriminate the best scenario for optimizing mixing.
4 Summary and discussion
We have presented simulations to characterize and optimize the design and operation of a stirrer whose purpose is to mix a bed of identical granular spheres. We have first studied some macroscopic measures, such as the mixing index. We conclude that the mixing is improved by increasing the frequency of the screw conveyor and decreasing the adimensional gap λ. The first gives more energy to the spheres to move upward the screw conveyor, while the second prevents the spheres to fall by the side of the screw conveyor before reaching a high altitude. We have shown that the mixing index offers limited information though. Effectively, by defining what we have called mobilized spheres (those who reach above half the height of the stirrer), we show that high values of the mixing are compatible with a small mobilization. Thus, it is necessary to consider several measures to characterize mixing and attain a good design.
Next, we have studied some microscopic measures that characterize the movement of particles. The mean-squared displacement is superdiffusive in all cases due to the constant supply of energy. It behaves as a power law during the time in which the mixing index increases and afterward flattens. The value of the exponent changes linearly with the frequency of the screw conveyor and linearly with λ. In this case, the exponent tends to 2 as λ reaches 1; this case represents the limiting case in which the spheres reach a high altitude in the stirrer. The prefactor of the power law is similarly correlated with the frequency of the screw conveyor and λ. In the latter case, we observe a flattening of the curves for large λ which corresponds to the flattening of the MSD at large times.
Finally, we have seen that it is possible to find correlations between the microscopic and macroscopic measures. In particular, we find that the maximum mixing index increases with the logarithm of the prefactor of the mean-squared displacement. This type of relationship can be used to design or operate apparatuses to handle media whose microscopic properties are known. Although some correlation might be expected based on physical reasoning, the precise form it takes can be far from obvious. In that case, simulations can be critical, especially when dealing with dense granular media for which a general theory is still lacking.
The open question of whether these relationships can be fruitfully used in industrial design remains unanswered. More research is required to assess the degree of generalization to different systems or to define frameworks that can lead from microscopic properties to design guidelines.
Data availability statement
The original contributions presented in the study are included in the article/Supplementary Material; further inquiries can be directed to the corresponding author.
Author contributions
RA: conceptualization, data curation, formal analysis, investigation, methodology, supervision, visualization, writing–original draft, and writing–review and editing.
Funding
The author(s) declare that financial support was received for the research, authorship, and/or publication of this article. This work received funding from the Horizon Europe project PLASTICE (Grant Agreement ID: 101058540).
Acknowledgments
The author thanks his colleagues Carlos González and Ignacio Julián for helpful discussions concerning this work.
Conflict of interest
The author declares that the research was conducted in the absence of any commercial or financial relationships that could be construed as a potential conflict of interest.
Publisher’s note
All claims expressed in this article are solely those of the authors and do not necessarily represent those of their affiliated organizations, or those of the publisher, the editors, and the reviewers. Any product that may be evaluated in this article, or claim that may be made by its manufacturer, is not guaranteed or endorsed by the publisher.
References
Aoki, K. M., and Akiyama, T. (1996). Spontaneous wave pattern formation in vibrated granular materials. Phys. Rev. Lett. 77, 4166–4169. doi:10.1103/physrevlett.77.4166
Aoki, K. M., and Akiyama, T. (1998). Control parameter in granular convection. Phys. Rev. E 58, 4629–4637. doi:10.1103/physreve.58.4629
Artoni, R., Larcher, M., Jenkins, J. T., and Richard, P. (2021). Self-diffusion scalings in dense granular flows. Soft Matter 17, 2596–2602. doi:10.1039/d0sm01846e
Artoni, R., Larcher, M., Jenkins, J. T., and Richard, P. (2022). Self-diffusion in inhomogeneous granular shearing flows. Phys. Rev. E 106, L032901. doi:10.1103/physreve.106.l032901
Bai, L., Zheng, Q., and Yu, A. (2017). FEM simulation of particle flow and convective mixing in a cylindrical bladed mixer. Powder Technol. 313, 175–183. doi:10.1016/j.powtec.2017.03.018
Barker, G. C., and Mehta, A. (1993). Transient phenomena, self-diffusion, and orientational effects in vibrated powders. Phys. Rev. E 47, 184–188. doi:10.1103/physreve.47.184
Basinskas, G., and Sakai, M. (2016). Numerical study of the mixing efficiency of a batch mixer using the discrete element method. Powder Technol. 301, 815–829. doi:10.1016/j.powtec.2016.07.017
Bourne, J. R. (1964). The mixing of powders, pastes and non-Newtonian fiuid. Trans. Inst. Chem. Eng. 181, CE202.
Breu, A. P. J., Ensner, H.-M., Kruelle, C. A., and Rehberg, I. (2003). Reversing the Brazil-nut effect: competition between percolation and condensation. Phys. Rev. Lett. 90, 014302. doi:10.1103/physrevlett.90.014302
Bridgewater, J. (1976). Fundamental powder mixing mechanisms. Powder Technol. 15, 225–236. doi:10.1016/0032-5910(76)80051-4
Cahn, D. S., and Fuerstenau, D. W. (1969). A probabilistic model of the diffusional mixing of particulate solids. Powder Technol. 2, 215–222. doi:10.1016/0032-5910(69)80015-x
Cahn, D. S., Fuerstenau, D. W., Healy, T. W., Hogg, R., and Rose, H. E. (1966). Diffusional mechanism of solid–solid mixing. Nature 209, 494–496. doi:10.1038/209494a0
Campbell, C. S. (1997). Self-diffusion in granular shear flows. J. Fluid Mech. 348, 85–101. doi:10.1017/s0022112097006496
Chandratilleke, G. R., Dong, K. J., and Shen, Y. S. (2018). DEM study of the effect of blade-support spokes on mixing performance in a ribbon mixer. Powder Technol. 326, 123–136. doi:10.1016/j.powtec.2017.12.055
Ciamarra, M. P., De Vizia, M. D., Fierro, A., Tarzia, M., Coniglio, A., and Nicodemi, M. (2006). Granular species segregation under vertical tapping: effects of size, density, friction, and shaking amplitude. Phys. Rev. Lett. 96, 058001. doi:10.1103/physrevlett.96.058001
Côté, P., and Abatzoglou, N. (2006). Powder and other divided solids mixing. scale-up and parametric study of a ribbon blender used in pharmaceutical powders mixing. Pharm. Dev. Technol. 11, 29–45. doi:10.1080/10837450500463778
Dippel, S., and Luding, S. (1995). Simulation on size segregation: geometrical effects in the absence of convection. J. Phys. I Fr. 5, 1527–1537. doi:10.1051/jp1:1995215
Duran, J., Rajchenbach, J., and Clément, E. E. (1993). Arching effect model for particle size segregation. Phys. Rev. Lett. 70, 2431–2434. doi:10.1103/physrevlett.70.2431
Fiedor, S. J., and Ottino, J. M. (2003). Dynamics of axial segregation and coarsening of dry granular materials and slurries in circular and square tubes. Phys. Rev. Lett. 91, 244301. doi:10.1103/physrevlett.91.244301
Gajjar, P., Johnson, C. G., Carr, J., Chrispeels, K., Gray, J. M. N. T., and Withers, P. J. (2021). Size segregation of irregular granular materials captured by time-resolved 3d imaging. Sci. Rep. 11, 8352. doi:10.1038/s41598-021-87280-1
Gao, W., Liu, L., Liao, Z., Chen, S., Zang, M., and Tan, Y. (2019). Discrete element analysis of the particle mixing performance in a ribbon mixer with a double u - shaped vessel. Granul. Matter 21, 12–16. doi:10.1007/s10035-018-0864-4
García-Chamorro, M., Gómez-González, R., and Garzó, V. (2022). Kinetic theory of polydisperse granular mixtures: influence of the partial temperatures on transport properties. Entropy 24, 1–40. doi:10.3390/e24060826
Gillemot, K. A., Somfai, E., and Börzsönyi, T. (2017). Shear-driven segregation of dry granular materials with different friction coefficients. Soft Matter 13 (2), 415–420. doi:10.1039/C6SM01946C
Halidan, M., Chandratilleke, G. R., Dong, K. J., and Yu, A. B. (2018). Mixing performance of ribbon mixers: effects of operational parameters. Powder Technol. 325, 92–106. doi:10.1016/j.powtec.2017.11.009
Hersey, J. A. (1975). Ordered mixing: a new concept in powder mixing practice. Powder Technol. 11, 41–44. doi:10.1016/0032-5910(75)80021-0
Hill, K. M., and Kakalios, J. (1995). Reversible axial segregation of rotating granular media. Phys. Rev. E 52, 4393–4400. doi:10.1103/physreve.52.4393
Huerta, D. A., and Ruiz-Suárez, J. C. (2004). Vibration-induced granular segregation: a phenomenon driven by three mechanisms. Phys. Rev. Lett. 92, 114301. doi:10.1103/physrevlett.92.114301
Jaklič, M., Kočevar, S., Srčič, K., and Dreu, R. (2015). Particle size-based segregation of pharmaceutical powders in a vertical chute with a closed bottom: an experimental evaluation. Powder Technol. 278, 171–180. doi:10.1016/j.powtec.2015.03.021
Jin, X., Chandratilleke, G. R., Wang, S., and Shen, Y. (2022). DEM investigation of mixing indices in a ribbon mixer. Particuology 60, 37–47. doi:10.1016/j.partic.2021.03.005
Jing, L., Ottino, J. M., Lueptow, R. M., and Umbanhowar, P. B. (2020). Rising and sinking intruders in dense granular flows. Phys. Rev. Res. 2, 022069. (R). doi:10.1103/physrevresearch.2.022069
Julián, I., Herguido, J., and Menéndez, M. (2016). Experimental and simulated solids mixing and bubbling behavior in a scaled two-section two-zone fluidized bedreactor. Chem. Eng. Sci. 143, 240–255. doi:10.1016/j.ces.2015.12.025
Kloss, C., Goniva, C., Hager, A., Amberger, S., and Pirker, S. (2012). Models, algorithms and validation for opensource DEM and CFD-DEM. Prog. Comput. Fluid Dyn. Int. J. 12, 140–152. doi:10.1504/pcfd.2012.047457
Knight, J. B., Jaeger, H. M., and Nagel, S. R. (1993). Vibration-induced size separation in granular media: the convection connection. Phys. Rev. Lett. 70, 3728–3731. doi:10.1103/physrevlett.70.3728
Kyocera (2023). Silcon carbide technical data. Available at: https://global.kyocera.com/prdct/fc/list/material/silicon_carbide/silicon_carbide.html.
Lacey, P. M. C. (1954). Developments in the theory of particle mixing. J. Appl. Chem. 4, 257–268. doi:10.1002/jctb.5010040504
Levanon, M., and Rapaport, D. C. (2001). Stratified horizontal flow in vertically vibrated granular layers. Phys. Rev. E 64, 011304. doi:10.1103/physreve.64.011304
Liffman, K., Muniandy, K., Rhodes, M., Gutteridge, D., and Metcalfe, G. (2001). A segregation mechanism in a vertically shaken bed. Granul. Matter 3, 205–214. doi:10.1007/s100350100093
Meier, S. W., Lueptow, R. M., and Ottino, J. M. (2007). A dynamical systems approach to mixing and segregation of granular materials in tumblers. Adv. Phys. 56, 757–827. doi:10.1080/00018730701611677
Nahmad-Molinari, Y., Canul-Chay, G., and Ruiz-Suárez, J. (2003). Inertia in the Brazil nut problem. Phys. Rev. E 68, 041301. doi:10.1103/physreve.68.041301
Naji, L., and Stannarius, R. (2009). Axial and radial segregation of granular mixtures in a rotating spherical container. Phys. Rev. E 79, 031307. doi:10.1103/physreve.79.031307
Nguyen, D., Rasmuson, A., Björn, I. N., and Thalberg, K. (2014). CFD simulation of transient particle mixing in a high shear mixer. Powder Technol. 258, 324–330. doi:10.1016/j.powtec.2014.03.041
Oyama, Y. (1940). Studies on mixing of solids. mixing of binary system of two sizes by ball mill motion. Sci. Pap. Inst. Phys. Chem. Res. 37, 17.
Pinzón-Moreno, D. D., Ribeiro, S., and Saron, C. (2020). Aggregates segregation in rubberized mortar. Structures 26, 778–784. doi:10.1016/j.istruc.2020.05.009
Poux, M., Fayolle, P., Bertrand, J., Bridoux, D., and Bousquet, J. (1991). Powder mixing: some practical rules applied to agitated systems. Powder Technol. 68, 213–234. doi:10.1016/0032-5910(91)80047-m
Prigozhin, L., and Kalman, H. (1998). Radial mixing and segregation of a binary mixture in a rotating drum: model and experiment. Phys. Rev. E 57, 2073–2080. doi:10.1103/physreve.57.2073
Qualitymaterial (2023). Porperties of silicon carbide. Available at: https://www.qualitymaterial.net/news_list85.html.
Rapaport, D. C. (2001). Mechanism for granular segregation. Phys. Rev. E 64, 061304. doi:10.1103/physreve.64.061304
Rapaport, D. C. (2002). Simulational studies of axial granular segregation in a rotating cylinder. Phys. Rev. E 65, 061306. doi:10.1103/physreve.65.061306
Rietz, F., and Stannarius, R. (2012). Oscillations, cessations, and circulation reversals of granular convection in a densely filled rotating container. Phys. Rev. Lett. 108, 118001. doi:10.1103/physrevlett.108.118001
Rosato, A., Strandburg, K., Prinz, F., and Swendsen, R. (1987). Why the Brazil nuts are on top. Phys. Rev. Lett. 58, 1038–1041. doi:10.1103/PhysRevLett.58.1038
Savage, S. B., and Dai, R. (1993). Studies of granular shear flows Wall slip velocities, ‘layering’ and self-diffusion. Mech. Mater. 16, 225–238. doi:10.1016/0167-6636(93)90047-u
Schofield, C. (1976). The definition and assessment of mixture quality in mixtures of particulate solids. Powder Technol. 15, 169–180. doi:10.1016/0032-5910(76)80045-9
Siiriä, S., and Yliruusi, J. (2009). Determining a value for mixing: mixing degree. Powder Technol. 196, 309–317. doi:10.1016/j.powtec.2009.08.009
Simons, T., Combarros-García, M., Gupta, P., Tüzün, U., Zigan, S., Sun, J., et al. (2013). “Segregation and mixing of granular material in industrial processes,” in III International Conference on Particle-Based Methods — Fundamentals and Applications (PARTICLES 2013), Stuttgart, 18-20 September, 2013, 1.
Simons, T. A. H., Bensmann, S., Zigan, S., Feise, H. J., Zetzener, H., and Kwade, A. (2016). Characterization of granular mixing in a helical ribbon blade blender. Powder Technol. 293, 15–25. doi:10.1016/j.powtec.2015.11.041
Stewart, R. L., Bridgwater, J., Zhou, Y. C., and Yu, A. B. (2001). Simulated and measured flow of granules in a bladed mixer—a detailed comparison. Chem. Eng. Sci. 56, 5457–5471. doi:10.1016/s0009-2509(01)00190-7
Thompson, A. P., Aktulga, H. M., Berger, R., Bolintineanu, D. S., Brown, W. M., Crozier, P. S., et al. (2022). Lammps - a flexible simulation tool for particle-based materials modeling at the atomic, meso, and continuum scales. Comput. Phys. Commun. 271, 108171. doi:10.1016/j.cpc.2021.108171
Tsugeno, Y., Sakai, S., Yamazaki, M., and Nishinomiya, T. (2021). DEM simulation for optimal design of powder mixing in a ribbon mixer. Adv. Powder Technol. 32, 1735–1749. doi:10.1016/j.apt.2021.03.026
Utter, B., and Behringer, R. P. (2004). Self-diffusion in dense granular shear flows. Phys. Rev. E 69, 031308. doi:10.1103/physreve.69.031308
Weidenbaum, S. S. (1958). Mixing of solids. Adv. Chem. Eng. 2, 209. doi:10.1016/S0065-2377(08)60229-X
Wildman, R. D., Huntley, J. M., and Hansen, J. P. (1999). Self-diffusion of grains in a two-dimensional vibrofluidized bed. Phys. Rev. E 60, 7066–7075. doi:10.1103/physreve.60.7066
Yang, S.-C., and Hsiau, S.-S. (2001). Self-diffusion analysis in a vibrated granular bed. Adv. Powder Technol. 12, 61–77. doi:10.1163/156855201744967
Zik, O., and Stavans, J. (1991). Self-diffusion in granular flows. Europhys. Lett. 6, 255–258. doi:10.1209/0295-5075/16/3/006
Keywords: mixing, identical particles, simulation, microscopic variables, macroscopic measures
Citation: Arévalo R (2023) Connecting micro- and macroscopic variables in the design of a granular stirrer using simulations. Front. Soft Matter 3:1302367. doi: 10.3389/frsfm.2023.1302367
Received: 26 September 2023; Accepted: 09 November 2023;
Published: 27 November 2023.
Edited by:
Lou Kondic, New Jersey Institute of Technology, United StatesReviewed by:
Nagi Khalil, Rey Juan Carlos University, SpainRalf Stannarius, Otto von Guericke University Magdeburg, Germany
Copyright © 2023 Arévalo. This is an open-access article distributed under the terms of the Creative Commons Attribution License (CC BY). The use, distribution or reproduction in other forums is permitted, provided the original author(s) and the copyright owner(s) are credited and that the original publication in this journal is cited, in accordance with accepted academic practice. No use, distribution or reproduction is permitted which does not comply with these terms.
*Correspondence: Roberto Arévalo, cmFyZXZhbG9AZmNpcmNlLmVz