 Andrew T. Tyowua
 Adebukola M. Echendu
94% of researchers rate our articles as excellent or good
Learn more about the work of our research integrity team to safeguard the quality of each article we publish.
Find out more
ORIGINAL RESEARCH article
Front. Soft Matter , 22 June 2023
Sec. Foams
Volume 3 - 2023 | https://doi.org/10.3389/frsfm.2023.1163393
Honey foam has applications in the food, cosmetic, and pharmaceutical industries. For example, honey foam can be used in bread or biscuit spread (food industry), as a carrier of topical bioactive ingredients (cosmetic industry), or as a carrier of drugs (pharmaceutical industry). However, the conditions for obtaining a stable honey foam remain unclear. In this study, we investigated the influence of particle fluorination on honey foam volume and foam stability by aerating natural (unadulterated) honey with fluorinated fumed silica (50%–75% SiOH) or fluorinated sericite clay (PF-5–PF-12) particles. Higher foam volume (≤4.3 cm3) and foam stability (up to a year) were observed with the least (75% SiOH) fluorinated fumed silica particles, while lower foam volume and foam stability were observed with the moderately (59% SiOH) and most (50% SiOH) fluorinated fumed silica particles. In contrast, regardless of the degree of fluorination, the fluorinated sericite clay particles yielded little (<1 cm3) and unstable foam that collapsed completely within 4 weeks of preparation. Therefore, with respect to honey foam stabilization, fluorinated fumed silica particles are superior to fluorinated sericite clay particles. These foams can be used for topical formulation of cosmetic and pharmaceutical products, and our findings will guide future stabilization of honey foam for target applications.
Colloidal particles with suitable wettability are attached at fluid interfaces to form ultra-stable emulsions, foams (Binks and Horozov, 2006), liquid marbles, and powdered liquids (Tyowua, 2019) for various applications. With these particles, both aqueous (Binks, 2002; Hunter et al., 2008; McHale and Newton, 2011; McHale and Newton, 2015; Fameau and Saint-Jalmes, 2017; Murray, 2019) and nonaqueous (Fernandez-Rodriguez et al., 2017; Zia et al., 2020) ultra-stable emulsions, foams, liquid marbles, and powdered liquids have been prepared. Because of their stable nature, these materials have several applications in catalysis (Carter et al., 2010; Pera-Titus et al., 2015; Nguyen et al., 2020; Rodriguez and Binks, 2020; Chang et al., 2021; Zhang et al., 2022), cosmetics (Marku et al., 2012; Sharkawy et al., 2020; Guzmán et al., 2022), drug delivery (Frelichowska et al., 2009a; Frelichowska et al., 2009b; Marto et al., 2016; Tai et al., 2020), and food (Berton-Carabin and Schroën, 2015; Chen et al., 2020; Dickinson, 2020).
Colloid scientists are also studying honey foams to address the problem of added sugar and pigments in formulated food foams (Tyowua et al., 2022a; Tyowua et al., 2022b). Unlike aqueous and nonaqueous foams, which require added sugar or sweeteners and pigments, honey foam does not require added sugar or sweeteners and pigments because honey is naturally sweet and occurs in various color shades. In addition to food applications, honey foam can be used in cosmetics for topical delivery of bioactive substances that are poorly soluble in both oil and water, such as clotrimazole (Jafarzadeh et al., 2022). Additionally, honey foam can be applied topically in place of honey because foams generally spread faster than liquids (Zhao et al., 2010). Furthermore, unlike liquids, foam leaves no greasy residue when smeared onto the skin (Tang et al., 2015). However, although the conditions and types of particles suitable for preparing stable aqueous and nonaqueous foams are well known, those required to obtain stable honey foam remain unclear. Tyowua et al. (2022b) investigated the use of sodium dodecyl sulfate and calcium carbonate particles as potential foaming agents in honey. They observed that the surfactant produced more foam than the particles and that the surfactant-stabilized foam was more stable (4 months) than the particle-stabilized foam (4 weeks). In another study (Tyowua et al., 2022a), fumed silica particles (14%–100% SiOH) containing different amounts of dichlorodimethylsilane were studied with respect to honey foam stabilization. An increase in foam volume and foam stability was observed with decreasing % SiOH, particularly at higher particle concentrations (≥1 wt.%). Nonetheless, the foam was stable for a relatively short period of time (6 months). Commercially, foams with relatively longer stability (≥1 year) are needed; therefore, it is imperative to find particles that will stabilize honey foam for at least 1 year. Herein, we turned our searchlight on fumed silica and sericite clay particles coated with fluorocarbons: tridecafluoro-1,1,2,2-tetrahydrooctyltrimethoxysilane (silica) and C9—C15 perfluoroalkyl phosphate diethanolamine salt (sericite). Although foams from these particles cannot be applied in the food sector because the particles are not edible, our interest in these particles stems from previous studies in which they were used to stabilize oil foams and powdered oils, with stability of over a year, for cosmetic applications (Binks and Tyowua, 2013; Binks et al., 2014). We asked two basic questions: i) Can a substantial volume of honey foam be obtained using these particles? ii) To what extent will the foam be stable? Our experiments were geared toward answering these questions.
The fluorinated fumed silica particles were prepared by Wacker Chemie (Burghausen, Germany) from silica particles with 100% SiOH groups and a Brunauer–Emmett–Teller surface area of 200 m2 g−1. These particles were fluorinated by reacting the SiOH groups with different amounts of the fluorinating agent, tridecafluoro-1,1,2,2-tetrahydrooctyltrimethoxysilane, CF3(CF2)5(CH2)2Si(OCH3)3. The resultant fluorinated particles contained 50%–75% residual surface SiOH groups. In order to produce these particles, a mechanical stirrer was used to fluidize the precursor 100% SiOH-fumed silica particles (100 g) in a glass cylinder, followed by purging (15 min) with nitrogen. Depending on the targeted % SiOH, 10.5 g (75% SiOH), 21.0 g (59% SiOH), or 27.8 g (50% SiOH) of the fluorinating agent was added to the cylinder in the form of aerosol via a mono-component nozzle using compressed nitrogen (pressure 10 bar). The mixture was stirred (15 min) and left in an oven (2 h, 150°C), which had been purged by nitrogen. Finally, the mixture was cooled to room temperature in a blanket of nitrogen, giving rise to the fluorinated fumed silica particles. This reaction occurred through four steps (Arkles, 1977): a) hydrolysis of labile OCH3 to OH groups, b) condensation of neighboring chains of the fluorinating agent to oligomers by forming an Si-O-Si backbone with either side containing alkyl and ‒OH groups, and (c, d) formation of hydrogen bonds between the oligomers (via OH groups) and SiOH of silica particles, which dry to form covalent bonds (R–Si–O–Si) (Supplementary Figure S1). The preferential reaction between fluoroalkylsilanol groups leaves unreacted SiOH groups on the surfaces of the particles. The precursor 100% SiOH fumed silica particles were reacted with a sufficient amount of dichlorodimethylsilane instead of the fluorinating agent to obtain hydrocarbon-coated 14% SiOH fumed silica particles. This replaces surface SiOH groups with Si-O-Si-(CH3)2 (Supplementary Figure S1).
The fluorinated sericite clay particles were prepared by Daito Kasei Kogyo Company Ltd., Japan, by reacting raw sericite (hydrophilic) clay particles with varying amounts of C9—C15 perfluoroalkyl phosphate diethanolamine salt. The reaction afforded PF-5‒PF-12 fluorinated sericite clay particles. Raw sericite is a whitish powdered mica mineral made up of a three-layered monoclinic unit cell, containing an Al2O3 octahedron and two SiO2 tetrahedrons, linked by potassium ionic bonds (Perng et al., 2008). As a result, raw sericite contains ∼ 54% SiO2, ∼31% Al2O3, and ∼7% K2O as major constituents (Arkles, 1977). To facilitate the reaction between the anion of the salt and the surfaces of the raw particles, a suspension of raw sericite was prepared using an aqueous solution containing NaAlO2 and H2SO4. This led to the formation of positive charges and deposition of Al(OH)3 crystals on the surfaces of the particles, both of which facilitated chemical modification. Depending on the alkalinity, the chemical modification process can involve the formation of metal salts and/or hydrogen bonds from the reaction of perfluoroalkyl phosphoric acid with sericite particle surfaces (Supplementary Figure S2). Fluorinated sericite clay particles are used in the cosmetic industry to prepare long-lasting makeup that promotes a natural and healthy appearance by withstanding sebum and perspiration.
A natural honey sample was obtained from a beekeeper in Kaduna State, Northern Nigeria, and used as received. The honey sample was characterized in terms of density, refractive index (RI), °Brix, viscosity, pH, conductivity, surface tension, moisture content, and ash content to determine its authenticity.
The morphological characteristics of the particles were investigated by scanning electron microscopy. A scanning electron microscope (Zeiss EVO 60 SEM) stub was coated with a self-adhesive and dipped into a loose bed of particles on an aluminum foil. The adhesive held the particles to the stub. Loosely held particles were removed by blowing low-pressure compressed air over the stub, whereas tightly held particles, remaining on the stub, were coated with a thin gold film (∼2 nm). The gold-coated particles were viewed under vacuum (beam voltage of 20 kV and probe current of 100 pA) using the scanning electron microscope. Images of the particles (Figure 1) from the scanning electron microscope were analyzed using ImageJ software by measuring the length of 250 random particle aggregates and particle grains. Our measurements showed that irrespective of the degree of fluorocarbon or hydrocarbon coating, the fumed silica particles are composed of amorphous aggregates (length ≤25 μm) made up of fused quasi-spherical particle grains (diameter ≤125 nm). This is in contrast to the data supplied by the manufacturer: individual particle grains ≤50 nm, particle aggregates ≤500 nm, and particle agglomerates >> 1 μm. Comparatively, the sericite clay particles were platelets (∼2 μm), discrete, and textured (∼200 nm).
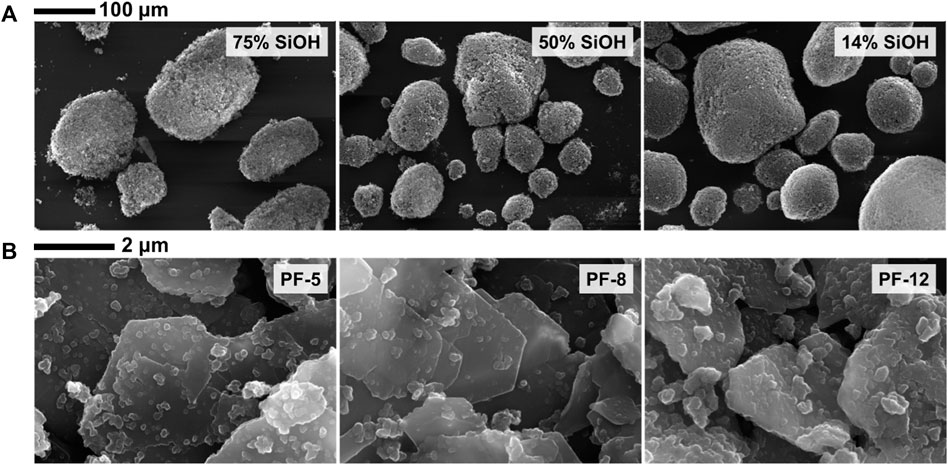
FIGURE 1. Scanning electron microscope images of fumed silica particles for 75% SiOH and 50% SiOH fluorocarbon-coated particles and 14% SiOH hydrocarbon-coated particles (A) and fluorocarbon-coated sericite clay particles [PF-5–PF-12, (B)]. The fumed silica particles exist as aggregates, irrespective of the degree of fluorocarbon or hydrocarbon coating. Contrarily, irrespective of the degree of fluorocarbon coating, the sericite clay particles exist as discrete individual platelet particle grains.
The honey sample (50 cm3) was filled into a 50-cm3 pycnometer bottle of known mass (M1) and weighed (M2). The difference between M2 and M1 was calculated and divided by 50 cm3 to obtain the density ρ of the honey sample as follows (Oroian, 2013):
This was repeated three times, and ρ was reported as the average ± standard deviation.
The RI of the honey sample was measured using an Abbe refractometer (60/DR). A small amount of honey (∼10 μL) was placed on the glass prism and illuminated with light. RI values were read at the point where the boundaries of the color fringe aligned with the center of the cross wires using the prism knob to adjust the illumination. Three measurements were performed and reported as the average ± standard deviation. The °Brix values were estimated using the IR values as follows (González-Méijome et al., 2007):
The viscosity of the honey sample was measured with a viscometer (DV-II+Pro, Brookfield, United Kingdom) using spindle LV4 (S64). The honey sample (400 cm3) was placed in a Pyrex glass beaker. The temperature probe was attached to the viscometer and inserted into the honey sample, and viscosity values were obtained at a spindle speed of 50 rpm. Three separate viscosity values were obtained and reported as the average ± standard deviation.
Three Pyrex glass crucibles were filled with 2 g of honey, weighed (W1), and heated (105°C) to a constant weight (W2) in an oven (MINO/30, Genlab, United Kingdom) (Vanhanen et al., 2011). The % moisture in each sample was estimated as follows and reported as the average ± standard deviation:
The honey sample (3.75–22.50 g) was weighed into 100-cm3 Pyrex glass beakers containing 100 g of ultrapure water (pH ∼ 6.8, resistivity ∼ 18 × 109 Ω cm) and stirred (500 rpm) using a magnetic stirrer for homogeneity. After calibrating the pH meter (Hydrus 400, Fisherbrand, United Kingdom) with standard buffers (pH 4.0, 7.0) and a conductivity meter (EC215, Hanna, United Kingdom) with an aqueous KCl solution (10 mM), the pH and conductivity values of the aqueous honey solutions were measured. Values were measured in triplicate and reported as the average ± standard deviation.
The honey sample (2 g) was weighed into three porcelain crucibles and charred in a muffle furnace (600°C), with intermittent cooling (30°C), and weighed to a constant weight (W). The % ash with respect to each crucible was calculated as follows, and the average was reported with the standard deviation:
The honey sample was drawn into a plastic syringe and forced out through a thin stainless-steel needle (inner diameter ∼0.8 mm). This resulted in a pendant drop of honey at the tip of the needle. Photographs of the suspended honey drops were obtained in air (30°C ± 2°C) using a high-definition digital camera (4.3 V Power Shot SX220 HS, Canon, Japan). The photographs were subsequently edited using the GNU image manipulation program (open-source software, version 2.10.30), as shown in Supplementary Figure S3. Profiles of the edited images were used for surface tension estimation using the method described by Hutzler et al. (2018). This procedure was repeated with 10 separate honey drops, and the results are reported as the average surface tension ± standard deviation.
The honey sample (5 g) was placed into different screw-cap plastic vials (inner diameter ∼ 1.5 cm and height ∼ 5.5 cm), followed by carefully placing the particles (50 mg) on top of the honey. In accordance with Tyowua and Binks (2020), the plastic vials were tightly closed, and it was observed whether or not the particles were wetted and immersed in honey. All the particle types remained on the honey sample for more than 24 h because they were not wetted or they were pinned to the honey surface due to their rough surfaces (Zanini et al., 2018). Subsequently, the honey–particle mixtures were aerated (13,000 rpm, 3 min) using a rotor-stator homogenizer (Ultra-Turrax T25, IKA-Werke, Germany) with a stainless-steel probe (diameter ∼8 mm). After aeration, the resultant material was gently smeared onto a dimple microscope glass slide (Fischer Scientific) and viewed using an optical microscope (CX31, Olympus, Japan). Stable air bubbles were observed in the honey for all particles. Thus, the particles were further investigated in terms of foam volume and foam stability at varying concentrations (wt.%). In direct contrast to the particle immersion experiment, a honey drop (40 μL) was carefully deposited, using a micropipette (Eppendorf, Germany), onto a Teflon substrate (4 cm × 4 cm × 3 mm, Radio Spares, United Kingdom) containing a loose bed of the particles (100 mg). The honey drop was gently rolled back and forth on the particle bed, and honey liquid marbles were obtained. The marbles were photographed using a high-definition digital camera (4.3 V Power Shot SX220 HS, Canon, Japan).
The foam volume and foam stability were investigated with respect to the degree of particle fluorination. For fumed silica particles, 75%, 59%, and 50% SiOH represent the least, moderately, and most fluorinated fumed silica particles, respectively. Similarly, PF-5, PF-8, and PF-12 represent the least, moderately, and most fluorinated sericite clay particles, respectively. Honey (5 g) was weighed into screw-cap plastic vials, followed by the addition of the required mass of fumed silica particles. This resulted in varying particle concentrations (0.1–3 wt.%) in honey. In order to obtain honey foam, the resultant honey–particle mixtures were aerated (13,000 rpm, 3 min) using a rotor-stator homogenizer (Ultra-Turrax T25, IKA-Werke, Germany) with a stainless-steel probe (diameter ∼ 8 mm). The initial foam volume (i.e., soon after aeration) was measured. This was repeated after 24 h and then weekly for a period of 1 year. To view the microstructure of the foam, a small foam sample was smeared onto a dimpled microscope glass slide (Fisher Scientific) and viewed under an optical microscope (CX31, Olympus, Japan). Images of the foam microstructure were captured using a digital camera (E-330, Olympus, Japan) connected to the optical microscope. These images were analyzed using ImageJ software to obtain the percentage of dispersed air bubbles in the foams. Finally, the viscosity of residual honey after aeration was measured using a rheometer (DHR-2, TA Instruments, New Castle, USA) with parallel plates of diameter 40 mm at a fixed gap of 1 mm. Viscosity values were obtained at a shear rate of 0.1 s−1 at ambient temperature (30°C ± 2°C).
There are several methods for measuring the contact angle of particles at liquid–air and liquid–liquid interfaces. These methods are often limited by particle size and shape, making it impossible to directly measure the contact angle. Therefore, the majority of these methods are indirect. As summarized by Maestro et al., 2014, some of these methods include collapse pressure of surface pressure-area isotherms (Clint and Taylor, 1992), the Washburn capillary rise technique (Galet et al., 2010), atomic force microscopy combined with a colloidal probe (Preuss and Butt, 1998), the gel trapping technique (Cayre and Paunov, 2004), freeze-fracture shadow casting (Isa et al., 2011), excluded area technique (Grigoriev et al., 2007), film caliper technique (Horozov et al., 2008), ellipsometry technique (Hunter et al., 2009), and the sessile drop technique (Guo et al., 2013). Compared with other techniques, which are limited to spherical and discrete particles of certain sizes, the sessile drop technique appears to be universal as it can be applied to both aggregated and discrete particles of any shape and size. However, contact angle values from the sessile drop technique are susceptible to Wenzel (1936) or Cassie and Baxter (1944) wetting, leading to the reduction or amplification of values. Because our particles are aggregated and irregular in shape, we choose to use the sessile drop technique, which requires a compressed disk or films of the particles. To obtain a particle film, a suspension (5 wt.%) of the particles was prepared by dispersing the required mass of the particles in a mixture of ethanol (60%) and water (40%), using the rotor-stator homogenizer (13,000 rpm, 2 min). All particle suspensions were prepared in screw-cap plastic vials with a stainless-steel probe (diameter ∼8 mm). Samples (30 μL) of the suspensions were placed on microscope glass slides (2.5 × 2.5 cm) (Fisher Scientific, UK) and allowed to dry in air (30°C ± 2 °C), forming thin films of the particles. Sessile drops (10 μL) of the honey sample were formed on the particle films using a plastic syringe with a thin stainless-steel needle (inner diameter ∼0.8 mm). These sessile honey drops were photographed, and the images were edited using the GNU image manipulation program (Supplementary Figure S3). The edited images were analyzed using ImageJ software by measuring the contact angle of honey drops on the particle films. For all particles, two separate contact angle values were obtained, and their averages and standard deviations were reported.
The high demand for honey makes it prone to adulteration (Fakhlaei et al., 2020); therefore, we verified the authenticity of our honey sample before use. We measured the basic physicochemical properties of the honey sample and compared them with literature values (Table 1). All our measured values are in good agreement with literature values, except for the surface tension, which differs significantly. This difference can be attributed to the chemical composition of honey, which varies with the geographical location, floral composition, and length of storage of a honey sample (Wang and Li, 2011; da Silva et al., 2016). However, the surface tension agrees closely with that (80.4 mN m−1, 30°C) of an aqueous sugar solution whose °Brix (80) (Peacock, 1995) is similar (°Brix 77) to our honey sample. The agreement of our measurements with literature values indicates that the honey sample was unadulterated.
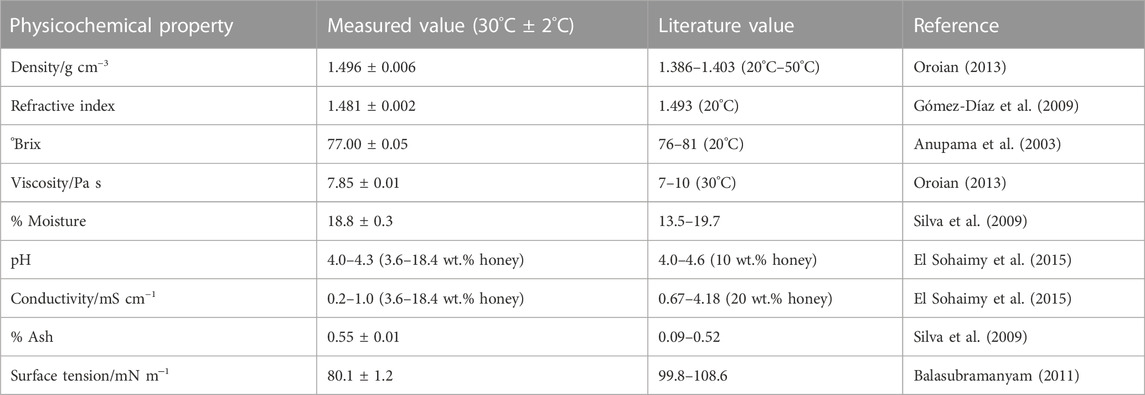
TABLE 1. Measured values of basic physicochemical properties [density, refractive index, °Brix, viscosity, surface tension, pH, conductivity (at 30°C ± 2 C), % moisture, and % ash] of the honey sample used versus literature values. The errors represent standard deviations of three separate measurements.
Placing powdered particles on a liquid surface and observing whether or not they sink into the liquid provides a qualitative measure of the extent to which the particles are wetted by the liquid. Upon aerating such a particle–liquid mixture, the particles become suspended in the liquid if they are completely wetted by the liquid (i.e., sank into it), but they coat surfaces of air bubbles and produce foam if they are partially wetted by the liquid (i.e., does not sink into it) (Tyowua et al., 2019). Both the hydrocarbon- and fluorocarbon-coated particles were partially wetted by the honey sample, thus aerating the particle–honey mixture yielded honey foam. Therefore, we investigated the effect of particle fluorination on foam volume and foam stability.
Another way to obtain qualitative information about the degree of particle wettability is by placing a drop of liquid on a loose powdered bed of particles and rolling it back and forth. This experiment is the opposite of the particle immersion test, and a paste is obtained if the particles are completely wetted by the liquid, whereas a liquid marble is obtained if the particles are partially wetted by the liquid. Both the hydrocarbon- and fluorocarbon-coated particles were partially wetted by the honey sample; therefore, honey liquid marbles (Figure 2) were obtained with all the particles. We observed that the marbles did not buckle or crumble for more than 6 months. This is presumably due to the low vapor pressure of honey (Bentabol Manzanares et al., 2014), which causes it to vaporize slowly. The particle immersion experiment and this experiment indicate that both the hydrocarbon- and fluorocarbon-coated particles are partially wetted by honey. We quantified the degree of particle wettability by measuring the contact angle of honey drops (10 μL) on microscope glass slides containing films of the particles. Contact angles above 130° were obtained for all particles (Table 2), but there was no clear correlation between the extent of fluorination and these values. In aqueous (Horozov, 2008) and oil (Binks et al., 2015) systems, contact angles slightly greater than 90° are required for stable foam formation, whereas those >> 90° are required for defoaming (Denkov and Marinova, 2006; Garrett, 2015). Therefore, these particles should not produce honey foam as the contact angle is above 130° (i.e., much greater than 90°). However, with the production of stable honey foam with these particles, it is possible that the contact angle values have been amplified by the roughness of the particle-coated glass slides via the Cassie–Baxter mechanism (Cassie and Baxter, 1944).
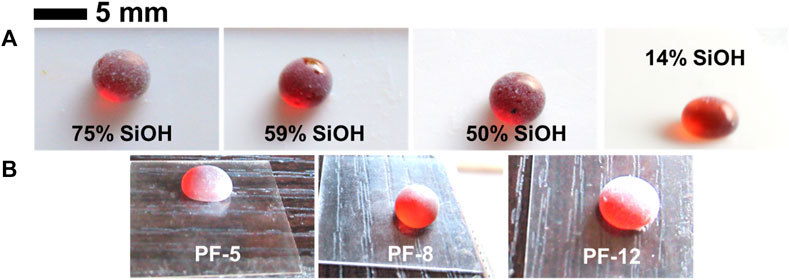
FIGURE 2. (A) Photographs (soon after preparation) of fluorocarbon- and hydrocarbon-coated fumed silica particle-stabilized honey liquid marbles (∼40 μL) on Teflon substrates. (B) Photographs (soon after preparation) of fluorocarbon-coated sericite clay particle-stabilized honey liquid marbles (∼40 μL) on microscope glass slides. Both particle types (i.e., fumed silica and sericite clay) were coated with varying amounts of fluorocarbons. Due to the low vapor pressure of honey, the marbles did not evaporate and remained intact for over 6 months.
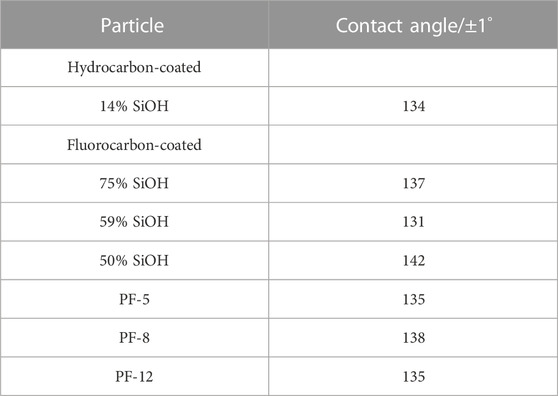
TABLE 2. Contact angles of honey drops (10 μL) on microscope glass slides containing films of hydrocarbon- and fluorocarbon-coated particles (given). The contact angle values are similar for all the particles.
When the contact angle is greater than 90°, the particles are hydrophobic (water) and oleophobic (oil) (Tyowua et al., 2019). We extend this nomenclature to describe these particles (contact angle >90°) in terms of honey as “honephobic.” The corresponding description for contact angle <90° is hydrophilic (water) and oleophilic (oil) (Tyowua et al., 2019), which can be extended to honey as “honephilic.” This nomenclature is necessary because although honey is a concentrated aqueous solution of sugars (mainly fructose and sucrose), it has a relatively higher surface tension (80.4 mN m−1, 30°C) compared with the surface tension of water (71.2 mN m−1, 30°C, Haynes et al., 2016), meaning it will wet surfaces or particles differently from water. This can be seen in our previous study (Tyowua et al., 2022a), where the contact angle of honey drops (10 μL) on a glass slide containing films of hydrocarbon-coated silica particles was observed to be higher than the contact angle of water drops on the same glass slides.
Fluorocarbon-coated fumed silica particles were used to study the effect of particle fluorination on honey foam volume and foam stability. These particles were 75% SiOH silica (least fluorinated), 59% SiOH silica (moderately fluorinated), and 50% SiOH silica (most fluorinated). This was compared with 14% SiOH fumed silica particles, which are almost completely coated with hydrocarbon groups and have reportedly produced the highest volume of honey foam compared with other hydrocarbon-coated fumed silica particles with ≤50% SiOH (Tyowua et al., 2022a). The visual appearance of plastic vials containing honey foam stabilized by 75% SiOH fluorinated fumed silica particles is shown in Figure 3, whereas those stabilized by the other particles are shown in Supplementary Figure S4. Although the honey sample used is brownish, the corresponding foam is light brown with a microstructure that contains spherical and non-spherical air bubbles (Figure 4). Particle-stabilized non-spherical air bubbles have been reported and are thought to arise from the jamming of adsorbed particles (Subramaniam et al., 2005). With jammed adsorbed particles, the surfaces of the air bubbles become rigid or solid-like and are unable to relax to the energetically favorable spherical geometry (Subramaniam et al., 2006). The foam volume increases with increasing particle concentration (Figure 5) as more particles are available to stabilize the incorporated air bubbles and created interfaces. The initial foam volume was highest with the hydrocarbon-coated (14% SiOH) fumed silica particles, followed by the least (75% SiOH) fluorinated silica particles, moderately (59% SiOH), and most (50% SiOH) fluorinated silica particles. When particle concentration is below 1 wt.%, foams stabilized by 14% SiOH (hydrocarbon-coated) fumed silica particles have the highest percentage of air bubbles, followed by foams stabilized by 75% SiOH, 50% SiOH, and 59% SiOH fluorinated silica particles (Figure 6). This correlates strongly with the initial foam volume observed with these particles (Figure 5). Above 1 wt.%, foams stabilized by 50% SiOH fluorinated fumed silica particles have the highest percentage of air bubbles, followed by foams stabilized by 75% SiOH fluorinated fumed silica particles, 14% SiOH hydrocarbon-coated fumed silica particles, and then 59% SiOH fluorinated fumed silica particles (Figure 6). In this case, there was no correlation between the initial foam volume and the percentage of incorporated air bubbles. This discrepancy might result from errors associated with estimating the actual percentage of incorporated air bubbles. The foam samples underwent gravity-induced syneresis and coalescence so that the foam volume decreased with time (Supplementary Figure S5). By 1 year, a substantial decrease in foam volume was noticed in the foam stabilized by 14% SiOH (hydrocarbon-coated) fumed silica particles (Figure 7; Supplementary Figure S6) compared with the rest of the fluorocarbon-coated fumed silica particles. Overall, only a small decrease in foam volume was observed with the least (75% SiOH) fluorinated fumed silica particles in comparison with the 59% SiOH and 50% SiOH fluorinated fumed silica particles, in which a substantial decrease in foam volume was observed (Supplementary Figure S6). In other words, increasing particle fluorination leads to a lower foam volume and foam stability. This is in contrast to hydrocarbon-coated particles, where the foam volume and foam stability increase with increasing hydrocarbon coating, especially at higher particle concentrations (≥1 wt.%) (Tyowua et al., 2022a). If it is assumed that the foam microstructure is stabilized by two mechanisms, namely, adsorption of individual particle grains and network formation of adsorbed particles (Figure 8), then the difference in trend between the hydrocarbon- and fluorocarbon-coated particles can be explained. In the case of hydrocarbon-coated fumed silica particles, network formation can occur through the methyl hydrogens of the siloxane and SiOH groups of the particles, as well as between SiOH groups of the particles (Supplementary Figure S7). Thus, increasing the hydrocarbon coating increases the possibility of network formation and, hence, the incorporation of more air bubbles with a stable microstructure. However, in the case of fluorocarbon-coated fumed silica particles, network formation can occur only through the SiOH groups of the particles (Supplementary Figure S7). Therefore, reducing the number of SiOH groups reduces network formation and leads to the incorporation of little air and an unstable microstructure for the incorporated air bubbles. We confirmed this mechanism by measuring the viscosity of honey suspensions containing 1 wt.% of hydrocarbon- and fluorocarbon-coated silica particles, with some of the suspensions coming from our previous work (Tyowua et al., 2022a). Although the viscosity of honey suspension containing hydrocarbon-coated particles increased with decreasing % SiOH, the viscosity of suspensions containing fluorocarbon-coated particles decreased with decreasing % SiOH (Supplementary Figure S8). This observation can be adduced to an increase in network formation in the former (hydrocarbon-coated) but a decrease in network formation in the latter (fluorocarbon-coated). In contrast, Whitby et al. (2018) investigated the rheology of olive oil suspensions containing hydrocarbon-coated fumed silica particles and reported a decrease in storage and loss moduli as the degree of hydrogen bonding decreases due to increasing hydrocarbon coating. Previously, we showed that foam formation does not occur unless hydrocarbon-coated particles contain ≤50% SiOH (Tyowua et al., 2022a). In other words, there is no foaming with the 75% SiOH hydrocarbon-coated particles compared with the 75% SiOH fluorinated particles, which provided excellent foam in this work. Presumably, with the fluorocarbon groups possessing a lower surface free energy than the hydrocarbon groups (Chaudhury and Whitesides, 1992), fluorination improves the wettability of the particles for honey foam formation much more than hydrocarbon groups.
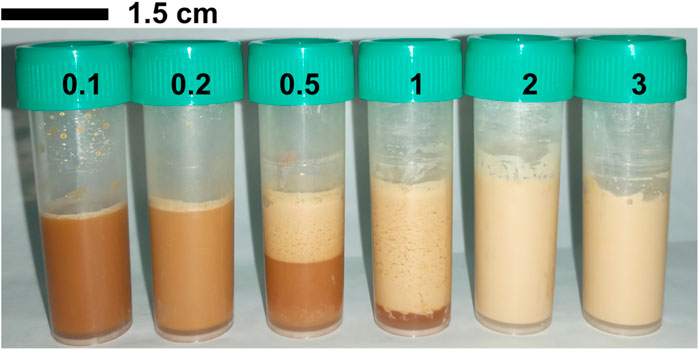
FIGURE 3. Photographs of plastic vails containing honey foam stabilized by different concentrations of 75% SiOH fluorinated fumed silica particles (at 4 weeks after preparation), showing an increment in foam volume as particle concentration increases from 0.1 to 3 wt.% (given).
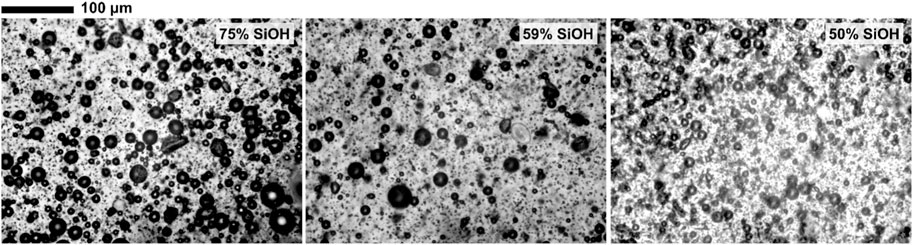
FIGURE 4. Optical microscope images of honey foam stabilized by 1 wt.% of fluorinated fumed silica particles (given) at 4 weeks after preparation, showing a mixture of spherical and non-spherical air bubbles.
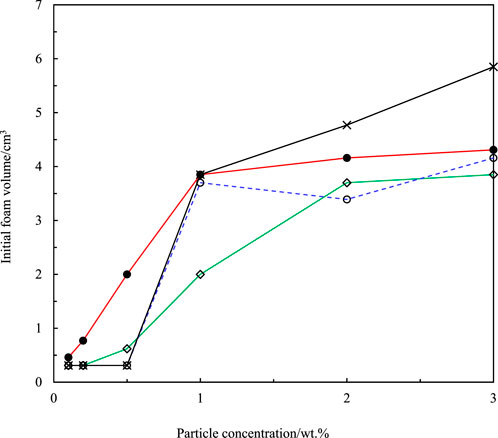
FIGURE 5. Initial volume of honey foam versus concentration of fumed silica particles for hydrocarbon-coated particles with 14% SiOH (×) and fluorocarbon-coated particles with 75% SiOH (•), 59% SiOH (◇), and 50% SiOH (○). The foam volume increased with increase in particle concentration (0.1–3 wt.%).
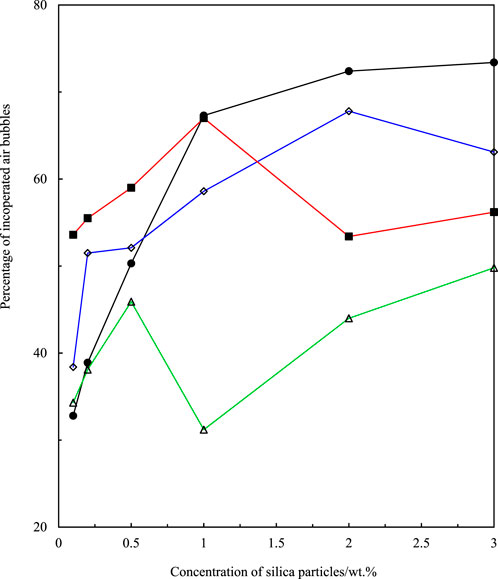
FIGURE 6. Percentage of incorporated air bubbles versus concentration of fumed silica particles for 14% SiOH (hydrocarbon-coated, ■), 75% SiOH (◇), 59% SiOH (△), and 50% SiOH (•) fluorinated fumed silica particles. At particle concentrations below 1 wt.%, a strong correlation exists between the initial foam volume and the percentage of dispersed air bubbles. This correlation is broken at particle concentrations above 1 wt.%.
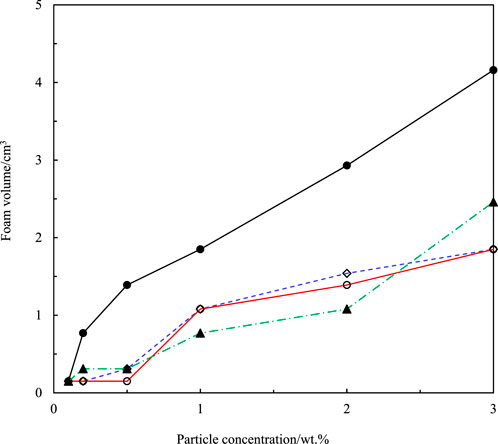
FIGURE 7. Volume of honey foam (1 year after preparation) versus concentration of fumed silica particles for hydrocarbon-coated silica particles with 14% SiOH (▲) and fluorocarbon-coated silica particles with 75% SiOH (•), 59% SiOH (◇), and 50% SiOH (○).
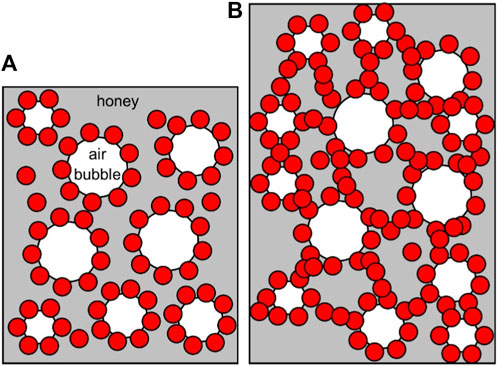
FIGURE 8. Schematic illustrations showing stabilization of honey foam microstructure by adsorption of individual silica particle grains (A) and network formation of adsorbed silica particles (B).
We further investigated the effect of particle fluorination on foam volume and foam stability using fluorocarbon-coated (PF-5‒PF-12) sericite clay particles. In this case, PF-5, PF-8, and PF-12 represent the least, moderately, and most fluorinated sericite clay particles, respectively. In contrast to the fluorocarbon-coated fumed silica particles, the fluorocarbon-coated sericite clay particles gave little foam (<1 cm3) that collapsed completely within 1 month, irrespective of the degree of fluorination, as shown in Supplementary Figure S9 (visual appearance) and Supplementary Figure S10 (foam volume). We attributed the foam volume and unstable microstructure to the stabilization of air bubbles by individual sericite particle grains rather than through the particle network (Figure 8). We confirmed this by measuring the viscosity of honey suspensions formed after aeration and obtained a fixed viscosity value (∼8 Pa s, similar to honey) irrespective of the degree of particle fluorination. Unlike the fluorinated fumed silica particle-stabilized foams with a mixture of spherical and non-spherical air bubbles, the microstructure of the fluorinated sericite clay particle-stabilized foam contained only spherical air bubbles (Supplementary Figure S11). Presumably, the sericite clay particles did not jam on air bubble surfaces like the fumed silica particles.
We studied the influence of particle fluorination on the volume of honey foam and foam stability using fluorocarbon-coated fumed silica and sericite clay particles. For the fumed silica particles, 75% SiOH, 59% SiOH, and 50% SiOH silica represent the least, moderately, and most fluorinated particles, respectively. Similarly, for sericite clay particles, PF-5, PF-8, and PF-12 represent the least, moderately, and most fluorinated particles, respectively. The contact angle of honey drops on microscope-glass slides containing films of these particles is greater than 90°; therefore, the particles can be described as “honephobic.” Aerating a mixture containing these particles and honey produced honey foam. The fluorinated fumed silica particles produced more foam than the fluorinated sericite clay particles. With fumed silica particles, we observed that foam volume and foam stability decreased with increasing particle fluorination. In other words, higher foam volume and stability were observed with the 75% SiOH fluorinated fumed silica particles, whereas lower foam volume and stability were observed with the 59% and 50% SiOH fluorinated fumed silica particles. Foam from the 75% SiOH fluorinated fumed silica particles had superior stability because they did not collapse completely for up to 1 year. Conversely, for fluorinated sericite clay particles, the foam volume and foam stability were independent of the degree of particle fluorination. Regardless of the degree of fluorination, these particles produced unstable foam (<1 cm3) that collapsed completely in 4 weeks. Overall, unlike hydrocarbon-coated fumed silica particles with foam stability of only 6 months (Tyowua et al., 2022a), we have shown that stability of up to 1 year can be achieved with fluorinated fumed silica particles. This is a significant advancement toward real-life applications of honey foams, especially in topical formulation of cosmetic and pharmaceutical products.
The original contributions presented in the study are included in the article/Supplementary Material. Further inquiries can be directed to the corresponding author.
Conceptualization and supervision: AT and SA; investigation and visualization: AE; methodology, resources, validation, writing the original draft, and writing review and editing: AT. All authors contributed to the article and approved the submitted version.
The Tertiary Education Trust Fund (TetFund) of Nigeria is thanked for its financial support (Grant no. TEF/DESS/UNI/MAKURDI/IBR/ 2014/VOL. 1).
Dr. Stefan Hutzler, School of Physics, Trinity College Dublin, The University of Dublin, Ireland, is thanked for a useful discussion during surface tension measurements.
The author AT declared that they were an editorial board member of Frontiers at the time of submission. This had no impact on the peer review process and the final decision.
The remaining authors declare that the research was conducted in the absence of any commercial or financial relationships that could be construed as a potential conflict of interest.
All claims expressed in this article are solely those of the authors and do not necessarily represent those of their affiliated organizations or those of the publisher, the editors, and the reviewers. Any product that may be evaluated in this article, or claim that may be made by its manufacturer, is not guaranteed or endorsed by the publisher.
The Supplementary Material for this article can be found online at: https://www.frontiersin.org/articles/10.3389/frsfm.2023.1163393/full#supplementary-material
Anupama, D., Bhat, K. K., and Sapna, V. K. (2003). Sensory and physico-chemical properties of commercial samples of honey. Food Res. Int. 36 (2), 183–191. doi:10.1016/S0963-9969(02)00135-7
Balasubramanyam, M. (2011). Physical characteristics of multifloral honey of Apis dorsata F. and Apis cerana indica from Western Ghats of Karnataka. Bioscan 6 (4), 631–634.
Bentabol Manzanares, A., Hernández García, Z., Rodríguez Galdón, B., Rodríguez Rodríguez, E., and Díaz Romero, C. (2014). Physicochemical characteristics of minor monofloral honeys from Tenerife, Spain. LWT - Food Sci. Technol. 55 (2), 572–578. doi:10.1016/j.lwt.2013.09.024
Berton-Carabin, C. C., and Schroën, K. (2015). Pickering emulsions for food applications: Background, trends, and challenges. Annu. Rev. Food Sci. Technol. 6 (1), 263–297. doi:10.1146/annurev-food-081114-110822
Binks, B. P., and Horozov, T. S. (2006). Colloidal particles at liquid interfaces. Cambridge University Press.
Binks, B. P., Johnston, S. K., Sekine, T., and Tyowua, A. T. (2015). Particles at oil-air surfaces: Powdered oil, liquid oil marbles, and oil foam. ACS Appl. Mater. Interfaces 7 (26), 14328–14337. doi:10.1021/acsami.5b02890
Binks, B. P. (2002). Particles as surfactants—Similarities and differences. Curr. Opin. Colloid Interface Sci. 7 (1–2), 21–41. doi:10.1016/s1359-0294(02)00008-0
Binks, B. P., Sekine, T., and Tyowua, A. T. (2014). Dry oil powders and oil foams stabilised by fluorinated clay platelet particles. Soft Matter 10 (4), 578–589. doi:10.1039/C3SM52748D
Binks, B. P., and Tyowua, A. T. (2013). Influence of the degree of fluorination on the behaviour of silica particles at air-oil surfaces. Soft Matter 9 (3), 834–845. doi:10.1039/c2sm27395k
Carter, B. O., Adams, D. J., and Cooper, A. I. (2010). Pausing a stir: Heterogeneous catalysis in “dry water”. Green Chem. 12 (5), 783–785. doi:10.1039/B922508K
Cassie, A. B. D., and Baxter, S. (1944). Wettability of porous surfaces. Trans. Faraday Soc. 40, 546–551. doi:10.1039/tf9444000546
Cayre, O. J., and Paunov, V. N. (2004). Contact angles of colloid silica and gold particles at air−water and oil−water interfaces determined with the gel trapping technique. Langmuir 20 (22), 9594–9599. doi:10.1021/la0489615
Chang, F., Vis, C. M., Ciptonugroho, W., and Bruijnincx, P. C. A. (2021). Recent developments in catalysis with pickering emulsions. Green Chem. 23 (7), 2575–2594. doi:10.1039/D0GC03604H
Chaudhury, M. K., and Whitesides, G. M. (1992). Correlation between surface free energy and surface constitution. Science 255 (5049), 1230–1232. doi:10.1126/science.255.5049.1230
Chen, L., Ao, F., Ge, X., and Shen, W. (2020). Food-grade Pickering emulsions: Preparation, stabilization and applications. Molecules 25 (14), 3202. doi:10.3390/molecules25143202
Clint, J. H., and Taylor, S. E. (1992). Particle size and interparticle forces of overbased detergents: A Langmuir trough study. Colloids Surf. 65 (1), 61–67. doi:10.1016/0166-6622(92)80175-2
da Silva, P. M., Gauche, C., Gonzaga, L. V., Costa, A. C. O., and Fett, R. (2016). Honey: Chemical composition, stability and authenticity. Food Chem. 196, 309–323. doi:10.1016/j.foodchem.2015.09.051
Denkov, N. D., and Marinova, K. G. (2006). Antifoam effects of solid particles, oil drops and oil-solid compounds in aqueous foams. Colloidal Part. A. T. Liq. interfaces, 383–444. doi:10.1017/cbo9780511536670.011
Dickinson, E. (2020). Advances in food emulsions and foams: Reflections on research in the neo-Pickering era. Curr. Opin. Food Sci. 33, 52–60. doi:10.1016/j.cofs.2019.12.009
El Sohaimy, S. A., Masry, S. H. D., and Shehata, M. G. (2015). Physicochemical characteristics of honey from different origins. Ann. Agric. Sci. 60 (2), 279–287. doi:10.1016/j.aoas.2015.10.015
Fakhlaei, R., Selamat, J., Khatib, A., Razis, A. F., Sukor, R., Ahmad, S., et al. (2020). The toxic impact of honey adulteration: A review. Foods 9 (11), 1538. doi:10.3390/foods9111538
Fameau, A.-L., and Saint-Jalmes, A. (2017). Non-aqueous foams: Current understanding on the formation and stability mechanisms. Adv. Colloid Interface Sci. 247, 454–464. doi:10.1016/j.cis.2017.02.007
Fernandez-Rodriguez, M. A., Binks, B. P., Rodriguez-Valverde, M. A., Cabrerizo-Vilchez, M. A., and Hidalgo-Alvarez, R. (2017). Particles adsorbed at various non-aqueous liquid-liquid interfaces. Adv. Colloid Interface Sci. 247, 208–222. doi:10.1016/j.cis.2017.02.001
Frelichowska, J., Bolzinger, M.-A., Pelletier, J., Valour, J.-P., and Chevalier, Y. (2009a). Topical delivery of lipophilic drugs from o/w Pickering emulsions. Int. J. Pharm. 371 (1), 56–63. doi:10.1016/j.ijpharm.2008.12.017
Frelichowska, J., Bolzinger, M.-A., Valour, J.-P., Mouaziz, H., Pelletier, J., and Chevalier, Y. (2009b). Pickering w/o emulsions: Drug release and topical delivery. Int. J. Pharm. 368 (1), 7–15. doi:10.1016/j.ijpharm.2008.09.057
Galet, L., Patry, S., and Dodds, J. (2010). Determination of the wettability of powders by the Washburn capillary rise method with bed preparation by a centrifugal packing technique. J. Colloid Interf. Sci. 346 (2), 470–475. doi:10.1016/j.jcis.2010.02.051
Garrett, P. R. (2015). Defoaming: Antifoams and mechanical methods. Curr. Opin. Colloid Interface Sci. 20 (2), 81–91. doi:10.1016/j.cocis.2015.03.007
Gómez-Díaz, D., Navaza, J. M., and Quintáns-Riveiro, L. C. (2009). Effect of temperature on the viscosity of honey. Int. J. Food Prop. 12 (2), 396–404. doi:10.1080/10942910701813925
González-Méijome, J. M., López-Alemany, A., Lira, M., Almeida, J. B., Oliveira, M. E. C. D. R., and Parafita, M. A. (2007). Equivalences between refractive index and equilibrium water content of conventional and silicone hydrogel soft contact lenses from automated and manual refractometry. J. Biomed. Mater. Res. B 80B (1), 184–191. doi:10.1002/jbm.b.30583
Grigoriev, D. O., Krägel, J., Dutschk, V., Miller, R., and Möhwald, H. (2007). Contact angle determination of micro- and nanoparticles at fluid/fluid interfaces: The excluded area concept. Phys. Chem. Chem. Phys. 9 (48), 6447–6454. doi:10.1039/B711732A
Guo, Y., Tang, D., Du, Y., and Liu, B. (2013). Controlled fabrication of hexagonally close-packed Langmuir–Blodgett silica particulate monolayers from binary surfactant and solvent systems. Langmuir 29 (9), 2849–2858. doi:10.1021/la3049218
Guzmán, E., Ortega, F., and Rubio, R. G. (2022). Pickering emulsions: A novel tool for cosmetic formulators. Cosmetics 9 (4), 68. doi:10.3390/cosmetics9040068
Haynes, W. M., Lide, D. R., and Bruno, T. J. (Editors) (2016). CRC handbook of chemistry and physics: A ready-reference book of chemical and physical data 97th Edition (Boca Raton, Florida, 2016–2017.
Horozov, T. S., Braz, D. A., Fletcher, P. D. I., Binks, B. P., and Clint, J. H. (2008). Novel film-calliper method of measuring the contact angle of colloidal particles at liquid interfaces. Langmuir 24 (5), 1678–1681. doi:10.1021/la703414q
Horozov, T. S. (2008). Foams and foam films stabilised by solid particles. Curr. Opin. Colloid Interface Sci. 13 (3), 134–140. doi:10.1016/j.cocis.2007.11.009
Hunter, T. N., Jameson, G. J., Wanless, E. J., Dupin, D., and Armes, S. P. (2009). Adsorption of submicrometer-sized cationic sterically stabilized polystyrene latex at the air−water interface: Contact angle determination by ellipsometry. Langmuir 25 (6), 3440–3449. doi:10.1021/la803879p
Hunter, T. N., Pugh, R. J., Franks, G. V., and Jameson, G. J. (2008). The role of particles in stabilising foams and emulsions. Adv. Colloid Interface Sci. 137 (2), 57–81. doi:10.1016/j.cis.2007.07.007
Hutzler, S., Ryan-Purcell, J. C. F., Dunne, F. F., and Weaire, D. (2018). A simple formula for the estimation of surface tension from two length measurements for a sessile or pendant drop. Phil. Mag. Lett. 98 (1), 9–16. doi:10.1080/09500839.2018.1434320
Isa, L., Falk, L., Roger, W., and Erik, R. (2011). Measuring single-nanoparticle wetting properties by freeze-fracture shadow-casting cryo-scanning electron microscopy. Nat. Comm. 2, 438. doi:10.1038/ncomms1441
Jafarzadeh, L., Ranjbar, M., Nazari, T., Naeimi Eshkaleti, M., Aghaei Gharehbolagh, S., Sobel, J. D., et al. (2022). Vulvovaginal candidiasis: An overview of mycological, clinical, and immunological aspects. J. Obstet. Gynaecol. Res. 48 (7), 1546–1560. doi:10.1111/jog.15267
Maestro, A., Guzmán, E., Ortega, F., and Rubio, R. G. (2014). Contact angle of micro- and nanoparticles at fluid interfaces. Curr. Opin. Colloid Interface Sci. 19 (4), 355–367. doi:10.1016/j.cocis.2014.04.008
Marku, D., Wahlgren, M., Rayner, M., Sjöö, M., and Timgren, A. (2012). Characterization of starch Pickering emulsions for potential applications in topical formulations. Int. J. Pharm. 428 (1), 1–7. doi:10.1016/j.ijpharm.2012.01.031
Marto, J., Ascenso, A., Simoes, S., Almeida, A. J., and Ribeiro, H. M. (2016). Pickering emulsions: Challenges and opportunities in topical delivery. Expert Opin. Drug Deliv. 13 (8), 1093–1107. doi:10.1080/17425247.2016.1182489
McHale, G., and Newton, M. I. (2011). Liquid marbles: Principles and applications. Soft Matter 7 (12), 5473–5481. doi:10.1039/C1SM05066D
McHale, G., and Newton, M. I. (2015). Liquid marbles: Topical context within soft matter and recent progress. Soft Matter 11 (13), 2530–2546. doi:10.1039/c5sm00084j
Murray, B. S. (2019). Pickering emulsions for food and drinks. Curr. Opin. Food Sci. 27, 57–63. doi:10.1016/j.cofs.2019.05.004
Nguyen, N.-K., Ooi, C. H., Singha, P., Jin, J., Sreejith, K. R., Phan, H.-P., et al. (2020). Liquid marbles as miniature reactors for chemical and biological applications. Processes 8 (7), 793. doi:10.3390/pr8070793
Oroian, M. (2013). Measurement, prediction and correlation of density, viscosity, surface tension and ultrasonic velocity of different honey types at different temperatures. J. Food Eng. 119 (1), 167–172. doi:10.1016/j.jfoodeng.2013.05.029
Peacock, S. (1995). Predicting physical properties of factory juices and syrups. Int. Sugar J. 97 (1162), 571–572.
Pera-Titus, M., Leclercq, L., Clacens, J.-M., De Campo, F., and Nardello-Rataj, V. (2015). Pickering interfacial catalysis for biphasic systems: From emulsion design to green reactions. Angew. Chem. Int. Ed. 54 (7), 2006–2021. doi:10.1002/anie.201402069
Perng, Y.-S., Wang, E. I.-C., Lu, C.-C., and Kuo, L.-S. (2008). Application of sericite to WLC coatings. TAPPI J. 3 (6), 21–31.
Preuss, M., and Butt, H.-J. (1998). Measuring the contact angle of individual colloidal particles. J. Colloid Interf. Sci. 208 (2), 468–477. doi:10.1006/jcis.1998.5833
Rodriguez, A. M. B., and Binks, B. P. (2020). Catalysis in pickering emulsions. Soft Matter 16 (45), 10221–10243. doi:10.1039/D0SM01636E
Sharkawy, A., Barreiro, M. F., and Rodrigues, A. E. (2020). Chitosan-based pickering emulsions and their applications: A review. Carbohydr. Polym. 250, 116885. doi:10.1016/j.carbpol.2020.116885
Silva, L. R., Videira, R., Monteiro, A. P., Valentão, P., and Andrade, P. B. (2009). Honey from Luso region (Portugal): Physicochemical characteristics and mineral contents. Microchem. J. 93 (1), 73–77. doi:10.1016/j.microc.2009.05.005
Subramaniam, A. B., Abkarian, M., Mahadevan, L., and Stone, H. A. (2006). Mechanics of interfacial composite materials. Langmuir 22 (24), 10204–10208. doi:10.1021/la061475s
Subramaniam, A. B., Abkarian, M., Mahadevan, L., and Stone, H. A. (2005). Non-spherical bubbles. Nature 438 (44), 930. doi:10.1038/438930a
Tai, Z., Huang, Y., Zhu, Q., Wu, W., Yi, T., Chen, Z., et al. (2020). Utility of Pickering emulsions in improved oral drug delivery. Drug Discov. 25 (11), 2038–2045. doi:10.1016/j.drudis.2020.09.012
Tang, C., Xiao, E., Sinko, P. J., Szekely, Z., and Prud’homme, R. K. (2015). Responsive foams for nanoparticle delivery. Colloids Surf. B 133, 81–87. doi:10.1016/j.colsurfb.2015.05.038
Tyowua, A. T., and Binks, B. P. (2020). Growing a particle-stabilized aqueous foam. J. Colloid Interface Sci. 561, 127–135. doi:10.1016/j.jcis.2019.11.103
Tyowua, A. T., Echendu, A. M., Adejo, S. O., and Binks, B. P. (2022a). Influence of particle wettability on foam formation in honey. J. Phys. Condens. Matter 34 (45), 454003. doi:10.1088/1361-648X/ac8f0b
Tyowua, A. T., Echendu, A. M., Yiase, S. G., Adejo, S. O., Leke, L., Mbawuaga, E. M., et al. (2022b). Foaming honey: Particle or molecular foaming agent? J. Dispers. Sci. Technol. 43 (6), 848–858. doi:10.1080/01932691.2020.1845718
Tyowua, A. T. (2019). Liquid marbles: Formation, characterisation and applications. Boca Raton, Florida: CRC Press.
Tyowua, A. T., Targema, M., and Ubuo, E. E. (2019). Non-wettable surfaces–from natural to artificial and applications: A critical review. Rev. Adhes. Adhes. 7 (2), 195–231. doi:10.7569/raa.2019.097308
Vanhanen, L. P., Emmertz, A., and Savage, G. P. (2011). Mineral analysis of mono-floral New Zealand honey. Food Chem. 128 (1), 236–240. doi:10.1016/j.foodchem.2011.02.064
Wang, J., and Li, Q. X. (2011). “Chapter 3 - chemical composition, characterization, and differentiation of honey botanical and geographical origins,” in Advances in food and nutrition research. Editor S. L. Taylor (Academic Press), 89–137.
Wenzel, R. N. (1936). Resistance of solid surfaces to wetting by water. Ind. Eng. Chem. 28 (8), 988–994. doi:10.1021/ie50320a024
Whitby, C. P., Krebsz, M., and Booty, S. J. (2018). Understanding the role of hydrogen bonding in the aggregation of fumed silica particles in triglyceride solvents. J. Colloid Interf. Sci. 527, 1–9. doi:10.1016/j.jcis.2018.05.029
Zanini, M., Lesov, I., Marini, E., Hsu, C.-P., Marschelke, C., Synytska, A., et al. (2018). Detachment of rough colloids from liquid–liquid interfaces. Langmuir 34 (16), 4861–4873. doi:10.1021/acs.langmuir.8b00327
Zhang, S., Dedovets, D., Feng, A., Wang, K., and Pera-Titus, M. (2022). Pickering interfacial catalysis for aerobic alcohol oxidation in oil foams. J. Am. Chem. Soc. 144 (4), 1729–1738. doi:10.1021/jacs.1c11207
Zhao, Y., Jones, S. A., and Brown, M. B. (2010). Dynamic foams in topical drug delivery. J. Pharm. Pharmacol. 62 (6), 678–684. doi:10.1211/jpp.62.06.0003
Keywords: honey, foam, wetting, contact angle, foam stability
Citation: Tyowua AT, Echendu AM and Adejo SO (2023) Influence of particle fluorination on the stability of honey foam. Front. Soft. Matter 3:1163393. doi: 10.3389/frsfm.2023.1163393
Received: 10 February 2023; Accepted: 05 June 2023;
Published: 22 June 2023.
Edited by:
Reinhard Hohler, Université Gustave Eiffel, FranceReviewed by:
Marcel Krzan, Jerzy Haber Institute of Catalysis and Surface Chemistry, PolandCopyright © 2023 Tyowua, Echendu and Adejo. This is an open-access article distributed under the terms of the Creative Commons Attribution License (CC BY). The use, distribution or reproduction in other forums is permitted, provided the original author(s) and the copyright owner(s) are credited and that the original publication in this journal is cited, in accordance with accepted academic practice. No use, distribution or reproduction is permitted which does not comply with these terms.
*Correspondence: Andrew T. Tyowua, YXR5b3d1YUBic3VtLmVkdS5uZw==
Disclaimer: All claims expressed in this article are solely those of the authors and do not necessarily represent those of their affiliated organizations, or those of the publisher, the editors and the reviewers. Any product that may be evaluated in this article or claim that may be made by its manufacturer is not guaranteed or endorsed by the publisher.
Research integrity at Frontiers
Learn more about the work of our research integrity team to safeguard the quality of each article we publish.