 Jared A. Gohl
 Tristan J. Wiley1
 Chelsea S. Davis
94% of researchers rate our articles as excellent or good
Learn more about the work of our research integrity team to safeguard the quality of each article we publish.
Find out more
ORIGINAL RESEARCH article
Front. Soft Matter, 10 April 2023
Sec. Gels
Volume 3 - 2023 | https://doi.org/10.3389/frsfm.2023.1125163
Stress concentrations in polymer matrix composites occur due to non-uniform loadings which develop near the interface between the matrix and reinforcement in a stressed composite. Methods to better understand the evolution of this stress concentration are required for the development of advanced composites. Mechanophores, which are stress responsive molecules, can be embedded into the polymer matrix and used to quantify the local stresses in a loaded composite. In this work, single particle model composites were fabricated by combining functionalized glass particles embedded into a silicone/mechanophore matrix. Confocal microscopy was then used to measure the mechanophore activation in situ during mechanical loading. The fluorescence intensity was correlated to maximum principal stress values obtained from a finite element analysis (FEA) model of the system utilizing an Ogden hyperelastic model to represent the elastomer. By calibrating stress to fluorescence intensity spatially, quantitative stress measurements can be obtained directly from fluorescent images. To validate this technique, calibrated stress values for a two-particle composite system were compared to a FEA model and good agreement was found. Further experiments were performed on silicone matrix composites containing short cylindrical particles oriented with their major axis parallel or perpendicular to the stretching direction. To demonstrate the versatility of the single particle intensity/stress calibration approach, maximum principal stress values were mapped on the fluorescence images of the cylindrical experiments. This technique has potential to quantify stress concentrations quickly and accurately in new composite designs without the use of FEA models or differential image correlation.
Polymer matrix composites combine the toughness of thermoset polymer matrices with the strength and stiffness of rigid particle or fiber reinforcements to obtain an optimized system which is strong and lightweight. This enhanced material performance is a result of efficient stress transfer to the reinforcement phase through the matrix. During mechanical loading, large stress concentrations often develop near the reinforcement phase due to non-uniform loading within the material. These stress concentrations often lead to catastrophic failure of the composite (Hedgepeth and Van Dyke, 1967; Carman et al., 1993). Understanding how and where these stress concentrations occur in composites is important for predicting material performance and optimizing new composite designs.
Current experimental techniques for measuring stresses or strains within polymeric materials include digital image correlation (Tekieli et al., 2017; Janeliukstis and Chen, 2021), photoelasticity measurements (Voloshin and Burger, 1983; Dijkstra and Broere, 2010), or mechanophores (Kim T. A. et al., 2020; Rencheck et al., 2021). Digital image correlation relies on speckling the surface of samples with high contrast particles and tracking the movement of these particles to determine local strains in the sample. However, this technique assumes uniform strains through the thickness of the sample, making analysis of internal stress concentrations difficult. Likewise, photoelasticity measurement is a full field technique that obtains a projection of the strains through the entire thickness of the sample. It relies on conformational rearrangement of the matrix to produce changes in the birefringence. To measure three-dimensional internal stress distributions in composite materials, a technique with high resolution in the thickness direction is required.
Mechanophores are molecules which undergo a structural change upon the application of a mechanical load (Li et al., 2015; Deneke et al., 2020; Niggemann and Göstl, 2022). This change can result in an optical or catalytic response to the mechanical stimulus. The optical change from a non-fluorescent to fluorescent state or a color change can be used to detect mechanophore activation. Fluorescent mechanophores are compatible with fluorescence microscopy and allow for spatial resolution of the stresses in transparent samples (Woodcock et al., 2017; Davis et al., 2021; Morelle et al., 2021; Rencheck et al., 2021). Of the various mechanophores that have been reported, spiropyran is a popular choice for stress detection due to its ability to undergo both a fluorescence and color change, allowing observations through both absorption and emission spectrometry (Beiermann et al., 2011; Gossweiler et al., 2015; Li, 2017; Li et al., 2018; Celestine et al., 2019; Kim D. W. et al., 2020; Cao, 2020; Chen et al., 2020; 2021; Grady et al., 2020; Shannahan et al., 2021).
For simple geometries, analytical solutions of the local stresses within a loaded composite can be derived to determine stress concentrations. However, for practical composites which contain complex geometries these solutions cannot be derived. Finite element analysis (FEA) is a tool used to simplify the analysis by modeling the problem as a discrete number of sections, or elements, which can be easily treated by a computer using linear algebra and given the constitutive properties to simulate the stress and strain response within a mechanically-loaded materials system. While being a powerful tool, FEA relies on assumptions about the material properties, along with the loads and boundary conditions and requires verification and validation to ensure accuracy of the model. For composite geometries, models require careful selection of element shapes and sizes (“meshing”) to capture the complexities of composite systems.
By combining experimental approaches with FEA to calibrate mechanophore activation, direct quantitative stress measurement has recently been achieved by others. Xia et al. similarly modeled a spiropyran system using FEA to simulate a projectile impact in which colorimetric analysis was used to correlate to the von Mises stress calculated from an FEA model (Xia et al., 2019). Colorimetric analysis relies on utilizing a mechanophore which exhibits a color change. Prior work has correlated stresses calculated from FEA to experimental mechanophore activation data (Chen et al., 2020; Chen et al., 2021). In their work, single edge notch experiments were correlated with FEA models containing a cohesive zone model to simulate crack growth. Nominal stresses from the model were correlated to colorimetric absorbance intensity measurements from experiments. While this is a straightforward experimental technique, it utilizes synthetically complex interpenetrating polymer networks that are extremely tough. These materials can be deformed to stresses much greater than the activation stress of the mechanophore. For more brittle materials, like commercially available silicones, it can be difficult to achieve sufficient stress to activate the mechanophore prior to reaching the fracture strength of the network. This lack of mechanophore activation was experimentally observed in single edge notch tensile tests detailed in Supplementary Figure S6. Further, full field absorbance measurements utilized by Chen et al. cannot resolve differences in the 3D stress field through the thickness of the material. In polymer matrix composites, the stress field can often be complex and non-uniform through the thickness. The technique presented here is applicable for more brittle, commercially available networks and can be generalized to any fluorescent mechanophore, including those that exhibit little or no colorimetric response.
Our group has previously reported a method to correlate fluorescence intensity of mechanophore activation from in situ mechanical experiments to hydrostatic stresses from a finite element model (Rencheck et al., 2021). Rigid spherical silica particles were embedded into a commercially available polydimethylsiloxane functionalized with spiropyran to provide a concentrated stress region within the matrix where internal local stresses exceed the fracture toughness of the matrix. The Gc of our SPN functionalized PDMS is 0.13 kJ/m2, an order of magnitude lower than Gc values reported for the multiple network elastomers used by Chen et al. This approach allows for a large stress gradient to be observed within a single field of view, greatly simplifying the calibration procedure. The composite samples were strained uniaxially in tension and the MP activation was observed with a fluorescence microscope. The adhesive strength of the interface between the particle and matrix was varied to observe various failure mechanisms. At high strains, debonding occurred as previously reported by Gent and Park (Gent and Park, 1984). To represent the different failure mechanisms within the FEA model, a carefully constructed cohesive zone model (CZM) was implemented. The traction separation law governing the CZM was adjusted to represent the adhesive strength of the interface. The correlation between hydrostatic stress and fluorescence intensity was then utilized to quantify stresses in the experimental images.
Here, we build upon our previous work and improve the methodology both experimentally and computationally to produce a more user-friendly technique. We optimize our experimental conditions to no longer necessitate the use of complicated cohesive zone models by tailoring the interfacial chemistry between particle and matrix. The computational complexity is further reduced by modeling a smaller portion of the total system. Additionally, the figure of merit reported by our new FEA modeling approach is the maximum principal stress rather than the hydrostatic stress. This subtle change captures shear stresses in the matrix near the particle surface and better represents the mechanophore activation observed experimentally.
In this work, single particle composites were fabricated utilizing silanized silica spheres as stress concentrators embedded in a silicone matrix functionalized with mechanophores. Mechanophore activation was monitored in situ using a confocal fluorescence microscope as the samples were strained under uniaxial tension. The resulting images are correlated to maximum principal stress values calculated from a finite element analysis model utilizing an Ogden hyperelastic model to represent the matrix. A calibration was constructed to allow direct stress measurements from fluorescence intensity values. To demonstrate the utility of this approach, two-particle composite samples were fabricated to validate the capabilities of the technique. FEA modeling of the two-particle system was in good quantitative agreement with the experimental stresses measured from MP intensity. Further experiments were performed on silicone matrix composites containing short cylindrical particles oriented with their major axis parallel or perpendicular to the stretching direction. To demonstrate the universality of the single particle intensity/stress calibration approach, maximum principal stress values were mapped on the fluorescence images of the two particle and cylindrical experiments. This technique has potential to quickly and accurately quantify stress concentrations in new composite designs without the use of FEA models.
To ensure covalent attachment of the polydimethylsiloxane (PDMS) network to the particle surface, the silica particles were treated with vinyltriethoxysilane (VTEOS) (Gelest). Glass particles with diameters of 500 µm ± 50 µm (BioSpec Products) were added to a solution of approximately 5 vol% silane in toluene (Sigma-Aldrich, 99.8%, anhydrous) and reacted at 150 °C for 24 h in a sealed vessel. Particles were triple rinsed with toluene, methanol, and water, successively. Absorbed water was removed by drying the particles at 120°C for 1 h.
Polydimethylsiloxane elastomer (Sylgard 184, Dow) was prepared at a 10 to 1 base to curing agent ratio by mass with 0.6 wt% Nitro-Spiropyran (SPN) (Figure 1A). A concentration of 0.6 wt% results in roughly 6.6 million SPN molecules per cubic micron at an average distance of 6.6 nm from each other. Further details are provided in SI. Nitro-Spiropyran was prepared using a previously reported method (Gossweiler, 2014; Rencheck et al., 2021). The mechanophore was dissolved into xylenes (Acros Organics, 99%, ACS Reagent) at a concentration of 0.05 g/mL to increase solubility in the PDMS. The mechanophore solution was added to the PDMS elastomer base and vortex mixed (LP Vortex Mixer, Thermo Scientific) for 60 s to homogenize the prepolymer. The crosslinker was then added and vortex mixed for an additional 60 s. The mixture was degassed under vacuum for 600 s to remove air bubbles before being cast. Molds were filled with a 1 mm thick layer of the uncured SPN/PDMS mixture and placed in a 70°C oven for 1,200 s to partially cure the PDMS and prevent the silica particles from settling. The particles were manually placed into the samples and an additional 1 mm thick layer of SPN/PDMS was added on top. Samples were cured in a vacuum oven at 70°C for 24 h at 380 mmHg vacuum. Both single particle and two-particle samples were prepared in this manner. Cylindrical particles were fabricated by removing the coating from glass optical fibers (Thorlabs) with a diameter of 400 µm and manually cutting short segments from the fiber. The cylindrical particle-containing composites were fabricated utilizing the same procedure as for the spherical particles (silane functionalization, sample fabrication, and thermal curing).

FIGURE 1. Mechanophore calibration experimental approach. (A) Spiropyran (SPN) mechanophores (MPs) transition from a non-fluorescent, inactive state to a fluorescently active state through an isomerization induced by the application of force. (B) MP activation was observed in situ by mounting a load frame above a laser scanning confocal microscope. Samples were deformed under uniaxial tension while both the force-displacement and fluorescence images were obtained. (C) Uniaxial tension specimens were fabricated by casting a polydimethylsiloxane (PDMS) network functionalized with SPN into sheets containing a single spherical silica particle embedded at the midplane. Dimensions of the specimen are detailed in the schematics of the top and side view of a sample. (D) Image of in situ uniaxial testing setup comprised of a micromechanical load frame mounted over the inverted microscope objective.
Samples were cut manually with a scalpel to dimensions of 10 mm by 30 mm by 2 mm (Figure 1C) and mounted in a micromechanical load frame (µTS, Psylotech) using custom 3D printed grips. The instrument was secured to a custom microscope stage insert and then positioned over the objective of an inverted microscope (SP8, Leica Microsystems) described in more detail below (Figures 1B, D). Samples were strained uniaxially at a rate of 0.1% s−1 in tension until failure.
Fluorescent microscopy images were acquired using a laser scanning confocal microscope (SP8, Leica Microsystems) with a long working distance 5X, NA = 0.15 air objective. A laser (λ = 552 nm) at 0.5 mW power was used to excite the samples. The photomultiplier tube (PMT) detector captured emission wavelengths from 600 nm to 725 nm with a gain of 650 mV. Images (2325 μm by 1,162 μm, 2048 pixels by 1,024 pixels) were acquired at the midplane of the samples with a depth of field of 51.3 μm and a scan time of 1.5 s every 10 s. To account for minor inter-sample differences in mechanophore concentration, fluorescence intensity values were normalized. To normalize fluorescent intensity values, a region of the sample far from the particle was photoactivated using an excitation wavelength of 405 nm at 0.07 mW for 10 s. The subsequent fluorescence intensity value of the photoactivated sample was acquired with the same scan settings and was used to normalize the fluorescent intensity of the mechanophore activation. Normalization was achieved by dividing raw intensity values by this normalization intensity to obtain our normalized intensity values.
FEA computations were completed utilizing Abaqus commercial software (Abaqus/CAE 2021). To simplify the analysis, only one quadrant of the sample is modeled as a 2D cross section (Supplementary Figure S3). Four node hybrid cohesive plane strain elements with reduced integration (CPE4RH) were used to model the PDMS matrix. The constitutive relationship governing material properties was fit to experimental data utilizing a Poisson’s ratio of ν = 0.495 and produced a second order Ogden hyperelastic model with constants of μ1 = 0.4095 MPa, μ2 = 2.43E-2 MPa, α1 = 1.11, and α2 = −6.19 (Ogden, 1972). The model had dimensions of 5 mm by 10 mm. The particle was modeled as a single quadrant with a radius of 250 µm. The particle was also modeled as an elastic solid with a modulus of E = 70 GPa and a Poisson’s ratio of ν = 0.3. Due to the covalent bonding formed at the interface from the silane treatment on the glass particles, we assumed an infinitely strong interface between the particle surface and PDMS matrix (Supplementary Figure S1). The elements at the interface in the model were tied together to create a non-deformable interface. Symmetry boundary conditions were placed on the interior faces of the quadrant to reduce computational complexity. A displacement boundary condition was applied to the top surface with a magnitude of 15 mm to reach a maximum simulated strain of 150%. Further details of the FEA model can be found in the Supplementary Material.
In order to visualize the stresses in a loaded composite system, we fabricated simple composites containing mechanophores in the matrix and a single spherical particle as the reinforcement. We observed the fluorescence activation intensity in situ while applying uniaxial tension to the specimen. To measure the stresses within the system, we constructed an FEA model which utilized an Ogden hyperelastic model to represent the material properties of the matrix. By correlating the experimental fluorescence micrographs to the calculated stress distributions from the FEA at a given strain, we constructed a calibration to measure stresses from any micrograph collected under identical imaging conditions and mechanophore content. We validated our calibration method by comparing the calibrated stress response measured experimentally for a two-particle composite sample to an FEA model which simulated the same system. Upon finding good agreement between the two particle experiments and model, we then applied the same calibration to more complex composites comprised of finite rigid cylinders at different orientations relative to the applied tension.
In our previous work, the interfacial strength between the silica particle and the PDMS matrix was tailored utilizing oxygen plasma irradiation on the surface of the particles and varying the exposure time (Rencheck et al., 2021). While a simple technique for improving adhesion between the particle and matrix, failure still occurred interfacially rather than in the bulk of the matrix, requiring careful treatment of the interfacial debonding in the original FEA by treating the interface with a cohesive zone model. By switching to a silane surface modification, our new composites failed through a cavitation response in the matrix as shown in Supplementary Figure S2. This cavitation indicates that the cohesive strength of the PDMS is lower than the interfacial strength between particle and matrix. This assumption allows for the simplification of our modified FEA model by utilizing a tied interface, rather than a cohesive zone model.
A representative stress strain curve showing the bulk material response as well as the Ogden fit used for the FEA is shown in Figure 2A along with a series of micrographs showing the fluorescence gradient in Figure 2B at various strains. As shown in Figure 2B, there is little change in the fluorescence intensity found in the micrographs between ϵ = 0% i) and ϵ = 75% ii). The mechanophore activation in the sample below this point is below the detection threshold of the imaging technique. Beyond this initial strain period, a significant change in fluorescence intensity occurs as the sample reaches ϵ = 100% iii) and ϵ = 110% iv). After the sample reaches a global strain of approximately 70% where the mechanophore activation is detectable, the intensity begins to increase monotonically with the global strain as evident in the micrographs. In the region immediately adjacent to the particle in the loading direction, a depletion zone occurs where mechanophore activation is significantly lower than expected from previous hydrostatic stress models (Rencheck et al., 2021).
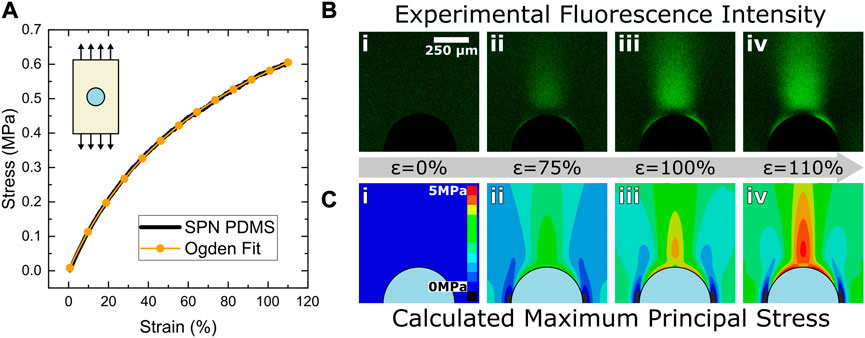
FIGURE 2. Fluorescence and stress evolution during mechanical loading. (A) Bulk material properties were characterized via quasistatic uniaxial tensile testing. The relationship between stress and strain was fit with an Ogden hyperelastic model to determine materials constants for the finite element analysis simulations. The tensile response of a representative test is shown. (B) As the specimen is strained from 0% (i) to 110% (iv), the fluorescence intensity increases, producing a characteristically shaped fluorescence micrograph concentrated in the loading direction as well as at 30° relative to the stretching direction along the sides of the particle. The black semicircle at the bottom of each image is the top half of the particle. The scale bar in (i) applies to all images. (C) Predicted stress evolution through finite element analysis. Maximum principal stress is related to MP activation due to the stress orientation insensitivity observed by MPs. Stress concentrations in the loading direction occur due to tensile stresses while the stress concentration near 30° occurs due to shear stresses near the particle. Inset schematic in (A) indicates the stretching direction applied in image sequences in (B) and (C).
To account for the depletion zone at the poles and capture the off-axis stresses near the particle surface, a different stress descriptor was needed for this study to more accurately represent the observed mechanophore activation. As shown in Supplementary Figure S4A, stress profiles of hydrostatic, von Mises, and maximum principal stresses were overlayed with the fluorescence profile of the composite. Hydrostatic stresses significantly overestimate the stresses near the interface of the particle while both von Mises and maximum principal stresses have a similar depletion zone to experiments. Maximum principal stress was chosen as the stress quantity for this study due to the similarities between the fluorescence contour and the stress contours (Supplementary Figure S4B).
The predicted maximum principal stress from the FEA simulation is shown in Figure 2C for a single particle in a hyperelastic matrix at various strains. At high strain values, the characteristic shape of the mechanophore activation near rigid spheres begins to form (iii). The stresses parallel to the loading direction are responsible for the general shape of the stress concentration in the vertical direction. However, the stress concentration at around 30° relative to the loading direction is induced by shear stresses near the particle surface. The aforementioned depletion zone occurs where the shear stresses overlap the tensile stresses. Hydrostatic stresses fail to incorporate the shear stress contribution to mechanophore activation which necessitated a more representative stress quantity. To better represent the mechanophore activation, we correlated the fluorescence intensity to the maximum principal stress. While this stress quantity does not distinguish the directionality of the stresses, it signifies the largest stress within the polymer matrix at any given point. As mechanophores activate in tension applied across the labile bond, they cannot distinguish stresses that are globally tensile, compressive, or shear in nature. Qualitatively, this stress quantity agrees well with the general shape of the mechanophore activation near the particle.
Comparing the experimental fluorescence intensity gradient to the calculated stress gradients radially at several angles around the particle reveals some interesting behaviors of this system. A 20-pixel wide line scan of the fluorescence intensity was taken from the edge of the particle radially outward into the matrix at 0°, 30°, 45°, and 90° relative to the loading direction at ϵ = 110% as indicated in Figure 3A. Likewise, analogous stress profiles of the maximum principal stress were taken from the FEA model (Figure 3B). Plotting these line scans on the same x-axis (Figure 3C) reveals agreement in the general shape of the intensity and stresses at the various angles. In the loading direction (0°), the maximum fluorescence intensity is found at approximately 110 μm from the particle while the largest stress value is found at 115 μm. At 0° there is some disagreement between the FEA model and the experiment within the first 100 μm from the particle. We theorize that this is a consequence of the assumption of an infinitely strong interface. Without the use of a cohesive zone mode, elements near the interface were overly constrained and experienced higher stress. The normalized background fluorescence intensity is around 0.25 which indicates that for this particular SPN/PDMS system, our calibration is insensitive to stresses below approximately 2.0 MPa (indicated by the grey rectangle). The mobility of the PDMS chains and the activation energy threshold of SPN limits the sensitivity of the technique as well as the detection limit of our confocal microscope. The stresses at 30° and 45° follow the shape of the intensity profile until reaching this threshold stress value, after which the fluorescent signal is indistinguishable from the background.

FIGURE 3. Fluorescence intensity and stress distributions as a function of angle. (A) Fluorescence and (B) FEA images illustrating locations of line scans taken from the edge of the particle and extending radially outward into the matrix at 0°, 30°, 45°, and 90° relative to the loading direction to quantify intensity and stress, respectively. Images are 500 μm by 500 μm. (C) Normalized fluorescence intensity and maximum principal stress as a function of distance from particle surface. The region in grey indicates the region where the background fluorescence intensity dominates the response. This region does not end at a stress value of 0 due to a minimum stress requirement to activate MPs. Once this critical stress value is reached, the MP activation scales with the stress.
Line scans at 0° relative to the loading direction were taken every 10% strain increment from 0% to 110% strain with additional traces every 5% from 75% to 105% for both the FEA and the experimental data. Plotting normalized fluorescence intensity against the calculated maximum principal stress reveals the minimum stress required to activate mechanophores along with the linear relationship between fluorescence intensity and stress above that critical value (Figure 4A) To account for fluorescence reversion and photobleaching of the mechanophore, a vertical shift factor was applied to strains above 75%, where the mechanophores begin to activate. Details of the application of this shift factor are outlined in Supplementary Figure S5 along with photoreversion experimental details. Taking the calibration value above the onset stress, we can assign a stress value to micrographs based on relative intensity values (Figure 4B).
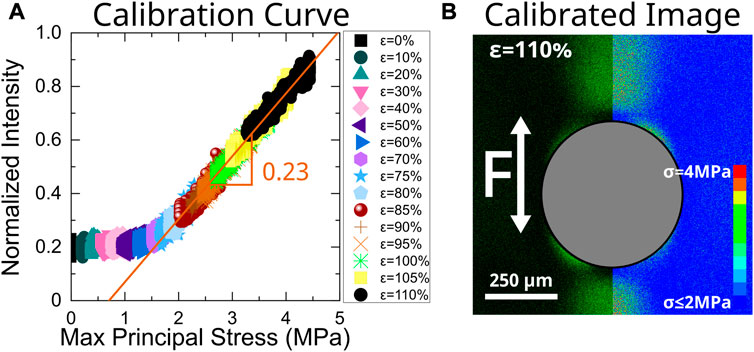
FIGURE 4. Calibration of mechanophore intensity to max principal stress. (A) Line scans at 0° relative to the loading direction were taken from the edge of the particle into the matrix. Due to disagreement between the model and experiment near the particle interface, the first 100 μm of this scan are excluded. Intensity line scans from experiments were plotted against stress line scans obtained from FEA at various strain steps as shown in Figure 3. Intensity values obtained at high strains have been systematically shifted upwards to account for photoreversion of the SPN resulting from repeated imaging. The raw curve and shift factors are shown in Supplementary Figure S4. A linear fit was applied to the data above the mechanophore threshold activation stress (approximately 2 MPa for the sensitivity of the detector and SPN concentration used in this study). Applying this linear fit to our experimental images allows us to create calibrated images (B) of max principal stress in our composite materials. The calibrated image was obtained at an applied engineering strain of 110%.
We applied the calibration for the single particle system to a sample with multiple particles as a validation of the approach. A sample containing two VTEOS functionalized particles was deformed using the same experimental approach. We then normalized fluorescence intensity values before applying our calibration to the micrographs. We observed a strong intensity between the particles resulting from the overlapping stress fields that form at the poles of each particle. We used the particle size and relative initial spacing in the unstrained composite to construct an FEA model of the experiment to validate our technique. The calibrated images in Figure 5 are in good agreement with the FEA model. Stress values of less than 2.0 MPa cannot be measured with our system as that is the SPN activation detection limit of our confocal microscope. While the profile of the stresses in the calibrated images agrees with the FEA model, the measured stresses are lower than expected from the FEA model at high strains. However, as shown in Figure 5A, during the experiment the samples developed cavities between the two particles at strains above 75% that were not observed in our “infinitely strong” FEA matrix. To highlight the sensitivity of our technique and show that the FEA simulation is still in good qualitative agreement with our experiments, an inset of Figure 5B (iv) just prior to cavitation is shown with a rescaled stress color scale. The stress gradient between the particles is qualitatively similar to the FEA result of Figure 5C (iv), though obviously at much lower stress values.
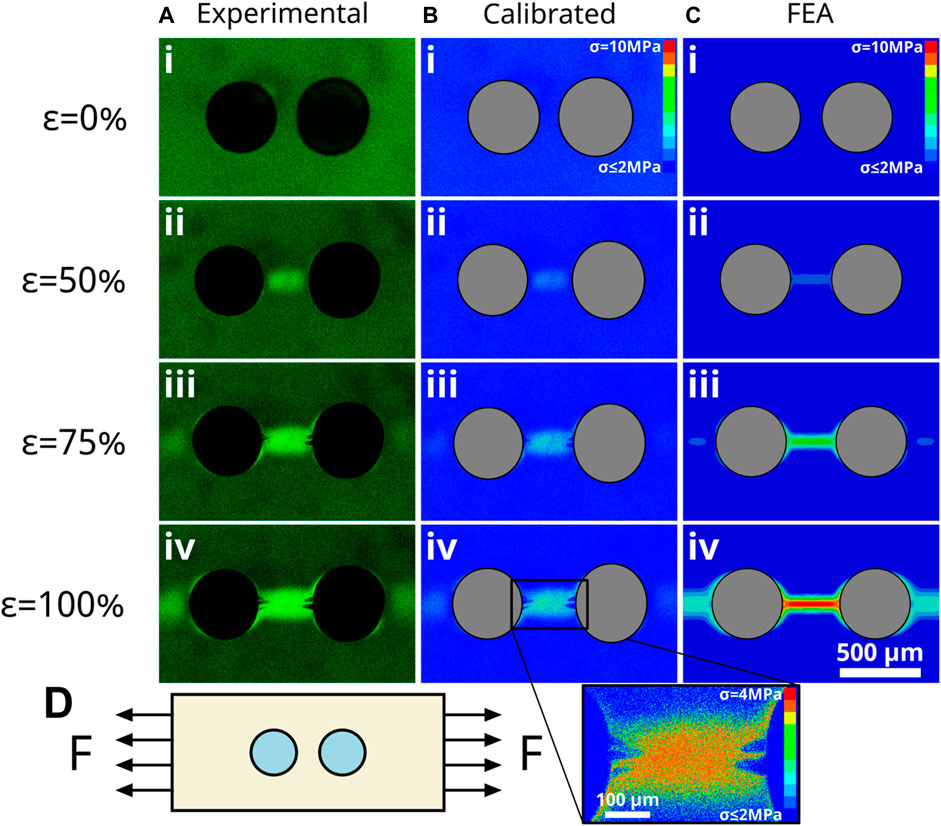
FIGURE 5. Demonstration of MP calibration for two-particle system. (A) In situ fluorescence images obtained for a two-particle composite deformed from 0% to 100% strain as indicated on the left. (B) Corresponding calibrated stress images utilizing calibration determined from single-particle experiments. (C) FEA model of a two-particle system. Scale bar in C.iv applies to all images. (D) Schematic representation of loading orientation.
As demonstrated in Figure 5, highlighting the stress field that develops between two particles in close proximity, the detection of small local stress localizations and gradients is important when evaluating stresses that develop in the matrix between particles or fibers in loaded composites. If the shape of the particles or arrangement of the fibers is irregular, the stress concentrations can be even more acute, as demonstrated by the insets in Figure 6 near a sharp corner. Utilizing a laser scanning confocal microscope enables diffraction-limited resolution of these stress fields to be achieved.
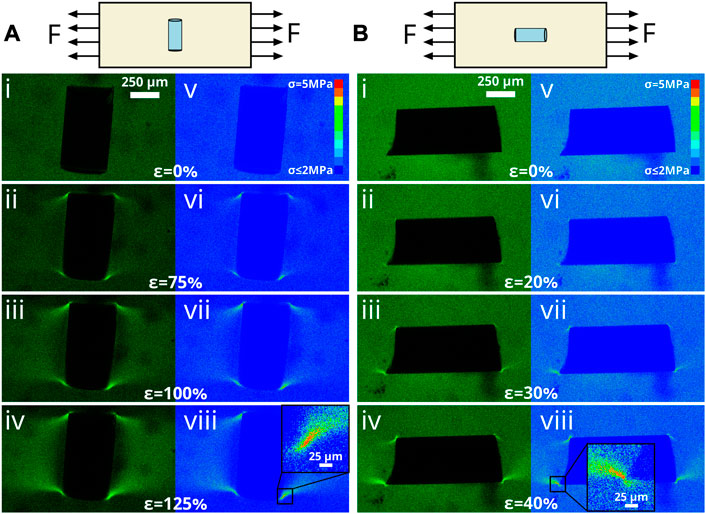
FIGURE 6. Demonstration of MP calibration for varied particle orientations. (A) Mechanical deformation of short glass cylinder perpendicular to loading direction. (i–iv) In situ fluorescence intensity images obtained for a short cylindrical particle deformed from 0% to 125% strain. v–viii) corresponding calibrated stress images utilizing calibration determined from single-particle experiments. Note stress concentrations near sharp edges of cylinder. (B) Mechanical deformation of short glass cylinder parallel to loading direction. (i–iv) In situ fluorescence intensity images obtained for a short cylindrical particle deformed from 0% to 40% strain. (v–viii) corresponding calibrated stress images utilizing calibration determined from single-particle experiments. Due to an especially sharp edge at the bottom left of the cylinder, stress concentrations are observed at significantly lower global strains than observed for rounder particles.
To highlight the capabilities of this technique, more complex composites were constructed utilizing rigid glass cylinders as the reinforcement material. As highlighted in (Figure 6) the particles were oriented both perpendicular (Figure 6A) and parallel (Figure 6B) to the loading direction in the matrix. As the perpendicular sample is strained to 125%, the fluorescence intensity is localized to the sharp edges of the particle as observed in Figure 6A i–iv. Applying the calibration (v–viii), we find that a high stress concentration occurs at these points which is expected by traditional composite wisdom. Likewise, for the parallel configuration, the fluorescence intensity is localized to the edges as the sample is strained (Figure 6B i–iv). However, an especially sharp edge was present in the sample, leading to a failure strain of just over 40%. As shown in the inset in viii, the stress concentration immediately in the vicinity of the sharp tip was significantly higher than the surrounding matrix. This stress concentration becomes the nucleation point for the fracture surface which leads to the ultimate failure of the composite as the crack propagates outward from this point.
By fabricating single particle composites with silanized silica in mechanophore-functionalized polydimethylsiloxane and testing the composite in uniaxial tension, we have created a system that can be modeled simply in FEA. We have demonstrated a technique to correlate fluorescence intensity measurements from experiments to calculated stresses from the FEA. A calibration curve to relate relative fluorescent intensity to maximum principal stress was used to create calibrated images in which stresses can be measured. The technique was validated by replicating the experiment in a two-particle system. The single particle calibration was used to measure the stresses in a two-particle system. The measured stresses were compared against calculated stresses from FEA, and we found good agreement for the simple composites. Additionally, in situ experiments investigating the stress distribution that form around short cylindrical particles were performed and the calibration determined from the single particle composite was applied.
This mechanophore stress calibration technique shows promise as a low cost and simple analysis tool for testing and validating novel composite designs with complex stress distributions. By embedding mechanophores into the matrix and probing optically, the stress distributions can be measured non-destructively. The capability of this technique to be employed in situ shows potential to enhance high throughput mechanical testing of composite prototypes. This work can be extended into other material systems that are industrially relevant for polymer matrix composites. As more mechanoresponsive molecules are synthesized, a method for quickly developing a calibration for the mechanophore response to the local stress in the matrix is essential. These novel mechanophores will be used to quantify stresses in fiberglass reinforced composites as well as other epoxy based structural composites in future studies.
The original contributions presented in the study are included in the article/Supplementary Material, further inquiries can be directed to the corresponding author.
JG designed and performed experiments, performed simulations, analyzed data, and wrote the manuscript. TW performed experiments. H-CC synthesized the mechanophores. C-CC designed the synthesis. CD directed the research and wrote the manuscript. All the authors contributed to the preparation of the manuscript and have approved of the submitted form.
JG and CD acknowledge support from the NSF-CMMI CAREER (Grant #2045908) and the Semiconductor Research Corporation (Project #2878.013). H-CC and C-CC acknowledge support from the Young Scholar Fellowship Program by National Science and Technology (Grant 111-2636-E-A49-015 and 111-2634-F-A49-007)) and the Center for Emergent Functional Matter Science of National Yang Ming Chiao Tung University from The Featured Areas Research Center Program within the framework of the Higher Education Sprout Project by the Ministry of Education (MOE) in Taiwan.
The authors thank Costantino Creton for insightful conversations and guidance when picking a stress quantity to report. We also thank Patrick Thompson and Monali Basutkar for helpful conversations. Thank you to Tyler Roberts for supplying the fracture toughness information for the SPN/PDMS system.
The authors declare that the research was conducted in the absence of any commercial or financial relationships that could be construed as a potential conflict of interest.
All claims expressed in this article are solely those of the authors and do not necessarily represent those of their affiliated organizations, or those of the publisher, the editors and the reviewers. Any product that may be evaluated in this article, or claim that may be made by its manufacturer, is not guaranteed or endorsed by the publisher.
The Supplementary Material for this article can be found online at: https://www.frontiersin.org/articles/10.3389/frsfm.2023.1125163/full#supplementary-material
Beiermann, B. A., Davis, D. A., Kramer, S. L. B., Moore, J. S., Sottos, N. R., and White, S. R. (2011). Environmental effects on mechanochemical activation of spiropyran in linear PMMA. J. Mat. Chem. 21, 8443–8447. doi:10.1039/c0jm03967e
Cao, Z. (2020). Highly stretchable tough elastomers crosslinked by spiropyran mechanophores for strain-induced colorimetric sensing. Macromol. Chem. Phys. 221, 2000190. doi:10.1002/macp.202000190
Carman, G. P., Averill, R. C., Reifsnider, K. L., and Reddy, J. N. (1993). Optimization of fiber coatings to minimize stress concentrations in composite materials. J. Compos. Mat. 27, 589–612. doi:10.1177/002199839302700603
Celestine, A. D. N., Sottos, N. R., and White, S. R. (2019). Strain and stress mapping by mechanochemical activation of spiropyran in poly(methyl methacrylate). Strain 55, e12310. doi:10.1111/STR.12310
Chen, Y., Yeh, C. J., Guo, Q., Qi, Y., Long, R., and Creton, C. (2021). Fast reversible isomerization of merocyanine as a tool to quantify stress history in elastomers. Chem. Sci. 12, 1693–1701. doi:10.1039/d0sc06157c
Chen, Y., Yeh, C. J., Qi, Y., Long, R., and Creton, C. (2020). From force-responsive molecules to quantifying and mapping stresses in soft materials. Sci. Adv. 6, eaaz5093–9. doi:10.1126/sciadv.aaz5093
Davis, C. S., Rencheck, M. L., Woodcock, J. W., Beams, R., Wang, M., Stranick, S., et al. (2021). Activation of mechanophores in a thermoset matrix by instrumented scratch. ACS Appl. Mat. Interfaces 13, 55498–55506. doi:10.1021/ACSAMI.1C15004
Deneke, N., Rencheck, M. L., and Davis, C. S. (2020). An engineer’s introduction to mechanophores. Soft Matter 16, 6230–6252. doi:10.1039/D0SM00465K
Dijkstra, J., Broere, W., and Broere, W. (2010). New method of full-field stress analysis and measurement using photoelasticity. Geotech. Test. J. 33, 102672. doi:10.1520/gtj102672
Gent, A. N., and Park, B. (1984). Failure processes in elastomers at or near a rigid spherical inclusion. J. Mat. Sci. 19, 1947–1956. doi:10.1007/BF00550265
Gossweiler, G., Hewage, G. B., Soriano, G., Wang, Q., Welshofer, G. W., Zhao, X., et al. (2014). Mechanochemical activation of covalent bonds in polymers with full and repeatable macroscopic shape recovery. ACS Macro Lett. 3, 216–219. doi:10.1021/mz500031q
Gossweiler, G. R., Kouznetsova, T. B., and Craig, S. L. (2015). Force-rate characterization of two spiropyran-based molecular force probes. J. Am. Chem. Soc. 137, 6148–6151. doi:10.1021/JACS.5B02492
Grady, M. E., Birrenkott, C. M., May, P. A., White, S. R., Moore, J. S., and Sottos, N. R. (2020). Localization of spiropyran activation. Langmuir 36, 5847–5854. doi:10.1021/acs.langmuir.0c00568
Hedgepeth, J. M., and Van Dyke, P. (1967). Local stress concentrations in imperfect filamentary composite materials. J. Compos. Mat. 1, 294–309. doi:10.1177/002199836700100305
Janeliukstis, R., and Chen, X. (2021). Review of digital image correlation application to large-scale composite structure testing. Compos. Struct. 271, 114143. doi:10.1016/J.COMPSTRUCT.2021.114143
Kim, D. W., Medvedev, G. A., Caruthers, J. M., Jo, J. Y., Won, Y. Y., and Kim, J. (2020a). Enhancement of mechano-sensitivity for spiropyran-linked poly(dimethylsiloxane) via solvent swelling. Macromolecules 53, 7954–7961. doi:10.1021/acs.macromol.0c00985
Kim, T. A., Lamuta, C., Kim, H., Leal, C., and Sottos, N. R. (2020b). Interfacial force-focusing effect in mechanophore-linked nanocomposites. Adv. Sci. 7, 1903464. doi:10.1002/ADVS.201903464
Li, J., Nagamani, C., and Moore, J. S. (2015). Polymer mechanochemistry: From destructive to productive. Acc. Chem. Res. 48, 2181–2190. doi:10.1021/acs.accounts.5b00184
Li, M. (2017). “Mechanoresponsive polymers based on spiropyran mechanophore,” (Hamilton (ON): McMaster University). [dissertation].
Li, M., Zhang, Q., Zhou, Y. N., and Zhu, S. (2018). Let spiropyran help polymers feel force. Prog. Polym. Sci. 79, 26–39. doi:10.1016/J.PROGPOLYMSCI.2017.11.001
Morelle, X. P., Sanoja, G. E., Castagnet, S., and Creton, C. (2021). 3D fluorescent mapping of invisible molecular damage after cavitation in hydrogen exposed elastomers. Soft Matter 17, 4266–4274. doi:10.1039/D1SM00325A
Niggemann, L. P., and Göstl, R. (2022). “Mechanoresponsive functional polymer materials,” in Chemoresponsive materials: Smart materials for chemical and biological stimulation. Editor H. Schneider (London: Royal Society of Chemistry), 604–636. doi:10.1039/9781839166136-00604
Ogden, R. W. (1972). Large deformation isotropic elasticity – On the correlation of theory and experiment for incompressible rubberlike solids. Proc. R. Soc. Lond. A. Math. Phys. Sci. 326, 565–584. doi:10.1098/RSPA.1972.0026
Rencheck, M. L., Mackey, B. T., Hu, Y. Y., Chang, C. C., Sangid, M. D., and Davis, C. S. (2021). Identifying internal stresses during mechanophore activation. Adv. Eng. Mat. 24, 2101080. doi:10.1002/ADEM.202101080
Shannahan, L. S., Lin, Y., Berry, J. F., Barbee, M. H., Fermen-Coker, M., and Craig, S. L. (2021). Onset of mechanochromic response in the high strain rate uniaxial compression of spiropyran embedded silicone elastomers. Macromol. Rapid Commun. 42, 2000449. doi:10.1002/MARC.202000449
Tekieli, M., De Santis, S., de Felice, G., Kwiecień, A., and Roscini, F. (2017). Application of digital image correlation to composite reinforcements testing. Compos. Struct. 160, 670–688. doi:10.1016/J.COMPSTRUCT.2016.10.096
Voloshin, A. S., and Burger, C. P. (1983). Half-fringe photoelasticity: A new approach to whole-field stress analysis. Exp. Mech. 23, 304–313. doi:10.1007/BF02319257
Woodcock, J. W., Beams, R., Davis, C. S., Chen, N., Stranick, S. J., Shah, D. U., et al. (2017). Observation of interfacial damage in a silk-epoxy composite, using a simple mechanoresponsive fluorescent probe. Adv. Mat. Interfaces 4, 1601018. doi:10.1002/ADMI.201601018
Keywords: mechanophore, silicone, composite, stress distribution, mechanics
Citation: Gohl JA, Wiley TJ, Chang H-C, Chang C-C and Davis CS (2023) Stress quantification in a composite matrix via mechanophores. Front. Soft. Matter 3:1125163. doi: 10.3389/frsfm.2023.1125163
Received: 16 December 2022; Accepted: 24 March 2023;
Published: 10 April 2023.
Edited by:
Edwin P. Chan, National Institute of Standards and Technology (NIST), United StatesReviewed by:
Yinjun Chen, Donghua University, ChinaCopyright © 2023 Gohl, Wiley, Chang, Chang and Davis. This is an open-access article distributed under the terms of the Creative Commons Attribution License (CC BY). The use, distribution or reproduction in other forums is permitted, provided the original author(s) and the copyright owner(s) are credited and that the original publication in this journal is cited, in accordance with accepted academic practice. No use, distribution or reproduction is permitted which does not comply with these terms.
*Correspondence: Chelsea S. Davis, Y2hlbHNlYUBwdXJkdWUuZWR1
Disclaimer: All claims expressed in this article are solely those of the authors and do not necessarily represent those of their affiliated organizations, or those of the publisher, the editors and the reviewers. Any product that may be evaluated in this article or claim that may be made by its manufacturer is not guaranteed or endorsed by the publisher.
Research integrity at Frontiers
Learn more about the work of our research integrity team to safeguard the quality of each article we publish.