 Manisha Devi
 Kavyasree A
 Ipsita Pani†
 Santanu Kumar Pal
- Department of Chemical Sciences, Indian Institute of Science Education and Research Mohali, Mohali, India
Aqueous interfaces of stimuli-responsive, thermotropic nematic liquid crystals (LC) have been utilized in the design of biosensing platforms for a range of analytes. Owing to the orientational changes in LC, these interfaces can easily report aptamer-target binding events at the LC-aqueous interface. We demonstrate a label-free, simple and robust technique for the detection of Ochratoxin A (OTA) using aptamer as the recognition probe. The self-assembly of CTAB (cetyltrimethylammonium bromide; cationic surfactant) at aqueous-LC interface gives a homeotropic orientation of LC. In presence of negatively charged OTA specific aptamer, aptamer forms a complex with CTAB. Formation of aptamer-CTAB complex results in ordering transition of LCs to planar/tilted. In presence of OTA, OTA forms a strong and stable G-quadruplex structure of aptamer that results in the redistribution of CTAB at LC-aqueous interface and leads to homeotropic orientation of LC. The designed LC aptasensor exhibits a detection limit of 0.1 nM. We observed that the sensitivity of LC aptasensor was affected by the pH and ionic strength. In addition, we demonstrated the applicability of the designed LC aptasensor for the detection of OTA in tap water and apple juice. This approach offers advantages over the conventional detection methods in terms of fabrication, ease of operation, and analysis.
1 Introduction
Mycotoxins are secondary metabolites produced by different fungal species which are major contaminants of agricultural food products that affect human health adversely. Among various mycotoxins, ochratoxin A (OTA) has gained considerable attention with regards to food safety (Van der Merwe et al., 1965). OTA is a toxic metabolite produced by fungal species such as Penicillium verrucosum and Aspergillus ochraceus, which is present in cereals, such as spices, dried fruits, fruit juices, beer, and wine (Covarelli et al., 2012). OTA is a widely detected fungal toxin in blood plasma proteins because of its long elimination half-life time, and reversible hepatic circulation. OTA has been recognized as mutagenic, neurotoxic, hepatotoxic, teratogenic, nephrotoxic, immunosuppressive, and carcinogenic having effects on animal, rodent, mice, and other mammalian species (Pfohl-Leszkowicz and Manderville, 2007). The Internal Agency for Research on Cancer (IARC) has identified OTA as human carcinogenic agent (group 2B) due to induction of oxidative DNA (Wei et al., 2015). Hence, the presence of OTA even at very low concentrations in agricultural and food products may cause serious toxic effects. Therefore, the detection of OTA in food and agricultural products is of prime importance in food safety, quality control, and human health. There are conventional analytical methods to detect OTA such as high-performance liquid chromatography (HPLC), colorimetric sensing, gas chromatography (GC), antibody-based techniques, and mass spectrometry (MS) etc. (Yu et al., 2005; Reinsch et al., 2007; Tessini et al., 2010; Zhao et al., 2020). Although conventional methods have excellent stability, reliability, and precision in the detection of OTA, these techniques impose some drawbacks which restrict their practical applications such as these are time-consuming, expensive, complex instrumentation, complicated pretreatment of samples, and requirement of trained operators. Hence, the development of alternate sensitive and selective methods is needed in order to overcome these drawbacks.
Nowadays, aptamers integrated with other technologies have attracted considerable attention over antibodies due to their properties including low cost, easy synthesis, chemical stability, and excellent selectivity and sensitivity (Zhou et al., 2017). Most importantly, aptamers have excellent affinity for binding to their targets such as metal ions, proteins, etc. that results in changes in their secondary structures to specific conformational structures. Therefore, aptamers are very promising molecular recognition probes for the development of various biosensors (Liu et al., 2009). In recent years, various biosensors have been developed by integrating the aptamer with liquid crystals (LCs) (Price and Schwartz, 2008; Noonan et al., 2013; Zhou et al., 2016; Verma et al., 2019; Qi et al., 2020; Xu et al., 2020; Yang et al., 2020).
LCs are intermediate state of matter between mobile isotropic liquids and anisotropic solids. The ordering of LC molecules at interfaces is sensitive to the presence of interfacial adsorbates. Changes in the orientation of LC can be amplified into optical signals with the help of polarized optical microscopy (POM) (Gupta et al., 1998; de Gennes and Prost, 1995). Interfaces formed between LC and aqueous phase have been widely utilized for the study of various biochemical interactions at the interfaces including DNA-hybridization, aptamer-target binding, adsorption of proteins and antigen-antibody interactions etc. (Price and Schwartz, 2008; Lin et al., 2011; Ma et al., 2015; Wang et al., 2015; Eimura et al., 2016; Popov et al., 2016; Verma et al., 2019; Pani et al., 2020; Munir et al., 2016; Verma et al., 2020; Devi et al., 2021). The sensing platforms based on LC interfaces are cost effective, robust, easy to handle and can be used in remote locations away from the laboratories by using simple smartphones (Nandi and Pal, 2018). In our previous report, we have integrated the CTAB decorated LC-aqueous interface with aptamer (Pb2+ specific SRNA) to design a LC aptasensor for the detection of Pb2+ (Verma et al., 2019). Here, Pb2+ specific SRNA forms the G-quadruplex in presence of Pb2+ which facilitates the self-assembly of CTAB at LC-aqueous interface and triggers the LC reorientation. Following a similar strategy, in this work, we aimed to detect OTA using aqueous LC interface decorated with an OTA specific aptamer. We have investigated the sensitivity of our LC aptasensor towards the detection of OTA. We have also demonstrated the applicability of our approach using real world samples like tap water and apple juice.
2 Materials and Methods
2.1 Materials
Chemicals such as LC [4-cyano-4′-pentylbiphenyl (5CB)], hexadecyltrimethylammonium bromide (CTAB), thioflavin T (ThT), DMOAP (N,N-dimethyl-N-octadecyl-3-aminopropyltrimethoxysilyl chloride), HEPES (4-(2-hydroxyethyl)-1-piperazineethanesulfonic acid), and OTA used for present study were bought from Sigma-Aldrich (St. Louis,MO). Sodium chloride (NaCl), hydrogen peroxide (H2O2, 30% w/v), and sulfuric acid (H2SO4) were bought from Merck (Mumbai, India). Ethanol (EtOH) was bought from Changshu Hongsheng Fine Chemical Co., Ltd. Deionized water (DI) was used for all the studies which was deionized by Milli-Q-system (Millipore, Bedford, MA). Gold transmission electron microscopy (TEM) grids (283 μm grid spacing, 50 μm wide bars, and 20 μm thickness) were bought from Electron Microscopy Sciences (Fort Washington, PA). Glass microscopic slides were bought from Fischer Scientific (Pittsburgh, PA).
Single-stranded DNA (OTA specific aptamers) with sequence GGGGTGAAACGGGTCCCG (OTA wt) was purchased from Europhins Genomics India Pvt. Ltd.
2.2 Experimental Methods
2.2.1 Preparation of Aqueous Solutions of CTAB, Aptamer, and Ochratoxin A
Aqueous solutions of CTAB (1 mM) and OTA (1.24 mM) were prepared by dissolving an accurately weighed amount in 1 mM HEPES (pH = 7.4). A stock solution of OTA specific aptamer (425 μM) was diluted with 1 mM HEPES solution containing 10 mM NaCl (pH = 7.4) at room temperature for further experiments. A complex of CTAB and aptamer was prepared by incubating certain volumes from their stock solutions for 30 min to yield the desired final concentration. To detect the OTA, equal volumes of aqueous solution of OTA and aptamer were incubated for 1.5 h followed by the addition of same volume of CTAB stock solution. The final concentration of CTAB and aptamer remains 7 μM and 100 nM respectively with different concentrations of OTA (250–0.01 nM). A similar procedure was followed to study the effect of ionic strength and pH of HEPES buffer by varying the pH from 5 to 9 and ionic strength of buffer from 1 to 100 mM.
Samples for the detection of OTA in tap water and apple juice were prepared by spiking the tap water and apple juice with 250 nM OTA. Apple juice was diluted with same volume of 1 mM HEPES buffer before use.
2.2.2 Pretreatment of Glass Slides with DMOAP
Prior to DMOAP coating, glass slides were treated with piranha solution [consist of 70% H2SO4 and 30% H2O2] for 45 min at 80 °C according to the reported procedure (Brake and Abbott, 2002). Then the glass slides were washed with an excess amount of DI water and ethanol followed by drying under N2 stream. Then, the glass slides were kept in an oven at 120 °C for 3–4 h (Note: Piranha solution reacts with organic materials that may cause explosion. Therefore, it should be handled with extra care and neutralized carefully before disposal. Never keep the piranha solution in closed vessels.) The “piranha-cleaned” glass slides were further modified with DMOAP following a previous report (Verma et al., 2019). Briefly, at room temperature, the glass slides were placed in aqueous solution of DMOAP (0.1%, v/v) for 30 min. After this, the glass slides were washed with excess amount of DI water to remove the extra DMOAP from the glass surface and dried under N2 stream before heating at 100 °C for 3–4 h.
2.2.3 Preparation of LC Films and Optical Cells
The cleaned gold TEM grids were mounted on the DMOAP treated glass slide of size 1.5 × 1.5 cm2. Then, 1 μL of 5CB was poured onto TEM grid using a Hamilton microsyringe and the extra 5CB was removed by using a syringe to obtain uniform distribution of 5CB on the surface. DMOAP induced the perpendicular alignment of LC to the glass substrate which gives dark appearance under crossed polarizers. A drop of 100 μl aqueous solution of interest was carefully made on to the TEM grid hosted with LC at DMOAP coated glass substrate (Verma et al., 2019). The orientational changes of LC were analyzed under a Zeiss polarizing microscope (Scope. A1). Images were obtained with an AxioCam camera. Average grayscale intensity of the images obtained from polarized microscope was measured by processing at least 4 squares of TEM grid using ImageJ free access software developed by U. S. National Institutes of Health, Bethesda, MD.
2.2.4 Steady-State Fluorescence of ThT
Fluorescence spectra were measured on fluorescence spectrophotometer (Shimadzu RF-6000) at λex (excitation wavelength) of 440 nm. Final concentrations of OTA specific aptamer, OTA, and ThT were 500 nM each. Samples were prepared by incubation of OTA specific aptamer and ThT for 1.5 h followed by addition of OTA.
2.2.5 Circular Dichromism Measurements
The CD spectra were obtained from Chirascan CD spectrophotometer (Applied Photophysics, United Kingdom) in a scan range of 250–280 nm and step size of 1 nm. A quartz cell (1 mm path length) was used for recording the CD spectra of solution. CD spectra of CTAB, preincubated mixture of OTA specific aptamer and CTAB in presence and absence of OTA were recorded. Final concentrations of CTAB, aptamer, and OTA are 7 μM, 5 μM, and 5 µM, respectively. For each sample, the spectra were corrected against the buffer signal and averaged over 3 scans using the ProData software of CD instrument.
3 Results and Discussion
3.1 Fabrication of LC Aptasenosr at Aqueous Interface
Previous studies showed that the orientation of LCs at LC-aqueous interface is influenced by the presence of various amphiphiles (lipids and surfactants etc.) (Brake et al., 2003; Price and Schwartz, 2007). Therefore, our first set of experiment was designed to determine the minimum desirable concentration of a cationic CTAB to obtain a homeotropic orientation of LC. For this, LC film was prepared by introducing 5CB onto the gold TEM grid which was supported on a DMOAP functionalized glass slide. DMOAP is a well-known alignment agent that induces a homeotropic alignment of LC (dark image under crossed polarizers) at LC-air interface (Verma et al., 2019). In presence of aqueous solution (HEPES buffer, pH = 7.4), a bright image was obtained under crossed polarizers that corresponds to the planar/tilted alignment of the LC molecules. However, on introduction of aqueous solution of CTAB, LC molecules adopt a homeotropic alignment that gives a dark optical micrograph as shown in Figure 1A. This homeotropic alignment of LC in contact with CTAB is a result of hydrophobic interactions between LC and alkyl chains of CTAB which favors the self-assembly of the CTAB at LC-aqueous interface (Brake and Abbott, 2002; Brake et al., 2003; Price and Schwartz, 2007). On varying the CTAB concentration (0–9 μM), we found that 7 μM is the minimum desirable concentration of CTAB at which homeotropic orientation of LC is attained within 1 min and remains stable up to 30 min (observed time), as shown in Figure 1A; Supplementary Figure S1. Therefore, for further experiments, 7 μM CTAB concentration was used to decorate the LC-aqueous interface (Verma et al., 2019). Our next aim was to observe the alignment of the LC in contact with CTAB and OTA specific aptamer (i.e., formation of CTAB-aptamer complex) at LC-aqueous interface. For this, we prepared the OTA specific aptamer solution in HEPES buffer containing 10 mM sodium chloride (NaCl) to minimize the repulsive interactions of base pairs of the aptamer (Xu et al., 2020). It was observed that on varying the concentration of OTA specific aptamer from 300 to 50 nM in pre-incubated CTAB-aptamer complex, LC remained in planar orientation upto 30 min at higher aptamer concentrations (300–100 nM) (Figure 1B; Supplementary Figure S2). However, at lower aptamer concentrations, LC orientation turned more towards homeotropic alignment. These results indicate that 100 nM aptamer concentration was sufficient for effective adsorption of the aptamer at aqueous-LC interface. This can be attributed to the ionic interactions between the CTAB and aptamer perturbing the organization of CTAB at LC-aqueous interface (Price and Schwartz, 2008). Hence, for further experiments, the optimum concentration of OTA specific aptamer used was 100 nM.
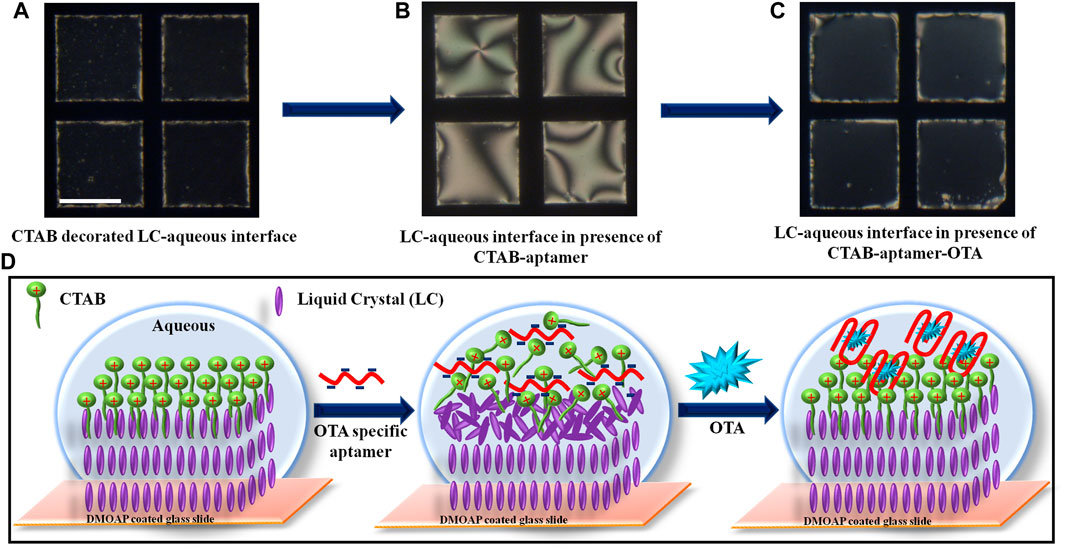
FIGURE 1. Polarized optical images of LC-aqueous interface in contact with (A) 7 μM CTAB after 30 min, (B) preincubated mixture of CTAB and OTA specific aptamer (final concentration 7 μM and 100 nM, respectively) after 30 min, and (C) preincubated mixture of CTAB, OTA specific aptamer, and OTA (final concentration 7 μM, 100 nM, and 250 nM, respectively) after 1 min. Scale bar = 200 μm. (D) Schematic representation of proposed design of label free detection of OTA using aptamer as a recognition probe at LC-aqueous interface (cartoon pictures not to scale).
3.2 Detection of OTA Using LC Aptasensor
Our next step was to examine the ordering of LC at CTAB-OTA specific aptamer decorated aqueous-LC interface in presence of OTA. In the presence of 250 nM OTA, planar orientation of LC (due to complexation of CTAB-OTA specific aptamer at LC-aqueous interface) transitioned to homeotropic immediately within 1 min that leads to the dark optical image under crossed polarizers (Figure 1C). This change in orientation of LC is probably due to the change in the configuration of DNA structure induced by the presence of the OTA which facilitates the self-assembly of surfactant at the LC-aqueous interface. This self-assembly of CTAB results in homeotropic ordering of LC with dark appearance under crossed polarizers. Figure 1D illustrates the schematic representation of the designed LC aptasensor for the detection of OTA at LC-aqueous interface corresponding to the optical images shown in Figures 1A–C. To examine the configurational changes in the secondary structure of DNA in presence of OTA, we performed CD measurements in solution phase. We recorded the CD spectra of CTAB, pre-incubated mixture of aptamer and CTAB in the presence and absence of OTA (Figure 2A). In presence of OTA, a change in ellipticity has been observed that reveals the stabilization of G-quadruplex configuration of aptamer in presence of OTA (Lv et al., 2017). These results were further supported by the ThT binding assay. ThT is a non-emissive, water soluble dye that is known to bind selectively with G-quadruplexes, and result in significant enhancement of fluorescence intensity. We have observed that ThT is non-emissive in buffer solution while in presence of aptamer emits strong fluorescence at 485 nm at λex = 440 nm. However, upon addition of OTA to the above ThT-aptamer solution, fluorescence intensity of ThT decreased significantly. This confirmed the release of ThT upon the competitive binding of OTA into the G-quadruplex (Figure 2B). Our results are in good agreement with a previous report (Wu et al., 2018). This suggests that OTA strongly binds and stabilizes the G-quadruplex motif in aptamer and displaced the ThT from the complex formed by ThT and aptamer as shown in Figure 2C. The above experimental results suggest that hydrophobic interactions between LC and alkyl tails of CTAB molecules results in the dark appearance of LC (homeotropic ordering). In presence of the aptamer, electrostatic interactions take place between aptamer and CTAB to form CTAB-aptamer complex. Hence, self-organization of CTAB at aqueous-LC interface is precluded resulting in a tilted/planar orientation of LC (bright image). However, the ordering of LC changes to homeotropic in presence of OTA which is mainly due the competitive binding between OTA and CTAB with aptamer at LC-aqueous interface.
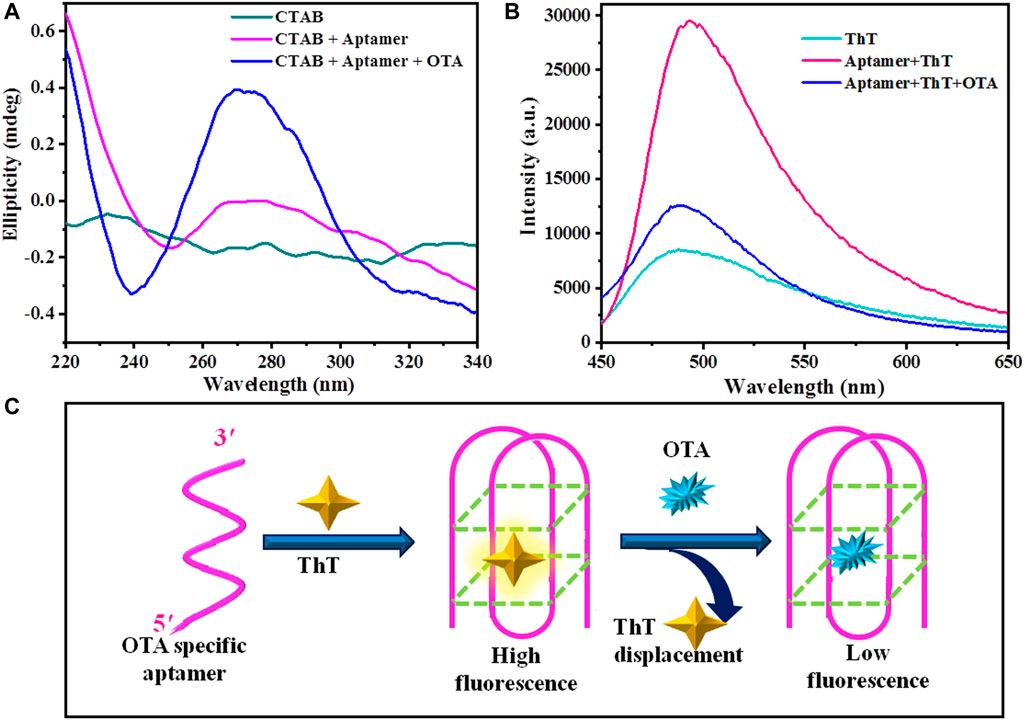
FIGURE 2. (A) CD spectra of CTAB, pre-incubated mixture of aptamer and CTAB in presence and absence of OTA; (final concentration of CTAB, aptamer, and OTA: 7 μM, 5 μM and 7 μM, respectively). (B) Fluorescence spectra of ThT (500 nM), ThT (500 nM) incubated with aptamer (500 nM) in the absence and presence of OTA (500 nM). (C) Cartoon schematic illustrates the OTA triggered displacement of ThT from the aptamer G-quadruplex that results in the quenching of ThT fluorescence.
3.3 Response Time and Detection Limit of LC Aptasensor
Next, we were interested to investigate the sensitivity and response time of LC aptasensor towards the detection of OTA. We varied the concentration of OTA and measured the response time of LC at aqueous interface. Figure 3 reveals that response time of LC-aptasensor increases with decrease in the concentration of OTA. At higher concentration of OTA (250 nM) homeotropic orientation was observed within 1 min. At OTA concentrations of 100–50 nM, homeotropic orientation was observed within 5–10 min. Similarly, for 30–10 nM OTA, response time increased to 20 min. Further decreasing the concentration of OTA increased the response time to 30 min. However, at concentrations of 1–0.1 nM OTA, we could not observe complete homeotropic alignment of LC at 30 min (mostly homeotropic alignment of LC). Below this OTA concentration, we did not observe a homeotropic alignment of LC. Based on these results, the detection limit of LC aptasensor towards the detection of OTA was found to be 0.1 nM. The performance of the LC aptasensor is dictated by the competitive binding between CTAB-aptamer and aptamer-OTA. From our experiments, we found that aptamer-OTA interactions direct the self-assembly of CTAB at aqueous-LC interface. At higher concentration of the OTA, aptamer-OTA interactions are higher, hence, CTAB is easily available to self-assemble at LC-aqueous interface that result in the fast response, and reorientation of LC. On decreasing the concentration of OTA, the self-assembly of CTAB at LC-aqueous interface is prolonged resulting in slow ordering transition of LC, and hence slow response time of LC aptasensor. Our observations indicate that the response time of the LC-aptasensor towards the detection of OTA mainly depends upon the kinetics of the CTAB self-assembly at LC-aqueous interface.
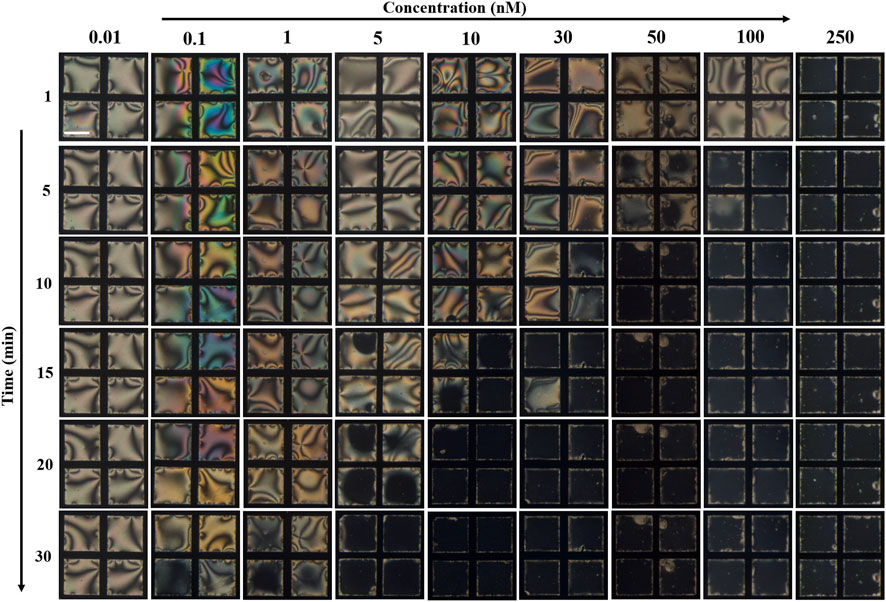
FIGURE 3. Polarized optical images of LC-aqueous interface decorated with 100 nM aptamer and 7 μM CTAB showing dynamic response of LC upon introduction of different concentrations of OTA (0.1–250 nM) at different time intervals. Scale bar = 200 μm.
For the quantitative analysis, we measured the GI (average grayscale intensity) of optical images captured at different time intervals for different concentrations of OTA. From Figure 4A it can be seen that GI decreased immediately for the concentration of 250 nM OTA. For 100–50 nM concentrations of OTA, GI decreased within 5–10 min. GI values decreased to lowest within 15–30 min for 30–5 nM concentrations of OTA. For 1–0.1 nM OTA concentrations, GI decreased slowly. On further decreasing the concentration to 0.01 nM of OTA, there was no significant change in the GI values. Supplementary Figure S3 reveals the comparison of GI at different concentrations of OTA after 30 min. It was observed that GI values remain lowest from 250 to 5 nM OTA corresponding to the homeotropic orientation of LC. For 1–0.1 nM concentrations of OTA, GI increased and becomes highest at 0.01 nM OTA. This suggests that at 1–0.1 nM OTA, the orientation of LC is not perfectly homeotropic (intermediate between homeotropic and planar). At 0.01 nM concentration of OTA, highest GI corresponds to the planar orientation of LC. These results are in good agreement with optical images. Figure 4B reveals a linear correlation between GI and logarithm of OTA concentration in the range of 0.1–250 nM. Based on our results, detection limit of designed LC aptasensor for the detection of OTA was found as 0.1 nM (0.037 ppb) with detection range of 0.1–250 nM (0.037–92 ppb) which is well below the maximum permissible level for OTA concentration in apple juice (20 ppb) (Al-Hazami, 2010). Therefore, the analysis of GI provides a tool for the quantification of OTA concentration. We have compared the detection limit of the designed aptasensor based on LC-aqueous interface with the recently reported aptasensors based on different approaches in Table 1.
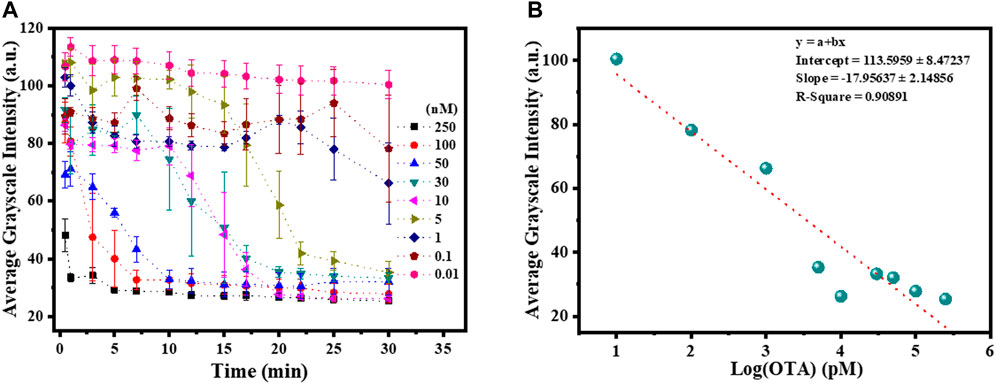
FIGURE 4. (A) Plot representing the average grayscale intensity (GI) of the polarized optical micrographs as a function of time at different concentrations of OTA by considering four squares in a grid. (B) Plot showing a linear correlation between the log concentration of OTA and GI of the LC aptasensor at 30 min.
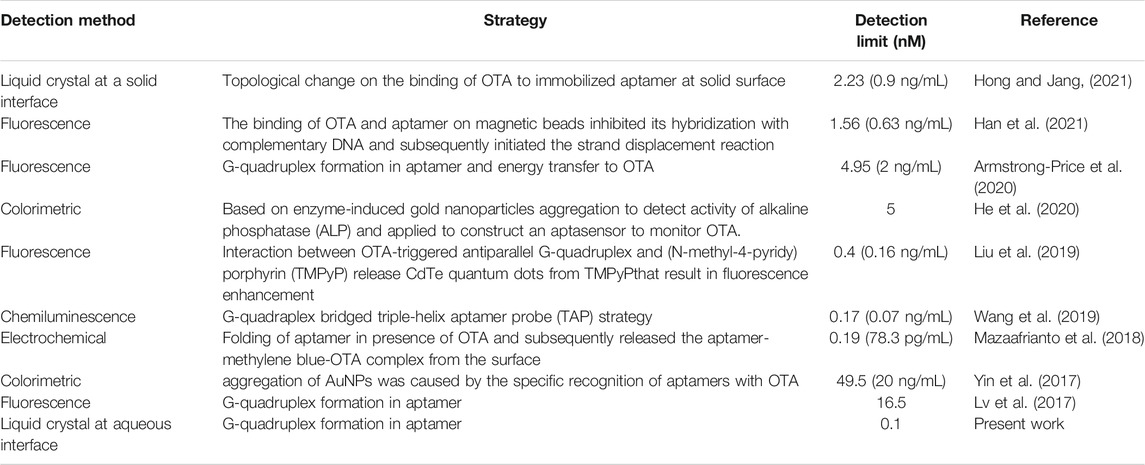
TABLE 1. Comparison of aptamer-based methods for the detection of ochratoxin A.
3.4 Effect of pH and Ionic Strength of Buffer Towards Detection of OTA
Next, we were interested to see the effect of pH and ionic strength of the buffer towards the detection of OTA using LC-aptasensor. We found that in presence of 7 μM of CTAB, LC remains homeotropic at pH 5 to 9 presented in Supplementary Figure S1, S4. In presence of aptamer, homeotropic orientation of LC triggers to planar orientation at pH 5 and 7.4. However, at pH 9 in presence of aptamer, we observed mixed domains of planar and homeotropic orientation of LC (Supplementary Figure S2, S5). Hence, we performed the experiment for the detection of OTA (250 nM) at pH 5. We observed the LC reorientation from planar to homeotropic in presence of 250 nM OTA at pH 5. However, the response of the LC aptasensor was found to be slow at pH 5 in comparison to pH 7.4 (Figure 3; Supplementary Figure S6). Next, we performed the experiments to see the effect of ionic strength of the HEPES buffer in the range of 1–100 mM. We observed that at 1–100 mM range of ionic strength of HEPES buffer, LC remained homeotropic in presence of 7 μM CTAB (Supplementary Figure S7). In presence of CTAB-aptamer complex, LC shows the planar orientation at 1–30 mM buffer, on the other hand, at higher buffer strength, coexisting bright and dark LC domains were observed (Supplementary Figure S8). These results are in good agreement with our previous report (Verma et al., 2019). It was shown previously that the higher ionic strength of the buffer screened the electrostatic interactions between the CTAB molecules that leads to the tight packing of surfactant monolayer at LC-aqueous interface (Noonan et al., 2013). As LC remained planar with bright appearance at 1, 10, and 30 mM buffer in presence of CTAB-aptamer complex, therefore, we performed experiments for the detection of OTA at 1–30 mM buffer strength. As shown in Figure 3; Supplementary Figures S9, S10, homeotropic orientation of LCs was observed in presence of OTA (250 and 100 nM). The response time of the designed LC aptasensor increased with increase in ionic strength of HEPES buffer.
3.5 Practical Applicability of LC-Aptasensor
High sensitivity of the LC aptasensor motivated us to investigate the practical applications of designed LC aptasensor for detection of OTA in real samples (tap water and apple juice). We spiked the tap water and apple juice with 250 nM OTA. We observed that the LC remained homeotropic when 7 μM CTAB was incubated with tap water and apple juice respectively (Figures 5A,D; Supplementary Figures S11A, S12A). In presence of pre-incubated 7 μM CTAB, 100 nM aptamer, and tap water/apple juice (without OTA), LC exhibits the planar orientation (Figures 5B,E; Supplementary Figures S11B, S12B). However, when tap water/apple juice spiked with OTA (250 nM) was pre-incubated with aptamer and CTAB, LC orientation changed to homeotropic with dark optical appearance (Figures 5C,F; Supplementary Figures S11C, S12C). These results suggest the applicability of the designed LC aptasensor towards the detection of OTA in real samples.
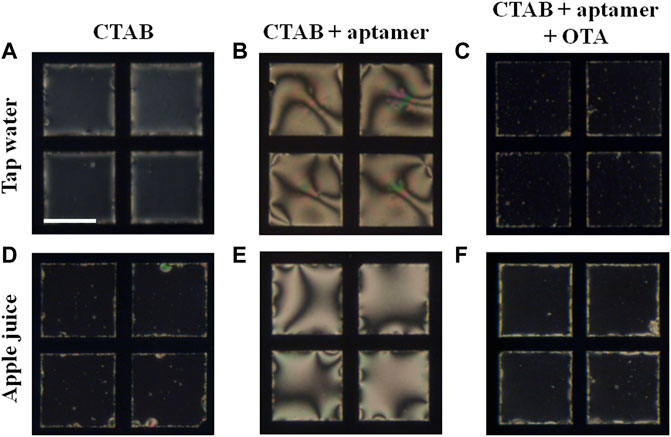
FIGURE 5. Detection of OTA in presence of (A–C) tap water and (D–F) apple juice. Polarized optical images of LC-aqueous interface laden with (A,D) 7 μM CTAB, (B,E) 7 μM CTAB and 100 nM aptamer, and (C,F) 7 μM CTAB, 100 nM aptamer, and 250 nM OTA. All the images shown here were captured after 30 min of addition. The time lapse polarized optical images for tap water and apple juice have been shown in Supplementary Figures S11, S12, respectively. Scale bar = 200 μm.
4 Conclusion
We reported a simple, label-free, and robust LC sensor for the detection of OTA using aptamer as a recognition probe in aqueous medium. The design of this sensor is based on the distinct orientations obtained by the LC that depends on the stabilization and formation of G-quadruplex by OTA which is proved by CD measurements and ThT binding assay. The detection limit of OTA was found to be 0.1 nM. We investigated the performance of our LC aptasensor at variable pH and ionic strength. Lastly, we demonstrated the applicability of our LC aptasensor towards the detection of OTA in real samples such as tap water and apple juice. This designed LC aptasensor offers advantages in terms of fabrication, ease of operation and analysis.
Data Availability Statement
The original contributions presented in the study are included in the article/Supplementary Material, further inquiries can be directed to the corresponding author.
Author Contributions
MD contributes in conceptualization, methodology, investigation, data analysis, and manuscript writing. KA performed experiments and analyzed data. IP contributes in conceptualization, data analysis, and manuscript writing. SS contributes in data analysis of few experiments. SKP contributes in editing and finalization of the manuscript, administered the project, and manages funding for completion of project.
Acknowledgments
SKP is grateful for the financial support from MHRD-STARS grant (File no. STARS/APR2019/CS/284/FS). MD acknowledges IISER Mohali for postdoctoral fellowship. KA acknowledges the receipt of an INSPIRE scholarship from DST, Govt. of India. IP is grateful to IISER Mohali for providing graduation fellowship. SS acknowledges the CSIR (09/0947(12388)/2021-EMR-I) for fellowship.
Conflict of Interest
The authors declare that the research was conducted in the absence of any commercial or financial relationships that could be construed as a potential conflict of interest.
Publisher’s Note
All claims expressed in this article are solely those of the authors and do not necessarily represent those of their affiliated organizations, or those of the publisher, the editors and the reviewers. Any product that may be evaluated in this article, or claim that may be made by its manufacturer, is not guaranteed or endorsed by the publisher.
Supplementary Material
The Supplementary Material for this article can be found online at: https://www.frontiersin.org/articles/10.3389/frsfm.2022.835057/full#supplementary-material
References
Al-Hazmi, N. A. (2010). Determination of Patulin and Ochratoxin A Using HPLC in Apple Juice Samples in Saudi Arabia. Saudi J. Biol. Sci. 17, 353–359. doi:10.1016/j.sjbs.2010.06.006
Armstrong-Price, D. E., Deore, P. S., and Manderville, R. A. (2020). Intrinsic "Turn-On" Aptasensor Detection of Ochratoxin A Using Energy-Transfer Fluorescence. J. Agric. Food Chem. 68, 2249–2255. doi:10.1021/acs.jafc.9b07391
Brake, J. M., and Abbott, N. L. (2002). An Experimental System for Imaging the Reversible Adsorption of Amphiphiles at Aqueous−Liquid Crystal Interfaces. Langmuir 18, 6101–6109. doi:10.1021/la011746t
Brake, J. M., Mezera, A. D., and Abbott, N. L. (2003). Effect of Surfactant Structure on the Orientation of Liquid Crystals at Aqueous−Liquid Crystal Interfaces. Langmuir 19, 6436–6442. doi:10.1021/la034132s
Covarelli, L., Beccari, G., Marini, A., and Tosi, L. (2012). A Review on the Occurrence and Control of Ochratoxigenic Fungal Species and Ochratoxin A in Dehydrated Grapes, Non-Fortified Dessert Wines and Dried Vine Fruit in the Mediterranean Area. Food Control 26, 347–356. doi:10.1016/j.foodcont.2012.01.044
de Gennes, P. J., and Prost, J. (1995). The Physics of Liquid Crystals. 2nd ed. New York: Oxford University Press.
Devi, M., Verma, I., and Pal, S. K. (2021). Distinct Interfacial Ordering of Liquid Crystals Observed by Protein-Lipid Interactions that Enabled the Label-free Sensing of Cytoplasmic Protein at the Liquid crystal-aqueous Interface. Analyst 146, 7152–7159. doi:10.1039/D1AN01444G
Eimura, H., Miller, D. S., Wang, X., Abbott, N. L., and Kato, T. (2016). Self-Assembly of Bioconjugated Amphiphilic Mesogens Having Specific Binding Moieties at Aqueous-Liquid Crystal Interfaces. Chem. Mater. 28, 1170–1178. doi:10.1021/acs.chemmater.5b04736
Gupta, V. K., Skaife, J. J., Dubrovsky, T. B., and Abbott, N. L. (1998). Optical Amplification of Ligand-Receptor Binding Using Liquid Crystals. Science 279, 2077–2080. doi:10.1126/science.279.5359.2077
Han, B., Fang, C., Sha, L., Jalalah, M., Al-Assiri, M. S., Harraz, F. A., et al. (2021). Cascade Strand Displacement Reaction-Assisted Aptamer-Based Highly Sensitive Detection of Ochratoxin A. Food Chem. 338, 127827. doi:10.1016/j.foodchem.2020.127827
He, Y., Tian, F., Zhou, J., Zhao, Q., Fu, R., and Jiao, B. (2020). Colorimetric Aptasensor for Ochratoxin A Detection Based on Enzyme-Induced Gold Nanoparticle Aggregation. J. Hazard. Mater. 388, 121758. doi:10.1016/j.jhazmat.2019.121758
Hong, P. T. K., and Jang, C.-H. (2021). A Liquid Crystal Sensor Supported on an Aptamer-Immobilized Surface for Specific Detection of Ochratoxin A. IEEE Sensors J. 21, 27414–27421. doi:10.1109/JSEN.2021.3126170
Lin, I.-H., Miller, D. S., Bertics, P. J., Murphy, C. J., de Pablo, J. J., and Abbott, N. L. (2011). Endotoxin-Induced Structural Transformations in Liquid Crystalline Droplets. Science 332, 1297–1300. doi:10.1126/science.1195639
Liu, J., Cao, Z., and Lu, Y. (2009). Functional Nucleic Acid Sensors. Chem. Rev. 109 (5), 1948–1998. doi:10.1021/cr030183i
Liu, L., Tanveer, Z. I., Jiang, K., Huang, Q., Zhang, J., Wu, Y., et al. (2019). Label-Free Fluorescent Aptasensor for Ochratoxin-A Detection Based on CdTe Quantum Dots and (N-Methyl-4-Pyridyl) Porphyrin. Toxins 11, 447. doi:10.3390/toxins11080447
Lv, L., Li, D., Liu, R., Cui, C., and Guo, Z. (2017). Label-free Aptasensor for Ochratoxin A Detection Using SYBR Gold as a Probe. Sens. Actuators B: Chem. 246, 647–652. doi:10.1016/j.snb.2017.02.143
Ma, C. D., Adamiak, L., Miller, D. S., Wang, X., Gianneschi, N. C., and Abbott, N. L. (2015). Liquid Crystal Interfaces Programmed with Enzyme-Responsive Polymers and Surfactants. Small 11, 5747–5751. doi:10.1002/smll.201502137
Mazaafrianto, D. N., Ishida, A., Maeki, M., Tani, H., and Tokeshi, M. (2018). Label-free Electrochemical Sensor for Ochratoxin A Using a Microfabricated Electrode with Immobilized Aptamer. ACS Omega 3, 16823–16830. doi:10.1021/acsomega.8b01996
Munir, S., and Park, S.-Y. (2016). Liquid Crystal-Based DNA Biosensor for Myricetin Detection. Sens. Actuators B: Chem. 233, 559–565. doi:10.1016/j.snb.2016.04.107
Nandi, R., and Pal, S. K. (2018). Liquid Crystal Based Sensing Device Using a Smartphone. Analyst 143, 1046–1052. doi:10.1039/C7AN01987D
Noonan, P. S., Roberts, R. H., and Schwartz, D. K. (2013). Liquid Crystal Reorientation Induced by Aptamer Conformational Changes. J. Am. Chem. Soc. 135, 5183–5189. doi:10.1021/ja400619k
Pani, I., Madhu, P., Najiya, N., Aayush, A., Mukhopadhyay, S., and Pal, S. K. (2020). Differentiating Conformationally Distinct Alzheimer's Amyloid-β Oligomers Using Liquid Crystals. J. Phys. Chem. Lett. 11, 9012–9018. doi:10.1021/acs.jpclett.0c01867
Pfohl-Leszkowicz, A., and Manderville, R. A. (2007). Ochratoxin A: An Overview on Toxicity and Carcinogenicity in Animals and Humans. Mol. Nutr. Food Res. 51, 61–99. doi:10.1002/mnfr.200600137
Popov, P., Honaker, L. W., Kooijman, E. E., Mann, E. K., and Jákli, A. I. (2016). A Liquid crystal Biosensor for Specific Detection of Antigens. Sens. Bio-Sens. Res. 8, 31–35. doi:10.1016/j.sbsr.2016.03.008
Price, A. D., and Schwartz, D. K. (2007). Fatty-Acid Monolayers at the Nematic/Water Interface: Phases and Liquid-Crystal Alignment. J. Phys. Chem. B 111, 1007–1015. doi:10.1021/jp066228b
Price, A. D., and Schwartz, D. K. (2008). DNA Hybridization-Induced Reorientation of Liquid Crystal Anchoring at the Nematic Liquid Crystal/Aqueous Interface. J. Am. Chem. Soc. 130, 8188–8194. doi:10.1021/ja0774055
Qi, L., Liu, S., Jiang, Y., Lin, J.-M., Yu, L., and Hu, Q. (2020). Simultaneous Detection of Multiple Tumor Markers in Blood by Functional Liquid Crystal Sensors Assisted with Target-Induced Dissociation of Aptamer. Anal. Chem. 92, 3867–3873. doi:10.1021/acs.analchem.9b05317
Reinsch, M., Töpfer, A., Lehmann, A., Nehls, I., and Panne, U. (2007). Determination of Ochratoxin A in Beer by LC-MS/MS Ion Trap Detection. Food Chem. 100, 312–317. doi:10.1016/j.foodchem.2005.10.005
Tessini, C., Mardones, C., von Baer, D., Vega, M., Herlitz, E., Saelzer, R., et al. (2009). Alternatives for Sample Pre-treatment and HPLC Determination of Ochratoxin A in Red Wine Using Fluorescence Detection. Anal. Chim. Acta 660, 119–126. doi:10.1016/j.aca.2009.11.011
Van der Merwe, K. J., Steyn, P. S., Fourie, L., Scott, D. B., and Theron, J. J. (1965). Ochratoxin A, a Toxic Metabolite Produced by Aspergillus Ochraceus Wilh. Nature 205, 1112–1113. doi:10.1038/2051112a0
Verma, I., Devi, M., Sharma, D., Nandi, R., and Pal, S. K. (2019). Liquid Crystal Based Detection of Pb(II) Ions Using Spinach RNA as Recognition Probe. Langmuir 35, 7816–7823. doi:10.1021/acs.langmuir.8b04018
Verma, I., Valsala Selvakumar, S. L., and Pal, S. K. (2020). Surfactin-Laden Aqueous-Liquid Crystal Interface Enabled Identification of Secondary Structure of Proteins. J. Phys. Chem. C 124, 780–788. doi:10.1021/acs.jpcc.9b10275
Wang, X., Yang, P., Mondiot, F., Li, Y., Miller, D. S., Chen, Z., et al. (2015). Interfacial Ordering of Thermotropic Liquid Crystals Triggered by the Secondary Structures of Oligopeptides. Chem. Commun. 51, 16844–16847. doi:10.1039/c5cc06996c
Wang, Y., Fang, Z., Ning, G., Mao, S., Wu, Y., Wu, S., et al. (2019). G-Quadruplex-Bridged Triple-Helix Aptamer Probe Strategy: A Label-Free Chemiluminescence Biosensor for Ochratoxin A. Sens. Actuators B: Chem. 298, 126867. doi:10.1016/j.snb.2019.126867
Wei, Y., Zhang, J., Wang, X., and Duan, Y. (2015). Amplified Fluorescent Aptasensor through Catalytic Recycling for Highly Sensitive Detection of Ochratoxin A. Biosens. Bioelectron. 65, 16–22. doi:10.1016/j.bios.2014.09.100
Wu, K., Ma, C., Zhao, H., He, H., and Chen, H. (2018). Label-Free G-Quadruplex Aptamer Fluorescence Assay for Ochratoxin A Using a Thioflavin T Probe. Toxins 10, 198. doi:10.3390/toxins10050198
Xu, Y., Rather, A. M., Song, S., Fang, J.-C., Dupont, R. L., Kara, U. I., et al. (2020). Ultrasensitive and Selective Detection of SARS-CoV-2 Using Thermotropic Liquid Crystals and Image-Based Machine Learning. Cel. Rep. Phys. Sci. 1, 100276. doi:10.1016/j.xcrp.2020.100276
Yang, X., Li, H., Zhao, X., Liao, W., Zhang, C. X., and Yang, Z. (2020). A Novel, Label-free Liquid crystal Biosensor for Parkinson's Disease Related Alpha-Synuclein. Chem. Commun. 56, 5441–5444. doi:10.1039/D0CC01025A
Yin, X., Wang, S., Liu, X., He, C., Tang, Y., Li, Q., et al. (2017). Aptamer-based Colorimetric Biosensing of Ochratoxin A in Fortified White Grape Wine Sample Using Unmodified Gold Nanoparticles. Anal. Sci. 33, 659–664. doi:10.2116/analsci.33.659
Yu, F.-y., Chi, T.-f., Liu, B.-h., and Su, C.-c. (2005). Development of A Sensitive Enzyme-Linked Immunosorbent Assay for the Determination of Ochratoxin A. J. Agric. Food Chem. 53, 6947–6953. doi:10.1021/jf0513922
Zhao, H., Xiong, D., Yan, Y., and Ma, C. (2020). Amplified Fluorescent Aptasensor for Ochratoxin A Assay Based on Graphene Oxide and RecJf Exonuclease. Toxins 12, 670. doi:10.3390/toxins12110670
Zhou, J., Dong, Y., Zhang, Y., Liu, D., and Yang, Z. (2016). The Assembly of DNA Amphiphiles at Liquid Crystal-Aqueous Interface. Nanomaterials 6, 229. doi:10.3390/nano6120229
Keywords: liquid crystal, aqueous interface, biosensor, aptamer, ochratoxin A
Citation: Devi M, A K, Pani I, Sil S and Pal SK (2022) Label-Free Detection of Ochratoxin A Using Aptamer as Recognition Probe at Liquid Crystal-Aqueous Interface. Front. Soft. Matter 2:835057. doi: 10.3389/frsfm.2022.835057
Received: 14 December 2021; Accepted: 24 January 2022;
Published: 23 March 2022.
Edited by:
Hiroyuki Yoshida, Osaka University, JapanReviewed by:
Xiaoguang Wang, The Ohio State University, United StatesTsung-Keng Chang, National Yang Ming Chiao Tung University, Taiwan
Copyright © 2022 Devi, A, Pani, Sil and Pal. This is an open-access article distributed under the terms of the Creative Commons Attribution License (CC BY). The use, distribution or reproduction in other forums is permitted, provided the original author(s) and the copyright owner(s) are credited and that the original publication in this journal is cited, in accordance with accepted academic practice. No use, distribution or reproduction is permitted which does not comply with these terms.
*Correspondence: Santanu Kumar Pal, c2twYWxAaWlzZXJtb2hhbGkuYWMuaW4=, c2FudGFudXBhbC4yMEBnbWFpbC5jb20=
†These authors have contributed equally to this work and share second authorship