 Suman Halder
 Yunho Shin2
 Xinfang Zhang
 Deng-Ke Yang
95% of researchers rate our articles as excellent or good
Learn more about the work of our research integrity team to safeguard the quality of each article we publish.
Find out more
ORIGINAL RESEARCH article
Front. Soft Matter , 11 October 2022
Sec. Liquid Crystals
Volume 2 - 2022 | https://doi.org/10.3389/frsfm.2022.1021077
This article is part of the Research Topic Editors' Showcase: Liquid Crystals View all 7 articles
Global warming is becoming a more and more severe crisis for humans. One way to resolve the concern is to reduce energy consumption. Smart switchable windows for office and residential buildings and vehicles can help reduce energy consumption. An ideal smart window should be able to control radiant energy flow and privacy. We investigated the capability of switchable windows based on liquid crystal/polymer composites, such as polymer dispersed liquid crystal (PDLC), polymer stabilized liquid crystal (PSLC), and polymer stabilized cholesteric texture (PSCT), to control the privacy and radiant energy flow. Through a systematic study, we identified methods to improve their capabilities. We demonstrated that PDLC and PSCT windows of sufficient thick film thickness can control both privacy and energy flow.
Global warming, caused by fossil fuel energy consumption, imposes a big challenge on humans. Approximately 40% of the total energy is used to heat and cool office and residential buildings (Chel and Kaushik, 2018; Ke et al., 2018). Smart switchable windows can greatly help reduce this energy consumption (Lampert, 1998; Wong and Chan, 2014; Casini, 2015; Oh et al., 2019). An ideal window should have two functions. The first function is to control radiant energy flow (solar light). On a hot summer day, the window should prevent sunlight from flowing through the window and entering the building, thus keeping the building cool. While on a cold winter day, the window should let sunlight through to warm up the building. The second function is to control privacy. When no privacy is needed, the window is transparent in such a way that people inside the building can see outside sceneries. When privacy is needed, the window becomes opaque in such a way that people outside the building cannot see inside activities.
Liquid crystal/polymer composites have been used to make switchable windows (Castellón and Levy, 2018; Lee and Kumar, 2021). The three leading technologies are polymer dispersed liquid crystal (PDLC) switchable window, polymer stabilized liquid crystal (PSLC) switchable window, and polymer stabilized cholesteric texture (PSCT) switchable window (Bao et al., 2009; Khandelwal et al., 2015; Hemaida et al., 2020). They can be switched by voltages. In one voltage condition, the windows are transparent with high transmittance. In another voltage condition, they are optically scattering (Long and Ye, 2014; Fuh et al., 2017; Jiang et al., 2019).
PDLCs consist of an isotropic polymer and a nematic liquid crystal (Higgins, 2000; Bronnikov et al., 2013). The composite is sandwiched between two parallel substrates with a transparent electrode to produce the switchable window. There is no alignment layer on the surface of the substrates. The polymer concentration is high (∼50%) and forms a binder. The liquid crystal forms micron-size droplets which are dispersed in the binder as shown in Figure 1A. The ordinary refractive index
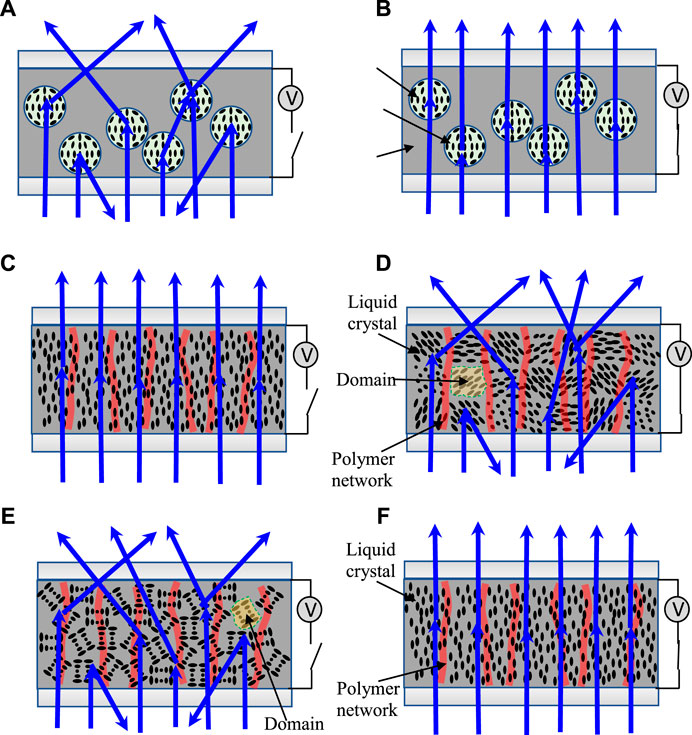
FIGURE 1. Schematic diagrams of liquid crystal/polymer composite switchable windows. (A) PDLC in voltage-off state, (B) PDLC in voltage-on state, (C) PSLC in voltage-off state, (D) PSLC in voltage-on state, (E) PSCT in voltage-off state, (F) PSCT in voltage-on state.
PSLCs consist of a polymer and a nematic liquid crystal (Kumar et al., 2011). The composite is sandwiched between two parallel substrates with a transparent electrode. There is a homeotropic alignment layer on the inner surface of the substrates. The polymer concentration is low (<10%). It forms an anisotropic polymer network in the normal direction of the film, as shown in Figure 1C. The liquid crystal has a negative dielectric anisotropy and tends to align perpendicular to externally applied electric fields (Luckhurst and Dunmur, 2017). When no voltage is applied, both the liquid crystal and polymer network are aligned in the normal direction of the film, as shown in Figure 1C. For an incident light (in any direction) it encounters a uniform refractive index throughout the film and thus is transmitted (Yu et al., 2017). When a sufficiently high voltage is applied, the polymer network remains in the original direction while the liquid crystal is switched into a poly-domain structure, wherein different domains, the liquid crystal orients randomly in different directions (Zhou et al., 2020), as shown in Figure 1D. The incident light encounters different refractive indices in different domains and thus is scattered.
PSCTs consist of a polymer and a cholesteric liquid crystal (Crawford and Zumer, 1996; Yang, 2012). The cholesteric liquid crystal possesses a periodic helical structure. The periodicity, the distance along the helical axis over which the liquid crystal molecule rotates 360o, is known as the pitch. The composite is sandwiched between two parallel substrates with a transparent electrode. There is no alignment layer on the inner surface of the substrates. The polymer concentration is low (<10%). It forms an anisotropic polymer network in the normal direction of the film, as shown in Figure 1E. The liquid crystal has a positive dielectric anisotropy and tends to align parallel to the externally applied electric field. When no voltage is applied, the polymer network is uniformly aligned along the film’s normal direction, while the liquid crystal is in a poly-domain state, called focal conic texture (or focal conic state) (Bao et al., 2009; Lee et al., 2015), as shown in Figure 1E. The helical axis of the liquid crystal varies from domain to domain, and thus the orientation of the liquid crystal varies from domain to domain. For an incident light (in any direction), it encounters different refractive indices from domain to domain and thus is scattered (Yang, 2012). When a voltage is applied, the helical axis is tilted toward the direction parallel to the cell substrate and the pitch is increased. When a sufficiently high voltage is applied, the helical structure is unwound (the pitch becomes infinitely long), and the liquid crystal is uniformly aligned along the film’s normal direction, as shown in Figure 1F. The incident light encounters a uniform refractive index throughout the film and thus is transmitted (Yang, 2012).
All these three switchable windows are excellent for privacy control (Körner et al., 1994; Sanchez-Pena et al., 2002; Liang et al., 2011; Ji et al., 2017). They do not use polarizers and have very high transmittances (∼90%) in the transparent state (Hurley et al., 2009; Ying-GueyFuh et al., 2009; Lin et al., 2011). The light loss is mainly caused by the reflection from the air-substrate interfaces. When they are in the scattering state, their scattering is strong, and images of sceneries seen through the windows are severely distorted by the scattering and cannot be distinguished. Their capability to control radiant energy flow control, however, is usually not the best and needs improvement. When the windows are in the scattering state, most of the incident light is scattered in forward directions and thus goes through the windows. Only about 20% of light is scattered in backward directions.
In this paper, we report our study of the scattering profiles of the three switchable windows and their capabilities of privacy and energy flow control. We also explored ways to improve their capability of energy flow control. Finally, we compare the performances of the three switchable windows.
The liquid crystal/polymer composite switchable windows are operated between a transparent state and a scattering state. When the incident light propagates through them, it is scattered in all directions, as shown in Figure 2. In our measurement, a green He-Ne laser light with the wavelength 543 nm was used, and the light is collimated and incident on the window in the normal direction. The incident light intensity is
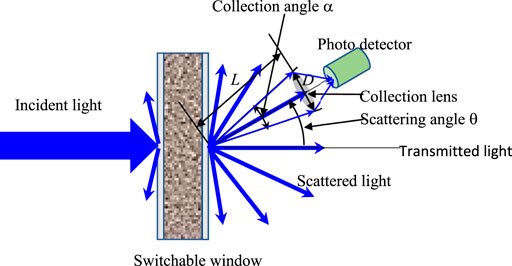
FIGURE 2. Schematic diagram of experimental setup for measurement of transmission and scattering profile of the switchable windows.
Usually, the linear collection angle, defined by
is used to specify the capability of the lens to collect scattered light. From Eqs. 1, 2, we have
The percentage of light scattered in the backward direction is given by
Usually, the collection angle
In the transmittance measurement, the lens and the detector are placed at the polar angle of 0. Therefore, the transmittance is given by
In measuring the capability of the switchable windows to control privacy, the collection angle of 4o is used. If the measured transmittance of the scattering state is less than 1%, good privacy control is achieved. In measuring the capability of the windows to control energy flow, the collection of 180o would be the best. This large collection angle can only be obtained with an integrating sphere. Unfortunately, we do not have an integrating sphere. As a compromise, we use the collection angle of 20o, which turns out to be able to give a good idea of the capability of the windows to control energy flow. In order to determine the capability more accurately, we measure the scattered light intensity profile and then use Eqs. 3, 4 to calculate the percentage of light scattered in the forward and backward directions.
In preparing the cell for the switchable windows, the empty cell was first assembled. It consisted of two 1 mm thick parallel glass plates with ITO (indium tin oxide) coating which serves as the transparent electrode. The ITO coating was on the inner surface of the substrates. The cell thickness was controlled by spherical spacers. Secondly, the liquid crystal and monomer were mixed homogeneously. The mixture was filled into the cell by capillary action. Last, the cell was irradiated by a LED UV light with a wavelength of 365 nm at room temperature to polymerize the monomer.
In the fabrication of the PDLC switchable window, the liquid crystal used was E7 (from Merck), whose dielectric anisotropy
In the fabrication of the PSLC switchable window, the liquid crystal used was BHR82 (from BaYi), whose dielectric anisotropy
In the fabrication of the PSCT switchable window, the mesogenic monomer used was RM257. A small amount of photo-initiator benzoin methyl ether (BME) (from Polyscience) was added. The ratio between the concentrations of RM257 and BME was about 10:1. The cholesteric liquid crystal used was constructed by mixing nematic liquid crystal E7 and chiral dopant R1011 (from Merck). The pitch
The scattering of the PDLC depends on the birefringence of the liquid crystal, liquid crystal droplet size, and cell thickness. The birefringence depends on the molecular structure of the liquid crystal. Liquid crystals with large birefringence exhibit strong scattering and are desirable for switchable windows. In our experiment, only one liquid crystal is used; thus, the effect of birefringence is not studied. Our research is focused on studying the effects of liquid crystal droplet size and cell thickness.
First, we studied the effects of liquid crystal droplet size on the electro-optical properties of the PDLC window. The cell thickness is kept at 10 μm. We vary the droplet size by using different curing UV light intensities. Under a high UV light intensity, the polymerization speed of the monomer is faster, and thus smaller droplets form (Lackner et al., 1989; Li et al., 2008b). When the collection angle is 4o, the transmittance as a function of the applied voltage is shown in Figure 3A. When the curing UV light intensity is 0.05 mW/cm2, the transmittance
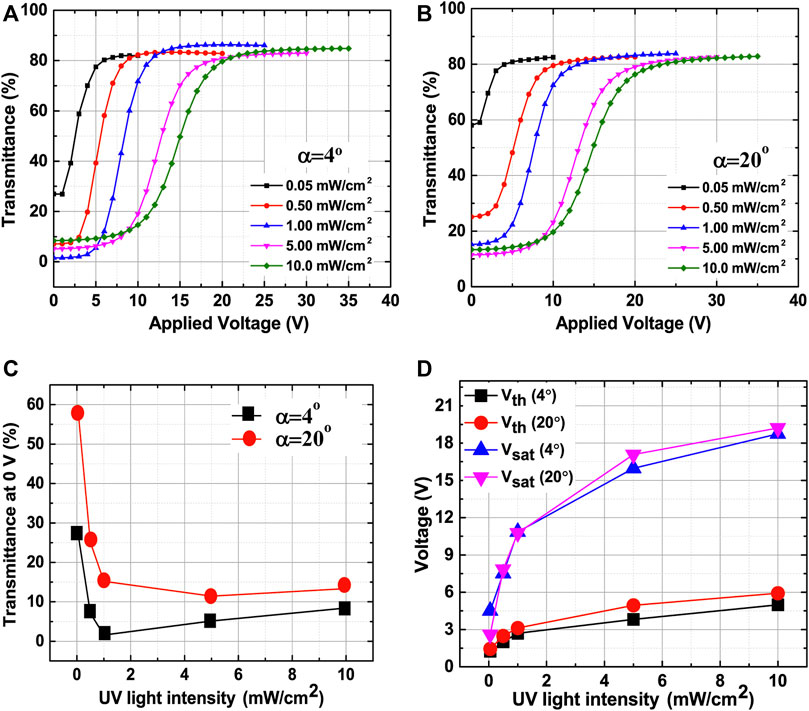
FIGURE 3. Electro-optical properties of the PDLC windows with the cell thickness of 10 μm cured under various UV light intensity. (A) Transmittance vs applied voltage measured with the collection angle of 4o. (B) Transmittance vs applied voltage measured with the collection angle of 20o. (C) Transmittance of scattering state vs curing UV light intensity. (D) Threshold and saturation voltages vs curing UV light intensity.
We then studied the effects of cell thickness on the electro-optical properties of the PDLC window. The curing UV light intensity is fixed at 5 mW/cm2, and thus the liquid crystal droplet size is fixed. We vary the cell thickness (PDLC film thickness). When the collection angle is 4o, the transmittance as a function of the applied voltage is shown in Figure 4A. When the cell thickness is 10 μm, the transmittance
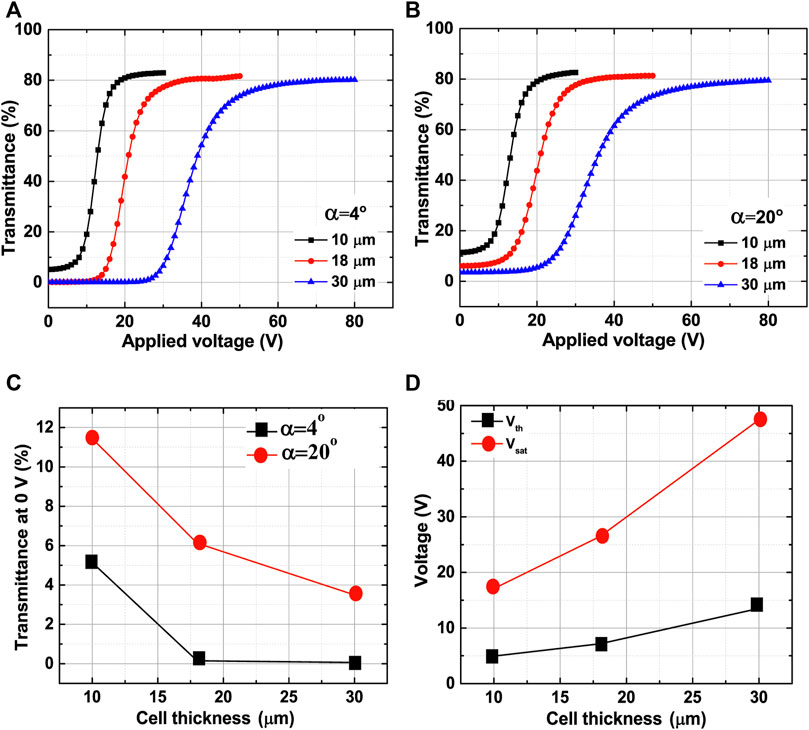
FIGURE 4. Electro-optical properties of the PDLC windows with different cell thicknesses cured under a UV light intensity of 5 mW/cm2. (A) Transmittance vs applied voltage measured with the collection angle of 4o. (B) Transmittance vs applied voltage measured with the collection angle of 20o. (C) Transmittance of scattering state vs cell thickness. (D) Threshold and saturation voltages vs cell thickness.
Linearly with the cell thickness. The maximum transmittance
The scattering of the PSLC depends on the birefringence of the liquid crystal, liquid crystal domain size, and cell thickness. Since we only used one liquid crystal in our experiment, the birefringence effect was not studied. Therefore, our research is focused on exploring the effects of liquid crystal domain size and cell thickness.
In PSLCs, the liquid crystal domain size can be adjusted by the monomer concentration and the curing UV light intensity (Rajaram et al., 1996; Dierking et al., 1998a). We first studied the effect of monomer concentration. The cell thickness is kept at 10 μm, and the curing UV light intensity is fixed at 5 mW/cm2. The monomer concentration is varied. When the collection angle is 4o, the transmittance as a function of the applied voltage is shown in Figure 5A. For the window with 3% monomer, when no voltage is applied, the material is in the transparent state with the transmittance of about 90%, where there is almost no residual scattering. When the applied voltage is increased above 5 V, the liquid crystal is tilted away from the cell’s normal direction, liquid crystal domains start forming, and the transmittance decreases. When the applied voltage is increased to 23 V, the transmittance decreases to a minimum value
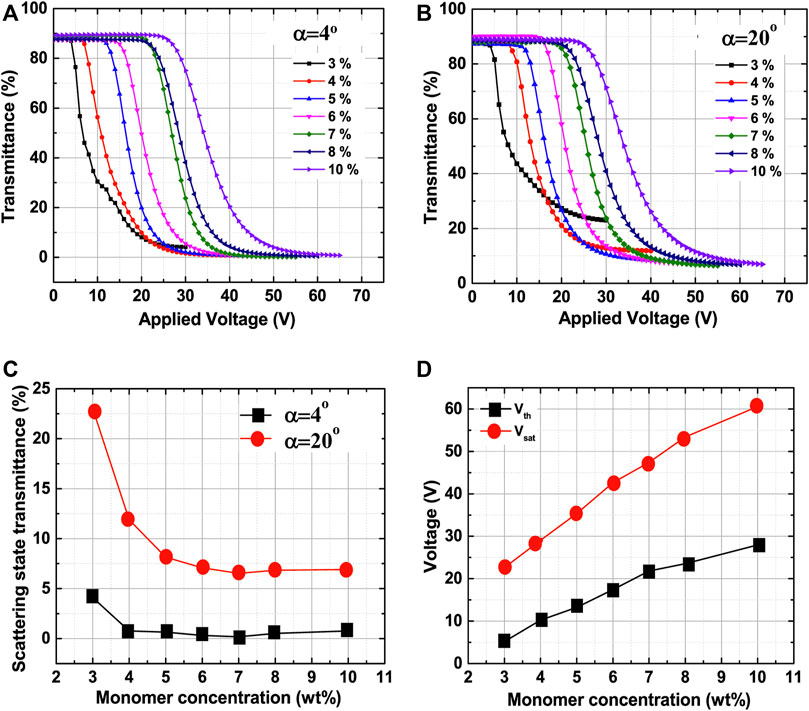
FIGURE 5. Electro-optical properties of the PSLC windows with different monomer concentrations cured under a UV light intensity of 5 mW/cm2. (A) Transmittance vs applied voltage measured with the collection angle of 4o. (B) Transmittance vs applied voltage measured with the collection angle of 20o. (C) Transmittance of scattering state vs monomer concentration. (D) Threshold and saturation voltages vs monomer concentration.
We then varied the liquid crystal domain size by using different UV light intensities. The monomer concentration is fixed at 6%, and the cell thickness is fixed at 10 μm. When the collection angle is 4o, the transmittance as a function of the applied voltage is shown in Figure 6A. The transmittance of the transparent state (at 0 V) is high, about 90%. When the applied voltage is increased, the transmittance decreases. When the UV light intensity is 0.05 mW/cm2, the transmittance of the scattering state (at 25 V) is 3.02%. When the UV light intensity is increased to 0.5 mW/cm2, the transmittance of the scattering state decreases to 0.79%, as shown in Figure 6C. When the UV light intensity is increased further, the transmittance of the scattering state decreases slightly. When the UV light intensity is 10 mW/cm2, the transmittance of the scattering state is 0.21%. When the UV light intensity is increased, first, the driving voltages increase dramatically, and then only slightly, as shown in Figure 6D. The change of the transmittance of the scattering state and the driving voltage with the UV light intensity indicates that when the UV light intensity is increased from 0.05 mW/cm2 to 0.5 mW/cm2, the liquid crystal domain size changes significantly, and beyond that, the domain size only changes slightly. When the collection angle is 20o, the transmittance as a function of the applied voltage is shown in Figure 6B. When no voltage is applied, the material is in the transparent state with the transmittance of about 90%, the same as when the collection angle of 4o is used. When the applied voltage is increased, the transmittance decreases. When the UV light intensity is 0.05 mW/cm2, the transmittance of the scattering state is 23.0%. When the UV light intensity is increased to 0.5 mW/cm2, the transmittance of the scattering state decreases to 9.8%. When the UV light intensity is further reduced, the transmittance of the scattering state does not change much and remains around 7%, as shown in Figure 6C.
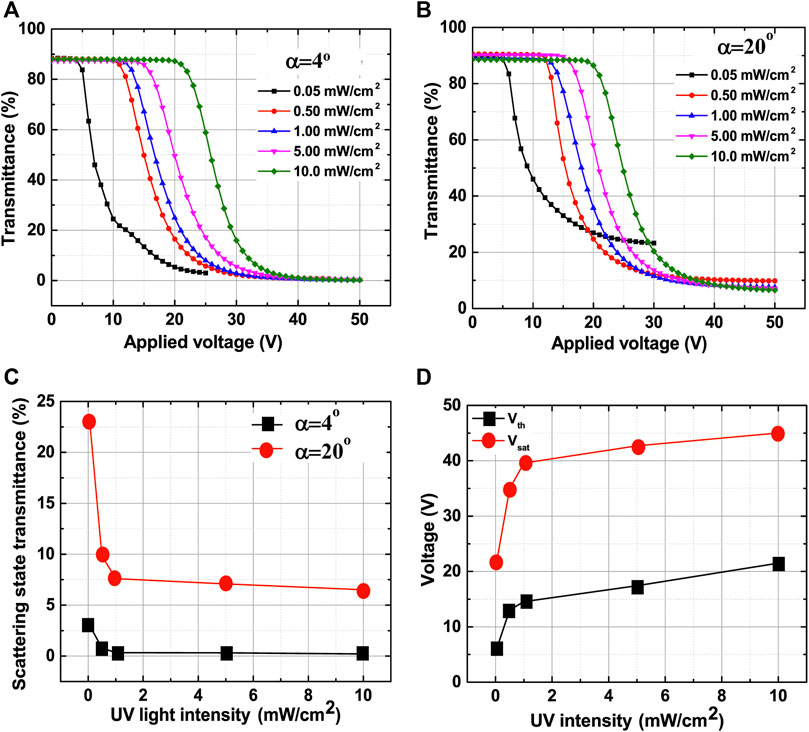
FIGURE 6. Electro-optical properties of the PSLC windows with 6% monomer cured under various UV light intensities. (A) Transmittance vs applied voltage measured with the collection angle of 4o. (B) Transmittance vs applied voltage measured with the collection angle of 20o. (C) Transmittance of scattering state vs curing UV light intensity. (D) Threshold and saturation voltages vs curing UV light intensity.
We also studied the effects of cell thickness on the electro-optical properties of the PSLC window. The monomer concentration is fixed at 6%, and the curing UV light intensity is fixed at 5 mW/cm2, and thus the liquid crystal domain size is fixed. The cell thickness is varied. When the collection angle is 4o, the transmittance as a function of the applied voltage is shown in Figure 7A. The transmittance of the transparent state (at 0 V) is near 90%, independent of the cell thickness. When the cell thickness is 10 μm, the transmittance
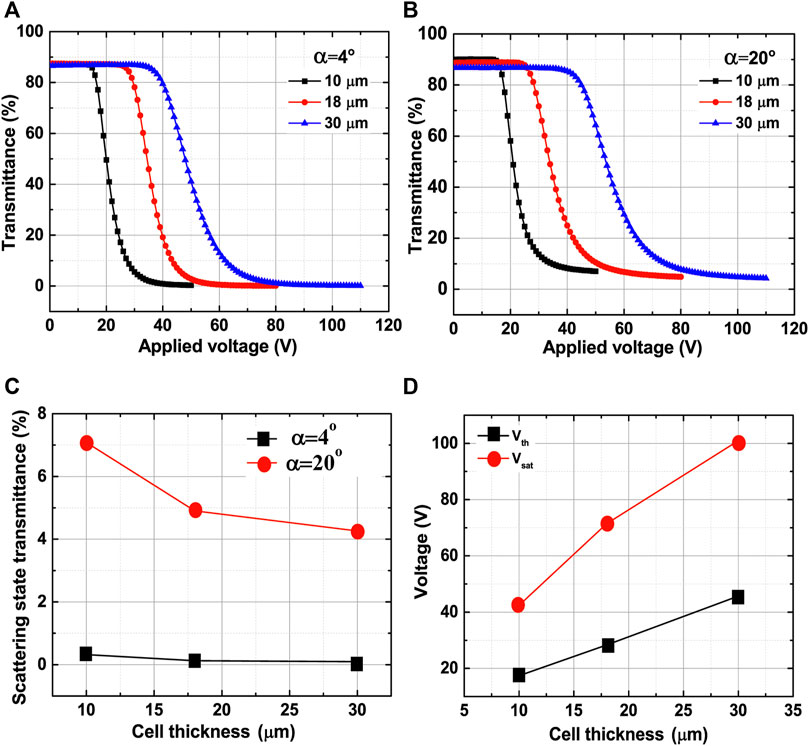
FIGURE 7. Electro-optical properties of the PSLC windows with different cell thicknesses cured under a UV light intensity of 5 mW/cm2. (A) Transmittance vs applied voltage measured with the collection angle of 4o. (B) Transmittance vs applied voltage measured with the collection angle of 20o. (C) Transmittance of scattering state vs cell thickness. (D) Threshold and saturation voltages vs cell thickness.
The scattering of a PSCT depends on the birefringence of the liquid crystal, liquid crystal domain size, and cell thickness. Like PDLCs and PSLCs, in this experiment, only one liquid crystal is used; thus, the effects of birefringence are not studied. Our research effort concentrates on studying the effects of liquid crystal domain size and cell thickness.
The electro-optical properties of PSCTs mainly depend on the monomer concentration and the helical pitch of the liquid crystal and slightly dependent on the curing UV light intensity (Dierking et al., 1998b; Huang et al., 2006; Xu et al., 2016). In our experiment, the curing UV light intensity is fixed at 5 mW/cm2. We first studied the effect of monomer concentration. The pitch is fixed at 0.7 μm, and the cell thickness is 10 μm. The monomer concentration is varied. When the collection angle is 4o, the transmittance as a function of the applied voltage is shown in Figure 8A. For the window with 2.5% monomer, when no voltage is applied, the material is in the scattering state with the minimum transmittance
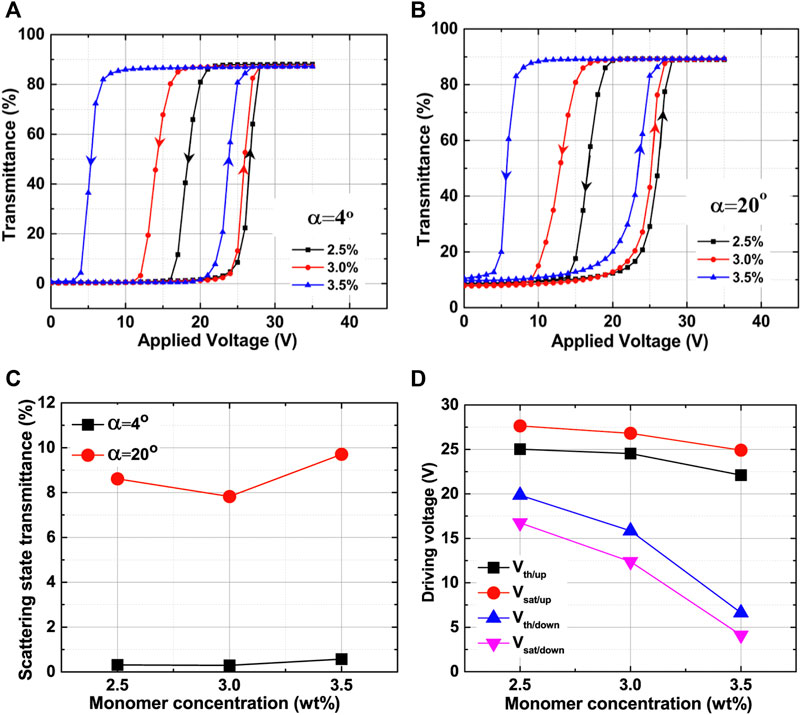
FIGURE 8. Electro-optical properties of the PSCT windows of the pitch of 0.7 μm with various monomer concentrations. (A) Transmittance vs applied voltage measured with the collection angle of 4o. (B) Transmittance vs applied voltage measured with the collection angle of 20o. (C) Transmittance of scattering state vs monomer concentration. (D) Threshold and saturation voltages vs monomer concentration.
We then studied the effects of the helical pitch of the cholesteric liquid crystal. In the experiment, the curing UV light intensity is fixed at 5 mW/cm2. The monomer concentration is 3%, and the cell thickness is 10 μm. The transmittance of the scattering state (at 0 V) as a function of pitch is shown in Figure 9A. For both collection angles, when the pitch is increased from 0.5 μm to 0.7 μm, the transmittance of the scattering state decreases slightly. When the pitch is increased further to 1.0 μm, the transmittance increases significantly. The pitch is a critical factor in determining the liquid crystal domain size. The domain size increases with the pitch (Huang et al., 2006). When the pitch is 1.0 μm, the domain size is too large, and the material does not strongly scatter visible light. The driving voltage as a function of the pitch is shown in Figure 9B. Both the threshold voltage and saturation voltages decrease monotonically with the pitch. In the transparent state, the helical structure is unwound, as shown in Figure 1F. The longer the pitch, the lower the required voltage to unwind the helical structure, following the equation
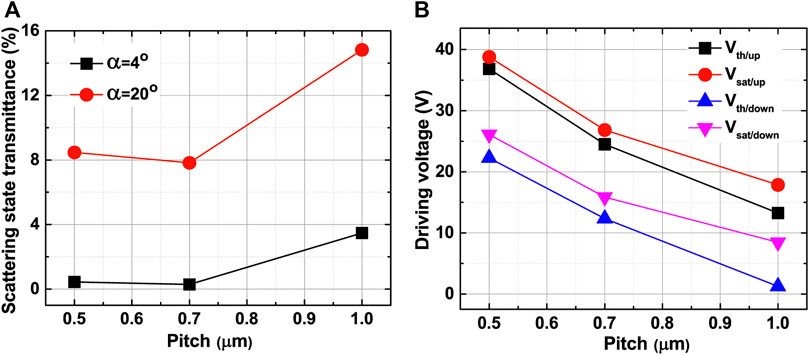
FIGURE 9. Electro-optical properties of the PSCT windows of monomer concentration of 3% with various the pitches. (A) Transmittance of scattering state vs pitch. (B) Threshold and saturation voltages vs pitch.
We also studied the effect of cell thickness on the electro-optical properties of the PSCT window. The monomer concentration is fixed at 3%, the pitch is fixed at 0.7 μm, and the curing UV light intensity is fixed at 5 mW/cm2, and thus the liquid crystal domain size is fixed. The cell thickness is varied. When the collection angle is 4o, the transmittance as a function of the applied voltage is shown in Figure 10A. When the cell thickness is 10 μm, the transmittance
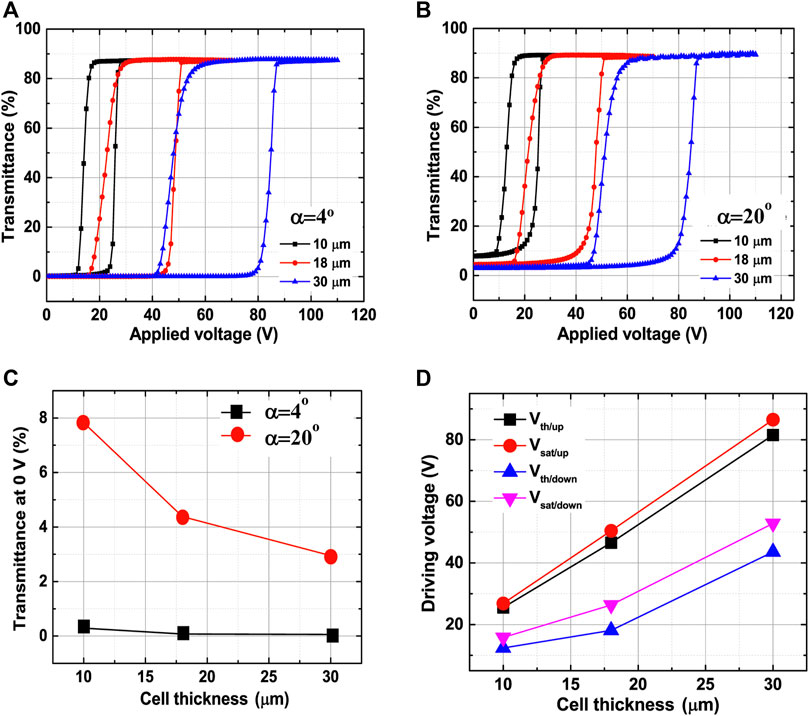
FIGURE 10. Electro-optical properties of the PSCT windows with the pitch of μm and monomer concentration of 3% of different cell thicknesses. (A) Transmittance vs applied voltage measured with the collection angle of 4o. (B) Transmittance vs applied voltage measured with the collection angle of 20o. (C) Transmittance of scattering state vs cell thickness. (D) Threshold and saturation voltages vs cell thickness.
We examined the capability of the switchable window to control privacy. In the experiment, a picture of the Kent State University logo is placed 1 cm behind the window. The appearance of the logo is visually observed and photographed. The photographs of the windows of various cell thicknesses are shown in Figure 11. For the PDLC windows, the curing UV light intensity is 5 mW/cm2. For the PSLC windows, the monomer concentration is 6% and the curing UV light intensity is 5 mW/cm2. For the PSCT windows, the monomer concentration is 3%, the pitch is 0.7 μm, and the curing UV light intensity is 5 mW/cm2. For the PDLC window of the cell thickness of 10 μm, the logo can be seen when it is in the scattering state. It does not control privacy well. The PSLC window of the cell thickness of 10 μm is better. The logo can barely be seen when it is in the scattering state. The PSCT window of the cell thickness of 10 μm is the best; when it is in the scattering state, the logo cannot be seen. It controls privacy well. For the windows of cell thickness of 18 μm or 30 μm, when they are in the scattering state, the logo cannot be seen. They all have good capability of privacy control. The logo can be clearly seen through on all the windows when they are in the transparent state.

FIGURE 11. Photographs of the switchable windows in the scattering and transparent states of different cell thicknesses.
Although the transmittance of the windows measured with the collection angle of 20o gives an idea of their capability to control energy flow, a better measurement is needed to characterize their capability. In order to accomplish this task, we measured the scattered light intensity profile, namely the scattered light intensity as a function of the scattering angle of the switchable windows. In the measurement, the collection angle of 20o is used, which assures a high signal-to-noise ratio. In the forward direction, the scattered light intensity is measured in the scattering angle region from 0o to 75o. It is difficult to measure the scattered light intensity in the region from 75o to 90o because of the usage of the collection lens. In the backward direction, the scattered light intensity is measured in the scattering angle region from 25o to 75o. It is difficult to measure the scattered light intensity in the region from 75o to 90o because of the usage of the collection lens. It is also difficult to measure the scattered light intensity in the region from 0o to 25o where the detector would block the incident light. The PDLC windows studied are cured under the UV light intensity of 5 mW/cm2. The PSLC windows studied have a monomer concentration of 6% and are cured under the UV light intensity of 5 mW/cm2. The PSCT windows have the pitch of 0.7 μm and monomer concentration of 3% and are cured under the UV light intensity of 5 mW/cm2. The results are shown in Figure 12. When the cell thickness is increased, the scattered light in forward directions with small scattering angle decreases significantly, while the scattered light in backward directions increases significantly. This is probably due to multiple scattering. When the cell is thin, single scattering is dominant, and most of the light is scattered in forward directions with small scattering angles. When the cell thickness is increased to 30 μm, multiple scattered becomes dominant. When light is scattered multiple times, a significant percentage of light is scattered in backward directions. For the same cell thickness, PSLC windows have the weakest backward scattering, PDLC windows have the medium backward scattering, and PSCT windows have the strongest backward scattering. This is probably attributed to the small liquid crystal domain size and the helical structure of the cholesteric liquid crystal in PSCT windows. Small domains produce more backward scattering. The periodic helical structure causes Bragg reflection. The wavelength of the reflected light is given by
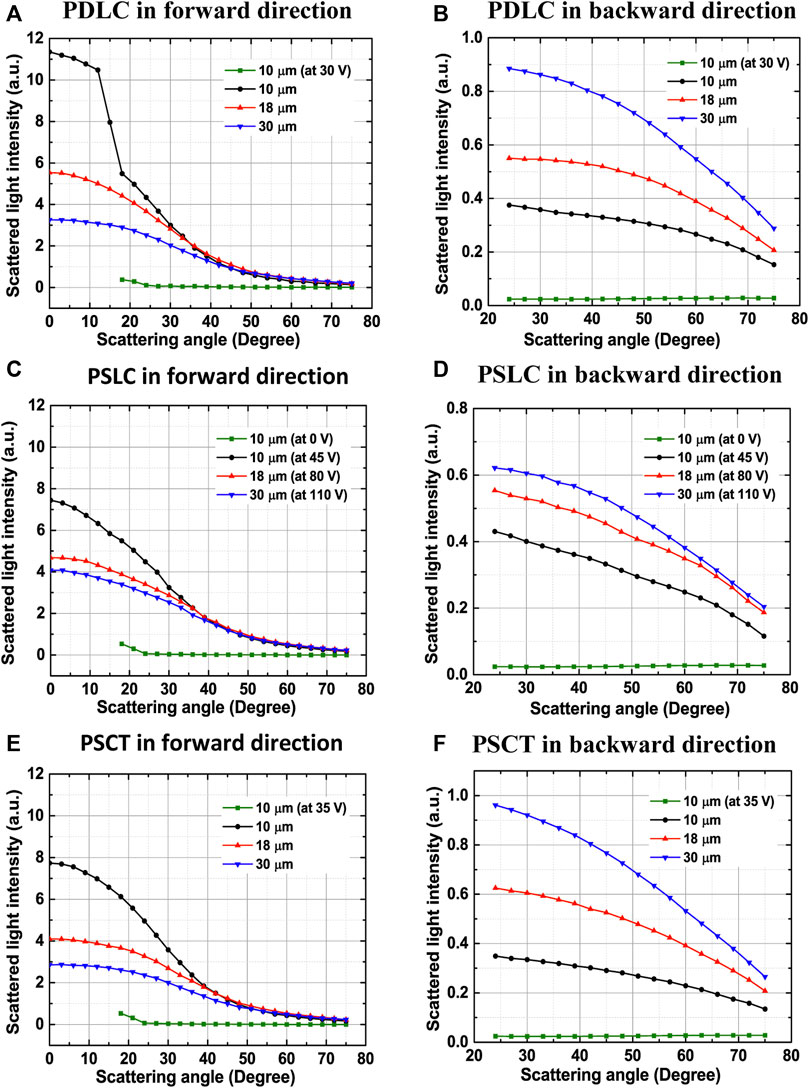
FIGURE 12. Scattered light intensity vs scattering angle of the windows with various cell thicknesses. (A) PDLC in forward directions, (B) PDLC in backward directions, (C) PSLC in forward directions, (D) PSLC in backward directions. (E) PSCT in forward directions, (F) PSCT in backward directions.
The switchable windows in the transparent state exhibit very weak scattering. More than 82% of incident light goes through the windows. The light blocked is mainly due to the reflection by the window substrate-air interfaces. The capability of the switchable windows to control energy flow depends on the percentage of light scattered in forward directions when they are in the scattering state. The percentage of light scattered in forward directions can be calculated from the measured scattered light intensity profile by using Eq. 3. The percentage of light blocked, namely the percentage of light that does not go through the windows, equal 100% subtracted by the percentage of light scattered in the forward direction. Note the light blocked is the sum of the light scattered in backward direction and the light reflected by the interfaces. Using the data shown in Figure 12, we calculate the percentage of light blocked by the windows and list the result in Table 1. When the cell thickness is 10 μm, the percentages of light blocked of three types of windows are low, slightly higher than 10%. The capability to control energy flow is poor. However, when the cell thickness is 30 μm, the percentage of light blocked by the PDLC and PSCT windows are around 45%. The capability to control energy flow is not the best, but significant to reduce the heating effect of sunlight. The transmittance of the transparent state and the driving voltage, the voltage to obtain the maximum transmittance (for PDLC and PSCT windows), or the minimum transmittance (for PSLC window), are also listed in the table.
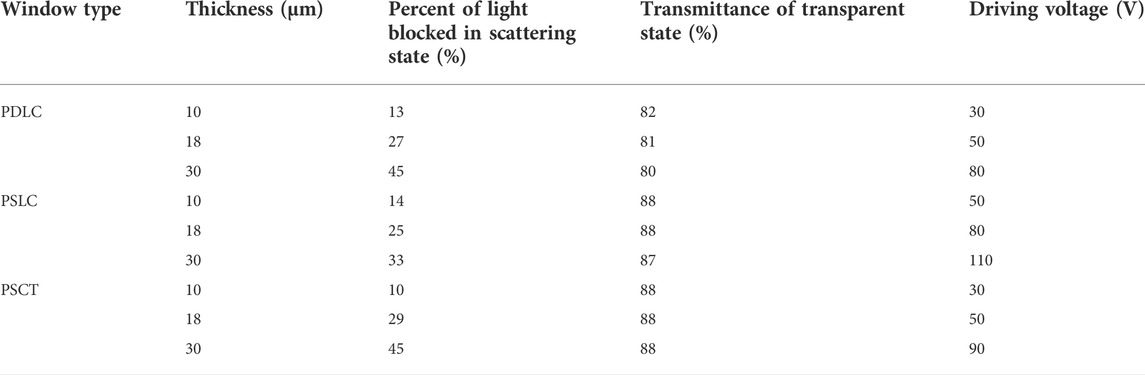
TABLE 1. Percentage of the light blocked by PDLC, PSLC, and PSCT switchable windows of different cell thicknesses and driving voltage.
We studied the electro-optical properties of PDLC, PSLC, and PSCT switchable windows. We investigated how the factors such as monomer concentration, curing UV light intensity, helical pitch, and cell thickness affect their performance. In addition, we compared their capabilities to control the privacy and radiant energy flow. Regarding privacy control, we measured the transmittance of the windows with a collection angle of 4o and visually inspected images seen through them. All the windows, except the PDLC window with a thickness of 10 μm, can control privacy well. Regarding energy flow control, we measured the scattered light intensity as a function of the scattering angle in forward and backward directions, from which we calculated the percentage of light blocked. We observed that liquid crystals with small droplets (or domains), which can be achieved with high UV light intensity, high monomer concentration, and short pitch, scatter more light in directions with large scattering angles. When the cell thickness is 30 μm, PDLC and PSCT windows can block 45% incident light, which is satisfactory for energy flow control, and can be used for architectural and vehicle windows to control both privacy and radiant energy flow.
The raw data supporting the conclusions of this article will be made available by the authors, without undue reservation.
All authors listed have made a substantial, direct, and intellectual contribution to the work and approved it for publication.
The authors declare that the research was conducted in the absence of any commercial or financial relationships that could be construed as a potential conflict of interest.
All claims expressed in this article are solely those of the authors and do not necessarily represent those of their affiliated organizations, or those of the publisher, the editors and the reviewers. Any product that may be evaluated in this article, or claim that may be made by its manufacturer, is not guaranteed or endorsed by the publisher.
Bao, R., Liu, C. M., and Yang, D. K. (2009). Smart bistable polymer stabilized cholesteric texture light shutter. Appl. Phys. Express 2, 112401. doi:10.1143/apex.2.112401
Broer, D. J., Gossink, R. G., and Hikmet, R. A. M. (1990). Oriented polymer networks obtained by photopolymerization of liquid-crystalline monomers. Angew. Makromol. Chem. 183, 45–66. doi:10.1002/apmc.1990.051830103
Bronnikov, S., Kostromin, S., and Zuev, V. (2013). Polymer-dispersed liquid crystals: Progress in preparation, investigation, and application. J. Macromol. Sci. Part B 52, 1718–1735. doi:10.1080/00222348.2013.808926
Casini, M. (2015). Smart windows for energy efficiency of buildings. Int. J. Civ. Struct. Engineering-IJCSE 2, 273–281. doi:10.15224/978-1-63248-030-9-56
Castellón, E., and Levy, D. (2018). Smart windows based on liquid crystal dispersions. Transparent Conduct. Mater. 4, 337–365. doi:10.1002/9783527804603.ch5_4
Chel, A., and Kaushik, G. (2018). Renewable energy technologies for sustainable development of energy efficient building. Alexandria Eng. J. 57, 655–669. doi:10.1016/j.aej.2017.02.027
Coates, D. (1995). Polymer-dispersed liquid crystals. J. Mat. Chem. 5, 2063–2072. doi:10.1039/jm9950502063
Crawford, G. P., and Zumer, S. (1996). Liquid crystals in complex geometries: Formed by polymer and porous. London: Networks” CRC Press.
Dierking, I., Kosbar, L. L., Afzali-Ardakani, A., Lowe, A. C., and Held, G. A. (1998). Network morphology of polymer stabilized liquid crystals. Appl. Phys. Lett. 71, 2454–2456. doi:10.1063/1.120087
Dierking, I., Kosbar, L. L., Lowe, A. C., and Held, G. A. (1998). Polymer network structure and electro-optic performance of polymer stabilized cholesteric textures II. The effect of UV curing conditions. Liq. Cryst. 24 (3), 397–406. doi:10.1080/026782998207217
Drzaic, P. S. (1995). Droplet density, droplet size, and wavelength effects in PDLC light scattering. Mol. Cryst. Liq. Cryst. Sci. Technol. 261, 383–392. doi:10.1080/10587259508033483
Fuh, A. Y. G., Chih, S. Y., and Wu, S. T. (2017). Advanced electro-optical smart window based on PSLC using a photoconductive TiOPc electrode. Liq. Cryst. 45, 864–871. doi:10.1080/02678292.2017.1397214
Fung, Y. K., Yang, D. K., Ying, S., Chien, L. C., Zumer, S., and Doane, J. W. (2006). Polymer networks formed in liquid crystals. Liq. Cryst. 19, 797–801. doi:10.1080/02678299508031102
Halder, S., Shin, Y., Zhou, Z., Zhang, X., Hu, L., Yang, D.-K., et al. (2021). Aligned polymer dispersed liquid crystal film for light enhancement of quantum dot backlight. Opt. Express 29, 43241–43255. doi:10.1364/oe.446185
Hemaida, A., Ghosh, A., Sundaram, S., and Mallick, T. K. (2020). Evaluation of thermal performance for a smart switchable adaptive polymer dispersed liquid crystal (PDLC) glazing. Sol. Energy 195, 185–193. doi:10.1016/j.solener.2019.11.024
Higgins, D. A. (2000). Probing the mesoscopic chemical and physical properties of polymer-dispersed liquid crystals. Adv. Mat. 12 (4), 251–264. doi:10.1002/(sici)1521-4095(200002)12:4<251:aid-adma251>3.0.co;2-4
Huang, C. Y., Ke, S. W., and Chih, Y. S. (2006). Electro-optical performance of polymer stabilized cholesteric texture cell: The influence of chiral dopant and monomer concentration. Opt. Commun. 266, 198–202. doi:10.1016/j.optcom.2006.04.027
Hurley, S., Ma, J., and Yang, D.-K. (2009). P-108: A flexible display using dye-doped PSCT. SID Symp. Dig. 40, 1520–1523. doi:10.1889/1.3256602
Ji, S. M., Huh, J. W., Kim, J. H., Choi, Y., Yu, B. H., and Yoon, T. H. (2017). Fabrication of flexible light shutter using liquid crystals with polymer structure. Liq. Cryst. 44, 1429–1435. doi:10.1080/02678292.2017.1281452
Jiang, Y., Shin, Y., and Yang, D.-K. (2019). Dual-Mode switchable liquid-crystal window. Phys. Rev. Appl. 12, 054037. doi:10.1103/physrevapplied.12.054037
Ke, Y., Zhou, C., Zhou, Y., Wang, S., Chan, S. H., and Long, Y. (2018). Emerging thermal-responsive materials and integrated techniques targeting the energy-efficient smart window application. Adv. Funct. Mat. 28, 1800113. doi:10.1002/adfm.201800113
Kelly, J., Wu, W., and Palffy-muhoray, P. (2006). Wavelength dependence of scattering in PDLC films: Droplet size effects molecular crystals and liquid crystals science and technology. Sect. A. Mol. Cryst. Liq. Cryst. 223, 251–261. doi:10.1080/15421409208048256
Khandelwal, H., Loonen, R. C. G. M., Hensen, J. L. M., Debije, M. G., and Schenning, A. P. H. J. (2015). Electrically switchable polymer stabilised broadband infrared reflectors and their potential as smart windows for energy saving in buildings. Sci. Rep. 5, 11773–11779. doi:10.1038/srep11773
Klosowicz, S. J., and Zmija, J. (1995). Optics and electro-optics of polymer-dispersed liquid crystals: Physics, technology, and application. Opt. Eng. 34, 3440–3450. doi:10.1117/12.213241
Körner, B. S., Scheller, P. C., Beck, A., and Fricke, J. (1994). PDLC films for control of light transmission. J. Phys. D. Appl. Phys. 27, 2145–2151. doi:10.1088/0022-3727/27/10/023
Kumar, R., Raina, K. K., Kumar, R., and Raina, K. K. (2011). Polymer stabilized liquid crystals: Materials, physics and applications. AIPC 1393, 46–49.
Lackner, A., Margerum, J., Ramos, E., Lim M Lackner, K. A., Margerum, J. D., and Lim, K. (1989). Droplet size control in polymer dispersed liquid crystal films. Liq. Cryst. Chem. Phys. Appl. 1080, 53–61. doi:10.1117/12.976401
Lampert, C. M. (1998). Smart switchable glazing for solar energy and daylight control. Sol. Energy Mater. Sol. Cells 52, 207–221. doi:10.1016/s0927-0248(97)00279-1
Lee, K. M., Tondiglia, V. P., and White, T. J. (2015). Bistable switching of polymer stabilized cholesteric liquid crystals between transparent and scattering modes. MRS Commun. 5, 223–227. doi:10.1557/mrc.2015.40
Lee, W., and Kumar, S. (2021). Unconventional liquid crystals and their applications. Bristol, United Kingdom: IoP publishing ltd, 570.
Li, W., Cao, H., Kashima, M., Liu, F., Cheng, Z., Yang, Z., et al. (2008). Control of the microstructure of polymer network and effects of the microstructures on light scattering properties of UV-cured polymer-dispersed liquid crystal films. J. Polym. Sci. B. Polym. Phys. 46, 2090–2099. doi:10.1002/polb.21543
Li, W., Cao, Y., Cao, H., Kashima, M., Kong, L., and Yang, H. (2008). Effects of the structures of polymerizable monomers on the electro-optical properties of UV cured polymer dispersed liquid crystal films. J. Polym. Sci. B. Polym. Phys. 46, 1369–1375. doi:10.1002/polb.21471
Liang, H. H., Wu, C. C., Wang, P. H., and Lee, J. Y. (2011). Electro-thermal switchable bistable reverse mode polymer stabilized cholesteric texture light shutter. Opt. Mat. (Amst). 33, 1195–1202. doi:10.1016/j.optmat.2011.02.012
Lin, Y.-H., Chen, H.-S., Chiang, T.-H., Wu, C.-H., Hsu, H.-K., Kikuchi, H., et al. (2011). A reflective polarizer-free electro-optical switch using dye-doped polymer-stabilized blue phase liquid crystals. Opt. Express 19, 2556–2561. doi:10.1364/oe.19.002556
Long, L., and Ye, H. (2014). How to be smart and energy efficient: A general discussion on thermochromic windows. Sci. Rep. 4, 6427–6510. doi:10.1038/srep06427
Ma, R. Q., and Yang, D. K. (2000). Fréedericksz transition in polymer-stabilized nematic liquid crystals. Phys. Rev. E 61, 1567–1573. doi:10.1103/physreve.61.1567
Marinov, Y. G., Hadjichristov, G. B., and Petrov, A. G. (2009). Single-layered microscale linear-gradient PDLC material for electro-optics. Cryst. Res. Technol. 44, 870–878. doi:10.1002/crat.200900147
Nastal Ł, E., Uran´ska, ˙, Uran´ska, U., and Mucha, M. (1999). Effect of curing progress on the electrooptical and switching properties of PDLC system. J. Appl. Polym. Sci. 71, 455–463. doi:10.1002/(sici)1097-4628(19990118)71:3<455:aid-app12>3.0.co;2-7
Oh, M., Lee, C., Park, J., Lee, K., and Tae, S. (2019). Evaluation of energy and daylight performance of old office buildings in South Korea with curtain walls remodeled using polymer dispersed liquid crystal (PDLC) films. Energies 12, 3679. doi:10.3390/en12193679
Pascault, J. P., and Williams, R. J. J. (2009). Epoxy polymers: New materials and innovations. Hoboken, New Jersey, United States: John Wiley & Sons.
Paul Montgomery, G., West, J. L., and Tamura-Lis, W. (1998). Light scattering from polymer-dispersed liquid crystal films: Droplet size effects. J. Appl. Phys. 69, 1605. doi:10.1063/1.347256
Rajaram, C. v., Hudson, S. D., and Chien, L. C. (1996). Effect of polymerization temperature on the morphology and electrooptic properties of polymer-stabilized liquid crystals. Chem. Mat. 8, 2451–2460. doi:10.1021/cm9505207
Sanchez-Pena, J. M., Vazquez, C., Perez, I., Rodriguez, I., and Oton, J. M. (2002). Electro-optic system for online light transmission control of polymer-dispersed liquid crystal windows. Opt. Eng. 41, 1608–1611. doi:10.1117/1.1481049
Seo, Y.-W., Yoo, H.-S., Jin, Y., Lee, B.-Y., Lu, S., and Kwon, S.-B. (2014). Droplet size dependent electro-optical properties of PDLCs with one plastic substrate. Mol. Cryst. Liq. Cryst. 596, 97–105. doi:10.1080/15421406.2014.918329
Wong, K. v., and Chan, R. (2014). Smart glass and its potential in energy savings. J. Energy Resour. Technol. 136, 012002. doi:10.1115/1.4024768
Xu, C., Chu, Y. T., Hu, J. L., and Lu, H. B. (2016). Influence of helical twisting power on electro-optical properties of normal-mode polymer-stabilized cholesteric texture. Liq. Cryst. 31, 358–362. doi:10.3788/yjyxs20163104.0358
Yang, D. K., Cui, Y., Nemati, H., Zhou, X., and Moheghi, A. (2013). Modeling aligning effect of polymer network in polymer stabilized nematic liquid crystals. J. Appl. Phys. 114, 243515. doi:10.1063/1.4856295
Yang, D. K. (2012). Polymer stabilized cholesteric liquid crystal for switchable windows. Liq. Cryst. Beyond Displays Chem. Phys. Appl., 2012, 505–523. doi:10.1002/9781118259993.ch16
Ying-Guey Fuh, A., Chen, C.-C., Liu, C.-K., Cheng, K.-T., Statman, D., Page, E., et al. (2009). Polarizer-free, electrically switchable and optically rewritable displays based on dye-doped polymer-dispersed liquid crystals. Opt. Express 17, 7088–7094. doi:10.1364/oe.17.007088
Yu, B. H., Ji, S. M., Kim, J. H., Huh, J. W., and Yoon, T. H. (2017). Fabrication of a dye-doped liquid crystal light shutter by thermal curing of polymer. Opt. Mat. (Amst). 69, 164–168. doi:10.1016/j.optmat.2017.04.029
Keywords: liquid crystal, liquid crystal/polymer composite, switchable windows, privacy control, radiant energy flow control
Citation: Halder S, Shin Y, Zhou Z, Zhang X, Hu L and Yang D-K (2022) Liquid crystal-polymer composites switchable windows for radiant energy flow and privacy control. Front. Soft. Matter 2:1021077. doi: 10.3389/frsfm.2022.1021077
Received: 17 August 2022; Accepted: 21 September 2022;
Published: 11 October 2022.
Edited by:
Suk-Won Choi, Kyung Hee University, South KoreaReviewed by:
Dae-Shik Seo, Yonsei University, South KoreaCopyright © 2022 Halder, Shin, Zhou, Zhang, Hu and Yang. This is an open-access article distributed under the terms of the Creative Commons Attribution License (CC BY). The use, distribution or reproduction in other forums is permitted, provided the original author(s) and the copyright owner(s) are credited and that the original publication in this journal is cited, in accordance with accepted academic practice. No use, distribution or reproduction is permitted which does not comply with these terms.
*Correspondence: Deng-Ke Yang, ZHlhbmdAa2VudC5lZHU=
Disclaimer: All claims expressed in this article are solely those of the authors and do not necessarily represent those of their affiliated organizations, or those of the publisher, the editors and the reviewers. Any product that may be evaluated in this article or claim that may be made by its manufacturer is not guaranteed or endorsed by the publisher.
Research integrity at Frontiers
Learn more about the work of our research integrity team to safeguard the quality of each article we publish.