 Gaia Urciuoli
 Odda Ruiz de Ballesteros
 Giuseppe Femina
 Finizia Auriemma
94% of researchers rate our articles as excellent or good
Learn more about the work of our research integrity team to safeguard the quality of each article we publish.
Find out more
ORIGINAL RESEARCH article
Front. Soft Matter, 25 October 2022
Sec. Polymers
Volume 2 - 2022 | https://doi.org/10.3389/frsfm.2022.1021006
This article is part of the Research TopicEditors’ Showcase 2023: PolymersView all 8 articles
Isothermal crystallization kinetics of ethylene/1-octene (C2/C8) multiblock copolymers synthesized by chain shuttling technology is investigated. The samples are a reactor blend of segmented chains characterized by alternating crystalline and amorphous blocks with C8 content of 0.5 and 20 mol%, respectively, and statistical distribution of block number/chain and block length. The analysis is carried out after complete removal of a fraction (5–12 wt%), namely consisting of C8-rich blocks, through Kumagawa extraction with boiling diethyl ether. The resultant diethyl ether-insoluble fractions have similar average content of C8 units (≈13–14 mol%) and of crystalline blocks (≈23–27 wt%) but different molecular mass (the number average molecular mass Mn is ≈ 60–70 kDa for the samples 1,2 and ≈38 and ≈21 kDa for the samples 3 and 4, respectively). An additional sample with Mn ≈ 93 kDa, but a greater average content of C8 units (≈15 mol%) and a smaller content of crystalline blocks (15 wt%) is also analyzed. The crystallization half time of the samples increases with increase of Mn and, for each sample, its logarithm increases linearly with a decrease of the undercooling by a factor of -0.155/°C, for the samples 1–4 and −0.031/°C, for the sample 5. Using the classic kinetic crystallization model by Lauritzen and Hoffman, values of energy barrier constant due to contributions from primary nucleation KN and crystal growth KG are extracted. The KN contribution is esteemed to amount to ≈34% of the total barrier assuming regime II for the sample 5 and regime III (or I) for the samples 1–4, to ≈34% for the sample 5 and 67% for the samples 1–4, assuming regime II for all the samples. In all the cases, regardless of the assumed regimes, the KN values of the sample 5 are lower than those of the samples 1–4. As a final remark, the implications of crystallization kinetics on the solid-state morphology are also discussed, considering that transmission electron microscopy (TEM) images present a partially mesophase separated morphology for the samples 1,2, and 5 and a classic lamellar morphology for the samples 3 and 4.
The solid-state morphology of semicrystalline block copolymers (BCs) is generally dependent on the complex interplay between the compatibility of the blocks and their crystallization properties (Hamley, 1999; Loo and Register, 2004; Müller et al., 2005a; Li and Register, 2013; Van Horn et al., 2018). In particular, for monodisperse di-block copolymers constituted by a crystallizable block covalently linked to an amorphous block, crystallization modes ranging from neat confinement of the crystals within the nanosized domains to complete disruption (break-out) of the phase separated morphology of the melt may occur depending on the inter-block segregation strength, the crystallization temperature Tc, the order to disorder transition temperature Todt, the glass transition of the amorphous blocks, the volume fractions of the blocks, and the relative kinetics of mesophase separation vs. crystallization rate (Loo et al., 2002; Nandan et al., 2006; Castillo and Müller, 2009; He and Xu, 2012).
Olefin multiblock copolymers (OBCs) by chain shuttling technology (CST) are a class of semicrystalline BCs with non-uniform chain microstructure synthesized by using two organometallic catalysts and a chain shuttling agent (CSA) (Arriola et al., 2006; Chum and Swogger, 2008; Zhang et al., 2013). They consist in the alternation of high density polyethylene (HDPE)-like blocks with very low concentration of 1-octene units that are thus able to crystallize (hard blocks), and octene-rich random ethylene/1-octene copolymers (soft blocks), which are substantially amorphous. The multiblock chain architecture arises from the repetition of reversible trans-alkylation events between two catalysts which differ significantly in their comonomer incorporation ability, through the mediation of a CSA (i.e., diethylzinc). The non-uniform chain microstructure is the result of a stochastic chain shuttling process that involves exchanges of the growing polymeryl chains between catalytic centers of the same or different catalyst type, determining homo- and hetero-shuttling events. As a consequence, OBCs feature a statistical distribution of block length and number of blocks/chain (Arriola et al., 2006; Chum and Swogger, 2008; Zhang et al., 2013). They can be considered really intriguing materials given their high performances as thermoplastic elastomers with high melting temperatures and low densities (Wang et al., 2007; Wang et al., 2009a). Their properties are clearly ascribable to their intrinsic chain microstructure and to the consequent implications of the chain microstructure on the inter-block segregation strength, phase separation of the blocks in different domains and crystallization.
The role of chain microstructure on the OBCs properties (Wang et al., 2007, Wang et al., 2009a, Wang et al., 2009b; Zuo et al., 2010, Zuo et al., 2011; Tong et al., 2013a, Tong et al., 2013b), phase separation in the melt, solid-state morphology, and crystallization (Khariwala et al., 2008; Jin et al., 2010; Park et al., 2010; Liu et al., 2011; Wen et al., 2012a, Wen et al., 2012b; Li et al., 2012; He et al., 2014; Tong et al., 2014; Auriemma et al., 2018a, Auriemma et al., 2018b, Auriemma et al., 2019, Auriemma et al., 2020; Urciuoli et al., 2021, Urciuoli et al., 2022) has been extensively investigated so far. Typical features of polydisperse BC systems characterized by low miscibility of the blocks are an increase of the order-to-disorder transition temperature Todt and of domain spacings compared to conventional monodisperse BCs (Matsen, 2007; Lynd et al., 2008). For OBCs, in particular, domains spacings on the order of 100 nm have been observed (Hustad et al., 2009; Park et al., 2010; Li et al., 2012; Auriemma et al., 2018a, Auriemma et al., 2020; Urciuoli et al., 2022; Vittoria et al., 2022). Hence the term mesophase separation has been coined to address the resultant phase separated morphologies (Park et al., 2010).
Mesophase separation in OBCs melts has been revealed through rheology measurements by time-temperature-superimposition failure at low frequencies (Park et al., 2010; Li et al., 2012; Auriemma et al., 2020). It has been reported that melt heterogeneities are dependent on the difference in comonomer (C8) content between the hard (H) and soft (S) blocks ΔC8. With increasing the ΔC8 value, the Flory interaction parameter χ increases. As a consequence, for a given average length of HS repetition units N, also the segregation strength χN and the tendency toward mesophase separation in the melt increase. The crystallization behavior of OBCs may be greatly influenced by the state of melt. In particular, because of the partial miscibility of the hard and soft blocks and the weak inter-block segregation strength, the crystals formed upon cooling may either crystallize undisturbed from a homogeneous melt, or disrupt completely the mesophase separated morphology of the melt (break-out crystallization) giving rise to an isotropic lamellar morphology similar to that one which sets in by cooling from a homogeneous melt, or end up in confined domains namely populated by the hard blocks, even though this confinement may be only partial (Li et al., 2010; Liu et al., 2011; Wen et al., 2012a; Wen et al., 2012b; Li et al., 2012; Auriemma et al., 2018a, Auriemma et al., 2020; Urciuoli et al., 2022). In the latter case, since the hard blocks dissolved in the surrounding matrix populated by soft blocks crystallize, the crystals confined inside the hard-block domains tend to cross the boundaries in the outside regions, forming well interconnected web-like meso-structures (Li et al., 2010; Liu et al., 2011; Wen et al., 2012a, Wen et al., 2012b; Li et al., 2012; Auriemma et al., 2018a, Auriemma et al., 2020; Urciuoli et al., 2022). The term “pass-through” crystallization has been coined to address this peculiar crystallization mode (Li et al., 2010).
In general, the crystallization kinetics of OBCs is expected to be affected by several factors, including: 1) the chain microstructure, i.e., the distribution of block length, the inter- and intra-chain compositional heterogeneity, the fraction of hard blocks; 2) the relative inter-block segregation strength, that is the ratio between χN at Tc and at Todt; 3) the molecular mass; 4) the state of mixing in the melt. The implications between chain microstructure, mixing state of the melt, and crystallization kinetics of OBCs are aspects that have been comparatively less intensively investigated, so far. As an example, the effect of hard block content (from 18 to 100 wt%) on the crystallization kinetics of OBCs was investigated by Khariwala et al. (2008). Samples sharing the same C8 content of 0.5 and 18.9 mol% in the hard and soft blocks, respectively, have been considered. It has been shown that the bulk crystallization rate, measured by DSC, as well as the linear growth rate, measured by polarized optical microscopy, decrease only slightly with a decrease of the hard block content. This decrease has been attributed to an increase of the fold surface energy, entailing some increase of disorder at fold surface of the lamellar crystals, with increase of soft block content. In contrast, for random copolymers, even a small amount of comonomeric units is able to induce a high increase of fold surface energy and remarkable decrease of crystallization rate. In another study (Tong et al., 2014), the crystallization kinetics of two OBC samples characterized by different segregation strength and different hard block content has been investigated at low and high crystallization temperatures, starting from both a mesophase separated and a homogeneous melt. The most important result of this study consists in having highlighted that the crystallization rate depends not only on the state of the melt, but also from the chain microstructure.
The present work is focused on the study of the crystallization kinetics of a set of well characterized commercial OBC samples, that have similar molecular properties such as comonomer content in the hard and soft blocks, similar hard block content, but different molecular mass (Auriemma et al., 2020; Urciuoli et al., 2021, Urciuoli et al., 2022). An additional sample with high molecular mass, but a greater average content of C8 units and a smaller content of hard blocks is also analyzed. The samples are reactor blends of chains having different block length and number of blocks per chain (Urciuoli et al., 2021, Urciuoli et al., 2022). This constitutional heterogeneity holds also at intra-chain level, since the block length changes not only from chain to chain but also within the same chain. The aim is to shed light on how this complexity affects the bulk crystallization kinetics of OBCs. The possible implications between crystallization kinetics and solid-state morphology are also discussed.
The analyzed OBC samples, synthesized through chain shuttling polymerization technology, were supplied by the Dow Chemical Company. The samples share the same C8 content equal to 0.5 and 20 mol% for the hard and soft blocks, respectively. The analysis was carried out on the fraction insoluble in diethyl ether (EE) obtained after subjecting the samples to exhaustive fractionation in boiling solvent in an inert Ar atmosphere, to eliminate the EE soluble fraction, namely constituted by soft blocks (Auriemma et al., 2018b, Auriemma et al., 2020; Urciuoli et al., 2021, Urciuoli et al., 2022). About 1 g of the pellets of each sample was reduced to powders by milling in liquid N2 and then placed in a Kumagawa extracting apparatus with 250 ml of EE (Teb = 34.6°C). The solvent was heated to the boiling point and then the system was left under reflux conditions for at least 8 h. The insoluble fraction (iEE) obtained at the end of the protocol was dried under vacuum at ≈ 40°C and then weighed. In all cases the EE soluble fraction results less than 12 wt%. The procedure was repeated on three independent aliquots of each sample, doubling at least in one of the three tests the extraction time, in order to ensure reproducibility of the extracting protocol. The weight loss of the samples after the extracting protocol was less than 2%. In Table 1, the values of the relative weight percentage of the iEE fractions together with the values of molecular parameters such as the average content of C8 units (xC8), the weight fraction of hard blocks (wH), the number average and mass average molecular masses (Mn and Mw, respectively), and the polydispersity index (Đ = Mw/Mn) of the iEE fractions are collected. The resultant EE insoluble fractions of the samples 1–4 (sample x-iEE with x = 1–4) have similar average content of C8 units (xC8 ≈13–14 mol%) and of hard blocks (wH ≈23–27 wt%) but different molecular mass (the values of the number average molecular mass Mn are ≈68 and 60 kDa for the samples 1-iEE and 2-iEE, respectively and ≈38 and ≈21 kDa for the samples 3-iEE and 4-iEE, respectively). The iEE fraction of the sample 5 (5-iEE) presents a high molecular mass (Mn ≈ 93 kDa), but a greater average content of C8 units (≈15 mol%) and a smaller content of hard blocks (15 wt%).
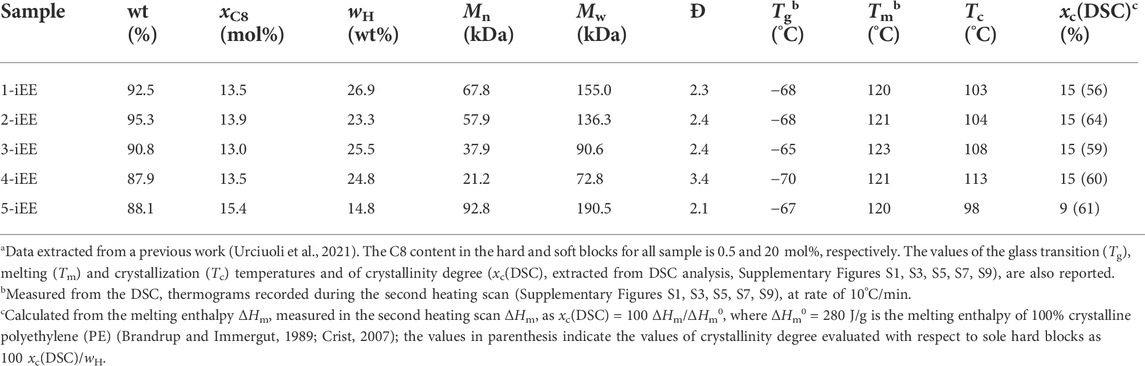
TABLE 1. Weight percentage of the iEE fractions of the OBC samples and corresponding average content of 1-octene units (xC8), weight fraction of hard blocks (wH), number average and mass average molecular masses (Mn and Mw, respectively) and polydispersity index (Đ = Mw/Mn)a.
DSC thermograms of iEE fractions were recorded with a Mettler Toledo DSC 822 apparatus, in a N2 atmosphere, at scanning rate of 10°C/min (Supplementary Figures S1, S3, S5, S7, S9). The values of glass transition, crystallization and melting temperatures are reported in Table 1. The melting temperatures are relative to the second heating scan. The values of the degree of crystallinity, calculated from the melting enthalpy measured in the second heating scan ΔHm as xc(DSC) = 100 ΔHm/ΔHm0, are also reported in Table 1, where ΔHm0 = 280 J/g is the melting enthalpy of 100% crystalline polyethylene (PE) (Brandrup and Immuergut, 1989; Crist, 2007). The numbers in parenthesis indicate the crystallinity degree evaluated with respect to the sole hard blocks as 100 xc(DSC)/wH.
In situ isothermal crystallization were performed in a Mettler Toledo DSC 822 apparatus. The following thermal program was applied to all the samples: the sample was first heated from room temperature up to 180°C at 20°C/min and kept at this temperature for 10 min; then, it was cooled to the selected crystallization temperature Tc(iso) at 40°C/min and kept at Tc(iso) for the needed time until reaching complete crystallization; in the last step, the sample is heated from the Tc(iso) up to 180°C. The crystallization exotherms measured at the different values of Tc(iso) as a function of time are reported in the Supporting Information (Supplementary Figures S2, S4, S6, S8, S10). The relative degree of crystallinity xc’(t) is defined as the ratio between the crystallinity xc(t) achieved at time t and the crystallinity achieved on completion time xc(∞). It is calculated as:
where ΔHc(t) and ΔHc(∞) are the values of crystallization enthalpy achieved at time t and on completion. The conversion of the DSC curves recorded during isothermal crystallization to xc’(t) vs. t was performed, after having identified a suitable baseline (see Supplementary Figures S2A, S4A, S6A, S8A, S10A), using a specific utility available in the STARe software of Mettler Toledo.
The Avrami exponent was estimated through non-linear fitting of the curves xc’(t) vs. t using the Avrami equation:
where t1/2 is the half-crystallization time, that is the time at which xc'(t) reaches 50%, and n is the Avrami exponent.
The crystallization temperatures Tc(iso) were selected in-between the crystallization and second melting temperatures of each sample, as recorded in the standard DSC scans of Supplementary Figures S1, S3, S5, S7, S9.
Transmission electron microscopy (TEM) bright-field images were obtained with a FEI TECNAI G2 200 kV instrument operated at 120 kV and equipped with a 4 K Eagle Camera. Specimens for TEM analysis were prepared as follows: drop-cast films (thickness 50–80 nm) were deposited on glass slides with a 0.5wt% solution of the iEE fractions in p-xylene; after drying, the films were quenched from 180°C in liquid nitrogen, after an isothermal stage for 10 min at 180°C; the films were covered with carbon, removed from the glass slides, and transferred to 200-mesh copper grids. Prior to TEM observation, a staining treatment with a RuO4 solution was performed, to enhance contrast between the amorphous and the crystalline phases.
As shown in Table 1, the OBC samples contain a non-negligible fraction soluble in boiling EE. This fraction is about 5wt% for the sample 2, 8–10 wt% for the samples 1 and 3 and 10–12 wt% for the samples 4 and 5. The EE soluble fraction is constituted by amorphous soft blocks not attached to hard blocks and originates from self-shuttling events occurring between the metal centers of the catalyst with a high C8 incorporation capability (Auriemma et al., 2018b; Urciuoli et al., 2021, Urciuoli et al., 2022). Since this EE fraction could dilute the samples to a different extent, the bulk isothermal crystallization kinetics of the OBCs is studied after removal of it, on the corresponding iEE fractions. In addition, the extraction procedure allows to remove also possible additives and/or impurities such as talc and catalyst remnants (Urciuoli et al., 2022), that could interfere with the crystallization.
The iEE fractions of OBC samples show a glass transition temperatures of ≈ −70°C and melting and crystallization temperatures of ≈120 and ≈100–110°C, respectively (Supplementary Figures S1, S3, S5, S7, S9; Table 1). The low molecular mass samples 3-iEE and 4-iEE show the highest crystallization temperatures (108 and 113°C, respectively), whereas the sample 5-iEE, with the lowest concentration of hard blocks, shows the lowest crystallization temperature, equal to 98 °C. The crystallization temperatures Tc(iso) were selected in a quite narrow range, of ≈10°C, between the crystallization and second melting temperatures, because of the need to avoid too fast or too slow crystallization rates for conducting the experiments in situ within the DSC apparatus (Supplementary Figures S1, S3, S5, S7, S9). This means that it was not possible to select common values of Tc(iso) for all the samples, neither of undercooling ΔT, defined as the difference between the equilibrium melting temperature Tm0 and the crystallization temperature Tc(iso), also because all iEE fractions share similar Tm0 values of 414.8 K (Auriemma et al., 2018b).
The DSC thermograms recorded during the crystallization isotherms as a function of time and in the successive heating scan are reported in Supplementary Figures S2, S4, S6, S8, S10. After a short delay time the samples start to crystallize, showing a broad exothermic peak (Supplementary Figures S2A, S4A, S6A, S8A, S10A). The so formed crystals melt in a relatively narrow temperature range in the successive heating scan (Supplementary Figures S2B, S4B, S6B, S8B, S10B). The time of incipient crystallization (t0), the width of the exothermic peaks and the melting temperature increase with increase of Tc(iso). The values of t0 and of crystallization (ΔHc(∞)) and melting (ΔHm(∞)) enthalpy and degree of crystallinity (xc(∞)) achieved at completion time of the isothermal processes, extracted from the thermograms of Supplementary Figures S2A, S4A, S6A, S8A, S10A, are collected in Table 2.
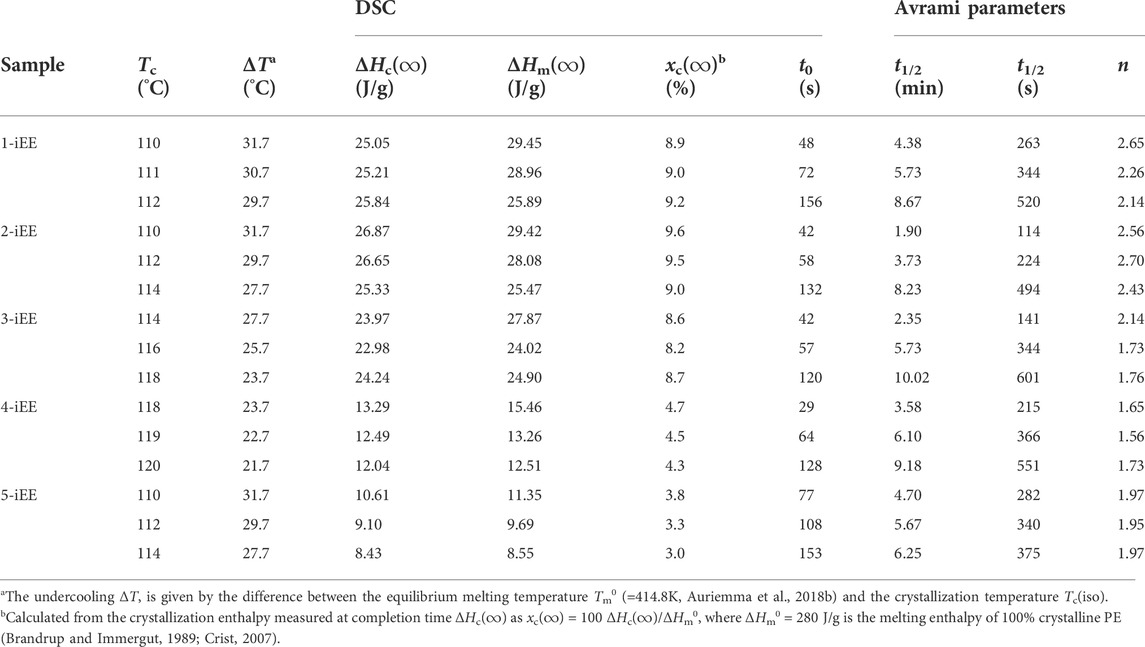
TABLE 2. Values of crystallization temperatures Tc(iso), crystallization [ΔHc(∞)] and melting enthalpy [ΔHm(∞)] and degree of crystallinity [xc(∞)] achieved at completion time of the isothermal processes and time of incipient crystallization (t0) extracted from DSC thermograms of Supplementary Figures S2A S4A, S6A, S8A, S10A. The values of the half-crystallization time (t1/2) and Avrami exponent (n) obtained by fitting the curves of Figure 1 with the Avrami equation are also reported.
From the data of Table 2 it is possible to check that, for each sample, the values of the crystallization enthalpy ΔHc(∞) measured at completion time at each Tc(iso) are only slightly lower than those of melting enthalpy ΔHm(∞) recorded in the successive heating scan, indicating that during the cooling step from 180 °C to the selected crystallization temperatures (cooling rate of 40°C/min), the crystallization of the samples is not significant. Furthermore, it is apparent that, with increasing the crystallization temperature, the values of ΔHc(∞) and, hence, of the maximum degree of crystallinity achieved at the end of crystallization process xc(∞), are about constant or tend to decrease only slightly. This suggests that, for each sample, due to the narrow range of the sampled undercoolings, the concentration of ethylene sequences available for crystallization at each Tc(iso) decreases only slightly.
The values of the relative degree of crystallinity xc'(t) calculated from the DSC crystallization thermograms of Supplementary Figures S2A, S4A, S6A, S8A, S10A, Eq. 1 are reported in Figure 1 as a function of the crystallization time t. In all the cases, the relative crystallinity grows with time according to a sigmoidal shape. The fit to data with the Avrami equation Eq. 2 gives the values of half crystallization time and the Avrami exponents reported in Table 2.

FIGURE 1. Relative degree of crystallinity as a function of crystallization time for the OBCs fractions 1-iEE (A), 2-iEE (B), 3-iEE (C), 4-iEE (D), and 5-iEE (E), isothermally crystallized at the indicated temperature Tc(iso). The solid lines are the fit to the data with Avrami equation Eq. 2.
Inspection of Table 2 indicates that the kinetics data of Figure 1 conform to an Avrami exponent between 2 and 3, for the samples 1-iEE and 2-iEE, and close to 2 for all the other samples, consistent with a crystal growth in two-dimensions and heterogeneous nucleation.
It is apparent too that for all the samples the half-crystallization time t1/2 increases with increase of the crystallization temperature. If one compares the behavior of the five samples, it becomes clear that, in order to probe the bulk crystallization of the OBCs via DSC apparatus on a comparable time scale, the samples 1-iEE, 2-iEE, and 5-iEE have to access to lower crystallization temperatures, which in turn means higher values of undercooling ΔT, with respect to samples 3-iEE and 4-iEE (Figure 1; Table 2). In other terms, at any given crystallization temperature (undercooling), it is clear that for the samples 1-iEE, 2-iEE, and 5-iEE crystallization is delayed with respect to the other two iEE fractions. As an example, if one considers the crystallization temperature Tc = 114°C (ΔT = 27.7°C), which is shared by the samples 2-iEE, 3-iEE, and 5-iEE, it emerges that the values of t1/2 for the samples 2-iEE and 5-iEE are 3–4 times higher than the t1/2 values for the samples 3-iEE (Table 2). These differences are clearly due to differences in molecular parameters (vide infra).
In order to shed light on the crystallization behavior of the OBC samples, the bulk crystallization kinetics of the corresponding iEE fractions are directly compared in Figure 2A, where the logarithm of the values of the half-crystallization time is reported as a function of undercooling.
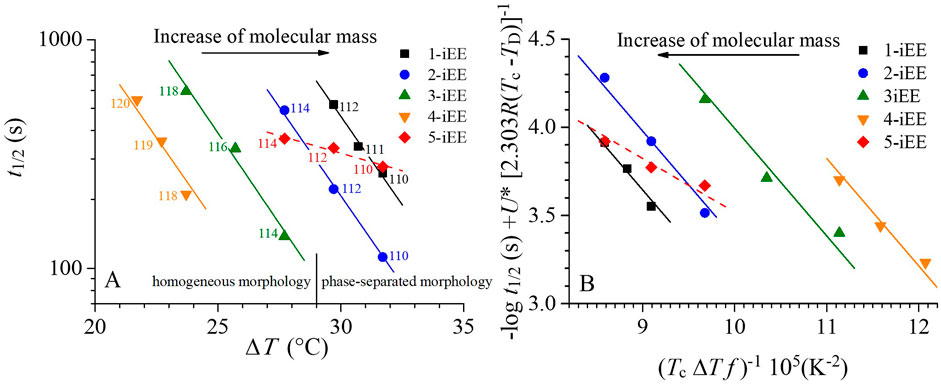
FIGURE 2. (A) Crystallization half-times t1/2, as a function of undercooling for the iEE fractions of the OBC samples 1–5. Data are fit to an exponential function. (B) Lauritzen-Hoffman plots of the bulk crystallization rate (1/t1/2) of the iEE fractions of the OBC samples 1-5 where U* is set equal to 5,736 cal/mol, corresponding to the standard value for PE (Armistead and Hoffman, 2002), and TD is assumed equal to Tg minus 20 K (Khariwala et al., 2008) Eq. 4. The number 2.303 corresponds to the inverse of log e.
It is apparent from Figure 2A that within the narrow range of the explored crystallization temperatures, the logarithmic values of t1/2 decrease with increase of undercooling with the same slope (-0.155/°C) for the samples 1-iEE—4-iEE and with a much lower slope (−0.031/°C) for the sample 5-iEE. The similar temperature dependence of the crystallization rate for the iEE fractions of the samples 1–4 is due to similar values of the average content of C8 units and of hard blocks, as well as to the similar average length of the soft and hard blocks (Urciuoli et al., 2021, Urciuoli et al., 2022). The iEE fraction of the sample 5, instead, which shows a completely different chain microstructure and a higher molecular mass, displays a different temperature dependence of the crystallization rate too.
It is worth noting that the major differences in the crystallization kinetic behavior of the iEE fractions of the samples 1–4 consists in that, in spite of the similar shape, the t1/2–ΔT data of Figure 2A are clearly shifted toward lower values of undercooling according to the sequence 1-iEE (right-most), 2-iEE, 3-iEE, and 4-iEE (left-most). This indicates that, at any given undercooling, the crystallization kinetics decreases, being the highest for the sample 4-iEE and the lowest for the sample 1-iEE. This horizontal shift is in agreement with the fact that the DSC thermograms recorded at 10°C/min (Supplementary Figures S1, S3, S5, S7, S9; Table 1) show that the sample 4-iEE exhibits the highest crystallization temperature (122 °C) whereas the sample 1-iEE the lowest one (103°C). Although small differences in the chain microstructure may play a role (vide infra), the horizontal shift of the t1/2-ΔT data for the iEE fractions of the samples 1–4 may also be due to differences in molecular mass. Indeed, the molecular mass decreases from the right to the left in Figures 2A, and is the highest for the sample 1-iEE (Mn = 68 kDa), decreases for the sample 2-iEE (Mn = 58 kDa) and 3-iEE (Mn = 38 kDa) and reaches the lowest value for the sample 4-iEE (Mn = 21 kDa). Therefore, although the horizontal shift effect could be ascribed also to small differences in the chain microstructure, it seems that the crystallization kinetics of statistical multiblock copolymers by chain shuttling technology showing similar average chain microstructure is namely controlled by molecular mass. The dependence of crystallization rate on the molecular mass at the same undercooling has been already described for several polymers such as PE, (Ergoz et al., 1972; Fatou and Marco. 1977), random ethylene copolymers (Alamo and Mandelkern, 1991), poly (ethylene oxide) (Maclaine and Booth, 1975), poly (ethylene succinate) (Umemoto and Okui, 2005). The molecular mass dependence of the bulk crystallization rate is quite complicated (Okui et al., 2007), because it depends on the undercooling and on the molecular mass dependence of nucleation and growth rates and, in particular, on the mechanism of primary, homogeneous or heterogeneous, nucleation, and the dimensions of the crystal growth. For instance, it has been shown that, in the case of three-dimensional growth of the crystals, the maximum crystallization rate (at crystallization temperature Tcmax) scales with the molecular mass M according to a power law Mγ with γ comprised in between -1.5 and 0, depending on the contribution from heterogeneous and homogeneous nucleation (Okui et al., 2007). However, for crystallization temperatures different from Tcmax the values of the exponent γ may be well outside the predicted range.
In Figure 2B, the bulk crystallization kinetics data are interpreted as prescribed by the Lauritzen-Hoffman (L-H) approach (Lambert and Phillips, 1994; Müller et al., 2005b; Lorenzo et al., 2007; Lorenzo and Müller, 2008). Indeed, albeit the L-H kinetic theory is strictly appropriate to describe the crystal growth data only, it has been often applied to describe also the temperature dependence of bulk crystallization rate Gb (set equal to 1/t1/2), provided that the barrier energy constant for the crystallization process Kb is reinterpreted as the sum of an apparent barrier energy constant for primary nucleation KN and the effective barrier energy constant for crystal growth KG (Lorenzo and Müller, 2008), from now on addressed simply as barrier energy for primary nucleation and growth, respectively (Okui et al., 2007).
Therefore, for the analysis of the temperature dependence of the bulk crystallization rate Gb(T) (proportional to 1/t1/2), the L-H formalism Eq. 3 is used:
The main difference with the classic L-H approach stems from the value of Kb, which, instead of being coincident with KG, it is assumed equal to Kb = KG + KN. In Eq. 3 the pre-exponential term G0b is a growth rate constant; U* is the activation energy controlling the transport of the chains to the growth front; R is the gas constant; TD is the temperature at which the segmental dynamics may be considered completely blocked and f (= Tc(iso)/[Tm0 + Tc(iso)]) is a factor that accounts for effects due to decrease in the heat of fusion upon stem deposition.
For the plot of Figure 2B, Eq. 3 is rearranged as it follows:
where 2.303 is the inverse of the decimal logarithm of e. The value of U* is set equal to 5,736 cal/mol, corresponding to the standard value for PE (Armistead and Hoffman, 2002), whereas TD is assumed equal to Tg minus 20 K (see for instance Khariwala et al., 2008).
The L-H plot of Figure 2B indicates that the iEE fractions of the samples 1-4 share the same slope. Furthermore, as already discussed before, the kinetics data are horizontally shifted, from the left to the right, with increasing the molecular mass. Indeed, the horizontal shift is reflected in an increase of the pre-exponential term in Eq. 3, which, in the L-H theory, depends on the segmental dynamics and the way the transport phenomena of the stems toward the growth front are influenced by the molecular mass and chain microstructure in general in the different regimes (see for instance Armistead and Hoffman, 2002). Therefore, for the fractions of the samples 1─4, with similar chain microstructure, the pre-exponential term decreases with an increase of molecular mass, consistent with the decrease of crystallization rate and a decrease of segmental dynamics. For the iEE fraction of the sample 5, instead, the slope is almost halved. The corresponding values of Kb are equal to 1.4 105 K2 for the fractions 1-iEE ─ 4-iEE and 7.0 104 K2 for the fraction 5-iEE.
In the working hypothesis that the different temperature dependence of the sample 5-iEE with respect to the samples 1-iEE ─ 4-iEE is somehow due to the nucleation step, the value of KG may be evaluated using the standard parameters of PE (Crist, 2007), valid also for OBCs (Auriemma et al., 2018b) through Eq. 5:
where n is equal to 4, 2, and 4 for regimes I, II and III, respectively, b corresponds to the lateral size of a PE stem and it is equal to 4.15 10−8 cm, σ and σe are the values of the lateral surface free energy and of the fold surface free energy, respectively, and are equal to 11.8 (Hoffman and Miller, 1997) and 44 erg/cm2, (Crist, 2007) respectively. Finally, k is the Boltzmann constant.
Considering that the comparatively low temperature dependence of the crystallization rate for the sample 5-iEE with respect to the samples 1-iEE ─ 4-iEE is typical of regime II, if one assumes n = 4 (regime I or III) for the samples 1-iEE ─ 4-iEE and n = 2 (regime II) for the sample 5-iEE, the value of KG (Eq. 5) would correspond to 9.2 104 K2 for the samples 1-iEE ─ 4-iEE and 4.6 104 K2 for the sample 5-iEE. Hence, the calculated values of the barrier energy constant for primary nucleation KN (= Kb—KG) would be equal to 4.8 104 K2 for the samples 1-iEE ─ 4-iEE and 2.4 104 K2 for the sample 5-iEE (that is ≈ 34% of Kb). Conversely, assuming n = 2 (regime II) for all the samples, the value of KG would correspond to 4.6 104 K2. This would give values of KN equal to 9.4 104 K2 for the samples 1-iEE ─ 4-iEE and 2.4 104 K2 for the sample 5-iEE (that is ≈ 67% of Kb for the samples 1-iEE ─ 4-iEE and ≈34% for the sample 5-iEE). Therefore, regardless of the assumed regimes, the barrier energy constants for primary nucleation KN of the sample 5-iEE would result remarkably lower than that of the samples 1-iEE ─ 4-iEE.
It is worth noting that the barrier energy constant for primary nucleation KN of PE is about 27% of the total barrier energy constant Kb (Lorenzo and Müller, 2008). Considering that the crystallizing hard blocks of the studied OBCs consist of linear polyethylene with a small concentration of 1-octene units (0.5 mol%), a barrier energy constant equal to 34% of Kb for all the samples seems quite reasonable, suggesting that in the sampled undercooling range the samples 1-iEE ─ 4-iEE are in the growth regime I or III, whereas the sample 5-iEE is in the growth regime II.
The separation of the energetic barrier constants associated to the overall crystallization phenomenon in the nucleation and crystal growth contributions was applied also using different kinetic crystallization theories (Lorenzo and Müller, 2008). In particular, it was considered that whenever crystallization occurs near the equilibrium melting temperature Tm0 two cases of nucleation and crystal growth may occur: 1) three-dimensional nucleation for which the rate is proportional to (1/(Tm0-Tc)2) and 2) two-dimensional nucleation, for which the rate is proportional to 1/(Tm0-Tc) (Eqs 2,3 of Lorenzo and Müller, 2008). It was shown that regardless of the theoretical approach employed there, the energy barrier for nucleation of the polymer under study (i.e., poly (1,4-dioxan-2-one) is about the same (45%) of the total energy barrier for the overall crystallization process.
The remarkable difference in the crystallization kinetics of the high molecular mass samples 1, 2, and 5, with respect to the low molecular samples 3 and 4, may also be ascribed, at least in part, to differences in the mixing state of the melt. The mixing state of the melt was indirectly probed resorting to TEM analysis, on specimens that after a heat treatment at 180°C for 10 min, were directly quenched in liquid N2 (see Materials and methods). In this way, the mixing state achieved at 180°C would be the same as that achieved by the samples subjected to isothermal crystallizations and the solid-state morphologies achieved by the melt-quenched samples would be reminiscent of the mixing state reached in the melt at 180°C. The bright field TEM images of melt-quenched specimens of the samples 1-iEE ─ 5-iEE are reported in Figure 3.
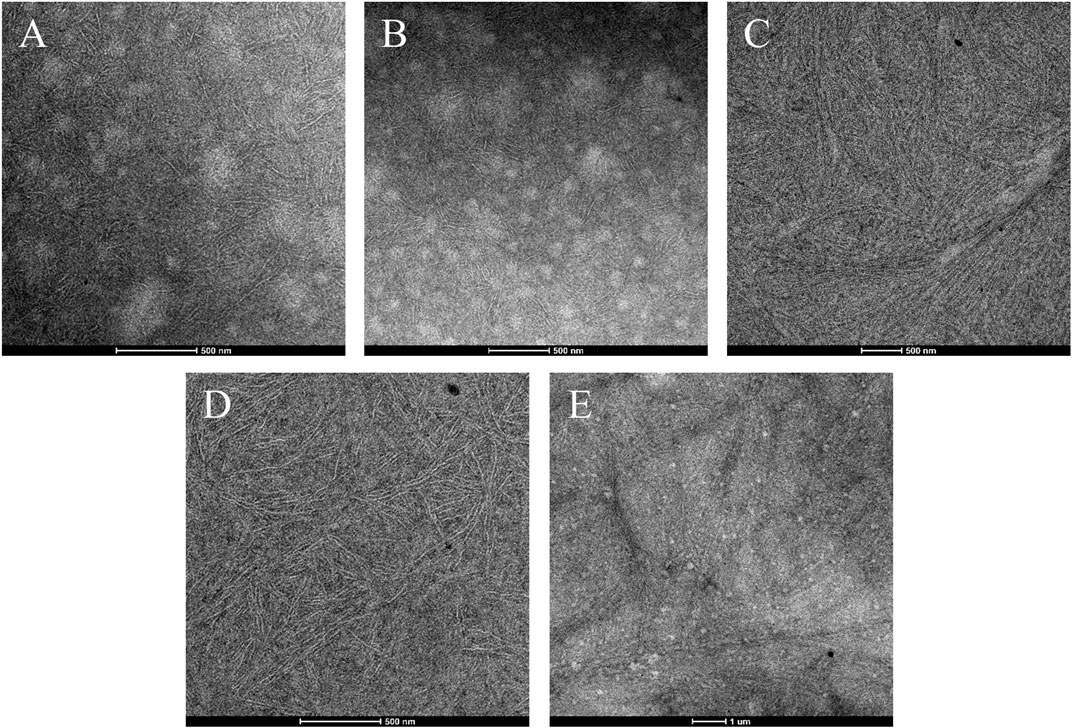
FIGURE 3. Bright-field TEM images of the iEE fractions of the OBC samples 1–5:1-iEE (A), 2-iEE (B), 3-iEE (C), 4-iEE (D), and 5-iEE (E). The samples are prepared by quenching in N2(l) from the melt at 180°C. The soft-block-rich regions appear dark because of RuO4 staining. The low magnification image E highlights that the observed morphology is uniform.
The samples 1-iEE, 2-iEE, and 5-iEE (Figures 3A,B,E) show a heterogeneous morphology, in which a dark matrix appears spotted by round-shaped bright domains with irregular size and not well-defined boundaries. The circular domains appear densely populated by lamellar crystals laying on edge that often cross the boundaries, passing through the surrounding phase. The lamellar crystals are clearly formed by the long ethylene sequences belonging to the hard blocks, whereas the soft blocks are rejected in the surrounding amorphous phase. This indicates that the samples 1-iEE, 2-iEE, and 5-iEE display a phase separated morphology in the solid-state, with domain size of the order of hundred nanometers, where the rounded bright motifs and the surrounding dark matrix correspond to the hard-block-rich and soft-block-rich phases, respectively. The soft-block-rich phase appears dark because of the higher electron density imparted by the RuO4 staining. The “pass-through” crystallization mode (Li et al., 2010) shown by the samples 1-iEE, 2-iEE, and 5-iEE is typical of OBCs (Wen et al., 2012; Tong et al., 2014; Auriemma et al., 2020).
The TEM images of the samples 3-iEE and 4-iEE (Figures 3C,D), instead, show a rather uniform morphology, with lamellar crystals growing in disordered arrangement or forming bundle-like structures all over the space.
The results of the TEM analysis performed on melt-quenched samples (Figure 3) allow addressing the mixing state of the melt upon crystallization. The high molecular mass samples 1-iEE, 2-iEE, and 5-iEE most likely crystallize from a phase separated melt and also show a slow crystallization rate in isothermal (Figure 2) and non-isothermal (Table 1) conditions. These samples show also a high primary nucleation barrier and a low L-H pre-exponential factor. The low molecular mass samples 3-iEE and 4-iEE, instead, most likely crystallize from a homogeneous melt and also show a fast crystallization rate, regardless of crystallization conditions (Figure 2; Table 1). Samples 3-iEE and 4-iEE show also a comparatively higher L-H pre-exponential factor. Due to partial solubility of hard and soft blocks, indeed, the crystallization from a homogeneous melt is expected to proceed at fast pace, because the transport of chain segments toward the crystal growth front would result almost unhindered, especially for low molecular mass samples. The crystallization from a heterogeneous melt, instead, is expected to proceed at slower pace, due to the partial segregation of the long hard blocks in separated domains. Since long ethylene sequences are expected to crystallize first, the simultaneous attachment to different crystals of ethylene sequences belonging to the same chain would greatly delay the transport phenomena of further crystallizable sequences toward the crystal growth front. This effect would result in a low crystallization rate, especially for high molecular mass OBCs.
It is worth remarking that the differences in the state of the melt for the unfractionated samples 1 and 3 are confirmed by the results of melt rheology measurements (Auriemma et al., 2020). In particular, the presence of heterogeneities in the melt for the sample 1 was indicated by the dominance at low frequencies of domain-relaxation modes, causing TTS failure in this frequency region, whereas the homogeneous state of the melt for the sample 3 was indicated by absence of TTS failure at all the frequencies.
The remarkable differences in the solid-state morphology of the samples 1-iEE ─ 4-iEE in spite of the similar average chain microstructure (similar average content of C8 units and of hard blocks, similar average length of the soft and hard blocks) may be attributed to differences in the compositional heterogeneity of these samples that occurs not only at intramolecular level but also at intermolecular level (Urciuoli et al., 2021). These samples, indeed, are characterized by remarkable differences in the distributions of the length of hard and soft blocks, that vary both from chain to chain and within the same chain. In particular, for the iEE fractions of the samples 1 and 2, the presence of a non-negligible fraction of chains with hard blocks of high length (Urciuoli et al., 2021) induces a microphase separated morphology already in the melt. On the other hand, for samples 3–4, the homogeneous morphology observed in the solid-state complies with the absence of heterogeneity in the melt (Auriemma et al., 2020) and with the presence of a non-negligible fraction of chains with low molecular mass, and/or containing hard and soft blocks of short and high length, respectively, acting as diluent (Urciuoli et al., 2021). Indeed, short chains rich in soft blocks and with short hard blocks, which are prevalent in the iEE fraction of the samples 3 and 4, cause concentration fluctuations, destabilization of the microphase separated melt, and no microphase separation in the solid state. Long chains with long hard blocks, prevalent in the iEE fraction of the samples 1 and 2 stabilize phase separation in the melt, and, upon crystallization, induce confinement of the hard block in separated domains.
As a further remark, we point out that the crystallization kinetics of OBCs in comparison with that of random ethylene/1-octene copolymers has been studied by Khariwala et al., 2008. It is shown that the crystallization rate of OBC samples characterized by similar molecular mass, the same C8 content of 0.5 and 18.9 mol% in the hard and soft blocks, respectively, but different hard block content decreases only slightly with decrease of the hard block content and it is the greatest for a random copolymer with identical C8 content as the hard blocks.
An alternative approach for the study of crystallization kinetics of OBCs may be envisaged in the multistage model proposed by Strobl (Heck et al., 1999; Rabiej et al., 2004; Strobl, 2007). According to this model, the growth of the crystals occurs through deposition on the growth front of crystalline blocks deriving from preexisting mesomorphic aggregates (layers) having the same thickness of the final crystals. The study of the kinetic implications of this multiphase model describing polymer crystallization and melting in the crystallization process of OBCs would be intriguing. The intrinsic tendency of the hard blocks to form aggregates already in the melt, possibly enhanced by aging treatments at suitable temperatures (Tong et al., 2014), indeed, comply well with the hypothesis that pre-crystalline aggregates play a role in the crystallization process.
The bulk crystallization kinetic in isothermal conditions of some ethylene/1-octene (C2/C8) multiblock copolymers samples synthesized by chain shuttling technology is investigated. The analysis is carried out after subjecting the samples to exhaustive Kumagawa extraction with boiling diethyl ether (EE), in order to remove the fraction of material constituted by sole soft blocks. The selected samples share the same characteristics as far as the 1-octene content in the soft and hard blocks, equal to 0.5 and 20 mol%, respectively. Four samples have similar hard block content (≈23–27 wt%) but different molecular mass, with Mn comprised in the range from ≈21 to ≈70 kDa, whereas a fifth sample has a high molecular mass (≈93 kDa) but a lower hard block content (≈15 wt%).
In the sampled temperature range, the crystallization rate decreases with increase of temperature, with an identical temperature dependence for the samples with similar chain microstructure and a significantly lower temperature dependence for the sample with lower hard block content. The analysis of the crystallization kinetics highlights the role of molecular mass. In particular, it is shown that at any given undercooling, the crystallization rate of the samples with similar chain microstructure decreases with increase of molecular mass. It is argued that this decrease is due to the decrease in the segmental dynamics and to the way the mechanism underlying transport phenomena of the stems toward the growth front are influenced by the molecular mass.
The use of the classic model by Lauritzen and Hoffman (L-H) to interpret the bulk crystallization kinetics of the OBC samples has allowed to extract the values of energy barrier constant due to contributions from primary nucleation and crystal growth. It is shown that the contribution from primary nucleation amounts to ≈34% of the total barrier, assuming regime II for the sample 5-iEE and regime III (or I) for the samples 1-iEE─4-iEE. In the hypothesis that regime II holds for all the samples, the contribution from primary nucleation amounts to ≈34% of the total barrier for the sample 5-iEE and 67% for the samples 1-iEE─4-iEE. It is worth noting that, regardless of the assumed regimes, the barrier energy constants for primary nucleation KN of the sample 5-iEE would result remarkably lower than that of the samples 1-iEE─4-iEE.
The effect of the mixing state of the melt on the crystallization rate is also analyzed by TEM, in the hypothesis that the solid-state morphology which sets in by quenching the melt is reminiscent of its degree of heterogeneity. It is shown that the TEM images of the melt-quenched samples with high molecular mass display a phase separated morphology in the solid-state, characteristic of pass-through crystallization mode. The TEM images of melt-quenched samples with low molecular mass instead, show a more homogeneous morphology. The unhindered crystallization of the ethylene sequences belonging to the hard blocks embedded in a homogeneous melt accounts well for the faster crystallization rate of the low molecular mass samples. For the high molecular mass samples, instead, the phase separation in the melt causes major hindrance, resulting in slower crystallization kinetics.
The original contributions presented in the study are included in the article/Supplementary Material, further inquiries can be directed to the corresponding authors.
Conceptualization: GU and FA; methodology: GU, ORB, and FA; investigation and writing original draft: GU; data curation: GU, ORB, and GF; supervision and writing—review and editing: GU and FA; all authors have read and agreed to the published version of the manuscript.
This research forms part of the research programme of DPI, project #817.
The authors declare that the research was conducted in the absence of any commercial or financial relationships that could be construed as a potential conflict of interest.
All claims expressed in this article are solely those of the authors and do not necessarily represent those of their affiliated organizations, or those of the publisher, the editors and the reviewers. Any product that may be evaluated in this article, or claim that may be made by its manufacturer, is not guaranteed or endorsed by the publisher.
The Supplementary Material for this article can be found online at: https://www.frontiersin.org/articles/10.3389/frsfm.2022.1021006/full#supplementary-material
Alamo, R. G., and Mandelkern, L. (1991). Crystallization kinetics of random ethylene copolymers. Macromolecules 24, 6480–6493. doi:10.1021/ma00024a018
Armistead, J. P., and Hoffman, J. D. (2002). Direct evidence of regimes I, II, and III in linear polyethylene fractions as revealed by spherulite growth rates. Macromolecules 35, 3895–3913. doi:10.1021/ma010313u
Arriola, D. J., Carnahan, E. M., Hustad, P. D., Kuhlman, R. L., and Wenzel, T. T. (2006). Catalytic production of olefin block copolymers via chain shuttling polymerization. Science 312, 714–719. doi:10.1126/science.1125268
Auriemma, F., De Rosa, C., Scoti, M., Di Girolamo, R., Malafronte, A., Talarico, G., et al. (2018a). Unveiling the molecular structure of ethylene/1-octene multi-block copolymers from chain shuttling technology. Polymer 154, 298–304. doi:10.1016/j.polymer.2018.09.011
Auriemma, F., De Rosa, C., Scoti, M., Di Girolamo, R., Malafronte, A., and Galotto, N. G. (2018b). Structural investigation at nanometric length scale of ethylene/1-octene multiblock copolymers from chain-shuttling technology. Macromolecules 51, 9613–9625. doi:10.1021/acs.macromol.8b01947
Auriemma, F., De Rosa, C., Scoti, M., Girolamo, R. di, Malafronte, A., D’Alterio, M. C., et al. (2019). Structure and mechanical properties of ethylene/1-octene multiblock copolymers from chain shuttling technology. Macromolecules 52, 2669–2680. doi:10.1021/acs.macromol.8b02470
Auriemma, F., Di Girolamo, R., Urciuoli, G., Caputo, M. R., De Rosa, C., Scoti, M., et al. (2020). Transmission electron microscopy analysis of multiblock ethylene/1-octene copolymers. Polymer 193, 122347. doi:10.1016/j.polymer.2020.122347
Castillo, R. V., and Müller, A. J. (2009). Crystallization and morphology of biodegradable or biostable single and double crystalline block copolymers. Prog. Polym. Sci. 34, 516–560. doi:10.1016/j.progpolymsci.2009.03.002
Chum, P. S., and Swogger, K. W. (2008). Olefin polymer technologies—history and recent progress at the Dow chemical company. Prog. Polym. Sci. 33, 797–819. doi:10.1016/j.progpolymsci.2008.05.003
Crist, B. (2007). Yet another visit to the melting of polyethylene crystals. J. Polym. Sci. B. Polym. Phys. 45, 3231–3236. doi:10.1002/polb.21326
Ergoz, E., Fatou, J. G., and Mandelkern, L. (1972). Molecular weight dependence of the crystallization kinetics of linear polyethylene. I. Experimental results. Macromolecules 5, 147–157. doi:10.1021/ma60026a011
Fatou, J. G., Marco, C., and Mandelkern, L. (1977). The influence of molecular weight on the regime crystallization of linear polyethylene. Polymer 31, 1685–1693. doi:10.1016/0032-3861(90)90186-3
He, P., Shen, W., Yu, W., and Zhou, C. (2014). Mesophase separation and rheology of olefin multiblock copolymers. Macromolecules 47 (2), 807–820. doi:10.1021/ma402330a
He, W.-N., and Xu, J.-T. (2012). Crystallization assisted self-assembly of semicrystalline block copolymers. Prog. Polym. Sci. 37, 1350–1400. doi:10.1016/j.progpolymsci.2012.05.002
Heck, B., HugelIijimaSadiku, T. M. E., and Strobl, G. (1999). Steps in the transition of an entangled polymer melt to the partially crystalline state. New J. Phys. 1, 17. doi:10.1088/1367-2630/1/1/317
Hoffman, J. D., and Miller, R. L. (1997). Kinetic of crystallization from the melt and chain folding in polyethylene fractions revisited: Theory and experiment. Polymer 38, 3151–3212. doi:10.1016/S0032-3861(97)00071-2
Hustad, P. D., Marchand, G. R., Garcia-Meitin, E. I., Roberts, P. L., and Weinhold, J. D. (2009). Photonic polyethylene from self-assembled mesophases of polydisperse olefin block copolymers. Macromolecules 42, 3788–3794. doi:10.1021/ma9002819
Jin, J., Du, J. A., Xia, Q. H., Liang, Y. R., and Han, C. C. (2010). Effect of mesophase separation on the crystallization behavior of olefin block copolymers. Macromolecules 43, 10554–10559. doi:10.1021/ma102075c
Khariwala, D. U., Taha, A., Chum, S. P., Hiltner, A., and Baer, E. (2008). Crystallization kinetics of some new olefinic block copolymers. Polymer 49, 1365–1375. doi:10.1016/j.polymer.2007.12.046
Lambert, W. S., and Phillips, P. J. (1994). Crystallization kinetics of low molecular weight fractions of branched polyethylenes. Macromolecules 27, 3537–3542. doi:10.1021/ma00091a014
Li, S., and Register, R. A. (2013). “Crystallization in copolymers,” in Handbook of polymer crystallization (New Jersey, United States: Wiley), 327–346.
Li, S., Register, R. A., Landes, B. G., Hustad, P. D., and Weinhold, J. D. (2010). Crystallization in ordered polydisperse polyolefin diblock copolymers. Macromolecules 43, 4761–4770. doi:10.1021/ma100609k
Li, S., Register, R. A., Weinhold, J. D., and Landes, B. G. (2012). Melt and solid-state structures of polydisperse polyolefin multiblock copolymers. Macromolecules 45, 5773–5781. doi:10.1021/ma300910m
Liu, G. M., Guan, Y., Wen, T., Wang, X. W., Zhang, X. Q., Wang, D. J., et al. (2011). Effect of mesophase separation and crystallization on the elastomeric behavior of olefin multi-block copolymers. Polymer 52, 5221–5230. doi:10.1016/j.polymer.2011.09.009
Loo, Y. L., and Register, R. A. (2004). “Crystallization within block copolymer mesophases,” in Development in block copolymer science and technology. Editor I. W. Hamley (Chichester: John Wiley & Sons). Chapter 6.
Loo, Y. L., Register, R. A., and Ryan, A. J. (2002). Modes of crystallization in block copolymer microdomains: Breakout, templated, and confined. Macromolecules 35, 2365–2374. doi:10.1021/ma011824j
Lorenzo, A. T., Arnal, M. L., Müller, A. J., Boschetti de Fierro, A., and Abetz, V. (2007). Nucleation and isothermal crystallization of the polyethylene block within diblock copolymers containing polystyrene and poly(ethylene-alt-propylene). Macromolecules 40, 5023–5037. doi:10.1021/ma070252l
Lorenzo, A. T., and Müller, A. J. (2008). Estimation of the nucleation and crystal growth contributions to the overall crystallization energy barrier. J. Polym. Sci. B. Polym. Phys. 46, 1478–1487. doi:10.1002/polb.21483
Lynd, N. A., Meuler, A. J., and Hillmyer, M. A. (2008). Polydispersity and block copolymer self-assembly. Prog. Polym. Sci. 33, 875–893. doi:10.1016/j.progpolymsci.2008.07.003
Maclaine, J. Q. G., and Booth, C. (1975). Effect of molecular weight on spherulite growth rates of high molecular weight poly(ethylene oxide) fractions. Polymer 16, 191–195. doi:10.1016/0032-3861(75)90052-X
Matsen, M. W. (2007). Polydispersity-induced macrophase separation in diblock copolymer melts. Phys. Rev. Lett. 99, 148304. doi:10.1103/PhysRevLett.99.148304
Müller, A. J., Albuerne, J., Marquez, L., Raquez, J.-M., Degée, P., Dubois, P., et al. (2005b). Self-nucleation and crystallization kinetics of double crystalline poly(p-dioxanone)-b-poly(ε-caprolactone) diblock copolymers. Faraday Discuss. 128, 231–252. doi:10.1039/B403085K
Müller, A. J., Balsamo, V., and Arnal, M. L. (2005a). Nucleation and crystallization in diblock and triblock copolymers. Adv. Polym. Sci. 190, 1–63. doi:10.1007/12_001
Nandan, B., Hsu, J. Y., and Chen, H. L. (2006). Crystallization behavior of crystalline-amorphous diblock copolymers consisting of a rubbery amorphous block. J. Macromol. Sci. Part C Polym. Rev. 46, 143–172. doi:10.1080/15321790600646802
Okui, N., Umemoto, S., Kawano, R., and Mamun, A. (2007). “Temperature and molecular weight dependencies of polymer crystallization,” in Progress in understanding of polymer crystallization. Editors G. Reiter, and G. R. Strobl (Berlin, Heidelberg: Springer), 714, 391–425. Lecture Notes in Physics. doi:10.1007/3-540-47307-6_19
Park, H. E., Dealy, J. M., Marchand, G. R., Wang, J. A., Li, S., and Register, R. A. (2010). Rheology and structure of molten, olefin multiblock copolymers. Macromolecules 43, 6789–6799. doi:10.1021/ma1012122
Rabiej, S., Goderis, B., Janicki, J., Mathot, V. B. F., Koch, M. H. J., GroeninckxReynaers, G. H., et al. (2004). Characterization of the dual crystal population in an isothermally crystallized homogeneous ethylene-1-octene copolymer. Polymer 45, 8761–8778. doi:10.1016/j.polymer.2004.10.045
Strobl, G. (2007). “A multiphase model describing polymer crystallization and melting,” in Progress in understanding of polymer crystallization. Lect. Notes phys. 714. Editors G. Reiter, and G. R. Strobl (Berlin, Heidelberg: Springer), 481–502. doi:10.1007/3-540-47307-6_23
Tong, Z. Z., Huang, J., Zhou, B., Xu, J. T., and Fan, Z. Q. (2013a). Chain microstructure, crystallization, and morphology of olefinic blocky copolymers. Macromol. Chem. Phys. 214, 605–616. doi:10.1002/macp.201200615
Tong, Z. Z., Xu, J. T., Xia, S. J., and Fan, Z. Q. (2013b). Comparison of chain structure and morphology of an olefinic blocky copolymer and a Ziegler–Natta-based ethylene random copolymer. Polym. Int. 62, 228–237. doi:10.1002/pi.4288
Tong, Z. Z., Zhou, B., Huang, J., Xu, J. T., and Fan, Z. Q. (2014). Regulation of crystallization kinetics, morphology, and mechanical properties of olefinic blocky copolymers. Macromolecules 47, 333–346. doi:10.1021/ma4023263
Umemoto, S., and Okui, N. (2005). Power law and scaling for molecular weight dependence of crystal growth rate in polymeric materials. Polymer 46, 8790–8795. doi:10.1016/j.polymer.2005.05.132
Urciuoli, G., Ruiz de Ballesteros, O., Cipullo, R., Trifuoggi, M., Giarra, A., and Auriemma, F. (2022). Thermal fractionation of ethylene/1-octene multiblock copolymers from chain shuttling polymerization. Macromolecules 55, 5656–5668. doi:10.1021/acs.macromol.2c00773
Urciuoli, G., Vittoria, A., Talarico, G., Luise, D., De Rosa, C., Busico, V., et al. (2021). In-depth analysis of the nonuniform chain microstructure of multiblock copolymers from chain-shuttling polymerization. Macromolecules 54, 10891–10902. doi:10.1021/acs.macromol.1c01824
Van Horn, R. M., Steffen, M. R., and O'Connor, D. (2018). Recent progress in block copolymer crystallization. Polym. Cryst. 1, e10039. doi:10.1002/pcr2.10039
Vittoria, A., Urciuoli, G., Costanzo, S., Tammaro, D., Cannavacciuolo, F. D., Pasquino, R., et al. (2022). Extending the high-throughput experimentation (HTE) approach to catalytic olefin polymerizations: From catalysts to materials. Macromolecules 55, 5017–5026. doi:10.1021/acs.macromol.2c00813
Wang, H. P., Chum, S. P., Hiltner, A., and Baer, E. (2009a). Deformation of elastomeric polyolefin spherulites. J. Polym. Sci. B. Polym. Phys. 47, 1313–1330. doi:10.1002/polb.21735
Wang, H. P., Chum, S. P., Hiltner, A., and Baer, E. (2009b). Comparing elastomeric behavior of block and random ethylene–octene copolymers. J. Appl. Polym. Sci. 113, 3236–3244. doi:10.1002/app.30070
Wang, H. P., Khariwala, D. U., Cheung, W., Chum, S. P., Hiltner, A., and Baer, E. (2007). Characterization of some new olefinic block copolymers. Macromolecules 40, 2852–2862. doi:10.1021/ma061680e
Wen, T., Liu, G. M., Zhou, Y., Zhang, X. Q., Wang, F. S., Chen, H. Y., et al. (2012a). Epitaxy-induced crystallization of olefin block copolymers. Macromolecules 45, 5979–5985. doi:10.1021/ma300619f
Wen, T., Zhou, Y., Liu, G. M., Wang, F. S., Zhang, X. G., Wang, D. J., et al. (2012b). Epitaxial crystallization of olefin block copolymers (OBCs) on uniaxially oriented isotactic polypropylene and high-density polyethylene films. Polymer 53, 529–535. doi:10.1016/j.polymer.2011.11.062
Zhang, M., Karjala, T. W., Jain, P., and Villa, C. (2013). Theoretical modeling of average block structure in chain-shuttling α–olefin copolymerization using dual catalysts. Macromolecules 46, 4847–4853. doi:10.1021/ma4004902
Zuo, F., Burger, C., Chen, X. M., Mao, Y. M., Hsiao, B. S., Chen, H. Y., et al. (2010). An in situ X-ray structural study of olefin block and random copolymers under uniaxial deformation. Macromolecules 43, 1922–1929. doi:10.1021/ma902105v
Keywords: statistical multiblock copolymers, mesophase separation, crystallization kinetics, mixing state of the melt, chain microstructure
Citation: Urciuoli G, Ruiz de Ballesteros O, Femina G and Auriemma F (2022) Isothermal crystallization kinetics in bulk of olefin-based multiblock copolymers. Front. Soft. Matter 2:1021006. doi: 10.3389/frsfm.2022.1021006
Received: 16 August 2022; Accepted: 28 September 2022;
Published: 25 October 2022.
Edited by:
Wensheng Xu, Changchun Institute of Applied Chemistry (CAS), ChinaCopyright © 2022 Urciuoli, Ruiz de Ballesteros, Femina and Auriemma. This is an open-access article distributed under the terms of the Creative Commons Attribution License (CC BY). The use, distribution or reproduction in other forums is permitted, provided the original author(s) and the copyright owner(s) are credited and that the original publication in this journal is cited, in accordance with accepted academic practice. No use, distribution or reproduction is permitted which does not comply with these terms.
*Correspondence: Gaia Urciuoli, Z2FpYS51cmNpdW9saUB1bmluYS5pdA==; Finizia Auriemma, ZmluaXppYS5hdXJpZW1tYUB1bmluYS5pdA==
Disclaimer: All claims expressed in this article are solely those of the authors and do not necessarily represent those of their affiliated organizations, or those of the publisher, the editors and the reviewers. Any product that may be evaluated in this article or claim that may be made by its manufacturer is not guaranteed or endorsed by the publisher.
Research integrity at Frontiers
Learn more about the work of our research integrity team to safeguard the quality of each article we publish.