- 1Department of Economics, Faculty of Economics, Universitas Terbuka, Tangerang Selatan, Indonesia
- 2Department of Economics, Faculty of Economics and Social Science, Universitas Sultan Fatah, Demak, Indonesia
The ASEAN Economic Community provides opportunities for foreign workers to enter Indonesia, including Central Java Province. The existence of these foreign workers tends to negatively and positively impact the regional economic growth of the country. Therefore, this study aims to analyze the effects of foreign workers’ human capital spillover inflow on the economic growth of Central Java. The Euclidean distance spatial weight matrix was used to calculate the spatial autoregressive model from 2015 to 2020. These results indicate that the presence of skilled foreign workers positively impacts increasing economic growth in Central Java Province. The influx of foreign workers, along with the influx of investment, encourages local workers to follow the performance of foreign workers. This study suggests a policy to encourage technology transfer from foreign workers to local workers. The government is also expected to strengthen local workers’ productivity to compete with foreign workers.
Introduction
The AEC implementation provides opportunities for highly educated foreign workers with special skills to migrate to Indonesia (Chia, 2014; Adhariani, 2020; Elms, 2020; Ho, 2019), including Central Java Province. This led to a 7% increase in the economic growth of this region, thereby making it an attractive place for foreigners to work (BPS Central Java, 2021). Furthermore, Central Java Province is one of the favorite provinces for investment due to accessible licensing services (Windhyastiti et al., 2020).
The free trade implementation in ASEAN regions has positive and negative impacts on labor (Chirathivat, 2002; Chin and Stubbs, 2011). One of the advantages is that many foreign capitals are invested in Indonesia, thereby creating job opportunities. Furthermore, the domestic regulation of goods and services tends to spin quickly, while export activities are efficiently executed. The negative impact is when goods and services are easily imported into the country, thereby threatening the domestic economy. This also led to the ease of labor both internally and externally. Therefore, the government needs to analyze the Indonesian human resources in the face of free trade.
Some studies on human capital spillover and externalities related to economic growth were carried out by Lucas (1988) and Romer (1990). These were reviewed in the form of physical capital and uneducated labor in endogenous growth models. Benhabib and Spiegel used a traditional accounting approach to evaluate the contribution of human capital to aggregate growth (Benhabib & Spiegel, 1994). This was demonstrated using total factor productivity, which led to the existence of world leaders in technology or the catch-up effect that eventually resulted in endogenous growth impacts. The studies carried out by Romer (1990), Benhabib & Spiegel (1994), and Brunow & Hirte (2009) used spatial error models (SEM) to determine workers’ age patterns with respect to the regional average productivity.
Caroline et al. (2019) used the Euclidean distance spatial weight matrix to calculate SAR. Fixed-effects SAR showed significant capital and spatial lag variables, implying a 0.6% growth spillover in ASEAN countries. However, ASEAN member countries grow by relatively 1%, and their economy increases by 0.6%, with a capital coefficient of 3.67e-12 at a significant rate of α = 1%. This is influenced by the value of capital, UWS, labor, and spatial residuals of the other 10 member countries (Indonesia, Malaysia, Brunei, Cambodia, Thailand, Singapore, the Philippines, Laos, Myanmar, and Vietnam) with similar characteristics. Another study carried out by Caroline et al. (2020) stated that the spillover of local labor in Central Java Province was realized through many foreign investment (PMA) projects established in districts and cities.
The studies carried out by Caroline et al. (2020) and Ho et al. (2013) adopted the Solow growth model developed by Mankiw based on the role of education in improving economic growth. Education tends to boost economic growth through labor productivity. Therefore, foreign workers who migrate to Central Java Province are expected to be highly disciplined and exhibit good work ethics, which leads to competitive labor with the locals. Furthermore, this study analyzes the impact of the inflow of foreign workers to the Central Java Province using the Euclidean distance spatial weight matrix.
Literature Review
Human Capital Spillover and Economic Growth
Spillover is described as the externality of economic activity that affects the parties involved. According to Fleisher et al. (2008), it is the interaction between human capital and the gap or distance per capita income of a region compared to an advanced place. The model designed by Fleisher et al. (2008) is in accordance with the research carried out by Nelson and Phelps (1966) on technological diffusion. They introduced the first model, which was related to the importance of technological advances. It was proposed based on the assumption that technological advances were inherent in labor augmenting, otherwise known as “Harrod-neutral.”
where
or equivalent to
Eqs. 2, 3 indicate the level of technological gap depending on the human capital, through the function
Furthermore, Benhabib and Spiegel (1994) developed a growth model similar to Nelson and Phelps, (1966) by including domestic innovation. They assumed that every period reports the existence of several countries as world leaders in technology. Nelson and Phelps’s growth model, modified by Benhabib and Spiegel (1994), is written as follows:
where
Fleisher et al. (2008) modified both models designed by Benhabib and Spiegel (1994) and Nelson and Phelps (1966) by ensuring that the per capita and distance income represent the technological gap. This led to the modification of the technological progress growth as stated in Equation 5
where
Determinant of Labor Migration
Factors affecting labor migration include age, family factors, education, distance, unemployment rate, and government policies. According to Sjaastad (1962), one of the factors of labor migration to other regions is when the worker is older than 18 years and is searching for a job that meets the criteria and demands of the workforce after graduation. However, some decide to continue schooling.
In terms of family factors, a study carried out by Mincer (1978) reported that unmarried workers in terms of marital status tend to migrate to other regions in search of a decent job, while the reverse is the case for couples. In terms of education, Juhn et al. (1993) reported that highly educated workers are bound to migrate to other regions; besides, their experiences have a positive impact on the demand for labor. Davies et al. (2001) reported that distance is a labor consideration for migration. In addition, the workforce has potential to obtain information related to employment opportunities, and the further the distance, the higher the transportation cost. Meanwhile, when viewed from the policy aspect, Green and Hendershott (2001) and Borjas (2006) reported that the high level of international immigration into an area reduces and simultaneously increases incoming and outbound migration, respectively.
Research Methods
An explanatory spatial data analysis (ESDA) approach and Euclidean distance spatial weight matrix were used to calculate the spatial autoregressive model. This research analyzed data acquired in 29 regencies and six cities in Central Java from 2015 to 2020. The variable descriptions used in this study are shown in Table 1.
The global Moran’s index was adopted to analyze the presence or absence of spatial autocorrelation in the data. It is also used to identify spatial interactions for the entirety of observation with its range of values in accordance with a standardized spatial weight matrix of −1
Spatial autocorrelation formed using the global Moran’s I method only reads either positive or negative coefficient value marks. The positive mark implies the spatial clustering of similar values, while that of the negative identifies the existence of checkerboard patterns. Global Moran’s I value is assumed to be significant depending on the distribution of its statistical tests. This is based on two methods, namely, the random permutation test and the distribution approach. Global Moran’s I coefficient values that are greater and less than the expectations of −1/(n-1) are indicative of positive and negative spatial autocorrelation, respectively (Fischer and Wang, 2011).
ESDA is a Euclidean distance spatial weight matrix used to explore data and calculate the SAR model. The first step in ESDA is to calculate the Euclidean distance spatial weight matrix using GeoDa version 1.18 application to determine the coordinates x and y of an entity. The second step is to obtain the spatial autoregressive (SAR) model using SPSS 15. This is carried out by calculating the ordinary least square (OLS) to determine the parameter that affects the economic growth of Central Java, after which the likelihood ratio (LR) test and Hausman Test are used to ascertain whether to use the fixed or random effect. The results are known to use a spatial autoregressive model (SAR) with a fixed effect as follows:
where
j = other districts/cities,
W = matrix of spatial weights with Euclidean distance approach,
CAP = capital,
AS = the average duration of a school,
LW = local worker,
FW = foreign worker, and
Results and Discussion
Euclidean Distance Spatial Weight Matrix
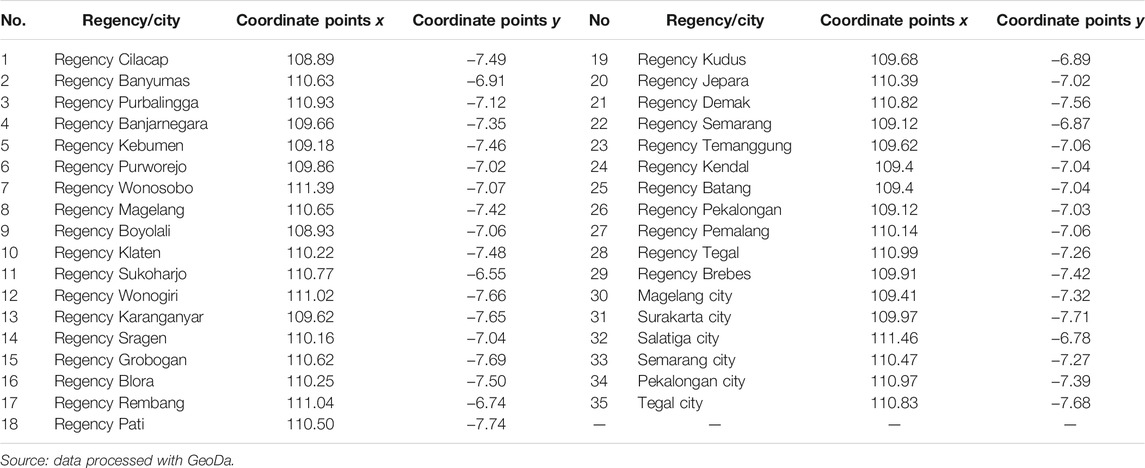
This study applied the Euclidean distance weight matrix to ensure that the calculated results correlate with the geographical distances. The value obtained from the Central Java shp Map was processed with GeoDa software to obtain the x and y coordinates, whereby 1 Euclidean distance is equivalent to 15.91 km.
Table 3 shows the spatial weight matrix with Euclidean distance realized using x and y coordinates from 29 districts and six cities in Central Java Province. This helps solve proximity and time issues, including labor and information mobility. According to Table 3, the Semarang regency is at x 109.12 and y −6.87 coordinates. Meanwhile, Semarang city and Demak regency are located at x 110.47 and y −7.27 and x 110.82 and y −7.56 coordinates, respectively.
Global Moran’s I Calculation Results
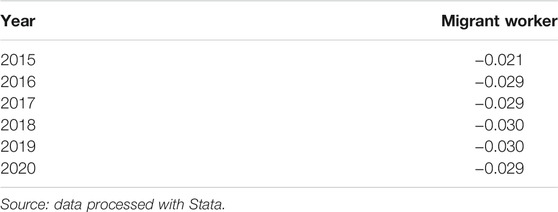
The following Table 4 shows that global Moran’s I coefficient values are negative and insignificant, meaning that the workforce migrating into Central Java Province spreads across several districts and cities.
a) This study used confidence and significance levels of α = 5%.
b) Moran’s global index was significantly used to identify both similar and dissimilar spatial interaction patterns within groups.
c) Positive and negative patterns indicate the presence of convergent or clusters and a spread or divergence, respectively.
d) Moran’s global index values were not significantly used to identify the absence of similar and dissimilar spatial interaction patterns within groups.
(b), (c), and (d) were adopted from the research carried out by Anselin (1995).
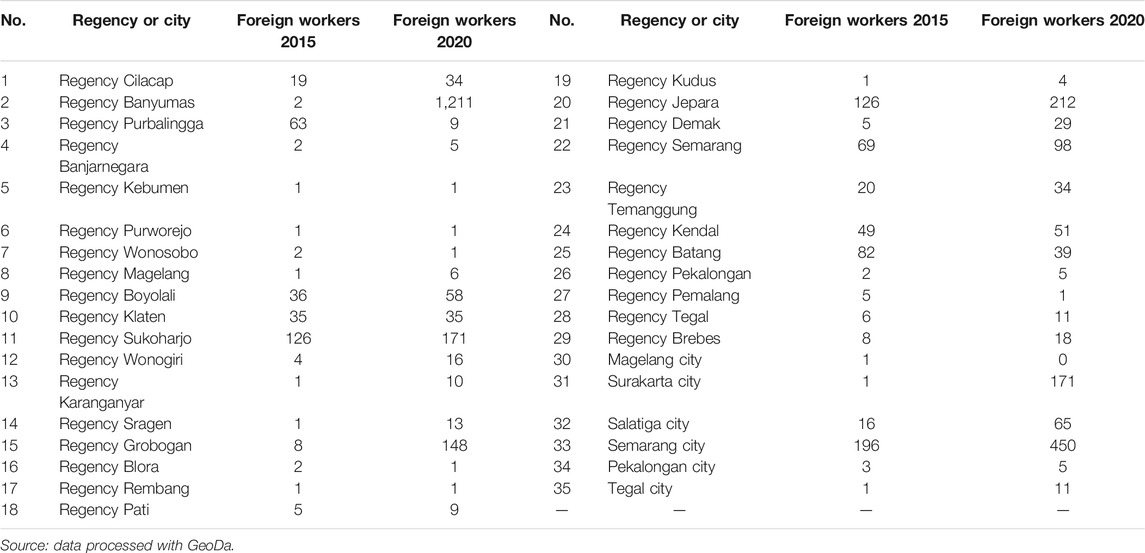
Table 5 shows that in 2015, 901 foreign workers migrated to Central Java Province, whereas in 2020, the number increased to 2,905, with 1,211, 450, and 212 recorded in Banyumas regency, Semarang city, and Jepara, respectively.
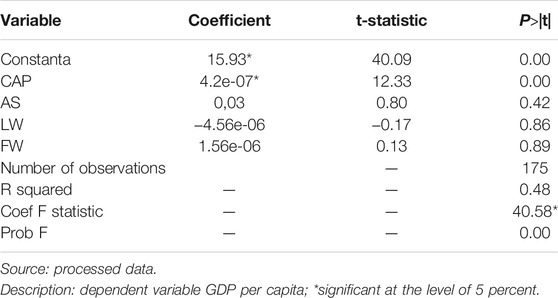
Before verifying the spatial regression model of the panel data, a classic test known as the goodness of fit was performed. The next step is to test the fixed or error effect using the LR test. Table 6 shows the results of the classic pooled OLS regression calculation. Variables with a positive and significant influence on GDP per capita are referred to as capital.
The OLS pooled method is used to validate the equation or economic growth model. A significant value indicates that α = 5% with a coefficient of 40.58. Free variables that affect economic growth are Constanta and capital with a significant rate of α = 5%. Based on the OLS pooled testing, only capital variables have positive and significant results on economic growth. Meanwhile, the reverse is the case for the number of educated local workers (Table 7).
Furthermore, an LR test was carried out to determine whether or not the model used fixed or random effects. Table 8 shows that the spatial autoregressive model was realized with a fixed effect obtained using the LR test at a significant level of α = 5%.
The results of the SAR state that the presence of foreign workers has a positive impact on economic growth. The number of foreign workers who enter along with the entry of investment provides a spur for local workers to follow the performance of foreign workers. Foreign workers brought to Central Java Province are educated, skilled workers. This is expected to provide technology transfer to local workers (Erliz Nindi Pratiwi, 2013; Pratiwi and Mahmudah, 2013). The results of the SAR show that the presence of foreign workers can encourage the economy through the given performance. Many foreign workers brought along with the investment can drive the local workforce to improve their performance.
Meanwhile, the analysis results for local workers show that the presence of local workers has not had an encouraging impact on economic growth. This is due to the large number of local workers who work in sectors that do not have high skills. Most investors who invest in Central Java Province already include skilled labor, so they involve only a small local workforce.
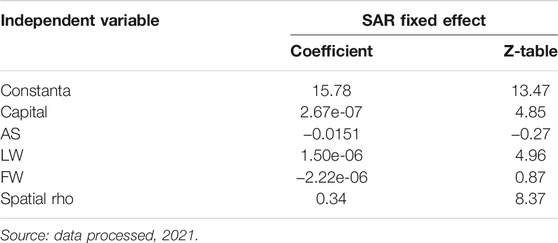
Fixed-effects SAR results indicate that the capital and spatial lag variable are significant. This implies a growth spillover of 0.34%. However, assuming the average regency or neighboring city in Central Java develops by relatively 1%, its growth is boosted by 0.34%, with a capital coefficient and significant rate of 2.67e-07 and 5%, respectively. The spatial interaction and effects were obtained from each region in Central Java Province.
The spatial coefficient lag (δ) or rho 0.99283791 indicates the magnitude of the interaction between the regency or city’s GDP per capita value and neighboring regions. Meanwhile, the coefficient of 2.67e-07 indicates a 1% increase in capital and GDP per capita. Spatial rho 6 percent means that assuming Central Java Province grows by 3 percent. It is bound to affect the 29 regencies and six cities, with a productivity correlation of 1.5 percent. Therefore, the average number of foreign workers contributes to Central Java’s economic growth. Economic growth increases the value of goods and services and capital formation, which supports production (Kanu & Ozurumba, 2014). Therefore, an increase triggers the potential for a rise in production activities. Capital formation is one of the essential determinants for improving economic growth (Amri & Aimon., 2017; Kanu & Ozurumba, 2014).
The increase in capital stocks is due to the relationship between capital formation and economic growth, which supports production activities, as illustrated in the Solow growth theory (Ho et al., 2013; Solow, 1994). Its existence drives economic growth in Central Java.
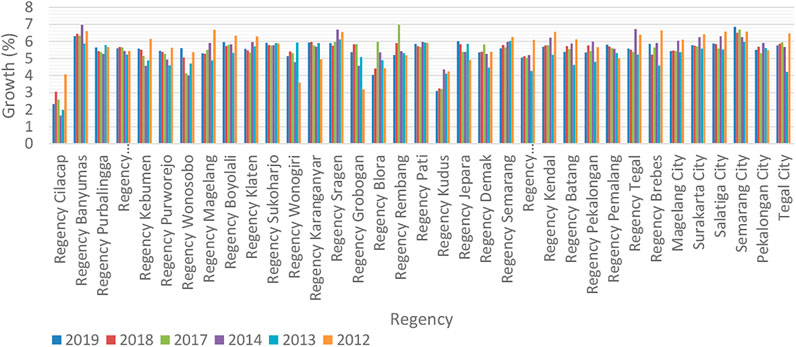
Figure 1 describes the economic growth of various cities in Central Java Province before and after the AEC implementation, presumed to be triggered by capital. The study carried out by Intisar et al. (2020) also stated that human capital and economic growth have unidirectional relationships. It was further discovered that human capital and foreign direct investment accelerated trade openness.
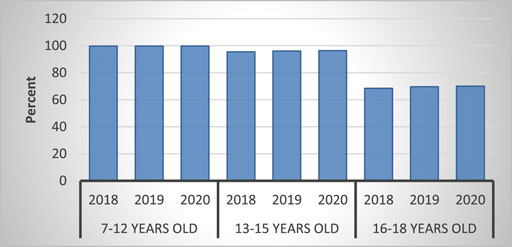
Meanwhile, the average number of educated foreign workers has a positive and insignificant influence. These findings show that an excellent educational level aids in securing employment opportunities, both in the formal and informal sectors with a limited population of well-educated workers. The data show that the level of education attained by the average working age is between 60 and 70 % (BPS Central Java, 2021). This means that many of the workers lack appropriate education, as shown in Figure 2.
The impact of human capital spillover on the economic growth of Central Java Province has been influenced by the inflow of foreign workers since the implementation of the ASEAN Economic Community in 2015. Table 9 shows the inflow of foreign workers in Central Java Province as of December 31, 2020. A total of 12,311 were recorded, with 10,487 working in cross-province, while 1,640 and 184 working in Central Java and cross-regency, respectively.
Figure 3 shows the inflow of foreign workers in Central Java Province. The foreign workers are mainly from the PRC, followed by Japan, South Korea, and India. China’s increased workforce is due to increased investment from the country. Thus, more and more experts accompany the investment. The local government hopes that there will be a transfer of technology from foreign labor to local labor. According to the rules, every foreign worker must be accompanied by local workers. So in the future, there will be many local workers who master the skill.
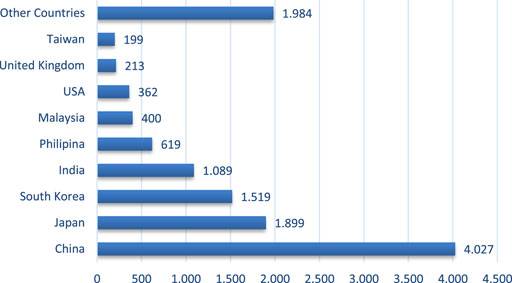
FIGURE 3. Inflow of foreign workers in Central Java Province, 2020. Source: Disnakertrans Central Java Province, 2021.
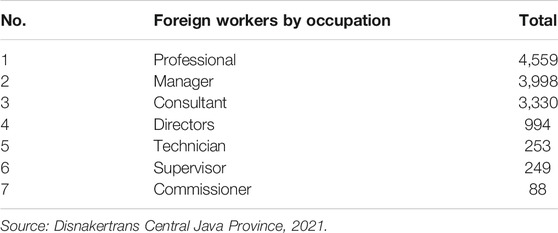
The impact of human capital spillover on the economic growth of Central Java Province is influenced by a large number of foreign workers in various fields. According to Table 10, 4,559 foreign workers have professional jobs, followed by managers, consultants, directors, and commissioners, respectively. One of the causes of the number of skilled foreign workers entering Central Java is because investors usually bring technology and workers into Indonesia. The local government states that the labor allowed to enter is specific skilled labor.
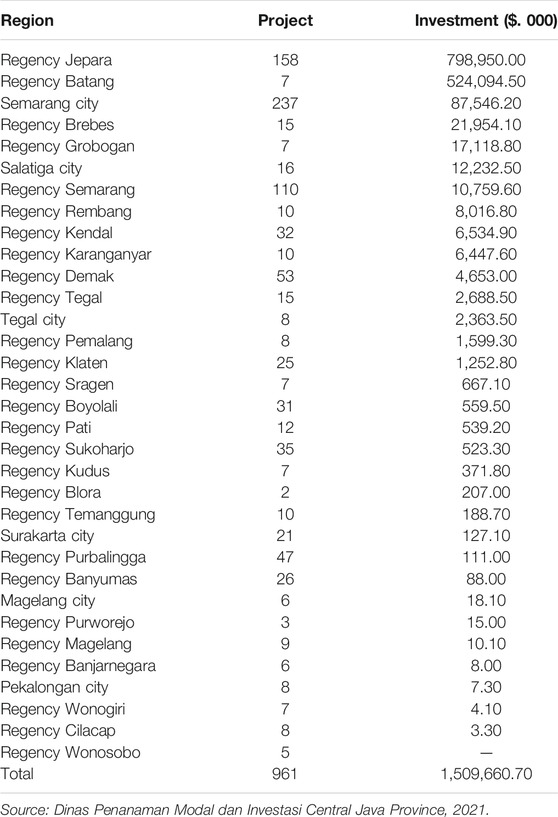
Influxes of foreign workers in this province are experts in various fields, and this serves as a chain of investment packages. Table 11 shows a total of 961 projects that were realized in 2019 with an investment value of 1,509,660.70 thousand $. The influx of investment mainly originates from transportation, warehouse, telecommunications, electricity, gas, and water sectors located in Tegal, Semarang, Cilacap, Grobogan, and Kudus. Simultaneously, these projects are found in Batang, Jepara, Semarang, Brebes, and Kendal. The presence of foreign workers encourages the transfer of knowledge to the local ones, thereby aiding them to work more effectively and efficiently.
The number of sectors in the free trade era forced local governments to train their human resources, which was realized by adopting certain strategies such as improving the quality of education and honing the community’s soft and hard skills (Erliz Nindi Pratiwi, 2013; Pratiwi and Mahmudah, 2013). This is extremely important in the free market, where there are many foreign and domestic workers. However, it is feared that the influx of foreign workers will adversely affect domestic labor because they are relatively skilled compared to the local workforce.
AEC also requires Indonesian workers to have more than average skills to compete with foreign workers from neighboring countries. Therefore, there needs to be an improvement in the quality of the Indonesian workforce. The existence of AEC that triggers the mobility of goods and services indefinitely impacts the workers. This provides a large number of opportunities for the workers both at home and abroad. Therefore, the Indonesian workforce also needs to be trained to compete with other domestic and foreign workers.
Conclusion
The opening of the free trade market led to the influx of foreign labor into Central Java Province. The existence of foreign workers has a negative or positive impact on regional economic growth. We used the Euclidean distance spatial weight matrix to calculate the spatial autoregressive model from 2015 to 2020. SAR results state that the presence of foreign labor has a positive impact on economic growth. The number of foreign workers who enter, along with the influx of investment, provides a boost for local workers to follow the performance of foreign workers.
The majority of foreign workers sent to Central Java Province are educated and skilled. The performance and work ethics of these foreign workers encourage local workers to increase their productivity. The local workforce must improve itself following the development of labor demand. Studies for local labor show that local workers have not had an encouraging impact on economic growth; this is due to the large number of local workers working in sectors that do not require high skills. Most investors who invest in Central Java Province already bring in a skilled workforce, involving only a small number of local workers. The research suggests strengthening the government’s role in increasing local labor productivity to replace skilled foreign labor. Many highlights from the industrial sector are among the limitations of the research. Other industries, such as agriculture, mining, and others, will benefit from further research.
Data Availability Statement
The original contributions presented in the study are included in the article/Supplementary Material; further inquiries can be directed to the corresponding author.
Author Contributions
EL contributed to conceptualization, conceived and designed the experiments, performed the experiments, analyzed and interpreted the data, and wrote the manuscript. CC conceived and designed the experiments, interpreted the data, contributed reagents, materials, analysis tools, or data, and wrote the manuscript.
Funding
This research is supported by the Research Institutions and Community Service (LPPM) of the Universitas Terbuka, Indonesia (Project No. 21337/UN31.LPPM/PT.01.03/2021).
Conflict of Interest
The authors declare that the research was conducted in the absence of any commercial or financial relationships that could be construed as a potential conflict of interest.
Publisher’s Note
All claims expressed in this article are solely those of the authors and do not necessarily represent those of their affiliated organizations or those of the publisher, the editors, and the reviewers. Any product that may be evaluated in this article, or claim that may be made by its manufacturer, is not guaranteed or endorsed by the publisher.
Acknowledgments
The authors would like to appreciate the Research Institutions and Community Service (LPPM), Universitas Terbuka, for making this research possible.
References
Adhariani, D. (2020). The Influence of the ASEAN Economic Community on the Future of the Management Accounting Profession. Medar 28 (4), 587–611. doi:10.1108/MEDAR-04-2019-0476
Amna Intisar, R., Yaseen, M. R., Kousar, R., Usman, M., and Makhdum, M. S. A. (2020). Impact of Trade Openness and Human Capital on Economic Growth: A Comparative Investigation of Asian Countries. Sustainability 12 (7), 2930. doi:10.3390/su12072930
Amri, K. A., and Aimon, H. (2017). The Effect of Capital Formation and Exports on Indonesia's Economic Growth. Economac 1 (1), 1–16.
Anselin, L. (1995). Local Indicators of Spatial Association-LISA. Geographical Anal. 27 (2), 93–115. doi:10.1111/j.1538-4632.1995.tb00338.x
Benhabib, J., and Spiegel, M. M. (1994). The Role of Human Capital in Economic Development Evidence from Aggregate Cross-Country Data. J. Monetary Econ. 34, 143–173. doi:10.1016/0304-3932(94)90047-7
Borjas, G. J. (2006). Native Internal Migration and the Labor Market Impact of Immigration. J. Hum. Resour. XLI (2), 221–258. doi:10.3368/jhr.xli.2.221
BPS Central Java (2021). BPS Central Java. Laju Pertumbuhan PDRB Menurut Kabupaten/Kota 2011-2020. Available at: https://jateng.bps.go.id/subject/157/produk-domestik-regional-bruto--kabupaten-kota-.html#subjekViewTab3.
Brunow, S., and Hirte, G. (2009). The Age Pattern of Human Capital and Regional Productivity: A Spatial Econometric Study on German Regions. Pap. Reg. Sci. 88 (4), 799–823. doi:10.1111/j.1435-5957.2009.00228.x
Caroline, C., Syakir, K. A., Puji, L. E., and Ceacilia, S. M. (2019). The Impact of Spillover Labor on the Economic Growth of Central Java Province with Spatial Econometrics Model Approach. Ijciet 10 (09), 16–26.
Caroline, C., Lestari, E. P., Srimindarti, C., Kusumawati, D., and Safriandono, A. N. (2020). Spatial Interaction Pattern of Local Workers in central Java Province by Using the Euclidean Distance Approach. Int. J. Business Management Sci. 10 (2), 169–186.
Chia, S. Y. (2014). “The ASEAN Economic Community: Progress, Challenges, and Prospects,” in A World Trade Organization for the 21st Century: The Asian Perspective, 269–315. doi:10.4337/9781783479283.00017
Chin, G., and Stubbs, R. (2011). China, Regional Institution-Building and the China-ASEAN Free Trade Area. Rev. Int. Polit. Economy 18 (3), 277–298. doi:10.1080/09692291003762548
Chirathivat, S. (2002). ASEAN-China Free Trade Area: Background, Implications and Future Development. J. Asian Econ. 13 (5), 671–686. doi:10.1016/S1049-0078(02)00177-X
Davies, P. S., Greenwood, M. J., and Li, H. (2001). A Conditional Logit Approach to U.S. State‐to‐State Migration. J. Reg. Sci. 41 (2), 337–360. doi:10.1111/0022-4146.00220
Elms, D. (2020). Impact of the ASEAN Economic Community and Implications for Latin America. (No. 148). Available at: https://repositorio.cepal.org/bitstream/handle/11362/46513/1/S2000776_en.pdf.
Erliz Nindi Pratiwi, R. A. M. (2013). Economics Development Analysis Journal. Econ. Development Anal. J. 2 (4), 446–455.
Fischer, M. M., and Wang, J. (2011). Spatial Data Analysis: Models, Methods and Techniques. Springer Science & Business Media.
Fleisher, B., Li, H., and Zhao, M. Q. (2008). Human Capital, Economic Growth, and Regional Inequality in China.
Green, R. K., and Hendershott, P. H. (2001). Home-Ownership and Unemployment in the US. Urban Stud. 38 (9), 1509–1520. doi:10.1080/00420980126669
Ho, C.-Y., Wang, W., and Yu, J. (2013). Growth Spillover through Trade: A Spatial Dynamic Panel Data Approach. Econ. Lett. 120 (3), 450–453. doi:10.1016/j.econlet.2013.05.027
Ho, S. W. H. (2019). Preparedness for ASEAN Economic Community (AEC): a Case Study of Malaysian SME Manufacturing Sector. Jabs 13 (3), 384–411. doi:10.1108/JABS-01-2017-0018
Juhn, C., Murphy, K. M., and Pierce, B. (1993). Wage Inequality and the Rise in Returns to Skill. J. Polit. Economy. 101 (3), 410–442. doi:10.1086/261881
Kanu, S., and Ozurumba, A. (2014). Capital Formation and Economic Growth in Nigeria. Glob. J. Hum. Soc. Sci. 14 (4).
Lucas, R. E. (1988). On the Mechanics of Economic Development. J. Monetary Econ. 22 (1), 3–42. doi:10.1016/0304-3932(88)90168-7
Mincer, J. (1978). Family Migration Decisions. J. Polit. Economy. 86 (5), 749–773. doi:10.1086/260710
Nelson, R. R., and Phelps, E. S. (1966). Investment in Humans, Technological Diffusion, and Economic Growth. Am. Econ. Rev. 56 (2), 133–139. doi:10.1016/b978-0-12-554002-5.50015-7
Pratiwi, E. N., and Mahmudah, R. (2013). Peningkatan Daya Saing Tenaga Kerja Indonesia Melalui Korelasi Input Penunjang Tenaga Kerja dalam Menghadapi MEA 2015. Econ. Development Anal. J. 2 (4), 446–455.
Romer, P. (1990). Endogenous Technological Change. J. Polit. Economy. 98 (5), S71–S102. doi:10.3386/w3210
Sjaastad, L. A. (1962). The Costs and Returns of Human Migration. J. Polit. Economy. 70 (5, Part 2), 80–93. doi:10.1086/258726
Solow, R. M. (1994). Perspectives on Growth Theory. J. Econ. Perspect. 8 (1), 45–54. doi:10.1257/jep.8.1.45
Tiefelsdog, M. (2002). Earth Leakage Mains Supply Supply Mains GP Outlet TR 1 GPO Reference I/P Reference I/P Reference I/P Reference I/P Reference I/P Reference I/P Marshalling Marshalling Marshalling Marshalling Marshalling Marshalling Panel 4 Panel 5 Panel 6 Pane. Geographical Anal. 34 (July), 7292.
Tiefelsdolfand, M., and Boots, B. (1997). Their Impact on Global Moran ’ S I *. Geographical Anal. 29 (3).
Keywords: foreign worker, spatial autoregressive model, human capital, spillover, economic growth
Citation: Lestari EP and Caroline C (2021) How Does Human Capital Spillover Inflow of Foreign Workers Affect Economic Growth?. Front. Sociol. 6:750946. doi: 10.3389/fsoc.2021.750946
Received: 31 July 2021; Accepted: 30 September 2021;
Published: 22 December 2021.
Edited by:
Vijay Victor, Christ University, IndiaReviewed by:
Swetha Loganathan, Christ University, IndiaNamrata Singha Roy, Christ University, India
Copyright © 2021 Lestari and Caroline. This is an open-access article distributed under the terms of the Creative Commons Attribution License (CC BY). The use, distribution or reproduction in other forums is permitted, provided the original author(s) and the copyright owner(s) are credited and that the original publication in this journal is cited, in accordance with accepted academic practice. No use, distribution or reproduction is permitted which does not comply with these terms.
*Correspondence: Etty Puji Lestari, ZXR0eXBsQGVjYW1wdXMudXQuYWMuaWQ=
 Etty Puji Lestari
 Caroline Caroline

