 Fabrizio De Caro
 Giorgio Maria Giannuzzi2
 Alfredo Vaccaro
94% of researchers rate our articles as excellent or good
Learn more about the work of our research integrity team to safeguard the quality of each article we publish.
Find out more
METHODS article
Front. Smart Grids, 20 May 2024
Sec. Grid Efficiency
Volume 3 - 2024 | https://doi.org/10.3389/frsgr.2024.1385367
This article is part of the Research TopicHorizons in Smart GridsView all 6 articles
Data-driven techniques have been considered as an enabling technology for reducing the computational burden of both static and dynamic power system security analysis. Anyway, the studies reported in the literature mainly focused on inferring from historical data the mapping between the bus variables before and after a certain contingencies set, while, to the best of the Author's knowledge, limited contributions have been devoted to try and classify the power system security state by processing aggregated grid data. This is a relevant issue to address for a Transmission System Operator since it could allow a sensible decrease in the computational burden and, considering that aggregated grid data can be reliably predicted from several hours to one day ahead, it may enable the evolution of security assessment to security forecasting. In trying and filling this research gap, this paper explores the role of machine learning and feature selection algorithms. A realistic case study involving 2 years of synthetic grid data simulated on the Italian power system model against future potential operational scenarios characterized by a high share of renewables is presented and discussed to identify the most promising computing paradigms, analyzing the criticality of tuning the feature selection and classifier algorithms.
Ensuring the secure and reliable operation of power transmission systems is becoming increasingly challenging due to the rise of renewable power generators, the evolution of the electricity markets, and the increasing number of grid interconnections. These driving factors are making transmission grids more vulnerable to dynamic perturbations, threatening their secure operation, and pushing Transmission System Operators (TSOs) to radically revise the conventional methods and criteria adopted for power system security assessment.
In this context, TSOs should periodically process the market data, which are aggregated on large grid area, in the task of estimating the corresponding bus variables and analyzing the impacts of each “credible” contingency on power system operation (Kundur et al., 2004). This computing process asks for a huge number of complex static/dynamic simulations aimed at analyzing if a certain contingency could trigger severe perturbation phenomena, which include power components overloading, over/under voltages, and voltage/frequency instability (Alimi et al., 2020). The complexity of these iterative analyses could require unfeasible computational times, which violate the strict time constraints needed for identifying effective countermeasures aimed at mitigating the effects of critical grid contingencies.
This has stimulated the research for data-driven-based techniques for power system security assessment, which allow promptly classifying the system operation state following a fixed set of contingencies by using pre-trained offline models, or by performing knowledge discovery from high-frequency sampled data collected by phasor-measurement units (Alimi et al., 2020).
In this context, machine learning-based techniques are recognized as one of the most promising enabling technologies for inferring from historical observation the evolution of the grid variables following severe grid contingencies (Venzke and Chatzivasileiadis, 2021; Chatzivasileiadis et al., 2022). These works focus on methodologies for making AI models more interpretable for the users.
Particularly, the works on this topic present two fundamental features, a data processing pipeline to reduce the number of features, or projecting data on a novel space, and a machine learning model aimed at linking these input data to a system security label, for a given contingency. Features can include demand and generation profiles, network topology, and contingency identification numbers.
In particular, a methodology integrating a Gini Index-based Feature Selection and Decision Trees was proposed by Mukherjee and De (2020) in the task of detecting if each credible contingency could trigger power system transient instabilities from the current grid state, which is described by a proper set of bus variables.
To enhance the prediction accuracy of machine learning in dealing with complex and large feature space, the same authors (Mukherjee and De, 2021) proposed a methodology integrating a self-organizing map (SOM), which aims at both reducing the data cardinality and enhancing the classification accuracy. However, SOMs are unsupervised algorithms, which require the deployment of heuristic techniques for transforming the data clusters into classes.
To face this issue, supervised learning algorithms have been employed in the task of classifying the system security labels in the presence of fault transients (Wang et al., 2021). For this purpose, a deep fuzzy-rule-based model has been proposed to build a secure/insecure power system state classification model, improving the accuracy of the conventional Wang-Mendel fuzzy system.
As an innovative aspect with respect to these methods, the authors of Ren et al. (2022) introduced a combination of Principal Component Analysis (PCA) and neural networks, coupled with an adaptive synthetic sampling technique to prevent low prediction accuracy due to imbalanced data sets, where the most critical security labels represent a minority portion of the whole data set.
On the same thinking line (Guddanti et al., 2023) deals with synthetic data generation and proposes a methodology that employs PCA for data dimensionality reduction and unsupervised algorithms (e.g., based on k-means) for swift scanning.
However, despite the differences in the input data processing pipeline and system state prediction model, all the mentioned works aim at linking the system security labels to a specific contingency given a fixed pre-contingency power system state, which is described by a proper set of bus variables. Furthermore, the selection of the optimal decision threshold, which is a critical issue to address in the task of enhancing the classification accuracy and reliability, is frequently based on heuristic approaches, with limited algorithm sensitivity analyses. Hence, the challenging idea of promptly processing aggregated power system data by data-driven techniques in the task of (i) classifying the power system security state, (ii) reliably tuning the classification parameters, (iii) identifying the most promising computing paradigm, and (iv) selecting the most relevant input variables are still open problems to address in this application context. In this context, the Italian Transmission System Operator (TSO) is currently trying to infer the hidden relationships between aggregated grid data describing the electricity market clearing and the corresponding alarms generated by the Dynamic Security Assessment (DSA) tool currently installed in the Italian control center. This knowledge discovery process, which mainly requires solving a data-driven classification problem, could allow TSO to promptly identify critical operation states requiring proper corrective/mitigation actions, and, more importantly, to predict the security state corresponding to future system states, hence enabling the development of pro-active security tools. In particular, the idea of using aggregated data as input to this classification problem is motivated by the fact that, as opposed to nodal variables, aggregated grid data can be accurately predicted on several time horizons, and these predictions are currently available to Terna. On the other hand, the choice of using aggregated grid data as input makes the classification problem extremely challenging compared to nodal variables-based classification. This problem has not been explored in the literature, to the best of our knowledge.
In trying and filling these research gaps, this paper explores the role of machine learning and feature selection algorithms in the task of developing a reliable framework for assessing power system security from a set of aggregated grid data. For this purpose, heuristic and automated feature selection algorithms, which include the Minimum Redundancy Maximum Relevancy algorithm, and advanced learning techniques, which include Random Forest, Support Vector Machine, k-nearest Neighbor, Naive-Bayes, and Feedforward Neural networks, have been applied for processing historical aggregated grid data in the task of selecting the most relevant input variables, and inferring the hidden relationships with the discrete output variable describing the grid security state.
The notable advantage of deploying this data-driven computing framework lies in its ability to promptly support TSOs in the task of identifying potential hazardous operating states, which require further detailed investigations, hence sensibly reducing the computational burden of power system security analysis. Moreover, it could avoid the need for storing and processing large and complex data sets of historical bus variables, which could exhibit a large number of very similar features for each contingency set, deteriorating the model generalization capability, and requiring complex training processes. Finally, considering that power system aggregated data can be reliably predicted from several hours to one day ahead, it may enable the evolution of security assessment to security forecasting, which could be a relevant benefit for TSOs in the context of decarbonized power systems.
A realistic case study involving two years of synthetic grid data of the Italian transmission system, which have been generated by using real security tools against potential future operational scenarios with a high share of renewables, is presented and discussed to identify the most promising data-driven technique and to analyze the criticality of feature selection and algorithm tuning process in achieving reliable classification accuracy. In particular, rather than proposing a specific methodology, this first application paper analyzes the potential role of conventional machine learning techniques in solving a new and complex classification problem. The final goal is to identify the most promising computational intelligence technique that can be deployed for surrogate modeling of the real DSA currently used by the Italian TSO.
Modern de-carbonized power grids are increasing vulnerable to dynamic perturbations, which could seriously affect power system operation, requiring detailed security analyses aimed at assessing and mitigating the impacts of multiple contingencies. For this purpose, Terna enhanced its security analysis tools with an online Dynamic Security Assessment (DSA) function, which periodically performs both static and dynamic simulations in order to analyze the system security. This DSA function automatically processes aggregated grid data generating a system snapshot every 5 min, and performing more than 250 dynamic simulations for the most critical N-1 and N-k contingencies. The obtained simulation results are automatically analyzed in order to detect critical operation states, promptly notifying the control room operators about potential alarms, and suggesting the corresponding mitigation actions. Surrogate models are here proposed to mimic the behavior of this complex computational process, which processes the grid data aggregated on the 7 system areas of the Italian electricity market to: (i) estimate the corresponding nodal variables of the Italian transmission system (which is composed by about 2,000 electrical buses); (ii) assess the static and dynamic system security of the Italian transmission system according to N-1 and N-k criteria; (iii) notify the TSO about potential contingencies that could compromise the correct system operation (i.e., by a binary variable: 0: secure–1: alarm); and (iv) identify control actions aimed at mitigating the impacts of critical contingencies. In this paper, we consider the DSA function as a black box module, and we explore the role of machine learning-based techniques in surrogating this tool by processing the same input variables and estimating the corresponding binary output variable. Particularly, one of the main advantages of the proposed methodology is that High-Performance Computing (HPC) architectures with high parallelism levels are required to solve physical-based models under the above-mentioned TSO time constraints. The HPC architectures are characterized by high installation and operational costs. Hence, surrogate models reduce the number of necessary cores for these architectures. Indeed, the computational burden linked to the surrogate models during real-time operation is null since the model is already trained and thousands of predictions can be performed in a few seconds. For this reason, it is possible to use precious computational resources only if necessary (and vice versa, increasing the detail or time resolution of each simulation since the number of cases to consider in the model-based DSA tool is reduced). Hence, according to surrogate modeling-based theory, we do not assume any physical knowledge about the computational process adopted by the target system (i.e., the DSA tool) to generate the output variable.
The data processing pipeline that should be designed for classifying the grid security state from a set of aggregated grid variables comprises the following steps: data splitting, heuristic and automatized feature selection, model training, and validation.
The historical input/output information is organized in a matrix X, having N samples and F features, along with a vector y with N samples. The F features within X are the input variables, which represent the aggregated variables describing the grid operation, encompassing both real and integer variables (e.g., the active power generated/demanded in each power system area and the corresponding exchanged power flows). Meanwhile, the elements within y are binary variables that convey information regarding the corresponding grid secure state, which are computed by the grid security assessment tool. In particular, the grid security state is one in case the security tool detects at least one critical contingency inducing system instability phenomena or grid constraint violations. This computing process requires a large number of static and dynamic simulations, which demand a very large computational burden, and motivate the application of data-driven techniques.
Thereafter, matrix X, and vector y are split into training and validation input/output data sets. The input training matrix is processed to select a subset of features using user experience or feature selection algorithms.
In this paper, several heuristic feature selections have been considered. Additionally, an automated algorithm such as the Minimum Redundancy Maximum Relevancy (mRMR) has been included for comparison, given its widespread application in solving complex classification problems. Specifically, this algorithm iteratively identifies a subset of M<F features that maximize the correlation with the output variable “y” and simultaneously minimize the correlation among the selected variables themselves (Peng et al., 2005).
The objective of the learning model is to infer from historical data the hidden relationship (Equation 1):
from the observed aggregated grid data (X) and the corresponding system security state (y). To solve this issue, in this paper, the following machine learning algorithms have been deployed in the task of assessing the most effective solution for the problem under study: Random Forest, Support Vector Machine, k-nearest Neighbor, Naive-Bayes, and Feedforward Neural Network.
A random forest (RF) is generated by combining multiple individual models known as a decision tree. The concept behind the random forest algorithm is rooted in the notion that an assembly of weak predictors, devoid of correlation and bias, can collectively enhance prediction accuracy when juxtaposed against the utilization of a solitary predictor (Liaw and Wiener, 2002).
Support Vector Machine (SVM) for Classification is an algorithm primarily focused on discovering the hyperplane that effectively distinguishes data points of distinct classes (Suthaharan and Suthaharan, 2016). Specifically, this hyperplane delineates various areas within the feature space. The algorithm aims to identify a hyperplane that maximizes the gap between the classes, signifying the amplification of the separation between the hyperplane and the nearest points.
On the other hand, the k-nearest neighbors (kNN) algorithm is a simple yet powerful approach that does not require training since the data itself serves as the model (Taunk et al., 2019). When given a query vector, kNN makes predictions by considering the outputs associated with the most similar neighbors in the input dataset. The degree of similarity is determined using a distance metric between the query vector and all instances in the input dataset.
Another computationally effective approach is the Naive Bayes, a probabilistic machine learning algorithm used for classification tasks. It is built upon Bayes' theorem, a formula that calculates the probability of an event occurring based on related probabilities. In classification, Naive Bayes calculates the probability of a given input belonging to a specific class based on its features. The term “Naive” comes from the assumption of feature independence, simplifying probability calculations and enhancing computational efficiency. Despite this simplification, Naive Bayes has shown remarkable effectiveness in tackling real-world problems.
When the previous algorithm falls due to excessive problem complexity, Artificial Neural Networks (ANNs) can be deployed. Particularly, the rise of ANNs in recent decades depends on their capacity to grasp intricate nonlinear connections within data by fine-tuning parameters using observed information. ANNs draw inspiration from the human brain's mechanics, comprising layers of interconnected nodes. Each node takes input, processes it, and generates output. Weights within nodes are calibrated using input-output data, enabling the network to tailor itself to specific tasks. ANNs can be designed with numerous layers, creating models that fall under the category of deep learning. The term “deep” alludes to the incorporation of multiple layers in the model's architecture. Multiple Layers all augmented computing capabilities for extensive computations and the accessibility of extensive datasets.
A Multi-layer Feedforward Network is a widely used architecture for several purposes including classification problems (Huang et al., 2000). Multi-layer feedforward networks are called Deep learning networks (DNN) due to the presence of several layers. In a network of this type, the information flow propagates in the same direction through several layers, where each of them applies a transformation to the inputs using activation functions like logistic functions.
To assess the performance of the machine-learning models in the task of classifying the grid security state from aggregated grid data, the conventional metrics derived from the analysis of the confusion matrix have been adopted. In particular, in the context of a binary classification problem, where a positive event is designated as y = 1 and a negative event as y = 0, the confusion matrix follows this typical configuration.
Within the confusion matrix shown in Table 1, TP indicates the number of accurate positive event predictions (y = 1), FP indicates instances where the negative event (y = 0) is inaccurately predicted as positive (ŷ = 1), TN denotes the accurate negative event predictions (y = 0), and FN corresponds to the positive event (y = 1) being overlooked (ŷ = 0). In the context of power system security assessment, the positive event indicates an insecure grid security state. By analyzing the elements of the confusion matrix, many fundamental metrics can be computed to evaluate the learning model's accuracy and reliability, TPR (True Positive Rate or Sensitivity) (Equation 2), TNR (True Negative Rate or Specificity) (Equation 3), FPR (False Positive Rate) (Equation 4), and FNR (False Negative Rate) (Equation 5):
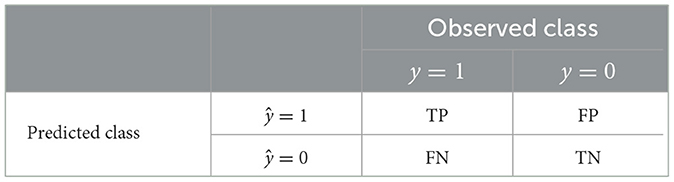
Table 1. Confusion matrix for binary classification problems.
A further metric considered in this paper is the phi-score or Matthews Correlation Coefficient (De Caro et al., 2022) (Equation 6):
where the MCC scores, gathering all the starting scores composing the confusion matrix, can assess the overall classification model quality. If the MCC score is equal to 1 the trained model perfectly predicts the classes, if the score is −1 the model predicts all the positive classes as negative and vice-versa. The MCC range can be scaled in [0, 1] as follows (Equation 7):
where nMCC is the normalized MCC score. It is essential to highlight that the scores in the confusion matrix and the corresponding accuracy metrics are associated with a specific decision threshold. Many classification methods provide a probability score indicating the likelihood of a given input x belonging to a particular class. The conversion from the predicted score to the predicted label is determined by applying a decision threshold β∈[0, 1]. For binary problems, this can be expressed as follows (Equation 8):
Hence, changing the decision threshold requires re-computing the previously computed metrics. This effect can be appreciated by observing the Receiving Operating Characteristic curve, which shows the curve FPR vs. TPR at a changing of β. Particularly, the Area Under the Curve (AUC) is a metric that provides insight into the comprehensive performance of a classification method across the entire range of optimal decision thresholds, where a perfect classifier attains an AUC of 1.
The case study discussed in this paper is based on a realistic data set composed of 21,983 synthetic operating states of the aggregated seven-area Italian power system depicted in Figure 1. The 7 area power system considered in our experiments is the real power system considered in clearing the Italian electricity market, and the corresponding aggregated data are the input of the DSA tool of the Italian TSO. These aggregated data are processed by the DSA tool to estimate the nodal variables of the Italian transmission system, which is composed of about 2,000 electrical buses, and to assess the corresponding static and dynamic security according to N-1 and N-k criteria.
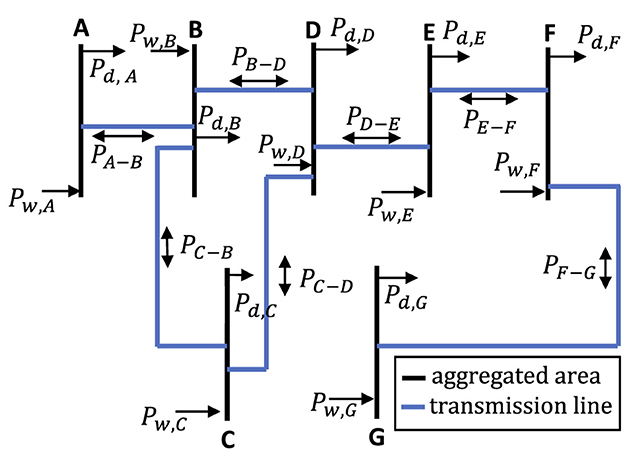
Figure 1. The 9-bus system adopted to settle the Italian electricity market.
The data set was generated by using the grid security tool currently used by the Italian Transmission System Operator, which, starting from the aggregated grid data, estimates the corresponding bus variables of the Italian power transmission system, and performs a static and dynamic security analysis for each credible contingency. The outputs of the grid security tool were processed to associate each aggregated system state with the corresponding security label, which is a binary variable whose value is 1 if the tool detected at least one critical contingency, 0 otherwise.
The data set is composed of 29 input features, which include, for each area, the power demand, the wind power generation, the number of available generators, the active power exchanged with each interconnected area, and 1 output variable, which represents the corresponding system security label. The detailed input feature list is presented in Table 2. By analyzing the produced data representing a potential future operation of the power system 417 (1,9%) unsecure states are identified following transient simulation against 21,566 (98,1%). In this scenario, some countermeasures are applied by the TSO to restore system security. Identify in advance that states, the most effective countermeasures (from security and economic points of view) are selected and applied to solve completely the violations.
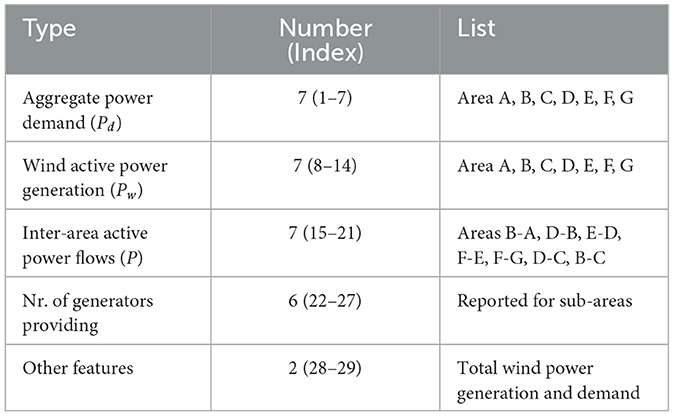
Table 2. Feature list.
Hence, the data set is split into training and validation sets by considering a ratio of 80%–20%. Data are randomly split preserving the 0.019/0.981 ratio between secure/insecure states in both sets, then an oversampling technique is applied to the training data set in the task of equally distributing the class occurrences. The latter process allows obtaining a balanced training set, which is expected to improve the model generalization (Gosain and Sardana, 2017).
The analyzed data, since related to the real behavior of the Italian power system even if against some theoretical future potential scenarios, reflects the complexity of the classification problem, which is non-linear and highly unbalanced. These features can be also confirmed by analyzing Figure 2, which reports the Pearson correlation between the available features for the entire data set, where the 30th feature corresponds to the security system label. The analysis of these data confirms the weak linear correlations between the input features and the system security label.
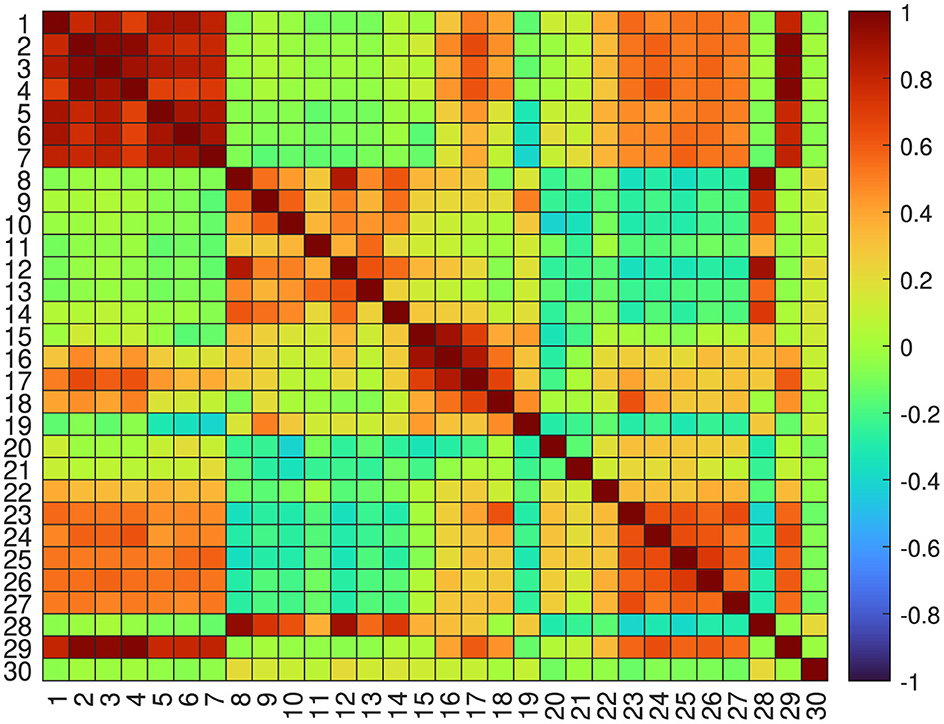
Figure 2. Correlation matrix heat map. The index of features is reported in Table 2.
Moreover, it is worth inferring the following patterns characterizing the observed variables: the power demand exhibits a strong positive correlation with the area power flows, while the area wind power generation exhibits a relatively weaker positive correlation with the area power flows. Additionally, noteworthy positive correlations are observed in the power flow data between specific areas, namely the exchange between areas B and A, D and B, and E and D.
As reported in Table 3, the following machine learning algorithms have been deployed in the task of inferring the hidden relationship between the aggregated grid data and the system security label: Random Forest, Naive-Bayes, Support Vector Machine, kNN, and a feed-forward multi-layer neural network. As far as the input feature selection is concerned, for cases A-E an heuristic approach has been deployed in the task of selecting the most relevant input variables based on the TSO experience, while for cases F-G the same problem has been solved by using an mRMR-based feature selection algorithm:
• Case A: Power Demand Data;
• Case B: Wind Power Generation;
• Case C: Inter-area Power Flows;
• Case D: Wind Power Generation and Inter-area Power Flows;
• Case E: Power Demand, Wind Power Generation, Inter-area Power Flows, and total Demand;
• Case F and G: Features Selection using the top 5 and 10 best features selected by mRMR.
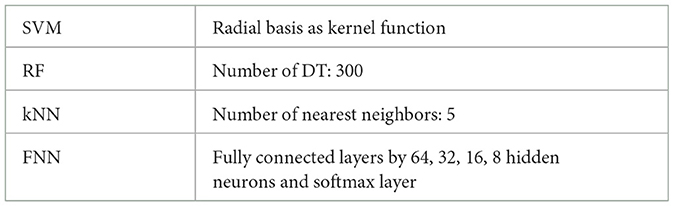
Table 3. Models' settings.
It is important to remark that both the machine learning and the feature selection algorithms deployed in this experimental analysis are based on conventional techniques frequently adopted in the computational intelligence literature to solve complex classification problems, and they have been considered only in the task of identifying the most promising computational paradigms aimed at reliably solving the challenging problem under study. Hence, these experimental studies should be considered as a prerequisite for effectively designing novel data-driven-based classification architectures.
The obtained experimental results have been summarized in Figure 3, which reports the Receiver Operating Characteristic (ROC) curves for each considered case. The analysis of these curves allows defining proper decision thresholds aimed at properly balancing the accuracy/reliability of the classification models. The complexity of this identification process can be assessed by analyzing Table 4, which reports the classification performances of each model for different values of the decision threshold.
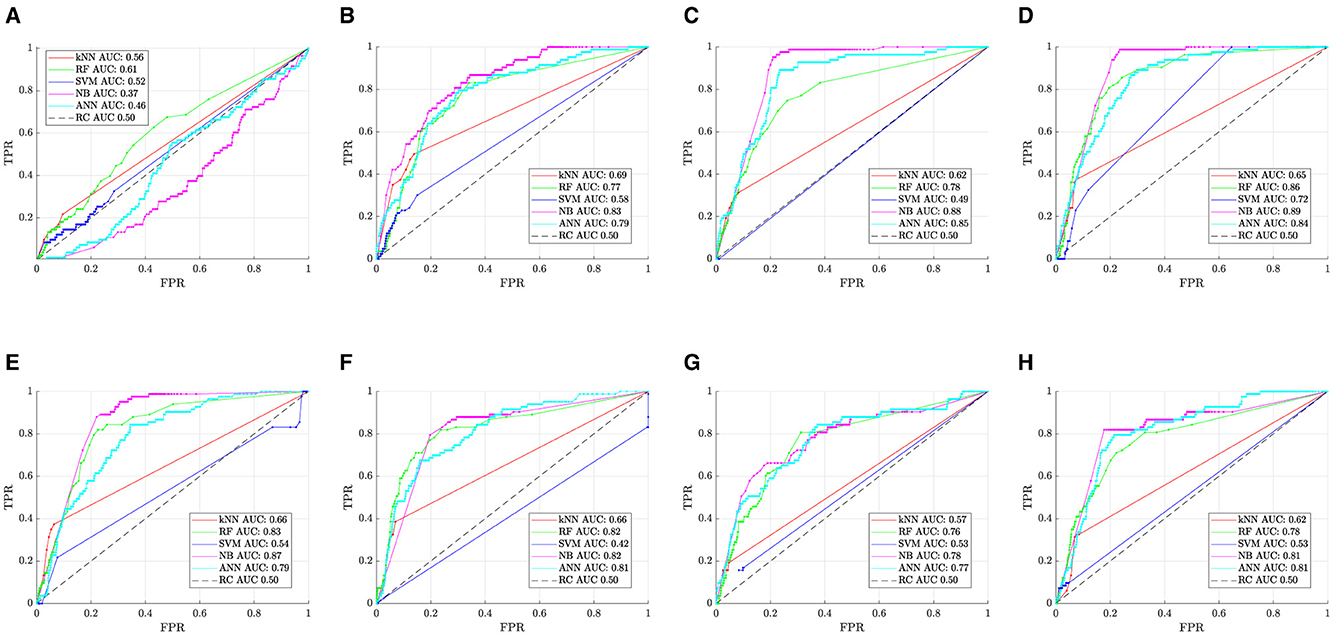
Figure 3. ROC curves for each class of considered data. (A) Power demand. (B) Power flows. (C) Wind power generation. (D) Power flows and wind power generation. (E) Power demand, wind power generation and power flows. (F) All features. (G) Best 5 selected features. (H) Best 10 selected features.
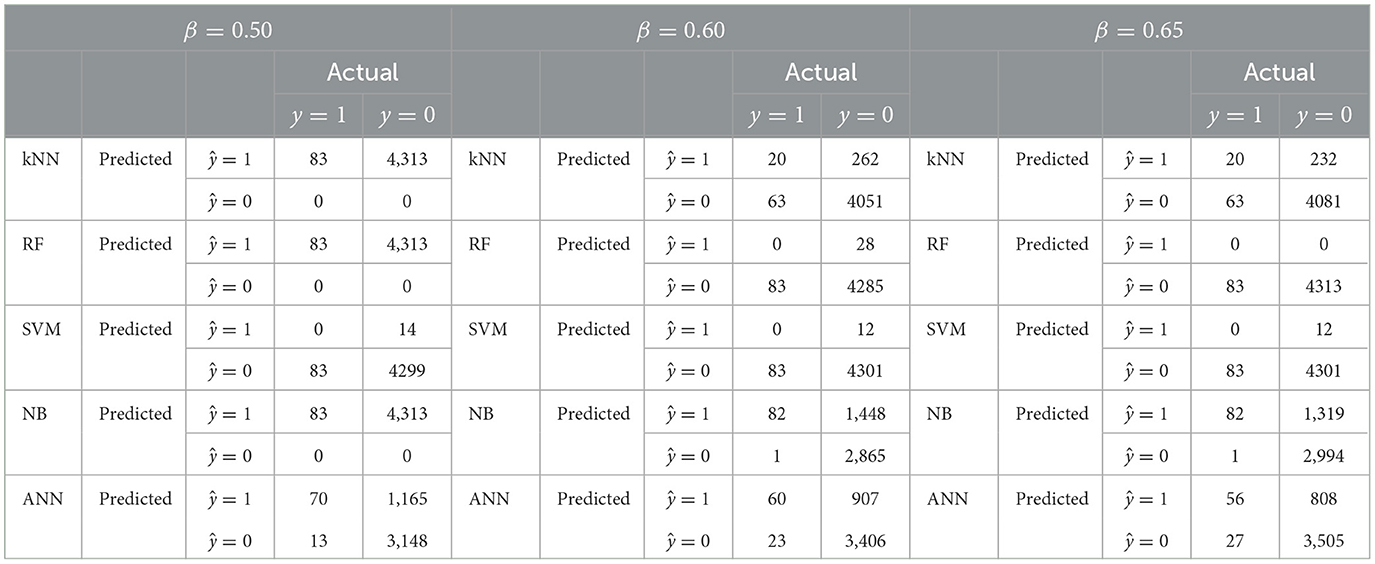
Table 4. TP, TN, FP, and FN values for several decision threshold values (β).
Furthermore, the analysis of ROC curves reported in Figure 3A reveals that using only demand data (i.e., Case A) does not allow obtaining reliable classifications, as the observed curves are either close to or below the curve corresponding to a random classifier. Furthermore, the AUC curve values for all the classification models are extremely low, consistently falling below the threshold of 0.5. The reliability of the classification models increases when considering only the power flow exchanged between each area (i.e., Case B), where Naive-Bayes methods reach an AUC of 0.83, as shown in Figure 3B. However, this score is not far from the ones returned by ANN (AUC = 0.79) and RF (AUC = 0.78).
A recognizable improvement, with the best operating point closer to [0, 1] (perfect classification), is obtained by only considering wind power generation (i.e., Case C), as shown in Figure 3C. Particularly, in this case, Naive Bayes returns an AUC = 0.89. Anyway, the combination of power flow and wind power generation does not lead to sensitive performance improvements (Case D).
Furthermore, increasing the number of input features does not lead to further enhancements, as confirmed by the AUC reduction characterizing the curves reported in Figures 3E, F, which refers to Cases E and F, respectively.
This performance deterioration could be caused by the increased complexity of the classification problem, and the higher dimensions of the input data, which could trigger the curse of dimensionality, and/or overfitting phenomena that can negatively affect the model generalization ability. This motivates the deployment of formal techniques for feature selection, which aim at identifying the most informative and relevant input variables ruling the performance of the classification models.
For this purpose, mRMR was applied to the training data set, obtaining the input features ranking listed in Table 5. Unexpectedly, the models trained using the top 5 and 10 most relevant and redundant input features seem not to outperform the model trained by using wind power generation and power flow data alone (i.e., Case D), as depicted in Figures 3G, H. This result could be justified by the complex correlation between the input and the output variables that the algorithm was not able to identify, as demonstrated in Figure 2.
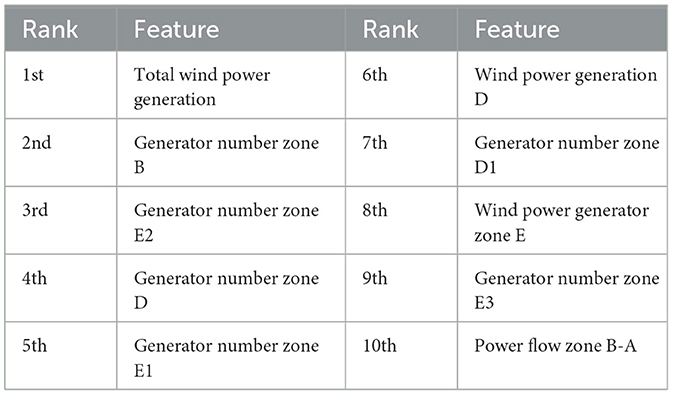
Table 5. Feature ranking.
Finally, it is important to observe that the analysis of the ROC curves could not allow for obtaining a reliable assessment of the classification performance, since they mainly emphasize the effectiveness of the classification model in detecting the positive class (i.e., the insecure state). Anyway, in classifying the grid security label, it is extremely useful to assess the model performance in terms of missed detection of insecure states (False Negative), which cannot be estimated by analyzing the ROC curves.
Hence, alternative metrics based on the nMCC should be deployed by considering the correlation between the elements of the confusion matrix. Unlike the ROC curve, which focuses on a specific threshold, nMCC provides an overall assessment of the relationship between the predicted and observed classes. The nMCC for different values of the decision threshold for all the classification models are reported in Figure 4. By analyzing this figure it is worth noting that the observed Naive-Bayes consistently outperforms the other models in all the classification tasks. This is more evident by considering the highest nMCC peaks, which often exceed a score of 0.6 for β values ranging from 0.5 to 0.7. Other notable models include FNN and RF-based classifiers.
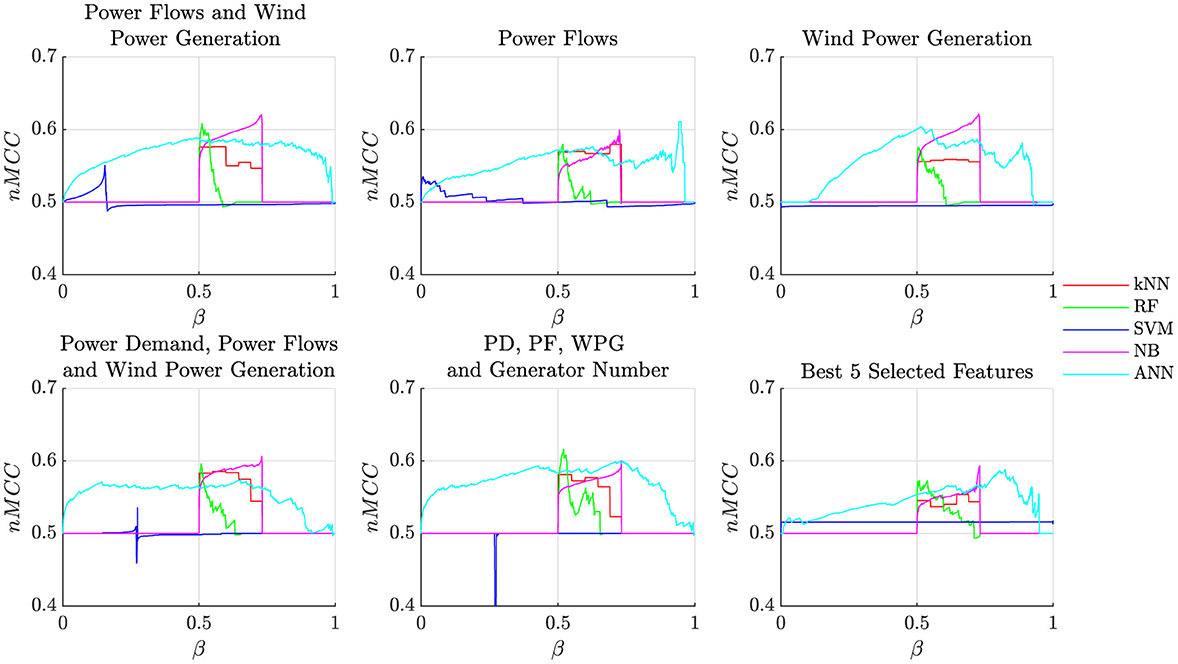
Figure 4. Visualization of nMCC profile at changing of the decision threshold β.
It is also interesting to analyze the range of β values allowing proper classification performance, which can be used to tune the decision thresholds. In particular, except for the ANN-based classifier, all the models are characterized by a limited range of feasible values for β, which allows for obtaining acceptable classification performance.
Data-driven methods represent an enabling methodology for inferring from historical data the hidden relationship between aggregated grid data and the corresponding security state, identifying potential insecure operating states that require countermeasures application very often costly.
By using a comprehensive set of realistic future potential operational data generated by the real grid security assessment tool of the Italian Power System, this paper explored the role of machine learning and feature selection algorithms in the task of solving this challenging classification problem, which is a complex issue currently under investigation by many TSOs.
The obtained experimental results demonstrated that the most promising computational intelligence-based paradigms include ANN, RF, and Naive-Bayes-based classifiers, which allows for obtaining a proper balance between reliability and accuracy. In this context, the selection of the decision thresholds represented a critical issue to address, which required detailed analysis of several important metrics. Moreover, the feature selection problem is exacerbated by the complexity of the classification problem, which includes mixed-integer variables, and unbalanced data sets, which made the application of conventional feature selection techniques ineffective.
Finally, it is important to remark that these experimental results should be considered as a prerequisite for effectively designing novel data-driven-based classification aimed at further enhancing the classification accuracy and reliability. In this context, the ongoing research activities are currently trying to infer also the mitigation actions identified by the DSA tool (e.g., renewable power curtailment) to mitigate the dynamic impacts of critical contingencies.
The datasets presented in this article are not readily available because confidential information. Requests to access the datasets should be directed to dmFjY2Fyb0B1bmlzYW5uaW8uaXQ=.
FD: Data curation, Investigation, Methodology, Writing – original draft, Writing – review & editing. GG: Conceptualization, Project administration, Supervision, Writing – review & editing, Writing – original draft. CP: Data curation, Project administration, Validation, Writing – original draft, Writing – review & editing. SI: Investigation, Methodology, Writing – review & editing, Writing – original draft. AV: Conceptualization, Supervision, Writing – original draft, Writing – review & editing.
The author(s) declare that no financial support was received for the research, authorship, and/or publication of this article.
GG and CP were employed by Terna Rete Italia S.p.A.
The remaining authors declare that the research was conducted in the absence of any commercial or financial relationships that could be construed as a potential conflict of interest.
All claims expressed in this article are solely those of the authors and do not necessarily represent those of their affiliated organizations, or those of the publisher, the editors and the reviewers. Any product that may be evaluated in this article, or claim that may be made by its manufacturer, is not guaranteed or endorsed by the publisher.
Alimi, O. A., Ouahada, K., and Abu-Mahfouz, A. M. (2020). A review of machine learning approaches to power system security and stability. IEEE Access 8, 113512–113531. doi: 10.1109/ACCESS.2020.3003568
Chatzivasileiadis, S., Venzke, A., Stiasny, J., and Misyris, G. (2022). Machine learning in power systems: Is it time to trust it? IEEE Power Ener. Mag. 20, 32–41. doi: 10.1109/MPE.2022.3150810
De Caro, F. J., Collin, A., and Vaccaro, A. (2022). Evaluation of classification models for forecasting critical voltage events in power systems. Smart Grids Sustain. Energy 8:1. doi: 10.1007/s40866-022-00159-6
Gosain, A., and Sardana, S. (2017). “Handling class imbalance problem using oversampling techniques: a review,” in 2017 International Conference on Advances in Computing, Communications and Informatics (ICACCI) (IEEE), 79–85. doi: 10.1109/ICACCI.2017.8125820
Guddanti, K. P., Vyakaranam, B., Mahapatra, K., Hou, Z., Etingov, P., Samaan, N., et al. (2023). Dynamic security analysis framework for future large grids with high renewable penetrations. IEEE Access 11, 8159–8171. doi: 10.1109/ACCESS.2023.3238316
Huang, G.-B., Chen, Y.-Q., and Babri, H. A. (2000). Classification ability of single hidden layer feedforward neural networks. IEEE Trans. Neur. Netw. 11, 799–801. doi: 10.1109/72.846750
Kundur, P., Paserba, J., Ajjarapu, V., Andersson, G., Bose, A., Canizares, C., et al. (2004). Definition and classification of power system stability IEEE/CIGRE joint task force on stability terms and definitions. IEEE Trans. Power Syst. 19, 1387–1401. doi: 10.1109/TPWRS.2004.825981
Mukherjee, R., and De, A. (2020). Development of an ensemble decision tree-based power system dynamic security state predictor. IEEE Syst. J. 14, 3836–3843. doi: 10.1109/JSYST.2020.2978504
Mukherjee, R., and De, A. (2021). “Transient stability-based security state classification of power system networks using kohonen's neural network,” in Innovations in Electrical and Electronic Engineering: Proceedings of ICEEE 2020 (Springer), 49–59. doi: 10.1007/978-981-15-4692-1_5
Peng, H., Long, F., and Ding, C. (2005). Feature selection based on mutual information criteria of max-dependency, max-relevance, and min-redundancy. IEEE Trans. Patt. Anal. Mach. Intell. 27, 1226–1238. doi: 10.1109/TPAMI.2005.159
Ren, J., Chen, J., Shi, D., Li, Y., Li, D., Wang, Y., et al. (2022). Online multi-fault power system dynamic security assessment driven by hybrid information of anticipated faults and pre-fault power flow. Int. J. Electr. Power Energy Syst. 136:107651. doi: 10.1016/j.ijepes.2021.107651
Suthaharan, S., and Suthaharan, S. (2016). “Support vector machine,” in Machine Learning Models and Algorithms for Big Data Classification: Thinking With Examples for Effective Learning, ed. S. Suthaharan (Cham: Springer), 207–235. doi: 10.1007/978-1-4899-7641-3_9
Taunk, K., De, S., Verma, S., and Swetapadma, A. (2019). “A brief review of nearest neighbor algorithm for learning and classification,” in 2019 International Conference on Intelligent Computing and Control Systems (ICCS) (IEEE), 1255–1260. doi: 10.1109/ICCS45141.2019.9065747
Venzke, A., and Chatzivasileiadis, S. (2021). Verification of neural network behaviour: formal guarantees for power system applications. IEEE Trans. Smart Grid 12, 383–397. doi: 10.1109/TSG.2020.3009401
Keywords: dynamic security analysis, machine-learning, sensitivity analysis, classification problem, power system operation and control
Citation: De Caro F, Giannuzzi GM, Pisani C, Iuliano S and Vaccaro A (2024) The role of data-driven methods in power system security assessment from aggregated grid data. Front. Smart Grids 3:1385367. doi: 10.3389/frsgr.2024.1385367
Received: 12 February 2024; Accepted: 29 April 2024;
Published: 20 May 2024.
Edited by:
Nikos Hatziargyriou, National Technical University of Athens, GreeceReviewed by:
Yishen Wang, State Grid Smart Grid Research Institute Co. Ltd., ChinaCopyright © 2024 De Caro, Giannuzzi, Pisani, Iuliano and Vaccaro. This is an open-access article distributed under the terms of the Creative Commons Attribution License (CC BY). The use, distribution or reproduction in other forums is permitted, provided the original author(s) and the copyright owner(s) are credited and that the original publication in this journal is cited, in accordance with accepted academic practice. No use, distribution or reproduction is permitted which does not comply with these terms.
*Correspondence: Alfredo Vaccaro, dmFjY2Fyb0B1bmlzYW5uaW8uaXQ=
Disclaimer: All claims expressed in this article are solely those of the authors and do not necessarily represent those of their affiliated organizations, or those of the publisher, the editors and the reviewers. Any product that may be evaluated in this article or claim that may be made by its manufacturer is not guaranteed or endorsed by the publisher.
Research integrity at Frontiers
Learn more about the work of our research integrity team to safeguard the quality of each article we publish.