 Xiangyv Lv1
 Chenglong Qi
 Huanhuan Han
94% of researchers rate our articles as excellent or good
Learn more about the work of our research integrity team to safeguard the quality of each article we publish.
Find out more
METHODS article
Front. Smart Grids, 25 April 2024
Sec. Grid Efficiency
Volume 3 - 2024 | https://doi.org/10.3389/frsgr.2024.1353732
A large proportion of new energy generation is integrated into the power grid, making it difficult for the power grid system to maintain reliable, stable, and efficient operation. To address these challenges, this article proposes a multiple microgrid hierarchical optimization structure based on energy routers as the core equipment for energy regulation within microgrids. Considering the uncertainty of renewable energy generation within microgrids, a two-layer energy management bidding strategy based on risk indicators is further proposed. In the process of trading, with the goal of maximizing a comprehensive economy, the energy trading model of the distribution network center and energy routers is divided into two sub-objectives for solving. In the first stage, based on the interests and energy supply and demand relationships of each microgrid, a risk assessment model considering wind and solar uncertainty is established to determine the risk preferences and expected returns of each microgrid. In the second stage, the original problem is decomposed into two sub-problems: the minimum cost sub-problem and the maximum transaction volume sub-problem. An asymmetric bargaining mechanism is adopted to determine the production and sales payment of the microgrid containing energy routers based on the contribution values of energy routers in each microgrid. Finally, the rationality and effectiveness of energy routers as an intelligent decision-maker in energy optimization are verified in a three-node system.
With the vigorous development of society, the level of human industrialization is increasing, and environmental pollution problems are becoming increasingly serious. To solve the contradiction between human energy utilization and the living environment, governments around the world are vigorously promoting the development of renewable energy. To promote the clean and low-carbon transformation of energy, advance the energy revolution, and improve energy efficiency, transforming traditional power systems into new smart power systems is urgent to meet the growth needs of clean and renewable energy (Hasankhani et al., 2021; Wei et al., 2021). The new smart power system can effectively integrate renewable energy, thereby promoting the development of clean energy. In the new smart power system, promoting the development of the new power system by actively developing smart microgrids that mainly consume new energy and achieving compatibility and complementarity with the large power grid has become a key point (Xiao, 2023; Xiaofan and Zhong, 2024).
In the new smart microgrid, the electricity market is no longer monopolized by a few large power companies but the utilization of advanced power electronics and information communication technology to achieve distributed energy trading (ET) (Nan, 2023; Xinyan et al., 2023). So, the emerging concept of the Internet of Energy (IoE) was proposed, which can effectively achieve efficient scheduling, management, and trading of energy through digital, intelligent, and integrated technological means (Mishra and Singh, 2023; Safari et al., 2023). As the execution terminal of the IoE, energy routers (ERs) have the ability to provide plug-and-play ports for distributed power sources, energy storage, loads, and the like and provide a continuous power supply for important loads in the area in case of a power outage with the distribution network (Koottappillil et al., 2022). Meanwhile, ER can serve as the core control device for energy microgrids, controlling the flow of electricity to adapt to constantly changing energy demands and scales (Deng et al., 2023; Liu et al., 2023; Zhichen and Yuan, 2023). Therefore, it is of great significance to study the collaboration problem of a microgrid with ERs (MGER) in the IoE for promoting innovation and progress in the energy industry, improving the security and flexibility of energy supply, and achieving a clean, efficient, and sustainable energy system.
At present, a large amount of research has been conducted both domestically and internationally on collaborative optimization and ET of multiple microgrid systems. In the coordination of multiple microgrid systems, peer-to-peer (P2P) ET has become a new means of multiple microgrid trading, which is used for energy interaction between microgrids (Jiang et al., 2023). Extensive research has been conducted on ET models and structures in existing literature (Sousa et al., 2019; Hongjun et al., 2022). Tushar et al. (2020) proposed a P2P ET and reserve scheduling model between multiple microgrids, which effectively reduces the cost of independent operation of microgrids by utilizing the method of Shapley value for profit distribution. However, the optimized model structure in massive data sets increases the complexity of decision-making and operational difficulty. Shukla et al. (2024) established a P2P transaction revenue model between microgrids. With the goal of maximizing the revenue of each microgrid, the complex decision-making problem of massive high-dimensional data and uncertainty was solved by multi-agent deep reinforcement learning, and the optimization of external transactions and internal devices between microgrid groups was achieved. However, the previously mentioned multiple microgrid optimization is very time-consuming in a multiple microgrid structure containing ERs due to multi-energy coupling and complex game relationships during ET between microgrids. It cannot effectively utilize the identity of ERs as the “energy center” and “information center” of the energy microgrid.
To fill this gap, Zheng et al. (2018) established a multi-energy hub (EH) non-cooperative game model by modeling the energy production equipment, energy conversion equipment, and energy storage equipment in the EH. Each EH played a game with other EHs with the minimum operating cost and used the interior point method to obtain the optimal strategy, which can significantly reduce the operating cost of each EH and improve the system's operational flexibility. Mingyong et al. (2022) proposed an algorithm for adaptively selecting energy and paths based on the non-linear characteristics of the transmission loss function and load types. It helps select the path with the lowest cost by exhaustively searching and comparing all feasible transmission paths, achieving the transmission with the lowest loss. Du et al. (2021) proposed a centralized energy routing algorithm for multi-energy interconnected energy systems to achieve the minimal loss of multi-energy flow. To achieve congestion-free transmission, two priority sorting methods are proposed to determine the energy transmission priority of multiple transactions based on quotation and transaction volume. However, the essence of the centralized energy routing algorithm is to place all computational burden on the network control center, requiring the network control center to have extremely high computing power.
Therefore, Guo et al. (2018, 2019a) proposed a decentralized Dijkstra algorithm to solve the energy routing problem between multiple ET pairs. Each designated ET pair uses the Dijkstra algorithm to calculate the optimal transmission line from their own perspective. However, it can only generate single-path solutions. To reduce losses, some smaller capacity transmission lines may be ignored, which may lead to network congestion. Koottappillil et al. (2022) and Chenlei et al. (2023) explored the operation of the energy internet and introduced a routing algorithm for ERs to find the shortest loss route. First, the source router and the target router are selected, and the algorithm is used to identify different paths between the two routers for reducing the network congestion and enabling the ER microgrid to allocate energy reasonably. The operation mechanism of the previously mentioned comprehensive energy microgrid group is complex without considering the organic connection between the MGER and the upper level microgrid. It makes the collaborate and optimize operation between microgrid groups difficult, which is not conducive to the development of the comprehensive energy microgrid group system containing ERs.
Guo et al. (2019b) proposed a discrete bias minimum consensus algorithm to discover the optimal power source candidate with the lowest power loss considering the bidirectional ET between ERs and distribution networks, as well as the role exchange between distribution networks and router microgrids. Feng et al. (2019) and Weifeng et al. (2021) proposed an energy management architecture for ERs in specific scenarios, which utilizes the characteristics of bidirectional energy flow, information monitoring, and remote operation to achieve energy conservation and efficiency. However, the disadvantage of ERs is that the ERs lack flexibility and scalability, and the impact of uncertain factors such as the output of wind turbines and photovoltaics among microgrids on energy supply is not considered. Therefore, when considering the interests and energy demands of MGER, it is necessary to seek a reasonable collaborative optimization operation strategy to ensure the orderly and reasonable energy interaction of ERs in the context of uncertain wind and solar power output, maximizing social profits and ensuring fairness in income distribution among microgrids.
In response to the mentioned issues, this article proposes a multiple microgrid bidding energy management strategy with ERs. The methods proposed in this article can be summarized as follows:
1. This article proposes a multiple microgrid structure containing ERs, which treats the multi-MGER as a multi-agent system composed of ERs as intelligent individuals. The ER is regarded as a public information and energy flow platform that shares its activity information with the distribution network center.
2. Under this structure, this article proposes a comprehensive energy microgrid optimization operation strategy based on a conditional value at risk (CVaR) and Nash negotiation model. This strategy aims to achieve the effectiveness and rationality of energy interaction between MGER and distribution networks while maximizing social welfare and ensuring fairness in income distribution.
3. A CVaR-based master–slave distribution company profit model is established to measure the risk of wind and solar uncertainty. The contribution of microgrids to social welfare is measured by the degree of loss of transaction costs of MGER. Each microgrid conducts asymmetric bargaining based on the size of social profit contribution to achieve fair distribution of cooperative surplus.
Finally, the effectiveness of the proposed method is verified through case analysis. The simulation results show that this method can achieve the maximization of social profits for MGER in a multiple microgrid structure. Based on the cooperation benefits of microgrid alliances, the MGER can achieve fair energy distribution in terms of social profit contribution. This provides a feasible reference scheme for the operation decision-making of multiple microgrid systems with ERs between economic benefits and risk levels.
When considering the mode of a distribution network center and multiple microgrids containing ERs, the interaction mode between the energy microgrid and the distribution network center is expressed as a Stackelberg game model. As a leader, the distribution network center provides pricing decisions to enable energy microgrids to participate in energy management and achieve maximum social profits. As an ER that follows the decision-making changes of the distribution network center, there is only a “black box” of output and usage. It shares energy configuration through cooperation in the distribution network center. As a leader, the distribution network center needs to make a choice between expected profits and CVaR in order to maximize social profits. The multiple microgrid structure with ERs is shown in Figure 1.
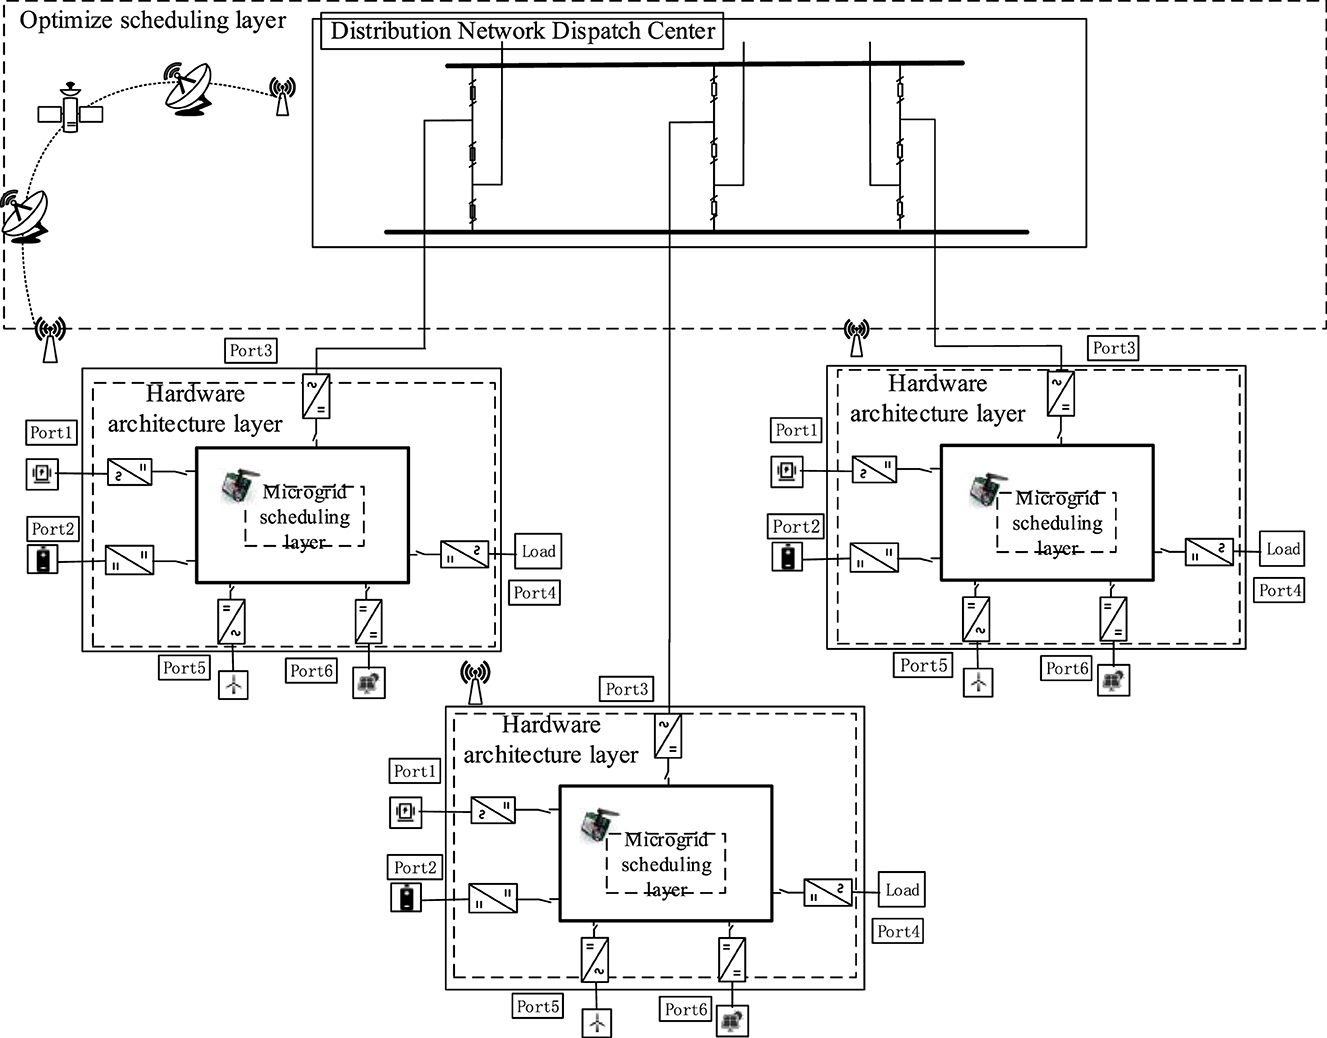
Figure 1. Multi-energy system model.
The distribution network center will incorporate all participants' ERs into the black box of the “power bank” for unified management to achieve optimal energy supply between interconnected multi-energy systems (MES). In addition to the potential risks brought by the uncertainty of ER microgrids, wind and solar power generation is considered to improve the practicality of the model, and the uncertainty brought by risk factors is considered in the distribution network center so that the interconnected MES can control the overall risk level from an overall perspective.
To clearly describe the coupling relationship of various energy sources in ERs under multiple microgrids, a matrix approach is adopted from the perspective of port devices to describe the interrelationships and interaction modes of electrical energy in ERs. By linking the input, output, and conversion of electrical energy together, constraints are imposed to simplify the calculation of the distribution network center. It can simultaneously meet the energy supply and distribution needs of microgrids at different time periods. The energy conversion matrix model is shown as follows in Equations (1–3);
where Z, X, and I represent the port output power matrix, the conversion coupling matrix, and the port input power matrix of the ER, respectively. In the conversion coupling matrix X, Xnn on the diagonal represents the network loss coefficient and distribution coefficient of energy in the transformation, Xmn outside the diagonal represents the conversion coefficients of energy between device m and device n, and the conversion coefficient includes energy allocation coefficient and energy efficiency coefficient; a represents the energy allocation coefficient. If the sum of coefficients for the same port equipment is 1, b is the port energy conversion efficiency, and c is the energy transmission loss coefficient.
As a leader, the distribution network coordinates the supply and demand of microgrids. When microgrids have a purchasing demand for energy, the distribution network needs to provide energy. When microgrids produce too much energy, the distribution network needs to purchase electricity to increase the penetration rate of new energy in the microgrid itself. It requires retailers to coordinate with the distribution network when there is a mismatch within the microgrid. Generally, the sales price is lower than the purchase price to encourage production consumers to arrange internal energy. However, in the coordination process, microgrids themselves cannot have unlimited access to energy during low-price periods, and the distribution network itself is not an infinite functional system, which may lead to the collapse of the power grid. So to achieve coordinated management and reduce the impact on Distribution Network (DN) , the goal of retailers is to maximize social profits while controlling risk levels to cope with uncertainty. The decision-making model of the distribution network is shown as follows in Equations (4) and (9):
where i denotes the producer and seller measure, t denotes the time measure, denotes the total number of producers and sellers, T the sum of all times, Ω denotes the total capacity of producers and sellers, and πi denotes the probability that producers and sellers are willing to take a risk when purchasing electricity. β weighting factor for the producer-seller's profit abandonment at load shedding; ζi auxiliary calculation of Value at Risk (VaR) associated with the producer-seller; γ is the constraints associated with the Lagrangian multiplier operator; ηi, w and ηi, v are the wind and light conditions' value-at-risk indicators, respectively; is the price of energy purchased by producers and sellers from the distribution grid network; is the price of energy sold by producers and distributors to the distribution network; is the price of energy sold by producers and distributors to the distribution network; is the producers and sellers selling to the distribution grid energy; is producers and sellers purchasing energy from the distribution grid network; and are the upper and lower bounds, respectively, on the sale of energy from producers and sellers in the distribution network; and are the upper and lower bounds, respectively, for the purchase of energy from producers and sellers in the distribution network; is the average price of energy sold by producers and distributors to consumers; and is the average price of energy sold by producers and distributors to the distribution network.
Equation (4) is the objective function, which consists of two components: (1) the expected retailer's revenue (the expected revenue from sales to production consumers minus the expected cost of purchases from the DN) and (2) the trade-off between the expected revenue and the risk (CVaR multiplied by the weighting parameter β). A larger value of β implies a greater preference for risk aversion. Lower values of β are chosen to obtain higher revenues to reduce expected costs. In contrast, conservative retailers tend to choose larger values of β to increase the weight of risk aversion. Constraints 5 and 6 constrain the transaction price offered to consumers to the interval. To limit the retailer's market power, Constraints 7 and 8 set the daily average price to impose the retail price. In the process of operation, the agreement is assumed to have an impact on retailers and production consumers. The impact of value β on the revenue can be calculated through Constraint 9.
As an ER microgrid that changes with the response of the distribution network, ERs participate in the production and distribution of energy. Therefore, ERs are referred to as producers and sellers. As followers that change with the response of the distribution network, ERs determine their transactions based on changes in risk and operating costs:
where and are the operational costs with or without containing ET; and are decision variables with or without containing operational trading, and their influencing factors are shown in Equations (18) and (19); reflects the trading capacity during the trading process; is the cost of losses in the process of charging and discharging by the producers and sellers; is the producer's storage capacity; is the producer's discharging capacity; is the capacity of the producer in a unit of time; is the load of the producer and seller in a unit of time; , , , and are the upper values of the main grid transmission and reception and the upper values of the producer's and the seller's charging and discharging, respectively.
Equation (20) considering prices and multiple scenarios, the responses of production consumers are modeled by the lower level problems (Equations 10–17). The objective Function (Equation 10) of the producer and seller as a follower has two parts: the first term represents the internal cost function of the producing consumer without a transaction term, and the second term models the cost of a transaction term with a transaction cost equal to the sum of the internal cost function and the payments made by other producers and sellers. The internal cost functions without or with transactions are denoted as Equations (11) and (12), and the functions include the ET cost with the distribution network and battery.
The difference between the two expressions lies in whether to directly consider transactions with the storage power station, which ensures the power balance of the ER at each unit time and in each pattern of production and sales. Constraint 13 ensures that the sum of the export power of production consumers with surplus energy equals to the sum of the import power of remaining production consumers. The energy transactions between the distribution network and production consumers are subject to Constraints 14 and 15. Constraints 16 and 17 define the restrictions on energy transmission and reception between the distribution network and producers and sellers, while Constraint 19 reflects that different trading capacities in the trading process are smaller than their production capacities.
In this article, the MES is jointly established by multiple microgrids containing ER, and the distribution center only needs to consider the total configuration cost of the MES and the risk operation cost brought by CVAR calculation when configuring. The distribution network center needs to configure MES reasonably to minimize the operating cost of the system. At the same time, each microgrid containing ERs will adjust the output of various equipment in the system according to the configuration of the distribution network center to flatten the net load. Therefore, this problem belongs to a double-layer optimization problem. This article requires the use of solvers or heuristic algorithms to solve the problem of maximizing the overall social profit of multiple microgrids. As can be seen from the model in Section 2, the microgrid model and distribution network model belong to non-convex linear models. To facilitate the solution, it is necessary to relax these non-linear constraints in the non-convex problem of joint optimization of multiple energy microgrids and decompose the problem into two subproblems to solve it, that is, to solve the global cost minimization subproblem (P1) and the energy greedy acquisition subproblem (P2) following the distribution company to complete market clearing and enable the problem to be solved by the solver (Yanchun et al., 2023; Yang et al., 2024).
First, the producer and seller can cooperate with other producers and sellers to minimize the operating cost, while at the same time, the producer and the seller maximize the amount of energy they can obtain from the distribution network under a limited constraint, which can be called greed. Therefore, we decompose the problem of optimal scheduling to the minimum cost subproblem P1 and the maximum transaction volume subproblem P2, which is Equation (21) as:
for Constraints 5 through 9.
Trading volume maximum acquisition has been formulated as
for Constraints 13 through 19.
The decisions of the two subproblems affect each other. When the distribution network determines the supply and price through Equation (21), the market price of electricity will be affected, thereby affecting the decisions of electricity traders and consumers. Question 2 needs to consider these price factors and make appropriate bargaining decisions through Equation (22). This creates a feedback loop between the problem in Equation (21) and the problem in Equation (22). The decisions of the distribution network will affect the decisions of the microgrid, which, in turn, will affect the decisions of the distribution network layer. This feedback loop can lead to adjustments in market prices and supply and demand, ultimately tending toward an optimal equilibrium state.
By relaxing the non-linear term, problems trapped in local optima can be transformed into global optima. Additional boosting variables need to be introduced for expansion, and then the method of spatial branch and bound, which is the algorithm for solving the most general Mixed-Integer Nonlinear Programming (MINLP), can be used. It differs from the traditional branch and bound methods used to solve mixed-integer linear programming (MILP) problems in that relaxation is no longer a simple linear relaxation but, rather, approximates the functions in each constraint and optimization objective using the functions of convex under estimator or concave over estimator, providing a lower/dual bound for pruning. The branch-and-bound method not only needs to reduce the upper and lower bounds of integer variables but also needs to limit the variables included in the constraint and update the corresponding approximation function (Lin, 2021).
In the process of relaxing variables, the main discussion is about the constraints on ET. In the process of ET, energy selling and energy purchasing cannot occur simultaneously for the same buyer and seller due to there being mutual exclusion between them.
The complementary relaxation condition of the lower level model can be expressed as follows:
At the optimal solution point of the lower model, we have ∇L = 0; that is Equations (33–36).
Constraints 24 through 32 are used to replace the lower model, and the calculation can transfer the original two-tier collaborative planning model into a single-tier MPEC problem.
The preceding linearized model has complementary relaxation constraints and non-linear bilinear terms, making it a non-convex model that is not suitable for a direct solution. Therefore, in this section, the Big M method will be used to apply convex constraints to the non-convex parts of the previously described model, and strong duality theory will be used for linearization.
Using the Big M method, the original non-linear constraint is equivalently transformed into a mixed-integer linear constraint by introducing several 0–1 variables. This article discusses the constraint problem of ET. In the process of ET, it is impossible to sell energy and purchase energy simultaneously for the same buyer and seller. Therefore, there exists a transmission and distribution model as shown in Equation (37) regardless of whether energy increases or decreases. Constraints 5 and 6 are transformed into Constraints 38 and 39. The 0-1 power distribution is shown in Equation 40.
is the energy sold by producers and sellers sell to the distribution network, is the energy purchased by producers and sellers from the distribution network, and M is a sufficiently large constant.
The bilinear term can be linearized based on strong duality theory, which can transform the previous model into a Mixed Integer Second-Order Cone Programming (MISOCP) model that can be optimized and solved. The objective function is shown as follows:
The constraints are Equations (13–19, 23–32, 38, 39). The commercial solvers can be used to solve this convex optimization problem and obtain market clearance.
In the probability distribution modeling of wind and solar power generation scenarios, data from a specific power company in Jilin Province is utilized as a foundation. To mitigate computational challenges stemming from the considerable randomness, volatility, and uncertainty introduced by variables like weather, season, and region in large-scale output scenarios, the k-means method is applied to streamline wind and solar power generation scenarios. Employing the approach of minimizing Euclidean distance, the number of clusters represented by the cluster center is determined, resulting in the identification of 10 clusters corresponding to the cluster center (Li and Shanshan, 2018; Mingqian et al., 2023).
Figures 2A–C show the power generated by wind turbines in microgrids 1, 2, and 3, while Figures 3A–C show the power generated by photovoltaics in microgrids 1, 2, and 3. It can be seen from the figures that the wind and solar power output is greatly affected by natural resources and time with great uncertainty and volatility. The probabilities of each are presented in the figures after considering the speed and accuracy.
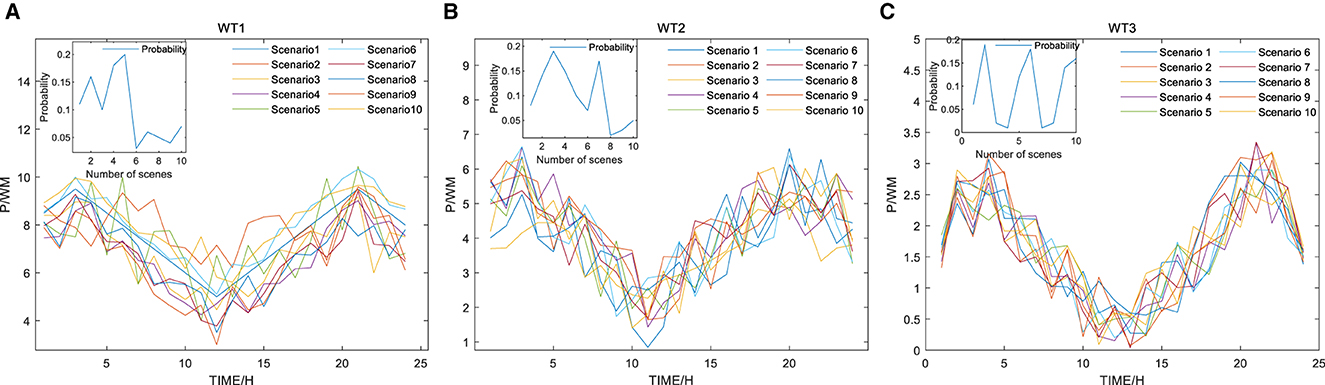
Figure 2. Wind turbine stochastic scenarios and probabilities: (A) Microgrid 1 turbine stochastic generation scenario; (B) Microgrid 2 turbine stochastic generation scenario; (C) Microgrid 3 turbine stochastic generation scenario.
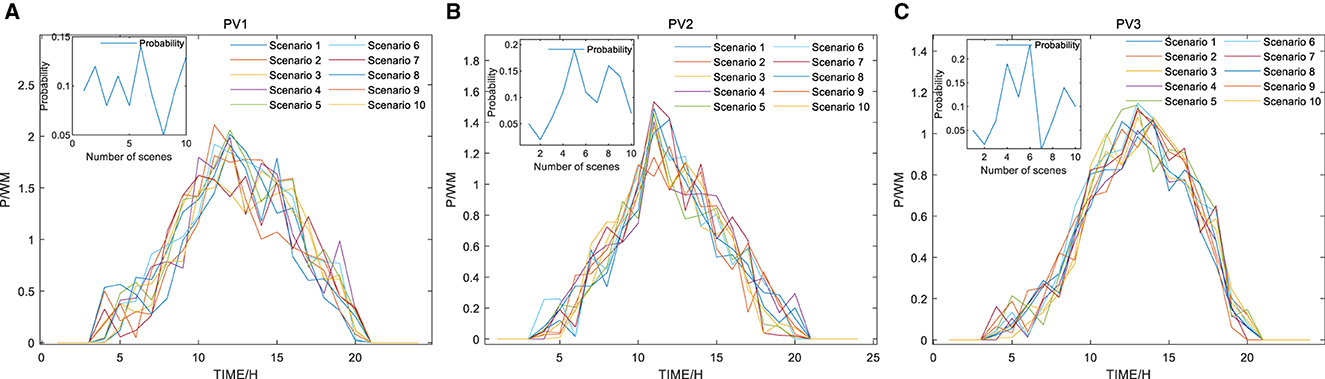
Figure 3. Optical machine random scenarios and probabilities: (A) Microgrid 1 opto-machine stochastic power generation scenario; (B) Microgrid 2 opto-machine stochastic power generation scenario; (C) Microgrid 3 opto-machine stochastic power generation scenario.
The Cornish–Fisher method is a continuous asymptotic expansion method for the quantile of a standardized random variable. It expands the quantile function of a true distribution into a polynomial function about the quantile function of a standard normal distribution. The first four orders of the expansion are expressed as follows:
where zα is the quantile of the standard normal distribution at α and κ3 and κ4 denote skewness and kurtosis, respectively.
Under this quantile expansion, the loss random variable can be expressed as follows:
where μl and σl denote the expectation and standard deviation of the loss random variable in period l, respectively. It can be seen that the asymptotic expansions and values of the quantiles are obtained by estimating the skewness κ3 and kurtosis κ4 from the samples without knowing the true distribution of the loss random variable.
Considering the potential uncertainty in multiple aspects of energy supply, consumption and trading on a time-series basis increases the risk of distribution network operation. I denotes the number of microgrids and the risk of multiple uncertainties in the real-time phase can be expressed as follows Equation (44):
where s1, s2,..., sN are sample data and α is the confidence level; the ηi, w and ηi, v auxiliary variables related to the scenery produced by consumer i and scenario w are used to calculate the CVaR.
To avoid false regression and eliminate heteroscedasticity, it is usually necessary to take the logarithm of the data from the wind and solar series with time attributes without changing the properties of the time series and correlation to obtain smooth data and make the data closer to a normal distribution. The formula for taking the series is as follows Equation (45): (Peng et al., 2023):
to estimate the percentage of failures at a 95% confidence level.
1. It is clear that most of r is smaller than the corresponding VR and CVaR estimated values; that is, the risk estimates are essentially valid. If r is greater than the corresponding VaR or CVaR value, then the risk estimation fails. It is clear to see that the CVaR is more reliable for the data.
2. In comparison with the theoretical values and the CVaR method, the VaR method is clearly inappropriate for measuring risk in the electricity bidding market.
3. The CVaR method estimates market risk well, while the VaR method has a significant difference with the reality when estimating the risk.
In this article, the three-node model of Figure 1 is used to give the parameters of three microgrids for arithmetic calculations. The parameters of the devices are set according to Peng et al. (2021) and Na et al. (2023). To estimate the percentage of failures at 95 per cent confidence level in Table 1. The parameters of each device are given in Table 2. The computer configuration I7-12700, RTX3060 12G, and MATLAB2021b are used for the simulation.

Table 1. Comparative analysis of CVaR and VaR.
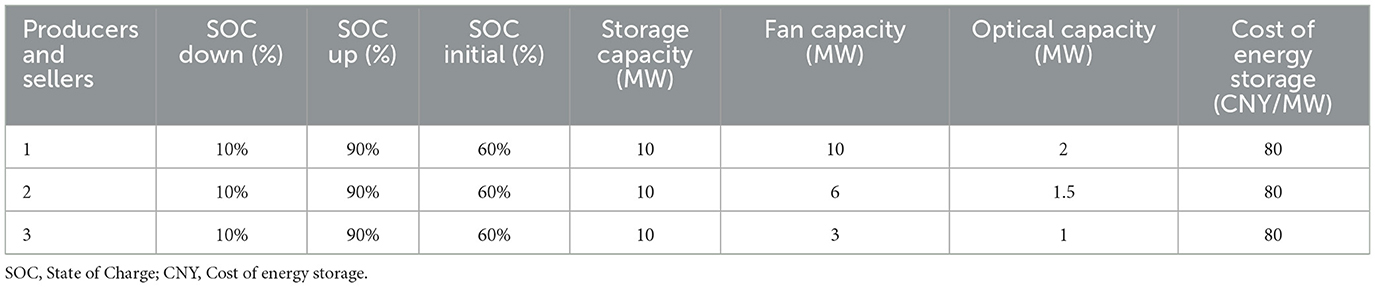
Table 2. Capacity parameters for producers and sellers.
The producer-marketer and load tariff phase-in tariffs are shown in Table 3.

Table 3. Time division and real-time tariffs for each time period.
The comparison of expected profit with CVaR is shown in Figures 5–7. This article calculates the CVaR and expected profit at a 95% confidence level for different risk factors. By modifying the parameters from Equation (41), β, the effect of this parameter on the balance between expected profit and profit variability (measured by CVaR) is described as follows.
The first point in Figure 4 is obtained by solving for the parameter β close to 0, which represents the maximum profit that the producer and the seller may get when they are in a condition of risk aversion and is approximated to be the optimal trading strategy of the producer and seller when they do not take into account the CVaR. It can be seen that as the degree of bidding increases, the producer and seller become more and more risk-averse, and the expected return decreases accordingly.
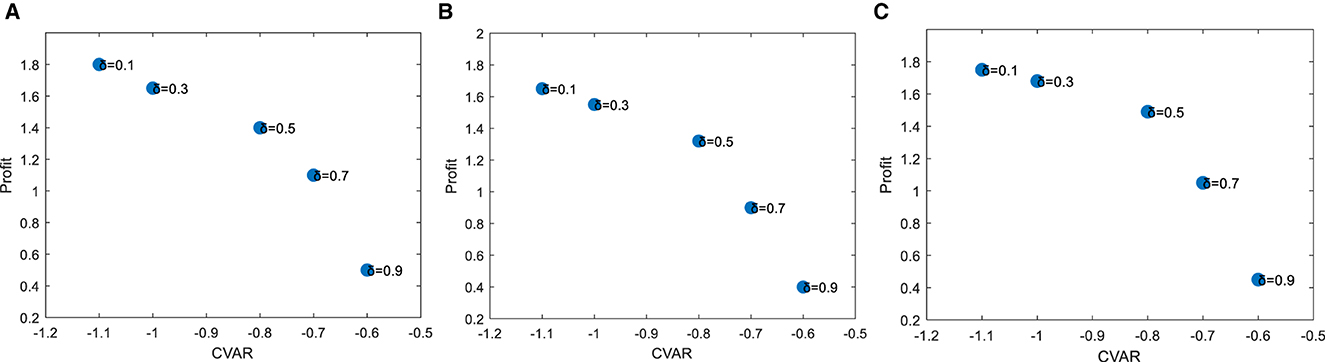
Figure 4. Expected profit and CVaR of producers and sellers with different values of β: (A) Expected profit and CVaR for producer and marketer 1; (B) Expected profit and CVaR for producer and marketer 2; (C) Expected profit and CVaR for producer and marketer 3.
The distribution network, as a leader, takes the maximization of overall profit as the overall goal, analyzes the impact of different risk indicators on the trading profits of each producer and seller, and thus guides the producers and sellers of new ET of outputs and promotes the amount of new energy consumption.
Figure 5 shows the change in the trading curves of producers and sellers when comparing different risk indicators (β = 0.1, β = 0.5, β = 0.9), which clearly illustrates the impact of different risk indicators on the producer-seller's interest. The impact of β on the optimal pricing strategy is examined to clearly illustrate the retailer's attitude toward risk. As we can see, y's positive axis is the profit obtained from the producer-seller's sale of the power, which consists of the profit from the sale of the power to the loads and the profit from the sale of the power to the distribution network. While y's negative axis is the cost of purchasing power to the producer and seller, which includes the cost of purchasing power from the distribution network and the cost of losses due to the constant charging and discharging of batteries.
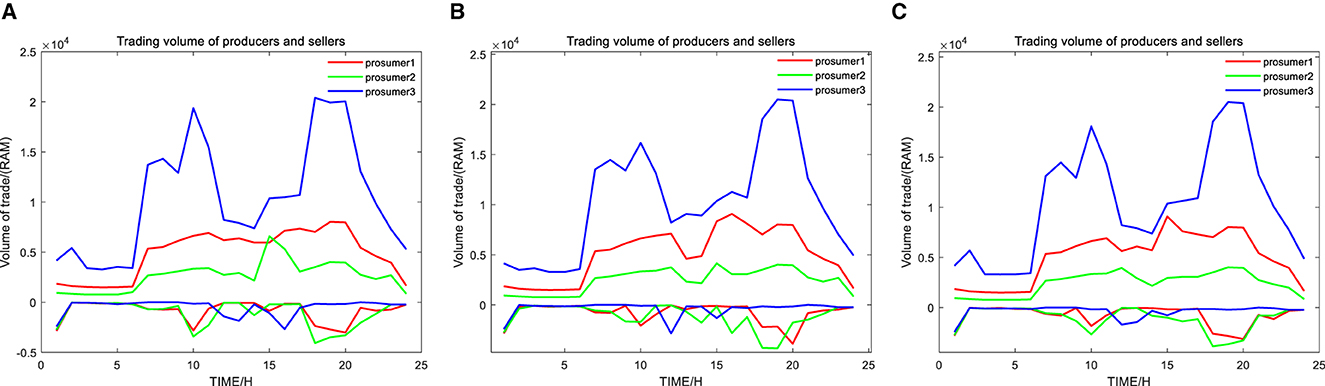
Figure 5. Trading curves of producers and sellers with different values of β: (A) β = 0.1; (B) β = 0.5; (C) β = 0.9.
When comparing vertically between producers and sellers 1, 2, and 3, it can be seen in the figure that at points 6–19, the constant sale of electricity to the loads and the distribution network gets better profit when the price of electricity is higher. The negative axis shows that the cost of energy storage and electricity purchase changes faster when the constant output changes, but overall, the producers and sellers are in a gainful state. When comparing the impacts under different risk indicators horizontally, the producers and sellers are affected by the risk indicators, the risk gradually increases, and they constantly seek energy to increase the demand for peaks and increase the demand for purchased power in the flat period to hoard energy. It indicates that the producers and consumers try to maximize their profits by trading energy with each other.
The transaction price between the distribution network and producers and sellers depends on the attitude of producers and sellers toward risk, which is caused by the uncertainty of wind and solar power output. Retailers determine reasonable prices within a price range by setting minimum and maximum values, thereby maximizing social welfare. Therefore, retailers seeking risk may offer competitive prices to attract production consumers to participate in energy sharing while taking on relatively high risks.
The cplex solver is used to solve the model, and then the optimal risk transaction value for each producer and seller will be figured out by sorting and looping algorithms to obtain the optimal price curve for maximizing overall welfare. The convergence iteration situation is shown in Figure 6.
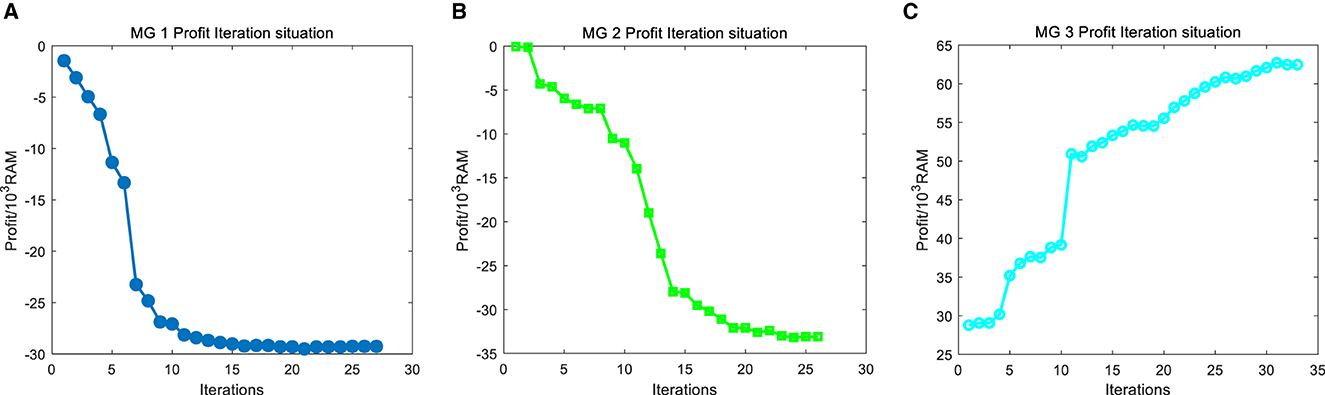
Figure 6. Iterative convergence results of microgrid alliance: (A) MG 1 profit iteration situation; (B) MG 2 profit iteration situation; (C) MG 3 profit iteration situation.
Figure 6 shows the iterative convergence results of each Microgrid (MG) cost. The proposed method achieves convergence after a total of 86 iterations, with a calculation time of 689 s. After the iteration convergence results are met, the residuals of each microgrid iteration converge to within 10−3. Therefore, it indicates that the methods proposed in this article have good convergence performance and computational efficiency, meeting the needs of optimization scheduling.
Figures 7, 8 present the pricing curves and transaction power of each producer and seller when maximizing the comprehensive benefits under the leadership of the distribution network.
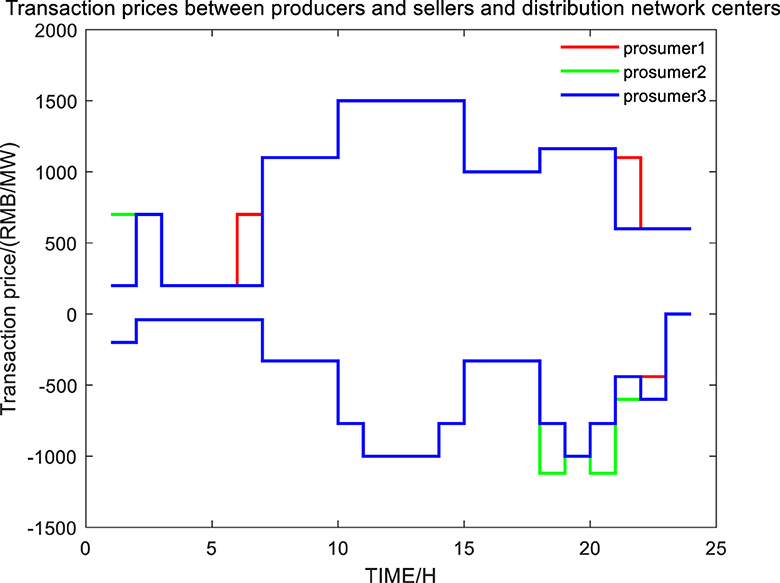
Figure 7. Purchased and sold power pricing curves.
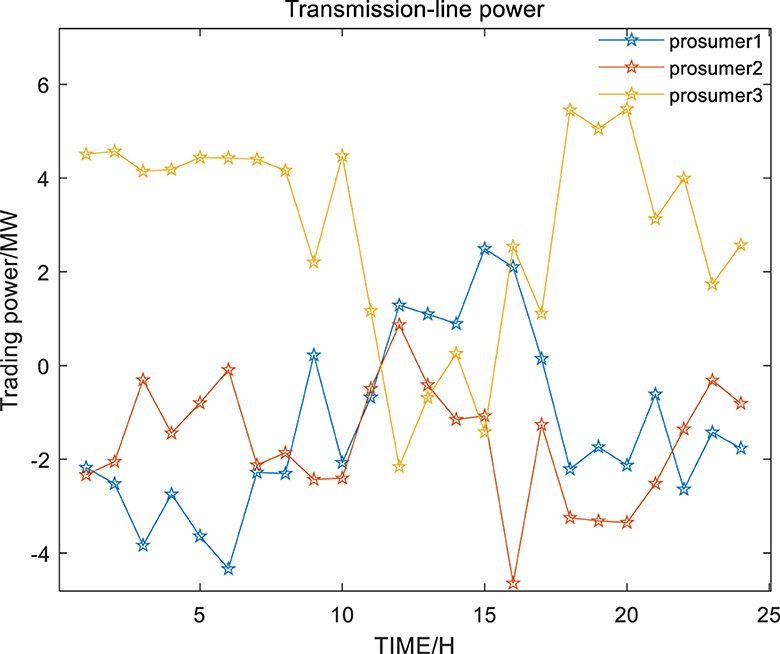
Figure 8. Transmission line trading power.
Figure 7 shows the optimized pricing curve for producers and sellers. The negative price represents the selling price of energy for producers and sellers, while the positive price represents the purchasing price of energy. For the sake of profit, when the operators of the distribution network sell energy to producers and sellers, the selling price tends to be higher than the purchase price. Constrained by the load price, the purchase price cannot be higher than the load price, making it profitable for producers and sellers. Figure 8 shows the optimal trading power curve based on the pricing curve in Figure 7, which combines the overall welfare maximization with the risk-value and risk-return curves brought by uncertain loads. Positive represents the purchasing quantity of producers and sellers, and negative represents the selling quantity. It can be seen that during periods 0–7 and 19–23 when the load is lighter, the transaction is smoother. During periods 8–16, producers 1 and 2 sell more electricity, while the purchased electricity needs to be able to meet the demands of providing the electricity to the load.
In this article, a dual-layer energy interaction framework for multiple microgrids with ERs is proposed, which can help the distribution network center coordinate energy transactions with ERs. Taking the multiple microgrids containing ERs as a multi-agent system, its activity information can be shared with the distribution network center. On this basis, we propose a Stackelberg game theory model, whereby the distribution network center serves as the leader and the microgrid containing ERs serves as followers. At the same time, risk measurement methods—VaR and CVaR calculation—are introduced to identify and quantify potential losses under uncertainty in wind and solar output. Leaders make a balanced choice between income and risk to determine price conditions under current risk indicators, encourage followers to engage in ET, expand wind and solar consumption, and improve overall returns of microgrid groups. In the multiple microgrid bidding strategy with ERs considering the uncertainty of wind and solar power generation proposed in this article, there are two stages of energy management. In the first stage, a master–slave distribution company profit model based on the conditional risk value is established based on the interests and demands of each microgrid and the energy supply and demand relationship, achieving a risk measurement of the dual uncertainty of wind and solar power. In the second stage, the previous problems will be decomposed into the minimum cost subproblem and the maximum transaction volume subproblem for asymmetric bargaining, and the fair allocation of energy will be carried out based on the contribution value of each microgrid containing ERs. The simulation results show that the model enhances the ability of the multiple microgrid system with ERs to cope with uncertain wind and solar output, improve the effectiveness and rationality of energy interaction between the microgrid with ERs and the distribution network while maximizing the profits of the multiple microgrid and ensuring fairness in the distribution of benefits to participants.
Future work will include analyzing and establishing optimization problems of microgrids with ERs under different configurations, further considering classification research on ER microgrids, and determining the impact of different microgrids on multiple microgrid systems to improve the widespread and universal application of ER-based multiple microgrid systems.
The original contributions presented in the study are included in the article/supplementary material, further inquiries can be directed to the corresponding author.
XL: Investigation, Supervision, Writing – review & editing. CQ: Writing – original draft. XJ: Writing – review & editing. JY: Data curation, Project administration, Resources, Writing – review & editing. HW: Writing – review & editing, Investigation, Visualization. HH: Data curation, Formal analysis, Supervision, Writing – review & editing.
The author(s) declare that financial support was received for the research, authorship, and/or publication of this article. This work was supported by the Jilin Province's “Land Scenery Three Gorges” High Quality Development Major Science and Technology Project—Park level Multi Microgrid System Participation in Grid Friendly Interaction Key Technology Research Project (No. 20230303003SF).
JY was employed by Jilin Electric Power Co., Ltd.
The remaining authors declare that the research was conducted in the absence of any commercial or financial relationships that could be construed as a potential conflict of interest.
All claims expressed in this article are solely those of the authors and do not necessarily represent those of their affiliated organizations, or those of the publisher, the editors and the reviewers. Any product that may be evaluated in this article, or claim that may be made by its manufacturer, is not guaranteed or endorsed by the publisher.
Chenlei, W., Da, J., and Chenghong, G. (2023). Energy router physical layer model and configuration strategy based on complex network theory. Chin. J. Elect. Eng. 43, 2666–2677. doi: 10.13334/j.0258-8013.pcsee.212419
Deng, J., Wang, X., Chen, T., and Meng, F. (2023). An energy router based on multi-hybrid energy storage system with energy coordinated management strategy in island operation mode. Renew. Energy 212, 274–284. doi: 10.1016/j.renene.2023.05.022
Du, Y., Yin, X., Lai, J., Ullah, Z., Wang, Z., Hu, J., et al. (2021). Energy optimization and routing control strategy for energy router based multi-energy interconnected energy system. Int. J. Electr. Power Energy Syst. 1:107110. doi: 10.1016/j.ijepes.2021.107110
Feng, D., Bin, L., Conglei, C., et al. (2019). Research on an energy router for ordered charging of electric vehicles based on NB IoT. 3rd Smart Grid Conf. 6, 244–249. doi: 10.26914/c.cnkihy.2019.055204
Guo, H., Wang, F., James, G., Zhang, L., and Luo, J. (2018). Graph theory based topology design and energy routing control of the energy internet. IET Gener. Transm. Distrib. 12, 4507–4514. doi: 10.1049/iet-gtd.2018.6238
Guo, H., Wang, F., Li, L., Zhang, L., and Luo, J. (2019a). A minimum loss routing algorithm based on real-time transaction in energy internet. IEEE Transact. Ind. Inf. 15, 6446–6456. doi: 10.1109/TII.2019.2904188
Guo, H., Wang, F., Zhang, L., and Luo, J. (2019b). A hierarchical optimization strategy of the energy router-based energy internet. IEEE Transact. Power Syst. 34, 4177–4185. doi: 10.1109/TPWRS.2019.2907323
Hasankhani, A., Hakimi, S. M., Shafie-khah, M., and Asadolahi, H. (2021). Blockchain technology in the future smart grids: a comprehensive review and frameworks. Int. J. Elect. Power Energy Syst. 1:106811. doi: 10.1016/j.ijepes.2021.106811
Hongjun, G., Fan, Z., Junyong, L., et al. (2022). Design of P2P transaction mechanism for community microgrid systems considering the differentiated characteristics of multi production and consumers. Chin. J. Elect. Eng. 4:42. doi: 10.13334/j.0258-8013.pcsee.210105
Jiang, X., Sun, C., Cao, L., Liu, J., Law, N.-F., Loo, K. H., et al. (2023). Peer-to-peer energy trading in energy local area network considering decentralized energy routing. Sustain. Energy Grids Netw. 34:100994. doi: 10.1016/j.segan.2023.100994
Koottappillil, D. P., Naidoo, R. M., Mbungu, N. T., and Bansal, R. C. (2022). Distribution of renewable energy through the energy internet: a routing algorithm for energy routers. Energy Rep. 8, 355–363. doi: 10.1016/j.egyr.2022.10.201
Li, L., and Shanshan, X. (2018). K-means algorithm for optimizing initial cluster centers and determining K values. Comp. Digit. Eng. 46, 21–24.+113. doi: 10.3969/j.issn.1672-9722.2018.01.006
Lin, W. (2021). Strong Pairwise Theory for Distributed Stochastic Optimisation Problems Based on the Wasserstein Distance. Shanghai University of Finance and Economics.
Liu, Y., Zhang, Y., Cheng, G., Lv, K., Zhu, J., Che, Y., et al. (2023). Grid-friendly energy prosumers based on the energy router with load switching functionality. Int. J. Elect. Power Energy Syst. 144:108496. doi: 10.1016/j.ijepes.2022.108496
Mingqian, L., Miao, M., and Fang, L. (2023). Improved k-means clustering method for power grid control automation system data. Mech. Electron. 41, 34–38.
Mingyong, C., Mingyang, X., Zhigang, L., et al. (2022). Operation optimisation strategy of multiple integrated energy service providers based on cooperative blog. Chin. J. Elect. Eng. 42, 3548–3564. doi: 10.19912/j.0254-0096.tynxb
Mishra, P., and Singh, G. (2023). Energy management systems in sustainable smart cities based on the internet of energy: a technical review. Energies 16:6903. doi: 10.3390/en16196903
Na, Z., Huan, W., Kun, S., et al. (2023). Study on dynamic optimal control of integrated energy system based on multi-energy demand response. Electr. Meas. Instrument. 60, 16–24.
Nan, X. (2023). Power allocation strategies for photovoltaic energy storage microgrids taking into account energy interconnections. Sci. Technol. Bull. 39, 31–35. doi: 10.13774/j.cnki.kjtb.2023.10.007
Peng, L., Difan, W., Yuwei, L., et al. (2021). Optimal scheduling strategy for multi-microgrid integrated energy system based on integrated demand response and master-slave game. Chin. J. Elect. Eng. 41, 1307–1315. doi: 10.13334/j.0258-8013.pcsee.201845.
Peng, Z., Shulin, C., and Jingxin, L. (2023). Consistency mean CVaR credibility portfolio optimization. China Manag. Sci. 31, 111–121. doi: 10.16381/j.cnki.issn1003-207x.2023.0256
Safari, Z., Javareshk, S. M. A. N., Niaemanesh, M., Shahabi, M., and Shafahi, H. (2023). “Intelligent management of the electricity distribution network based on the internet of energy,” in 2023 27th International Electrical Power Distribution Networks Conference (EPDC), 178–185.
Shukla, S., Hussain, S., Irshad, R. R., Alattab, A. A., Thakur, S., Breslin, J. G., et al. (2024). Network analysis in a peer-to-peer energy trading model using blockchain and machine learning. Comp. Stand. Interfaces 88:103799. doi: 10.1016/j.csi.2023.103799
Sousa, T., Soares, T., Pinson, P., Moret, F., Baroche, T., Sorin, E., et al. (2019). Peer-to-peer and community-based markets: a comprehensive review. Renew. Sustain. Energy Rev. 104, 367–378. doi: 10.1016/j.rser.2019.01.036
Tushar, W., Saha, T. K., Yuen, C., Smith, D., and Poor, H. V. (2020). Peer-to-peer trading in electricity networks: an overview. IEEE Trans. Smart Grid 99:2969657. doi: 10.1109/TSG.2020.2969657
Wei, L., Yi, C., and Yun, J. (2021). Energy drive and management of smart grids with high penetration of renewable sources of wind unit and solar panel. Int. J. Electr. Power Energy Syst. 1:106846. doi: 10.1016/j.ijepes.2021.106846
Weifeng, Z., Senjiong, H., and Da, X. (2021). Home energy management system based on power router. J. Power Supply 19, 86–92. doi: 10.13234/j.issn.2095-2805.2021.3.86
Xiao, L. (2023). Research on distribution network planning under the new power system. Low Carbon World 13, 142–144. doi: 10.16844/j.cnki.cn10-1007/tk.2023.12.011
Xiaofan, B., and Zhong, T. (2024). Energy interaction of integrated energy microgrid cluster and benefit analysis of multi-energy market construction. Modern Electr. 42, 1–13. doi: 10.13334/j.0258-8013.pcsee.202163
Xinyan, L., Junpeng, Z., and Yue, Y. (2023). Distributed resilience enhancement strategies for multi-microgrids in architecture. China Light Power 56, 87–99.
Yanchun, X., Haiquan, L., Sihan, S., et al. (2023). Double layer mixed integer programming for multi microgrid systems considering hybrid energy sharing stations. Chin. J. Elect. Eng. 43, 9136–9149.
Yang, F., Dengwang, L., Zhiquan, Z., et al. (2024). Comprehensive energy microgrid group cooperative operation strategy considering social welfare and microgrid differences. Modern Electric Power 1–14.
Zheng, Y., Sicheng, P., Qingfen, L., et al. (2018). A non-cooperative trading method of three-party market players for integrated energy parks. Power Syst. Automat. 42, 32–39. doi: 10.7500/AEPS20170915007
Keywords: electricity market, multi-microgrids, conditional value at risk, scenery absorption, energy routers
Citation: Lv X, Qi C, Ji X, Yv J, Wang H and Han H (2024) Bidding strategies for multi-microgrid markets taking into account risk indicators. Front. Smart Grids 3:1353732. doi: 10.3389/frsgr.2024.1353732
Received: 11 December 2023; Accepted: 25 March 2024;
Published: 25 April 2024.
Edited by:
Muhammad Babar Rasheed, University of Alcalá, SpainReviewed by:
Ehsan Naderi, Arkansas State University, United StatesCopyright © 2024 Lv, Qi, Ji, Yv, Wang and Han. This is an open-access article distributed under the terms of the Creative Commons Attribution License (CC BY). The use, distribution or reproduction in other forums is permitted, provided the original author(s) and the copyright owner(s) are credited and that the original publication in this journal is cited, in accordance with accepted academic practice. No use, distribution or reproduction is permitted which does not comply with these terms.
*Correspondence: Chenglong Qi, cWljaGVuZ2xvbmcxOTk3QDEyNi5jb20=
Disclaimer: All claims expressed in this article are solely those of the authors and do not necessarily represent those of their affiliated organizations, or those of the publisher, the editors and the reviewers. Any product that may be evaluated in this article or claim that may be made by its manufacturer is not guaranteed or endorsed by the publisher.
Research integrity at Frontiers
Learn more about the work of our research integrity team to safeguard the quality of each article we publish.