- 1University of Tunis, Ecole Nationale Supérieure d’ingénieurs de Tunis, Reseach Laboratory Signal, Image et Maitrise de l’Energie, Tunis, Tunisia
- 2Laboratory Youth-Physical Activity and Sports-Health (J-AP2S), Toulon University, Toulon, France
Introduction: Knee osteoarthritis (KOA) is a major health issue affecting millions worldwide. This study employs machine learning algorithms to analyze human gait using kinematic data, aiming to enhance the diagnosis and detection of KOA. By adopting this approach, we contribute to the development of an effective diagnostic methods for KOA, a prevalent joint condition.
Methods: The methodology is structured around several critical steps to optimize the model’s performance. These steps include extracting kinematic features from video data to capture essential gait dynamics, applying data filtering and reduction techniques to remove noise and enhance data quality, and calculating key gait parameters to boost the model’s predictive power. The machine learning model trains on these refined features, validates through cross-validation for robust performance assessment, and tests on unseen data to ensure generalizability.
Results: Our approach demonstrates significant improvements in classification accuracy, highlighting its potential for early and precise KOA detection. The model achieves a high classification accuracy, indicating its effectiveness in distinguishing KOA-related gait patterns.
Discussion: Furthermore, a comparative analysis with another model trained on the same dataset demonstrates the superiority of our method, suggesting that the proposed approach serves as a reliable tool for early KOA detection and potentially improves clinical diagnostic workflows.
1 Introduction
The integration of machine learning and biomechanics in recent years has created new opportunities for understanding and analyzing human movement (Geng et al., 2023). Among the various applications, human gait analysis and classification have emerged as significant research areas that impact rehabilitation, sports science, medical diagnostics, and security systems. An individual’s unique walking patterns reveal a multitude of information about their physical health, gait-related problems, and overall wellbeing (Elbaz et al., 2014; Rahi et al., 2023). Gait analysis has gained popularity as an effective tool for assessing the functional consequences of knee osteoarthritis (KOA) in daily life. KOA frequently affects knee joints, leading to pain, significant mobility challenges, and potential alterations in walking patterns.
To better understand these changes, kinematic and kinetic analyses of gait are crucial components of physical examinations, providing essential evidence of functional ability while evaluating disability. Comprehending normal gait is vital for interpreting abnormal findings, normative data from healthy individuals serve as a reference point when assessing abnormal or pathological gait parameters. The ability to walk significantly influences an individual’s quality of life and health status, underscoring how one’s health can affect gait kinematics (Li et al., 2022).
Technological advancements have revolutionized the field of gait analysis, enabling more precise and efficient methods for assessing human movement. Traditional gait analysis systems, however, often require complex setups that include PCs, wireless IMU sensors, and the expertise of trained professionals to operate sophisticated software. While these methods are accurate, they demand a well-equipped environment and considerable technical resources, limiting their accessibility for widespread use.
In contrast, our research focuses on a simplified approach to gait classification by utilizing a reduced set of parameters extracted from basic RGB videos (Balti et al., 2024). This innovative method significantly decreases the reliance on specialized hardware and expert manipulation, making gait analysis more accessible. With the rise of human pose extraction technologies, our approach facilitates the implementation of gait analysis in real-world scenarios, bridging the gap between advanced research and practical application.
2 Related work on markerless vision-based classification of knee osteoarthritis
Several researchers have been working on markerless systems and kinematics to diagnose human gait and identify diseases (Liang et al., 2022). For instance, Huang et al. (2024) aimed to compare kinematic and joint moment calculations of the lower limbs during gait using both a markerless motion system and a marker-based system. Sixteen healthy participants were enlisted, and their lower limb kinematics were recorded simultaneously at 120 Hz by both systems, while a force platform captured ground reaction forces at 1,200 Hz. The data were processed in visual3D for inverse dynamics analysis, revealing that the least variation in joint center position occurred at the ankle in the posterior and anterior directions, with a mean absolute deviation of 0.74 cm.
In a similar vein, the markerless motion capture system utilizes deep learning to estimate 3D human poses through a deep convolutional neural network (Cao et al., 2017). This network was trained on a dataset comprising over 120,000 images, each featuring 25 manually labeled joints, enabling accurate identification of human joints from 2D images. Furthermore, Pixmotion processes data from eight cameras to construct 3D skeletons by merging multi-view 2D pose information (Sun et al., 2019). Camera calibration via Direct Linear Transformation (DLT) allows for the precise mapping of 3D spatial coordinates onto the 2D image plane, facilitating accurate 3D scene reconstruction from 2D inputs.
Building upon these advancements, Liang et al. (2022) focused on quantifying kinematic gait in elderly individuals to assess their health. They introduced a 3D markerless pose estimation system based on OpenPose and 3DPoseNet algorithms, which effectively addresses the limitations of traditional optical sensor methods. In their study, thirty participants completed walking tasks, and sample entropy was employed to evaluate the dynamic irregularity of gait parameters.
Expanding the scope of markerless pose estimation, Hu et al. (2024) proposed a new framework utilizing smartphone monocular videos. This approach offers a simpler and more cost-effective alternative to traditional motion capture techniques, addressing the limitations often associated with single-view technology, such as low accuracy and reliability. The framework was tested with 15 healthy adults and 12 patients with musculoskeletal disorders, measuring gait spatiotemporal dynamics, knee angles, and center-of-mass velocity while comparing results to the VICON gold standard system.
Finally, the study by Dong et al. (2023) explores the application of quantum machine learning to enhance knee osteoarthritis classification. The authors introduce an improved hybrid quantum convolutional neural network (HQCNN) model, which was initially trained on a brain tumor MRI dataset. Utilizing a quantum classical transfer learning (QCTL) approach, they fine-tune the model and extract features based on previously trained weights. Testing the HQCNN structure on the knee osteoarthritis dataset (OAI), they achieved a classification accuracy of 98.36%.
3 The methodology adopted
3.1 Understanding gait kinematics in osteoarthritis assessment
Gait kinematics refers to the study of human walking patterns and movements, encompassing the detailed analysis of joint angles, segmental movements, and overall body posture during the gait cycle. As a specialized field within biomechanics, gait kinematics emphasizes the quantitative assessment of how individuals walk, providing critical insights into the mechanics of human locomotion. This analysis is particularly significant in understanding the impact of osteoarthritis on mobility and functional performance.
One of the key components of gait kinematics is joint angle measurement, which involves quantifying the angles at which various joints move during walking. In individuals with osteoarthritis, alterations in joint angles are commonly observed, especially in weight-bearing joints such as the knees and hips. These changes can indicate compensatory strategies that individuals adopt to manage pain and maintain mobility.
In addition to joint angles, various gait parameters can be analyzed, including stride length, step width, and walking speed. Osteoarthritis often leads to modifications in these parameters as individuals adjust their walking patterns to minimize discomfort. For instance, a person with osteoarthritis may shorten their stride or alter their step width to relieve pressure on affected joints. These adaptations are essential to monitor, as they can provide valuable information about the severity of the condition and the effectiveness of therapeutic interventions.
Joint loading patterns are another crucial aspect of gait analysis. This component examines how weight is distributed across joints during movement, revealing the potential for altered loading in individuals with osteoarthritis. For instance, affected individuals may unconsciously shift their weight away from the painful joint, leading to imbalances that can further exacerbate mobility issues. Analyzing these loading patterns can help healthcare professionals develop tailored rehabilitation strategies.
The assessment of asymmetry in gait is also vital, as osteoarthritis can lead to noticeable differences in movement between legs. For example, if one knee is more affected by osteoarthritis, the individual may exhibit a distinct asymmetry in their walking pattern, which can contribute to increased strain on other joints. Recognizing these asymmetries is essential for implementing effective treatment plans that address the underlying issues.
Temporal spatial parameters, which involve measuring time intervals and distances during walking, further enrich the understanding of gait kinematics. Changes in these parameters may occur as individuals with osteoarthritis adapt their movements to reduce pain. By analyzing these factors, clinicians can gain insight into how the disease affects mobility and identify appropriate interventions.
Moreover, pain assessment plays a crucial role in gait analysis. By combining objective gait measurements with self-reported pain levels, clinicians can develop a comprehensive understanding of how osteoarthritis influences an individual’s walking pattern. This multifaceted approach enhances the ability to address the patient’s needs effectively.
Longitudinal monitoring of gait kinematics is invaluable for tracking changes over time. This method allows for the assessment of osteoarthritis progression and the evaluation of the effectiveness of various interventions. By routinely measuring gait parameters, healthcare providers can make informed decisions regarding treatment adjustments.
Finally, gait kinematics offers objective assessment tools that provide quantifiable data on how osteoarthritis impacts mobility. This objective measurement can complement subjective evaluations, leading to better treatment planning and patient outcomes.
3.2 Database
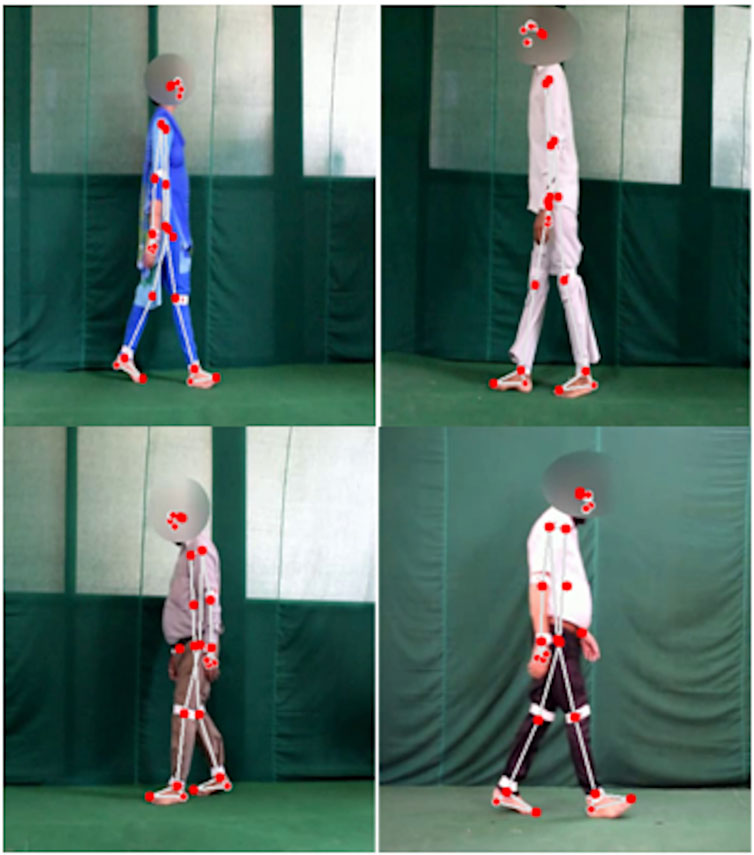
Several medical research laboratories have developed databases to facilitate research on conditions like knee osteoarthritis (KOA) and Parkinson’s disease (PD). One such dataset is the KOA-PD-NM (Kour et al., 2020), which we have utilized in our study (Figure 1). This dataset accounts for key variables such as age, gender, and disease severity, providing a robust foundation for analyzing both normal (NM) and abnormal (KOA, PD) subjects. Its unique contribution lies in enabling the comprehensive evaluation of not only lower body movements but also upper body dynamics, including arm movements and posture.
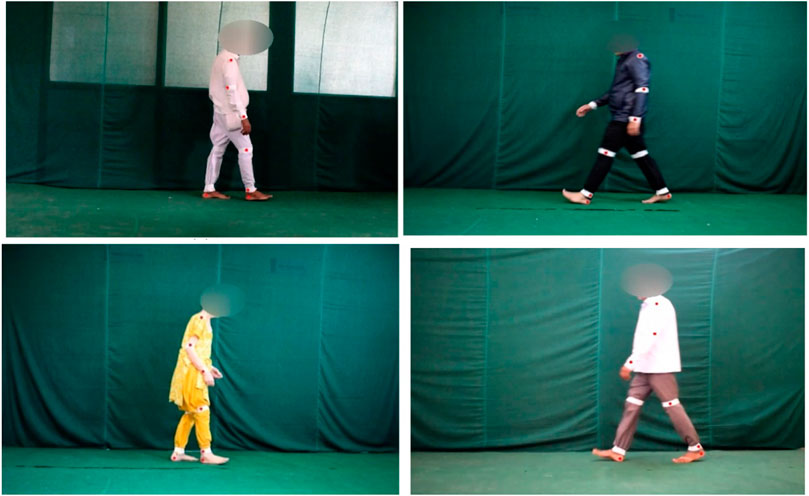
Figure 1. Examples of videos on knee osteoarthritis from Kour et al. (2020).
In our study, we leverage the KOA-PD-NM dataset to compare gait deviations between patients and healthy individuals. By doing so, we aim to enhance the understanding of disease progression and contribute to the development of more refined diagnostic techniques and strategies.
The KOA-PD-NM Gait Video Dataset (Kour et al., 2020) consists of 96 subjects: 50 with KOA, 16 with PD, and 30 NM subjects (Table 1). Each individual is represented by two sequences left-to-right and right-to-left captured in the frontal and sagittal planes. The dataset includes MOV format videos, recorded using a NIKON DSLR 5,300 camera positioned 8 m away from a walking mat in a clinical setting. While the original dataset involved the use of six red passive reflective markers on the body joints, our study takes a different approach by detecting gait abnormalities without relying on these markers, aiming for a more accessible and markerless diagnostic method.

Table 1. Database composition (Kour et al., 2020).
3.3 Gait analysis and human pose estimation technologies
Several advanced studies are available for assessing and quantifying gait patterns, providing a quantitative measure of ambulatory activity (Balti et al., 2022). These technologies facilitate gait analysis by extracting a variety of parameters, including kinematic, kinetic, electrical signal, and spatiotemporal variables, which contribute to a comprehensive understanding of gait characteristics (Salchow et al., 2022). For instance, some approaches utilize energy images for human gait analysis, while others employ a bottom-up pose estimation system that leverages a 3D markerless multimodal motion capture framework (Bakchy et al., 2022; Viswakumar et al., 2022).
In this study, we concentrate on classifying human gaits based on a streamlined set of parameters extracted from RGB videos. Recent advancements in technology have introduced several innovative libraries designed for human pose extraction and body joint estimation. After extensive research and experimentation, we selected MediaPipe (Kim et al., 2023), MediaPipe is a powerful python library that employs state-of-the-art machine learning techniques for precise body pose tracking. MediaPipe can extract 33 (3D) landmarks through a bottom-up approach, effectively capturing the critical joints and points along the body. The Figure 2 illustrate the extracted body landmarks, showcasing their importance in accurately analyzing and classifying gait patterns.
3.4 Workflow description
The methodology begins with the collection of a video dataset that includes several categories: NM (normal), KOA_EL (early-stage knee osteoarthritis), KOA_MD (mid-stage), and KOA_SV (severe-stage). From these videos, key kinematic features such as joint angles and distances are extracted to analyze the motion of joints and body segments during gait. The data is then cleaned through filtering and reduction processes to ensure accuracy and relevance. Afterward, the numerical dataset is split into two portions, one for training and validation and the other for testing. The machine learning model is trained and optimized using the training set, while the test set is employed to evaluate its performance. Finally, the model’s accuracy is calculated, determining how effectively it can classify different KOA stages based on the gait data. This structured approach enables a reliable and comprehensive system for KOA classification (Figure 3).
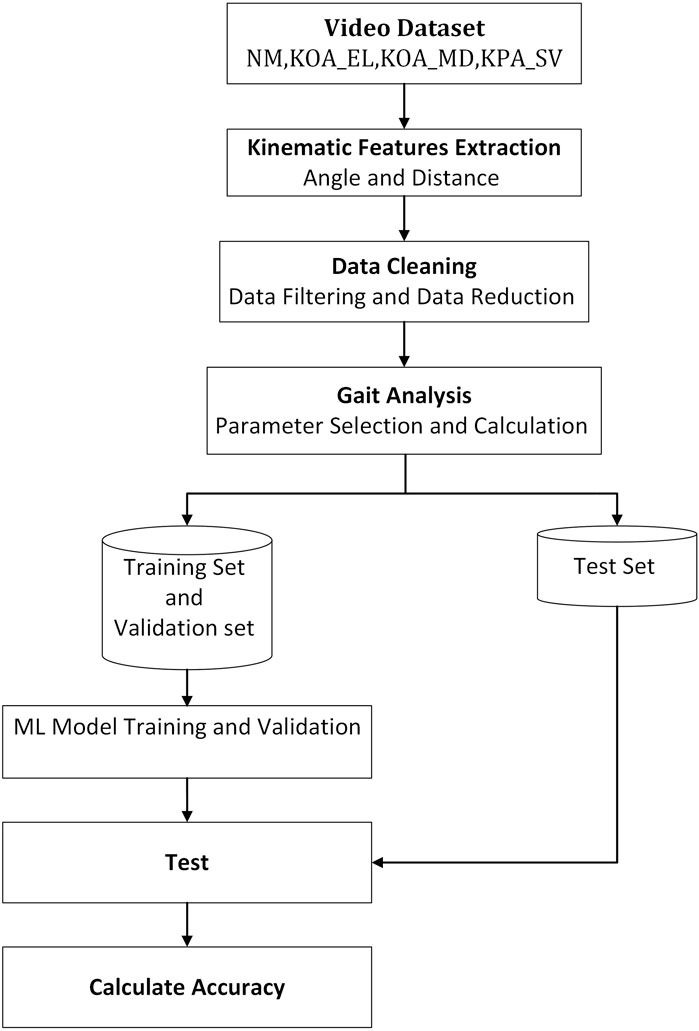
Figure 3. Comprehensive flowchart of the kinematic gait classification methodology using machine learning techniques.
4 Measurements and analyses
4.1 Gait kinematics feature selection
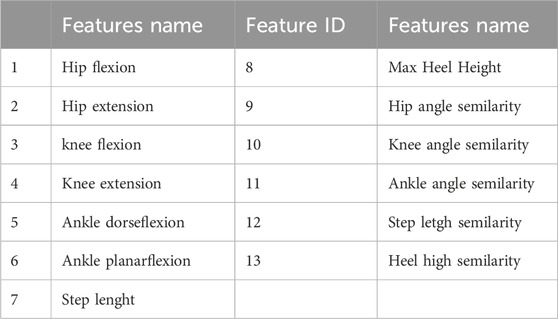
Throughout each phase of the gait cycle, various kinematic parameters are used to represent and analyze human walking patterns (Rodrigues et al., 2020). Machine learning techniques are applied to process and analyze the data, offering a precise method for assessing human gait. The specific kinematic features selected for this project are detailed in Table 2.
Below is a full explanation of the calculations and key parameters, accompanied by illustrative figures that depict the precise positioning of angles, heel and steps. These visualisations include example curves that effectively demonstrate the dynamic patterns of gait, providing a deeper insight into the biomechanical characteristics essential to the analysis.
4.1.1 Angle calculation
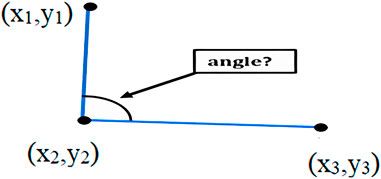
To measure the angle (Equation 1), we used a function that calculates the angle between three reference points and computes the angle between two lines. The first point is considered the starting point of the first line, the second point is regarded as the endpoint of the first line and the starting point of the second line, and the third point is considered the endpoint of the second line (Figure 4).
Where (x2, y2) represents the vertex of the angle, (x1, y1) and (x3, y3) represent the other two points defining the vectors:
The final angle is determined by averaging the values of both the flexion and extension angles over a specific number of gait cycles, ensuring that the resulting angle is an aggregate measurement.
The angle is the mean value of the N measurement angle flexion and extension
4.1.2 Knee angle
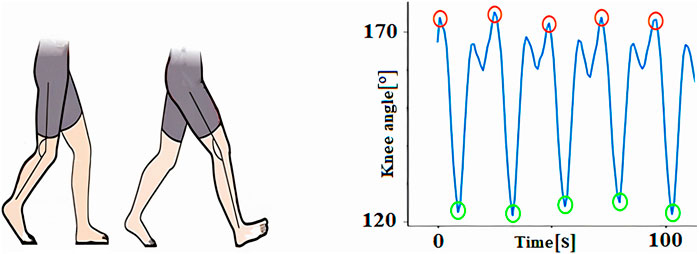
The knee angle is defined as the angle formed between the femur and the tibia, serving as a critical parameter for assessing joint movement during gait. In this study, we focus on two key knee angles: the maximum flexion angle, which corresponds to the degree of bending at the knee and is represented by the lowest point on the graph, and the maximum extension angle, which reflects the straightening of the knee and is denoted by the graph’s highest point. These two angles provide valuable insight into the range of motion and functional capacity of the knee, particularly in conditions like osteoarthritis where joint movement is compromised (Figure 5).
4.1.3 Hip angle
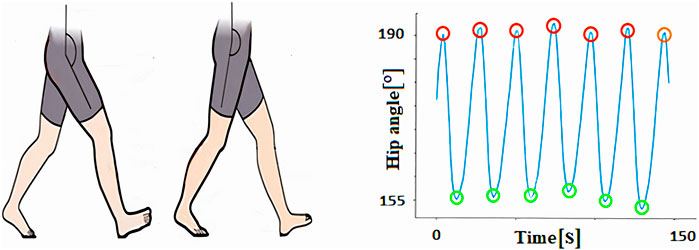
The hip angle is defined as the angle between the thigh and the vertical axis, providing a crucial measure of hip joint movement during gait. For this analysis, we concentrated on two key angles: maximum flexion, which represents the degree of hip bending and is indicated by the minimum value on the graph, and maximum extension, which reflects the straightening of the hip joint and is marked by the highest point on the graph. These parameters offer important insights into hip mobility, particularly relevant for detecting abnormalities in gait patterns caused by conditions such as osteoarthritis (Figure 6).
4.1.4 Ankle flexion and planar flexion angle measurements
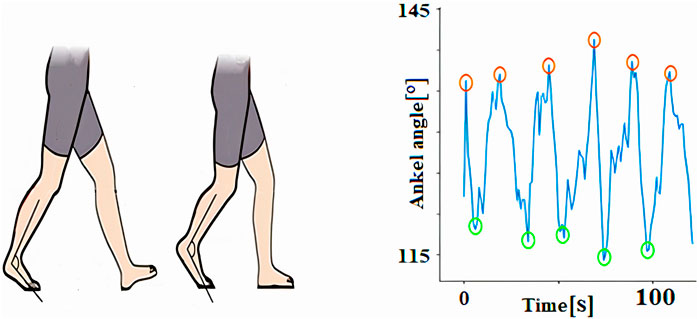
Ankle dorsiflexion and plantar flexion are key movements at the ankle joint, essential for various activities like walking, running, and jumping. Dorsiflexion involves pulling the toes upward toward the shin, while plantar flexion refers to pointing the toes downward. These movements play a vital role in gait dynamics, enabling proper foot clearance and propulsion during the gait cycle (Figure 7).
The typical range of motion for ankle dorsiflexion is approximately 10–20°, while plantar flexion usually falls within 30–50°. However, these ranges can vary significantly based on factors such as age, genetics and individual anatomy. Reduced range of motion in either direction may indicate underlying musculoskeletal issues, such as stiffness or weakness, often seen in conditions like osteoarthritis or after injury. Understanding these movements and their variability is crucial for assessing gait abnormalities and developing targeted therapeutic interventions.
4.1.5 Step length
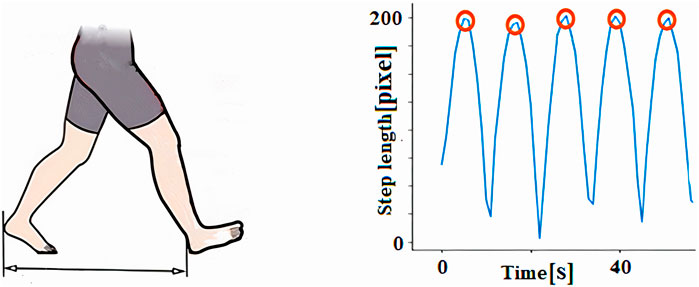
The step length (Equation 3) was quantified along the horizontal axis of the walking track by measuring the distance from the right heel to the left heel when both feet were in contact with the ground (Figure 8).
The step length exhibited by the maximum value in the graph was calculated by the average of the number of reputations. The mean value of N is the step length X.
Where:
4.1.6 Measurement of heel height
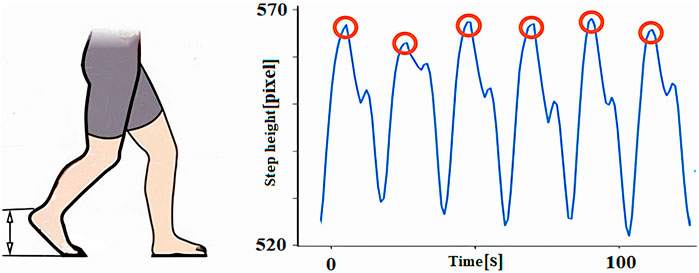
The step height parameter refers to the maximum elevation of the foot relative to the ground during walking (Figure 9). This height is computed as the difference between the maximum Ymax and minimum Ymin coordinates during a complete gait cycle (Equation 6):
Where:
4.2 Gait symmetry
Gait symmetry refers to the degree of similarity between the movements of the left and right limbs during activities like walking or running. It is a critical measure in biomechanics, as it quantifies how closely the movement patterns of one side of the body mirror those of the opposite side. This concept is particularly important for assessing balance and coordination, as well as identifying potential movement impairments.
To assess gait symmetry, various kinematic parameters such as joint angles, range of motion, and timing of limb movements are analyzed. Discrepancies in these parameters between the left and right sides can reveal underlying imbalances or irregularities. For example, asymmetry in joint angles or step length may indicate musculoskeletal disorders, neurological conditions, or compensatory patterns due to pain or injury. Accurate measurement of gait symmetry helps clinicians and researchers identify movement inefficiencies, diagnose conditions, and tailor rehabilitation programs to restore normal and balanced gait patterns.
The assessment of gait symmetry involves the utilization of various comparative techniques. In our study, we chose to use Pearson correlation coefficient noted “r” (Equation 8).
The Pearson correlation coefficient is often denoted as r and is widely used in statistics and data analysis to explore relationships between variables.
The Pearson correlation coefficient ranges from −1 to 1. 1 indicates that two random variables are perfectly positively correlated, −1 indicates that two random variables are perfectly negatively correlated, and 0 indicates that two random variables are not correlated.
The formula for calculating the Pearson correlation coefficient between two variables, X and Y, with n data points is as follows:
Where:
Figure 10 illustrates the correlation between the left and right knee angles of a normal individual and a person diagnosed with knee osteoarthritis (KOA). The blue points represent the Pearson correlation coefficients for the normal group (NM), indicating a healthy and symmetrical movement pattern. In contrast, the red points represent the Pearson correlation coefficients for the KOA_SV group, which corresponds to individuals in the severe stage of knee osteoarthritis. This visual comparison highlights the differences in knee angle relationships between the two groups, emphasizing how the severity of osteoarthritis impacts gait symmetry and joint function.
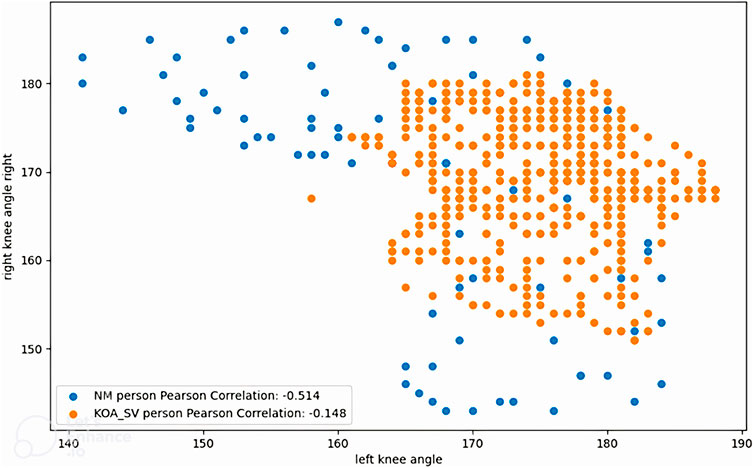
Figure 10. Correlations of left and right knee angles between a normal person and a person with knee osteoarthritis.
5 Results and discussion
5.1 Results of the classification of normal with knee osteoarthritis gait pattern
We conducted our experiments utilizing the gait dataset to analyze the severity of knee osteoarthritis and Parkinson’s disease (Bishop et al., 2016). This comprehensive dataset encompasses gait data from both healthy individuals and those diagnosed with knee osteoarthritis (KOA), providing a valuable resource for our analysis.
For our study, we specifically focused on a subset of the dataset that included 30 video recordings from normal, healthy subjects. Each subject was recorded performing two sequences of gait, one from left to right and the other from right to left, all captured in the frontal and the sagittal plane. In addition, the dataset features 50 video files that document various stages of knee osteoarthritis, categorized into three distinct severity levels: early, moderate and severe. This structured approach allows for a nuanced understanding of how gait is affected across different stages of KOA.
To classify human gait patterns effectively, we employed three different machine learning algorithms: logistic regression, random forest (RF), and support vector machine (SVM). The primary aim of this classification was to differentiate between healthy individuals and those with varying grades of knee osteoarthritis based on their gait characteristics.
Following the training of our models, the dataset was divided into training and validation sets, with 20% reserved for testing the algorithms’ performance. To enhance the robustness of our findings, we utilized cross-validation techniques alongside the scikit-learn library for our analysis. The results of this evaluation, including performance metrics for each model, are summarized in Table 3, offering insights into the efficacy of each classification approach in distinguishing between the two groups.

Table 3. Precision and sensibility result in classification of knee osteorathritis and normal subjects using logistic regression, Random Forest and SVM.
Following a comprehensive analysis of the training process using this limited dataset, we found that the random forest model exhibited a remarkable accuracy of 96.9%, significantly outperforming the other algorithms. In contrast, the logistic regression model achieved an accuracy of 94%, while the support vector machine (SVM) model lagged behind at 88%.
These results highlight the random forest model’s robustness and effectiveness in classifying gait patterns associated with knee osteoarthritis. However, there is a clear opportunity for improvement with the other models. By expanding the dataset to include a greater variety of samples and potentially more diverse gait patterns, we anticipate that both the logistic regression and SVM models will demonstrate enhanced performance. This expansion could lead to more reliable classifications and a better understanding of the subtle gait variations present in individuals with varying degrees of knee osteoarthritis.
5.2 Comparison of SVM and random forest model performance
Figure 11 highlights the performance of the SVM model through its learning curve, validation curve, and confusion matrix. The learning curve indicates a steady increase in accuracy as training progresses, ultimately exceeding 85%. This suggests that the model’s performance could further improve with additional training data. The validation curve shows optimal performance at a C value of 10^1, striking a balance between underfitting and overfitting, with accuracy peaking around 90%. The confusion matrix reveals the model’s high accuracy in predicting healthy individuals, with only 1 misclassification. However, it struggles slightly with predicting unhealthy cases, incorrectly classifying 3 out of 12 as healthy. This indicates room for refinement in handling complex cases.
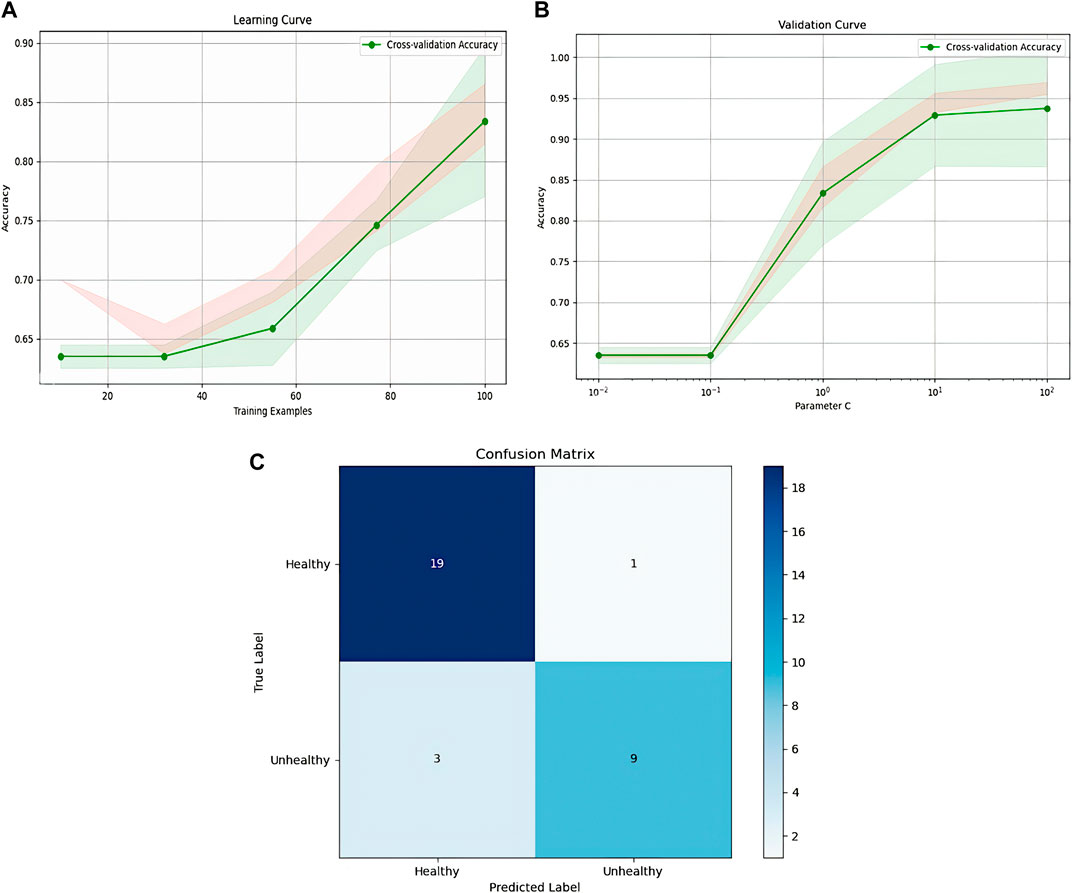
Figure 11. Representation of SVM model, (A): SVM learning, (B): validation curve, (C): confusion matrix.
Figure 12 illustrates the learning curve, validation curve, and confusion matrix for the Random Forest classifier. The learning curve demonstrates a consistent improvement in accuracy as the training set size increases, stabilizing at 94% after reaching 80 training examples. The validation curve reveals that accuracy initially improves as the regularization parameter C increases, but after a certain threshold, further increases cause a decline in performance. The optimal C value is around 10^−1. The confusion matrix showcases the model’s effectiveness, with only 2 false negatives and no false positives, highlighting its strong capacity to distinguish between healthy and unhealthy individuals. This shows robust classification, though additional fine-tuning could potentially improve its performance even further.
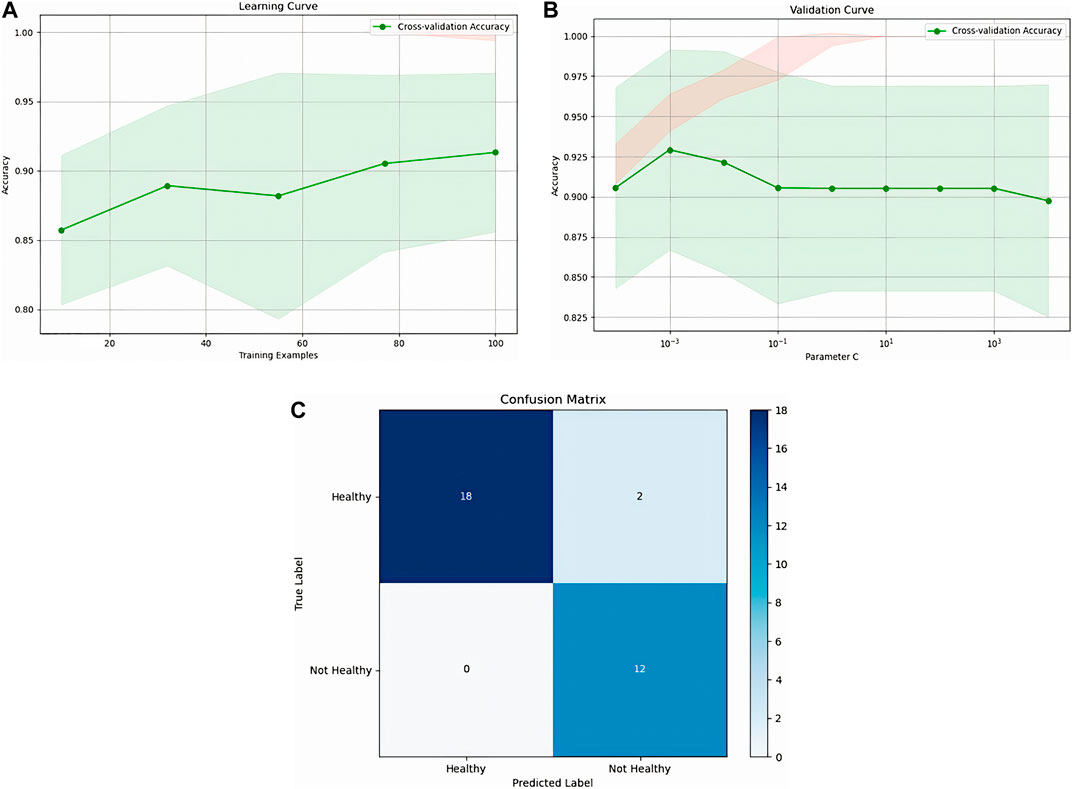
Figure 12. Representation of Random Forest, (A): Random forest learning, (B): validation curve, (C): confusion matrix.
Figure 13 presents the performance of the Random Forest model via its learning curve, validation curve, and confusion matrix. The learning curve shows that accuracy steadily improves, stabilizing after 60 training examples and reaching 86%. The validation curve demonstrates that high accuracy is achieved quickly with a small number of estimators (trees), leveling off around 20 estimators, with diminishing returns beyond that point. The confusion matrix confirms the model’s strong performance, with 19 true negatives, 12 true positives, 1 false positive, and no false negatives. This indicates a highly accurate model with only one misclassification, emphasizing its robustness in both identifying healthy and unhealthy cases.
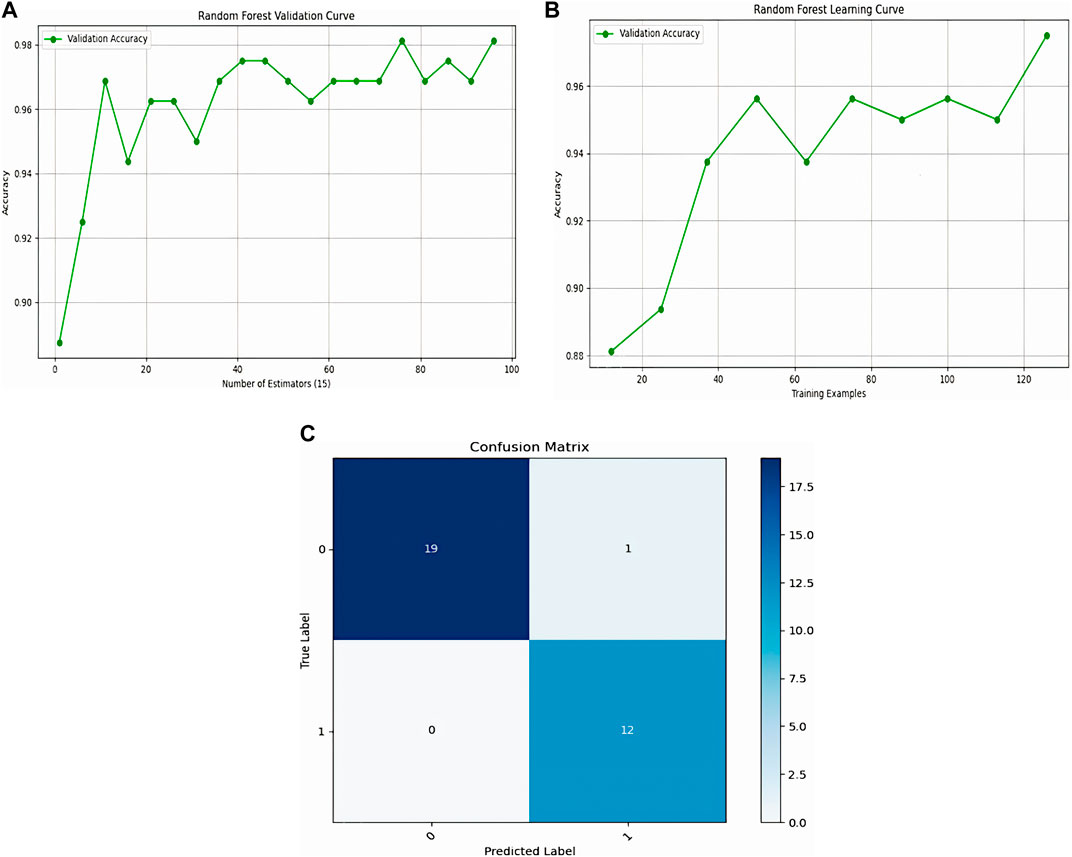
Figure 13. Representation of Logistic Regression, (A): Logistic Regression learning, (B): validation curve, (C): confusion matrix.
The Random Forest model likely outperformed both Logistic Regression and SVM due to its ability to capture non-linear relationships and complex interactions between features. This capability allows it to excel even with smaller datasets by generating diverse models that generalize better. In contrast, Logistic Regression and SVM are more prone to overfitting or failing to recognize complex patterns without sufficient data. The Random Forest’s inherent capacity to handle feature complexity and variability makes it a more reliable choice in this scenario.
5.3 Results of the classification of normal people with KOA of different severity levels
In this experiment, the primary objective was to classify individuals based on the severity of knee osteoarthritis (KOA), with a focus on evaluating the performance of two distinct classification methods: Support Vector Machine (SVMs) and Logistic Regression. The aim was to determine how effectively these models could differentiate between varying levels of KOA severity. A comprehensive comparison (Table 4) was conducted by analyzing key performance metrics, including accuracy, precision, and recall. By assessing these metrics, we sought to gauge the models’ ability not only to correctly categorize individuals but also to minimize false positives and false negatives, thus providing a more precise evaluation of their reliability in identifying KOA severity stages. This comparison is essential for identifying the most suitable model for clinical applications, where accurate classification is critical for effective diagnosis and treatment planning.

Table 4. Accuracy and precision of classifying knee osteoarthritis severity using SVM and logistic regression.
However, the accuracy achieved in this experiment may not be sufficient. One limitation is the relatively small dataset used likely contributed to overfitting, The limited sample size likely contributed to the reduced performance of both classification methods.
5.4 Comparative analysis
We conducted a comprehensive comparison between the proposed knee osteoarthritis (KOA) and normal gait pattern classification methodology and the state-of-art methodologies, with a primary focus on the accuracy parameter. Table 5 provides a detailed comparison of the accuracy between our proposed method and other leading techniques for knee osteoarthritis (KOA) classification. Yang et al. (2020) introduced a sensor-based approach using Support Vector Machine (SVM), which achieved an accuracy of 92.8%. However, their method is reliant on a complex hardware setup, including a PC and wireless IMU sensors, and requires expert handling for software operation, making it suitable only for highly equipped laboratories. Kour et al. (2020) employed a vision-based method with marker points and K-Nearest Neighbors (KNN), achieving a higher accuracy of 95.16%. Nonetheless, their approach necessitates a controlled lab environment and requires considerable space and time to accurately capture data, limiting its practicality in real-world settings. In contrast, our proposed method, which is both markerless and vision-based, utilizes a Random Forest classifier and achieves an accuracy of 96.9%. This approach not only surpasses the accuracy of previous methods but also offers the advantage of being non-invasive and more adaptable to diverse environments. However, further improvements in performance can be achieved with access to larger datasets for training and refinement.
6 Conclusion
Gait classification in patients with knee osteoarthritis (KOA) is a critical area of research with the potential to improve diagnosis, treatment and management. Analyzing gait patterns provides valuable insights into the biomechanical changes associated with KOA, enabling more personalized and effective interventions. However, gait classification in KOA remains complex, with ongoing advancements in classification systems and technologies aimed at better understanding the impact of KOA on gait. Personalized treatment approaches based on gait classification are also emerging, offering more targeted interventions.
While this study presents an effective method for KOA classification, several limitations must be acknowledged. The relatively small dataset impacts both the accuracy and generalizability of the machine learning model. Expanding the dataset with more diverse samples is crucial for improving the model’s robustness. Additionally, relying solely on RGB videos for gait analysis limits the data scope compared to more advanced systems that incorporate sensors like IMUs. Future research could benefit from integrating multi-modal data to enhance the precision of KOA classification, and clinical validation is necessary to ensure real-world applicability.
In conclusion, this research demonstrates the potential of markerless vision-based gait classification for KOA assessment using machine learning. By analyzing gait patterns, the method provides valuable insights that aid in diagnosis, treatment planning, and rehabilitation. However, future work should focus on expanding the dataset, exploring additional features, and refining the algorithm to improve accuracy and clinical relevance. Despite these limitations, this approach shows promise as a non-invasive, scalable tool for KOA assessment, with the potential to improve personalized care for patients.
Data availability statement
The original contributions presented in the study are included in the article/supplementary material, further inquiries can be directed to the corresponding author.
Author contributions
SB: Conceptualization, Data curation, Formal Analysis, Investigation, Methodology, Resources, Software, Supervision, Validation, Visualization, Writing–original draft, Writing–review and editing. AB: Conceptualization, Data curation, Formal Analysis, Investigation, Methodology, Resources, Software, Supervision, Validation, Visualization, Writing–original draft, Writing–review and editing. SA: Conceptualization, Data curation, Formal Analysis, Investigation, Methodology, Resources, Software, Supervision, Validation, Visualization, Writing–review and editing. MB: Conceptualization, Data curation, Formal Analysis, Investigation, Resources, Software, Supervision, Validation, Visualization, Writing–review and editing. MS: Conceptualization, Data curation, Formal Analysis, Investigation, Resources, Supervision, Validation, Visualization, Writing–review and editing.
Funding
The author(s) declare that no financial support was received for the research, authorship, and/or publication of this article.
Conflict of interest
The authors declare that the research was conducted in the absence of any commercial or financial relationships that could be construed as a potential conflict of interest.
Publisher’s note
All claims expressed in this article are solely those of the authors and do not necessarily represent those of their affiliated organizations, or those of the publisher, the editors and the reviewers. Any product that may be evaluated in this article, or claim that may be made by its manufacturer, is not guaranteed or endorsed by the publisher.
References
Bakchy, S. C., Islam, M. R., Mahmud, M. R., and Imran, F. (2022). Human gait analysis using gait energy image. arXiv preprint arXiv:2203.09549.
Balti, A., Hamdi, A., Abid, S., Ben Khelifa, M. M., and Sayadi, M. (2024). Enhanced fingerprint classification through modified PCA with SVD and invariant moments. Front. Artif. Intell. 7, 1433494. doi:10.3389/frai.2024.1433494
Balti, A., Khelifa, M. M. B., Hassine, S. B., Ouazaa, H. A., Abid, S., Lakhoua, M. N., et al. (2022). “Gait analysis and detection of human pose diseases,” in 2022 8th International Conference on Control, Decision and Information Technologies (CoDIT), Istanbul, Turkey, 17-20 May 2022 (IEEE), 1381–1386.
Bishop, C., Read, P., Chavda, S., and Turner, A. (2016). Asymmetries of the lower limb: the calculation conundrum in strength training and conditioning. Strength and Cond. J. 38 (6), 27–32. doi:10.1519/ssc.0000000000000264
Cao, Z., Simon, T., Wei, S.-E., and Sheikh, Y. (2017). “Realtime multi-person 2d pose estimation using part affinity fields,” in Proceedings of the IEEE conference on computer vision and pattern recognition, Honolulu, HI, USA, July 21 2017 to July 26 2017 (IEEE), 7291–7299.
Dong, Y., Che, X., Fu, Y., Liu, H., Zhang, Y., and Tu, Y. (2023). Classification of knee osteoarthritis based on quantum-toclassical transfer learning. Front. Phys. 11, 1212373. doi:10.3389/fphy.2023.1212373
Elbaz, A., Mor, A., Segal, G., Aloni, Y., Teo, Y. H., Teo, Y. S., et al. (2014). Patients with knee osteoarthritis demonstrate improved gait pattern and reduced pain following a non-invasive biomechanical therapy: a prospective multi-centre study on Singaporean population. J. Orthop. Surg. Res. 9, 1. doi:10.1186/1749-799x-9-1
Geng, R., Li, J., Yu, C., Zhang, C., Chen, F., Chen, J., et al. (2023). Knee osteoarthritis: current status and research progress in treatment (Review). Exp. Ther. Med. 26 (4), 481. doi:10.3892/etm.2023.12180
Hu, R., Diao, Y., Wang, Y., Li, G., He, R., Ning, Y., et al. (2024). Effective evaluation of HGcnMLP method for markerless 3D pose estimation of musculoskeletal diseases patients based on smartphone monocular video. Front. Bioeng. Biotechnol. 11, 1335251. doi:10.3389/fbioe.2023.1335251
Huang, T., Ruan, M., Huang, S., Fan, L., and Wu, X. (2024). Comparison of kinematics and joint moments calculations for lower limbs during gait using markerless and marker-based motion capture. Front. Bioeng. Biotechnol. 12, 1280363. doi:10.3389/fbioe.2024.1280363
Kim, J. W., Choi, J. Y., Ha, E. J., and Choi, J. H. (2023). Human pose estimation using mediapipe pose and optimization method based on a humanoid model. Appl. Sci. 13 (4), 2700. doi:10.3390/app13042700
Kour, N., Gupta, S., and Arora, S. (2020). Gait dataset for knee osteoarthritis and Parkinson’s disease analysis with severity levels. [Online]. Available at: https://zenodo.org/records/3369237
Li, H., Hu, S., Zhao, R., Zhang, Y., Huang, L., Shi, J., et al. (2022). Gait analysis of bilateral knee osteoarthritis and its correlation with Western Ontario and McMaster University Osteoarthritis Index assessment. Medicina 58 (10), 1419. doi:10.3390/medicina58101419
Liang, S., Zhang, Y., Diao, Y., Li, G., and Zhao, G. (2022). The reliability and validity of gait analysis system using 3D markerless pose estimation algorithms. Front. Bioeng. Biotechnol. 10, 857975. doi:10.3389/fbioe.2022.857975
Rahi, B., Li, M., and Qi, M. (2023). A review of techniques on gait-based person re-identification. Int. J. Netw. Dyn. Intell. 2, 66–92. doi:10.53941/ijndi0201005
Rodrigues, T. B., Salgado, D. P., Catháin, C. Ó., O’Connor, N., and Murray, N. (2020). Human gait assessment using a 3D marker-less multimodal motion capture system. Multimedia Tools Appl. 79, 2629–2651. doi:10.1007/s11042-019-08275-9
Salchow, H. C., Skrobot, M., Jochner, M. C., Schauer, T., Kühn, A. A., and Wenger, N. (2022). Review-emerging portable technologies for gait analysis in neurological disorders. Front. Hum. Neurosci. 16, 768575. doi:10.3389/fnhum.2022.768575
Sun, K., Xiao, B., Liu, D., and andWang, J. (2019). “Deep high-resolution representation learning for human pose estimation,” in Proceedings of the IEEE/CVF conference on computer vision and pattern recognition, Long Beach, CA, USA, 15-20 June 2019 (IEEE), 5693–5703.
Viswakumar, A., Rajagopalan, V., Ray, T., Gottipati, P., and Parimi, C. (2022). Development of a robust, simple, and affordable human gait analysis system using bottom-up pose estimation with a smartphone camera. Front. Physiology 12, 784865. doi:10.3389/fphys.2021.784865
Keywords: knee osteoarthritis (KOA), gait analysis, machine learning, markerless motion capture, remote diagnostics, kinematic data, human pose estimation, telemedicine
Citation: Ben Hassine S, Balti A, Abid S, Ben Khelifa MM and Sayadi M (2024) Markerless vision-based knee osteoarthritis classification using machine learning and gait videos. Front. Sig. Proc. 4:1479244. doi: 10.3389/frsip.2024.1479244
Received: 11 August 2024; Accepted: 31 October 2024;
Published: 21 November 2024.
Edited by:
Mohammad Zavid Parvez, Torrens University Australia, AustraliaReviewed by:
Ahashan Habib Niloy, University of Kentucky, United StatesJia Uddin, Woosong University, Republic of Korea
Copyright © 2024 Ben Hassine, Balti, Abid, Ben Khelifa and Sayadi. This is an open-access article distributed under the terms of the Creative Commons Attribution License (CC BY). The use, distribution or reproduction in other forums is permitted, provided the original author(s) and the copyright owner(s) are credited and that the original publication in this journal is cited, in accordance with accepted academic practice. No use, distribution or reproduction is permitted which does not comply with these terms.
*Correspondence: Ala Balti, YWxhYS5iYWx0aUBlbmljYXIudWNhci50bg==
 Slim Ben Hassine
 Ala Balti
 Sabeur Abid1