1 Introduction
A binaural room impulse response (BRIR) describes the characteristics of acoustic wave interactions from a sound source in a room to the torso, head, and ears of a listener. The use of BRIRs has been ubiquitous in many audio applications. For example, in spatial audio reproduction with headphones, BRIRs are used as audio filters to simulate or reproduce an immersive and perceptually plausible sounding environment; in loudspeaker-based applications, the frequency-domain counterparts of BRIRs are equivalent to the acoustic transfer functions between the loudspeakers and the listener’s ears, based on which audio filters are designed for tasks such as crosstalk cancellation (Cooper and Bauck, 1989; Gardner, 1998; Choueiri, 2018), room correction/loudspeaker equalization (Karjalainen et al., 1999; Lindfors et al., 2022), and personal sound zones (Druyvesteyn and Garas, 1997; Betlehem et al., 2015; Qiao and Choueiri, 2023a). In addition to audio reproduction and rendering, BRIRs have also played an important role in other audio-related tasks, such as sound source localization (Shinn-Cunningham et al., 2005), sound source separation (Yu et al., 2016), and audio-visual learning (Younes et al., 2023).
As implied by its name, a BRIR is dependent on both the listener’s anthropometric features (e.g., ear size and shape) and the room’s geometry and acoustic properties. Due to the complex acoustic interactions, such as sound reflections in the room and scattering off the listener, a BRIR varies with both the listener’s position and orientation in the room. This is unlike room impulse response (RIR), which only depends on the position, or anechoic head-related impulse response (HRIR) which, in the far-field case, only depends on the orientation. Although there have been multiple HRIR and RIR datasets (Sridhar et al., 2017; Brinkmann et al., 2019; Koyama et al., 2021) available, and while it is possible to synthesize BRIRs from HRIRs and RIRs using methods such as the image source model (Wendt et al., 2014), synthesized BRIRs lose physical accuracy and can only maintain perceptual plausibility. While this is sufficient for some applications, such as headphone-based auralization, it is not appropriate for others, such as crosstalk cancellation and personal sound zones, where measured BRIRs are required. Moreover, the lack of a high-resolution BRIR dataset, compared to existing ones measured at sparse listener positions and orientations (Jeub et al., 2009; Kayser et al., 2009; Erbes et al., 2015), limits the study of BRIR modeling and interpolation at high frequencies and the development of machine learning-based audio applications.
In this paper, we introduce a dataset that contains BRIRs measured in an acoustically treated listening room using multiple loudspeakers and at high-resolution translational and rotational head coordinates. Although the dataset is only measured in one specific room, it is expected that it will be useful for a wide range of applications as it faithfully captures the spatial dependency of BRIRs on listener positions and orientations. For example, it can be directly applied to studies of BRIR modeling and to interpolation and applications that require multi-loudspeaker BRIRs, such as crosstalk cancellation and personal sound zones. It has been shown (Qiao and Choueiri, 2023b) that the spatial sampling resolution of the dataset is adequate for rendering personal sound zones with continuous listener movements within a certain frequency range. With proper interpolation between the measured BRIRs, the dataset can also be used to simulate binaural audio for headphone-based auralization with continuous listener movements. In addition, the dataset can be used for either data augmentation or performance evaluation in a wide range of machine learning-based tasks that require binaural audio with listener movements in multiple degrees of freedom.
2 Methods
2.1 Data collection
We measured BRIRs in an irregularly shaped listening room of a near-shoebox shape (see Figure 1 for the exact dimensions). The room had a RT60 of 0.24 s averaged in the range of 1,300 and 6,300 Hz. Its floor was covered with carpet, and the walls and ceiling were partially covered with acoustic panels. Figure 1 also shows the setup and dimensions of the measurement system. A linear array of eight loudspeakers was used as a sound source; each was a Focal Shape 40 4-inch Flax woofer. The loudspeaker array layout was initially intended for sound field control applications, such as rendering personal sound zones. A Brüel & Kjær Head and Torso Simulator (HATS, Type 4,100) was used as the mannequin listener, with its built-in microphones replaced with a pair of in-ear binaural microphones (Theoretica Applied Physics BACCH-BM Pro). The microphones were calibrated and free-field equalized before the measurement. A custom-made, computer-controlled mechanical translation platform was applied to enable translational movements, and a turntable (Outline ET250-3D) was mounted on top of the platform for rotational movements in the azimuth.
FIGURE 1

Illustrations of the measurement system (A). Photograph of the measurement system. Note that the tweeter loudspeaker arrays in the photograph were not used in the data collection (B). Schematic representation of the listening room. Left: side view. Right: top view (C). Schematic diagram of the measurement system (D). Dimensions of the loudspeaker array.
The BRIR measurement grid has a range of [0.5, 1.0] m in the y direction (front/back) and [-0.5, 0.5] m in the x direction (left/right), with a 0.05-m spacing between adjacent grid points. The distances are relative to the center of the loudspeaker array. At each grid point, the BRIRs were measured at 37 different azimuth angles from the listener facing left to facing right, with a 5° spacing between adjacent angles. In total, there were 68376 (=11 y-translations × 21 x-translations × 37 azimuthal rotations × 8 loudspeakers) BRIRs measured.
We measured BRIRs by playing back exponential sine sweep (ESS) signals from the loudspeakers and recording the signals received with binaural microphones. Each sine sweep signal had a length of 500 ms at a 48 kHz sampling rate and was generated using the synchronized ESS method (Novak et al., 2015), with a start frequency of 100 Hz and an end frequency of 24 kHz. Synchronized ESS is a variant of the traditional ESS method (Farina, 2000), with the advantage of correctly estimating higher harmonic frequency responses. All eight loudspeakers were triggered in series with no overlapping between the ESS signals.
The entire data collection process was split into multiple measurement sessions. For each session, we manually fixed the distance from the listener to the array in the y direction and automated the movements in the x direction and the azimuthal rotations. The measurement automation, signal generation, and data collection were implemented in Cycling ’74 Max 8. The BRIR post-processing was performed in MATLAB. Each session lasted for approximately 2 h, and the entire data collection process took 9 days.
2.2 Data processing
The BRIRs were obtained by first deconvolving the recorded signals with the ESS signal in the frequency domain, with 32768-length FFT at a 48 kHz sampling rate. A fourth-order highpass Butterworth filter with a cutoff frequency of 100 Hz was then applied to the deconvolved signals to remove the low-frequency noise present during the measurement. Finally, the deconvolved signals were truncated to the first 16,384 samples (corresponding to 341.3 ms) and globally normalized. No loudspeaker equalization was applied to the BRIRs as loudspeaker-specific information, such as directivity, is an integral part of the BRIR and was therefore difficult to compensate for. The processed BRIRs, together with the corresponding listener position and orientation coordinates, were saved as separate files corresponding to different y translations in the SOFA (spatially oriented format for acoustics, AES69-2022 (2022)) format, following the AES69-2022 (SOFA 2.1) standard. The dataset was generated using SOFA Toolbox for MATLAB/Octave version 2.2.0.
3 Data visualization
We examine the dataset by visualizing 1) the time index of the BRIR onset, 2) the peak amplitude of the BRIR, and 3) the interaural time difference (ITD) of the BRIR as functions of the listener position. Both the onset and the ITD of the BRIRs were calculated in a thresholding approach (see Katz and Noisternig (2014) as an example). Figure 2 shows the onset, peak amplitude, and ITD of the BRIRs measured at the fourth loudspeaker (counting from the left) and with the listener facing forward. The colors in the figures were interpolated using the “interp” option of the MATLAB “pcolor” function. All three figures show clear spatial dependency on the listener’s position, with the onset increasing and the peak amplitude decreasing as the listener moved away from the loudspeaker. The ITD was nearly zero when the listener was on-axis with the loudspeaker and increased as the listener moved to off-axis positions. Note that the maxima of the peak amplitude in Figure 2 are not on-axis with the loudspeaker, which was due to the occlusion effect of the listener’s head and ear.
FIGURE 2
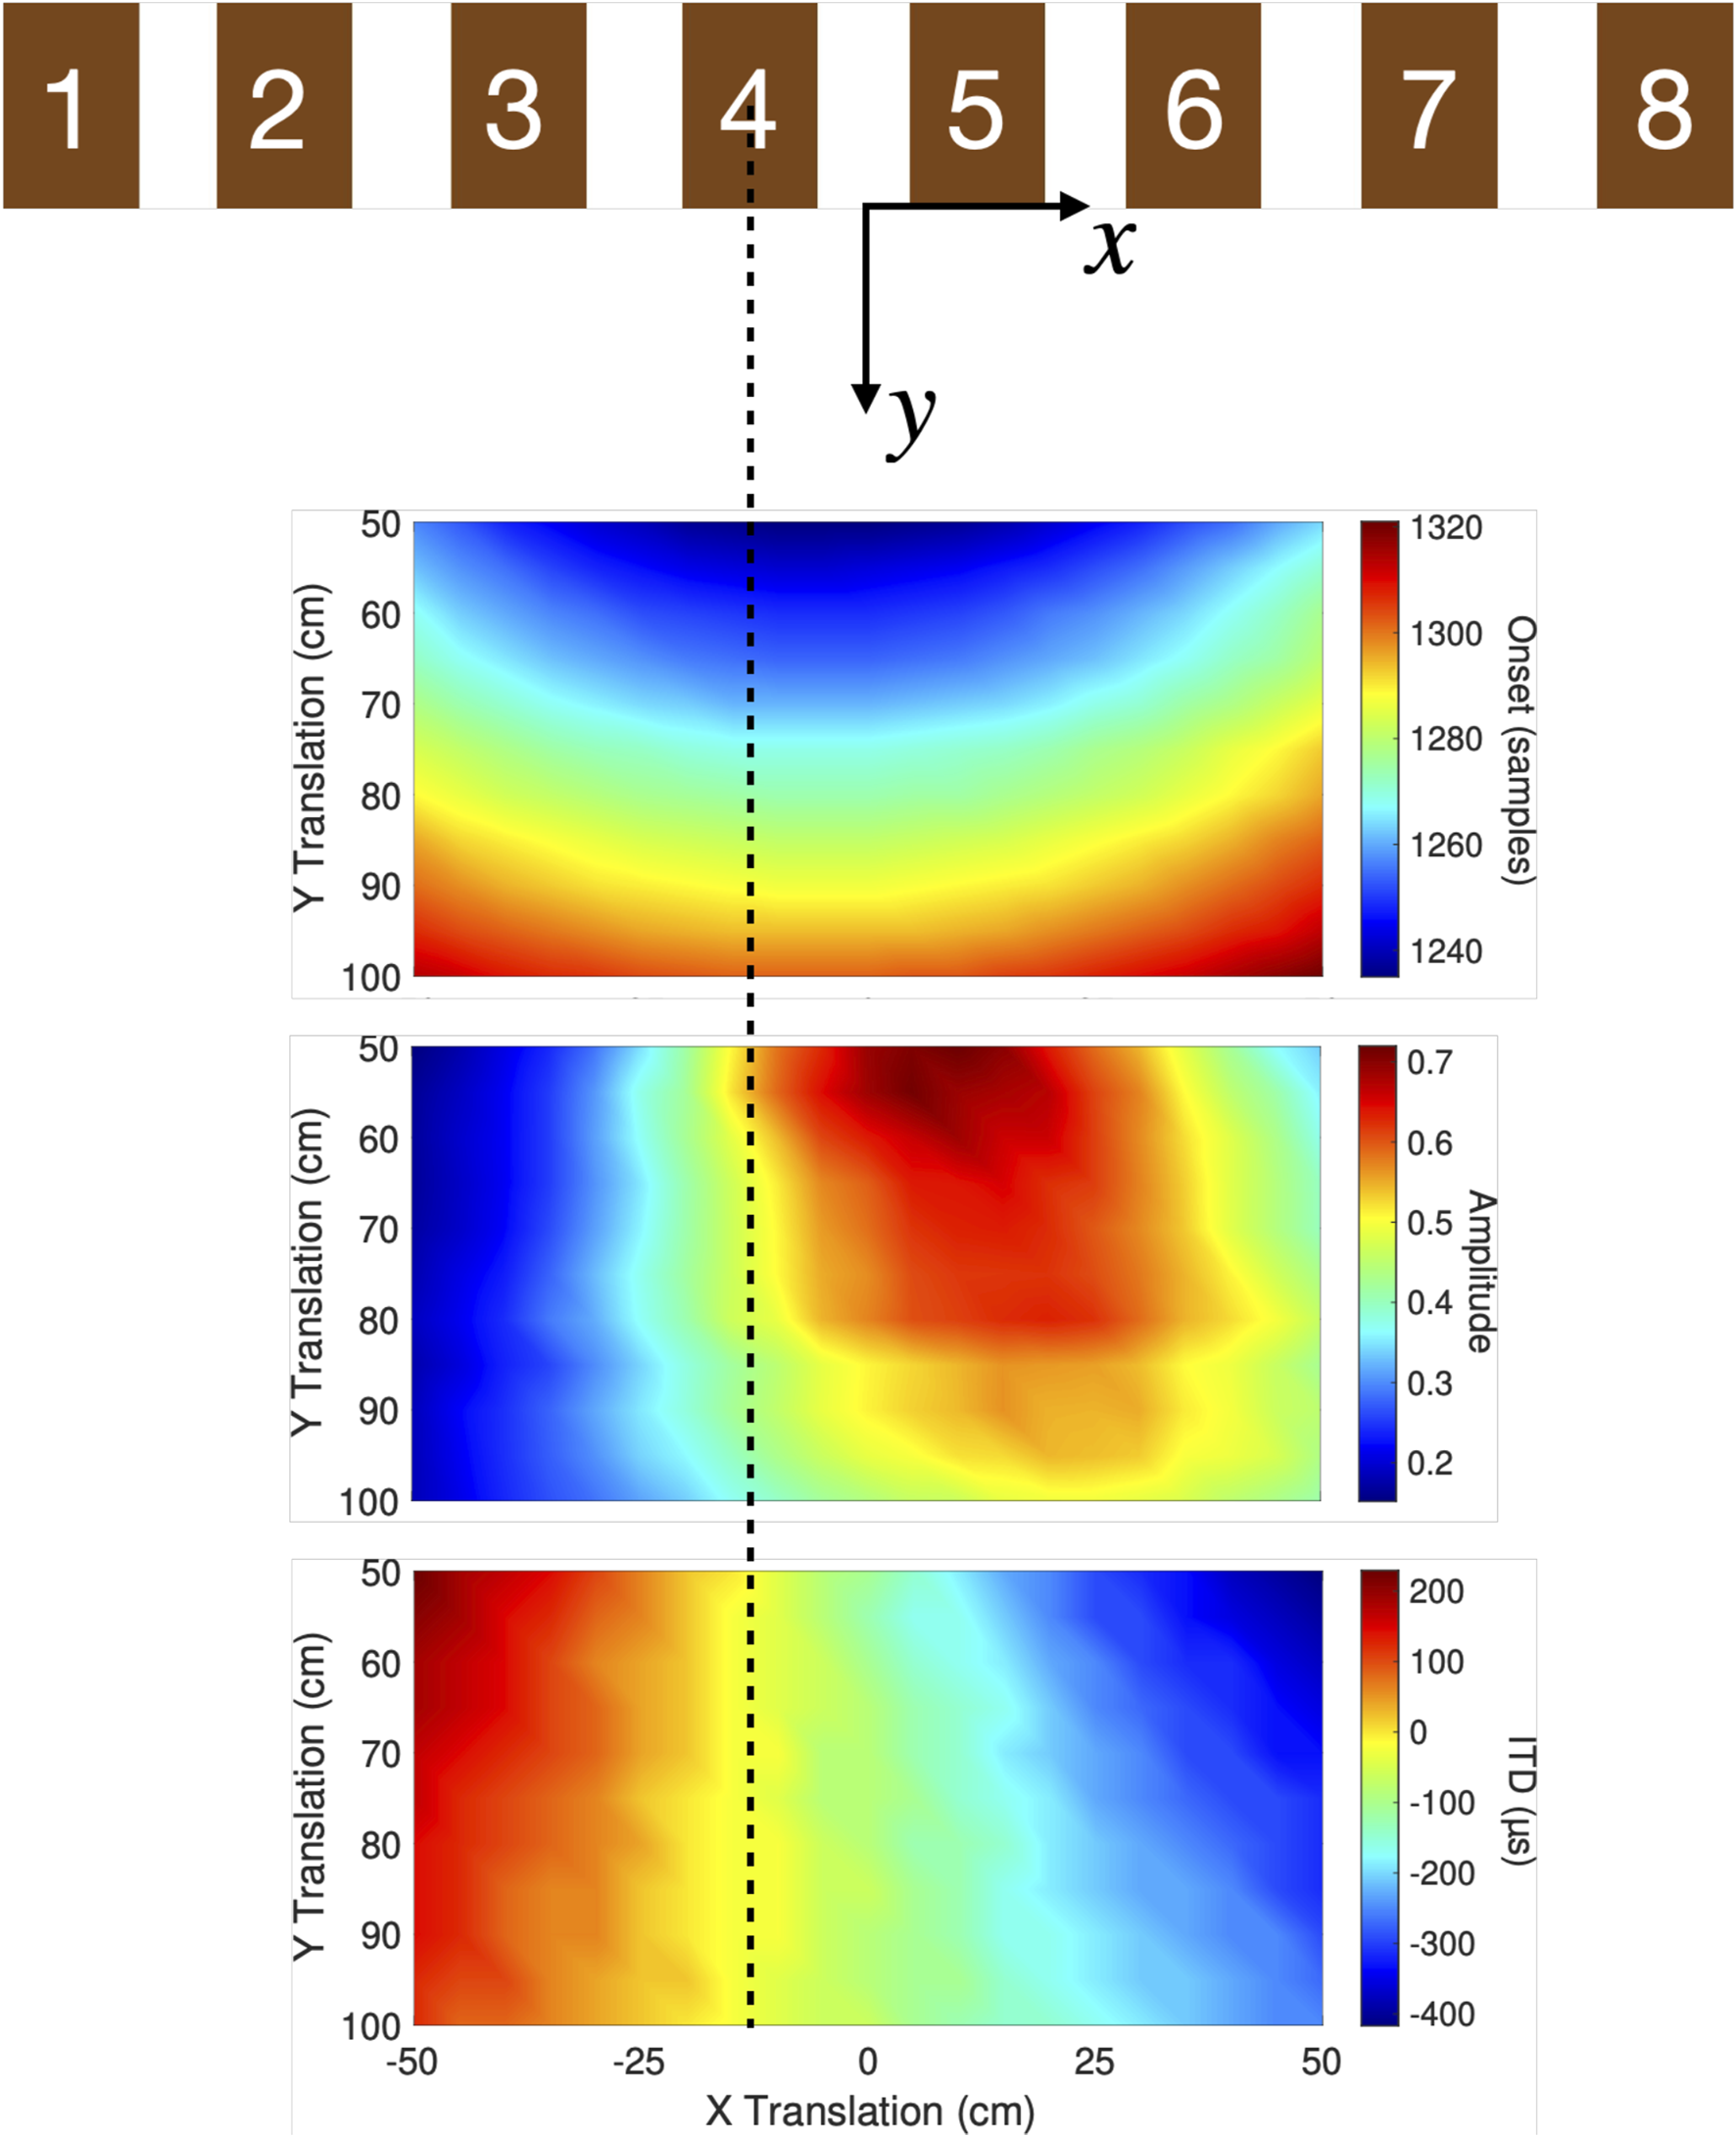
Three example figures showing the properties of the BRIRs measured at the fourth loudspeaker (counting from the left) and with the listener facing forward. The x-axis of the figures is aligned with the loudspeaker array. The dashed line in the figure indicates the center of the fourth loudspeaker. Top figure: onsets of left-ear BRIRs. Middle figure: peak amplitude of left-ear BRIRs. Bottom figure: calculated ITD of BRIRs.
Statements
Data availability statement
The datasets presented in this study can be found in online repositories. The names of the repository/repositories and accession number(s) can be found in the article/Supplementary material https://doi.org/10.34770/6gc9-5787.
Author contributions
YQ: conceptualization, data curation, formal analysis, methodology, software, visualization, writing–original draft, and writing–review and editing. RG: formal analysis, investigation, software, validation, visualization, and writing–review and editing. EC: funding acquisition, project administration, resources, supervision, and writing–review and editing.
Funding
The author(s) declare financial support was received for the research, authorship, and/or publication of this article. This work was supported by a research grant from Masimo Corporation.
Acknowledgments
The authors wish to thank K. Tworek, R. Sridhar, and J. Tylka for their prior work in developing the control software program for the translation platform and the turntable. They also wish to thank L. Guadagnin for his support on the loudspeaker array.
Conflict of interest
The authors declare that the research was conducted in the absence of any commercial or financial relationships that could be construed as a potential conflict of interest.
Publisher’s note
All claims expressed in this article are solely those of the authors and do not necessarily represent those of their affiliated organizations, or those of the publisher, the editors, and the reviewers. Any product that may be evaluated in this article, or claim that may be made by its manufacturer, is not guaranteed or endorsed by the publisher.
References
1
AES69-2022 (2022). AES standard for file exchange-spatial acoustic data file format. Standard: Audio Engineering Society.
2
Betlehem T. Zhang W. Poletti M. A. Abhayapala T. D. (2015). Personal sound zones: delivering interface-free audio to multiple listeners. IEEE Signal Process. Mag.32, 81–91. 10.1109/msp.2014.2360707
3
Brinkmann F. Dinakaran M. Pelzer R. Grosche P. Voss D. Weinzierl S. (2019). A cross-evaluated database of measured and simulated hrtfs including 3d head meshes, anthropometric features, and headphone impulse responses. J. Audio Eng. Soc.67, 705–718. 10.17743/jaes.2019.0024
4
Choueiri E. (2018). “Binaural audio through loudspeakers,” in Immersive sound: the art and science of binaural and multi-channel audio. Editors RoginskaA.GelusoP. (New York, NY, USA. Taylor and Francis), 124–179. chap. 6.
5
Cooper D. H. Bauck J. L. (1989). Prospects for transaural recording. J. Audio Eng. Soc.37, 3–19.
6
Druyvesteyn W. Garas J. (1997). Personal sound. J. Audio Eng. Soc.45, 685–701.
7
Erbes V. Geier M. Weinzierl S. Spors S. (2015). “Database of single-channel and binaural room impulse responses of a 64-channel loudspeaker array,” in Audio engineering society convention (Warsaw, Poland. Audio Engineering Society), 138.
8
Farina A. (2000). “Simultaneous measurement of impulse response and distortion with a swept-sine technique,” in Audio engineering society convention (Paris, France. Audio Engineering Society), 108.
9
Gardner W. G. (1998). D audio using loudspeakers. in 3, 444. Springer Science and Business Media.
10
Jeub M. Schafer M. Vary P. (2009). “A binaural room impulse response database for the evaluation of dereverberation algorithms,” in 2009 16th international conference on digital signal processing (IEEE), 1–5.
11
Karjalainen M. Piirilä E. Järvinen A. Huopaniemi J. (1999). Comparison of loudspeaker equalization methods based on dsp techniques. J. Audio Eng. Soc.47, 14–31.
12
Katz B. F. Noisternig M. (2014). A comparative study of interaural time delay estimation methods. J. Acoust. Soc. Am.135, 3530–3540. 10.1121/1.4875714
13
Kayser H. Ewert S. D. Anemüller J. Rohdenburg T. Hohmann V. Kollmeier B. (2009). Database of multichannel in-ear and behind-the-ear head-related and binaural room impulse responses. EURASIP J. Adv. signal Process.2009, 298605–298610. 10.1155/2009/298605
14
Koyama S. Nishida T. Kimura K. Abe T. Ueno N. Brunnström J. (2021). “Meshrir: a dataset of room impulse responses on meshed grid points for evaluating sound field analysis and synthesis methods,” in 2021 IEEE workshop on applications of signal processing to audio and acoustics (WASPAA) (IEEE), 1–5.
15
Lindfors J. Liski J. Välimäki V. (2022). Loudspeaker equalization for a moving listener. J. Audio Eng. Soc.70, 722–730. 10.17743/jaes.2022.0020
16
Novak A. Lotton P. Simon L. (2015). Synchronized swept-sine: theory, application, and implementation. J. Audio Eng. Soc.63, 786–798. 10.17743/jaes.2015.0071
17
Qiao Y. Choueiri E. (2023a). The effects of individualized binaural room transfer functions for personal sound zones. J. Audio Eng. Soc.71, 848–858. 10.17743/jaes.2022.0109
18
Qiao Y. Choueiri E. (2023b). “Optimal spatial sampling of plant transfer functions for head-tracked personal sound zones,” in Audio engineering society convention (Espoo, Helsinki, Finland. Audio Engineering Society), 154.
19
Shinn-Cunningham B. G. Kopco N. Martin T. J. (2005). Localizing nearby sound sources in a classroom: binaural room impulse responses. J. Acoust. Soc. Am.117, 3100–3115. 10.1121/1.1872572
20
Sridhar R. Tylka J. G. Choueiri E. (2017). “A database of head-related transfer functions and morphological measurements,” in Audio engineering society convention (New York, NY, USA. Audio Engineering Society), 143.
21
Wendt T. Van De Par S. Ewert S. D. (2014). A computationally-efficient and perceptually-plausible algorithm for binaural room impulse response simulation. J. Audio Eng. Soc.62, 748–766. 10.17743/jaes.2014.0042
22
Younes A. Honerkamp D. Welschehold T. Valada A. (2023). Catch me if you hear me: audio-visual navigation in complex unmapped environments with moving sounds. IEEE Robotics Automation Lett.8, 928–935. 10.1109/lra.2023.3234766
23
Yu Y. Wang W. Han P. (2016). Localization based stereo speech source separation using probabilistic time-frequency masking and deep neural networks. EURASIP J. Audio, Speech, Music Process.2016, 7–18. 10.1186/s13636-016-0085-x
Summary
Keywords
binaural room impulse response, acoustic dataset, spatial audio, listener movement, acoustic measurement
Citation
Qiao Y, Gonzales RM and Choueiri E (2024) A multi-loudspeaker binaural room impulse response dataset with high-resolution translational and rotational head coordinates in a listening room. Front. Sig. Proc. 4:1380060. doi: 10.3389/frsip.2024.1380060
Received
31 January 2024
Accepted
05 April 2024
Published
29 April 2024
Volume
4 - 2024
Edited by
Ante Jukic, Nvidia, United States
Reviewed by
Emanuël Habets, International Audio Laboratories Erlangen (AudioLabs), Germany
Lukas Aspöck, RWTH Aachen University, Germany
Updates
Copyright
© 2024 Qiao, Gonzales and Choueiri.
This is an open-access article distributed under the terms of the Creative Commons Attribution License (CC BY). The use, distribution or reproduction in other forums is permitted, provided the original author(s) and the copyright owner(s) are credited and that the original publication in this journal is cited, in accordance with accepted academic practice. No use, distribution or reproduction is permitted which does not comply with these terms.
*Correspondence: Yue Qiao, yqiao@princeton.edu
Disclaimer
All claims expressed in this article are solely those of the authors and do not necessarily represent those of their affiliated organizations, or those of the publisher, the editors and the reviewers. Any product that may be evaluated in this article or claim that may be made by its manufacturer is not guaranteed or endorsed by the publisher.