 Min-Seo Song
 Seung-Bo Lee
- Department of Medical Informatics, School of Medicine, Keimyung University, Daegu, Republic of Korea
In this study, we highlighted the growing need for automated electrocardiogram (ECG) signal classification using deep learning to overcome the limitations of traditional ECG interpretation algorithms that can lead to misdiagnosis and inefficiency. Convolutional neural networks (CNN) application to ECG signals is gaining significant attention owing to their exceptional image-classification capabilities. However, we addressed the lack of standardized methods for converting 1D ECG signals into 2D-CNN-compatible input images by using time-frequency methods and selecting hyperparameters associated with these methods, particularly the choice of function. Furthermore, we investigated the effects of fine-tuned training, a technique where pre-trained weights are adapted to a specific dataset, on 2D-CNNs for ECG classification. We conducted the experiments using the MIT-BIH Arrhythmia Database, focusing on classifying premature ventricular contractions (PVCs) and abnormal heartbeats originating from ventricles. We employed several CNN architectures pre-trained on ImageNet and fine-tuned using the proposed ECG datasets. We found that using the Ricker Wavelet function outperformed other feature extraction methods with an accuracy of 96.17%. We provided crucial insights into CNNs for ECG classification, underscoring the significance of fine-tuning and hyperparameter selection in image transformation methods. The findings provide valuable guidance for researchers and practitioners, improving the accuracy and efficiency of ECG analysis using 2D-CNNs. Future research avenues may include advanced visualization techniques and extending CNNs to multiclass classification, expanding their utility in medical diagnosis.
1 Introduction
Electrocardiograms (ECG) play a pivotal role in clinical medicine, and more than 300 million ECG signals are obtained annually worldwide (Holst et al., 1999). The simplicity, non-invasiveness, and cost-effectiveness of ECG make it a widely used method for measuring cardiac electrical activity. ECG is crucial for diagnosing a wide spectrum of cardiovascular diseases ranging from arrhythmias to acute coronary syndromes (Schlant et al., 1992). Owing to its increasing importance in the clinical ECG workflow, computer-aided interpretation has become a crucial tool in clinical settings, specifically in ECG analysis. However, traditional ECG examination algorithms have significant misdiagnosis rates of 11.3% for specific tasks of atrial fibrillation (Bae et al., 2012). Moreover, the existing clinical ECG examinations and diagnoses conducted by physicians can be time-consuming, impractical, and sometimes inaccessible in remote areas (Poon et al., 2005; Guglin and Thatai, 2006; Shah and Rubin, 2007; Schläpfer and Wellens, 2017).
In recent years, several researchers have used deep learning to accurately identify ECG and overcome these problems. These reports have shown that specific abnormalities, such as premature ventricular contraction and atrial fibrilla, can be identified by using a robustly designed deep learning model (Yildirim, 2018; Yıldırım et al., 2018; Attia et al., 2019). Among these advancements, convolutional neural networks (CNNs) have demonstrated remarkable capabilities in various image-analysis tasks, sparking interest in their potential for ECG classification. Notably, the transformation of ECG signals into two-dimensional images has emerged as a promising approach. However, no standardized method exists for inputting ECG signals into 2D-CNNs. Some researchers have converted raw ECG signals directly into pixel images for classification (Makimoto et al., 2020; Huang et al., 2022); others have explored using time-frequency methods, such as the continuous wavelet transform (CWT) and short-time Fourier transform (STFT), which can transform ECG signals into input images for 2D-CNNs. However, established guidelines regarding the hyperparameters associated with using time-frequency methods are absent.
One of the critical hyperparameters in time-frequency methods is the choice of function, which is pivotal in CWT and STFT. CWT employs wavelet functions, such as the bump wavelet (Ozaltin and Yeniay, 2023), Ricker wavelet (Wang et al., 2021), and Morlet wavelet (Rahuja and Valluru, 2021), to transform signals. Wavelets are wave-like oscillations characterized by an amplitude that starts at zero, increases or decreases, and returns to zero one or more times. They are often called “brief oscillations.” Wavelets have various forms, and a taxonomy has been established based on the number and direction of the pulses. They possess unique properties that make them valuable for signal-processing tasks. These versatile wavelet functions find applications in the CWT and other research domains, such as the discrete wavelet transform. In the case of STFT, window functions, such as the Blackman (Niroshana et al., 2021) and Hann (Huang et al., 2019), transform signals into their time-frequency representations. Window functions are zero-valued mathematical functions outside the chosen interval. They are typically symmetrical around the middle of the interval, often peaking in the middle and gradually tapering away from the center. Window functions are crucial in defining the characteristics of the spectral analysis, with different types serving various purposes and determining how data are weighted and tapered before undergoing a Fourier transform. These functions are important in influencing the size, depth, and importance attributed to different aspects of the transformed 2D features, resulting in a significant effect on the performance of deep learning classification models.
Meanwhile, fine-tuning, where pre-trained weights from a large dataset are further trained on a specific dataset to enhance the model performance, has been gaining attention in several studies. Transfer learning involves applying the knowledge gained from one problem or task to another, using a model trained on a source dataset and further training it on a target dataset. It gradually improves the model performance, especially in scenarios with limited training data. Several researchers have focused on CNN-based transfer learning. In (Yosinski et al., 2014), the transferability of features pre-learned from the ImageNet dataset was extensively explored by employing various fine-tuning strategies on different datasets. In another study (Donahue et al., 2014), the transferability of each layer’s parameters in a pre-trained AlexNet was described using a fine-tuning approach applied to each network layer individually. However, the effectiveness of transfer learning using fine-tuned CNN models pre-trained on generic image datasets with ECG data has not been adequately validated.
This study addressed the need for comprehensive exploration, using comparative studies to identify the most effective transformation methods for learning ECG patterns. This study provides clear guidelines to assist researchers and practitioners in optimizing ECG analysis using 2D-CNNs, enhancing the accuracy and efficiency of arrhythmia detection and diagnosis. A significant aspect of our work involves extensively analyzing various image-transformation methods. We assessed their efficiencies and offered insights into their performances in ECG signal classification. Our study provides valuable information for selecting the most suitable image transformation techniques for ECG analysis, recognizing the lack of standardized protocols in this field. Furthermore, we explore the impact of transfer learning in this domain. By fine-tuning CNN models trained on diverse image datasets, we demonstrated the viability and potential efficiency gains in ECG classification, even in scenarios with limited data resources. This study underscores the feasibility of utilizing 2D-CNNs for ECG classification and contributes to the establishment of more effective methodologies in the field of medical signal processing.
We validated the classification of ECG signals as premature ventricular contractions (PVCs) and abnormal heartbeats originating in the ventricles. Unlike normal electrical signals in the heart that originate rhythmically in the sinoatrial (SA) node, in PVCs, an abnormal electrical signal in the ventricles precedes a regular electrical impulse from the SA node. Consequently, the ventricles contract prematurely, disrupting normal heart rhythm. PVCs can feel like a fluttering or pounding sensation in the chest and are often described as “skipped beats” because they interrupt the regular heartbeat. They can occur in individuals with or without underlying cardiac conditions. Although occasional PVCs are usually harmless and may not require treatment, frequent or sustained PVCs can be associated with heart disease and may require medical evaluation and management.
2 Materials and methods
2.1 Datasets
The primary data source for this study was the MIT-BIH Arrhythmia Database (Moody and Mark, 2001), comprising 30-min ECG signal recordings from 48 subjects at 360 Hz. The original ECG signal data contained heartbeat information from patients with cardiovascular disease. Each of the ECG signals lasts 1 hour, except for the two-channel ambulatory recordings. In most records, lead A is a modified limb lead II (MLII), and lead B is V1 (occasionally V2 or V5, and in one instance V4).
We used a single lead, specifically the MLII, and normalized each raw one-dimensional ECG signal using the min-max normalization given in Eq. 1 as follows:
where X represents the normalized ECG signal, min (signal) and max (signal) represent the minimum and maximum functions.
2.2 Processing
We split the points in a 4:6 ratio of the R-wave peaks, considering the heartbeats of a healthy male adult with a heart rate of 60 bpm (Clifford et al., 2006; Hu et al., 2022). After obtaining the heartbeat information and establishing the split points, we adopted a sliding window algorithm and organized the ECG data into coherent three-second segments. We categorized all normal heartbeats into the normal class and any occurrence of a PVC beat in a segment into the PVC class. In addition, we implemented downsampling in the normal class, where we retained 30% of the data and separated the training and validation sets in an 80:20 ratio.
2.3 Generation of 2D images
Within the 2D-CNN, the input data must be of the image type. In the following sections, we discuss two prominent techniques for transforming ECG signals to 2D images, CWT and STFT.
2.3.1 Continuous wavelet transform (CWT)
CWT is a time-frequency analysis that translates time-series data into a 2D image format by mapping the signal on the time axis. It provides insights into frequency and time information and effectively handles non-stationary signals. The formulations of the CWT and WT families are expressed in Eqs 2, 3 as follows:
where f (t) is a continuous signal, ECG,
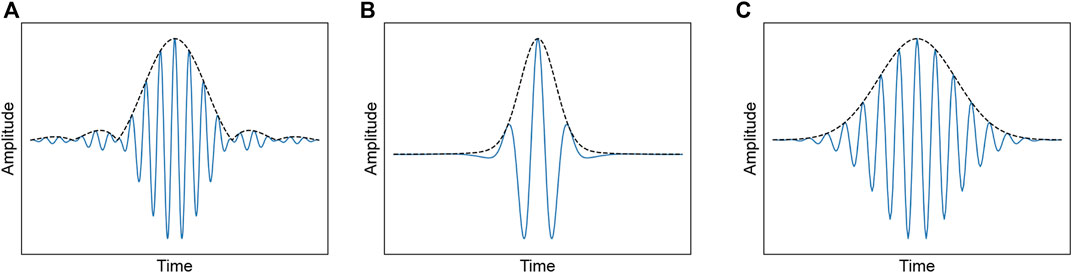
FIGURE 1. Time-domain waveforms of each wavelet function: (A) Bump wavelet, (B) ricker wavelet, (C) morlet wavelet.
Bump Wavelet: Bump wavelet is a bandlimited function defined in the frequency domain with parameters μ and σ and window w [n] (Li et al., 2020). It has a wider variance in time and a narrower frequency variance. Valid values for μ and σ are in the ranges of (3, 6) and (0.1, 1.2), respectively. Smaller values of σ produce wavelets with superior frequency localization but poorer time localization. Larger values of σ have a wavelet with better time localization and poorer frequency localization. Eq. 4. Shows the formulation of the bump wavelet.
when
Ricker Wavelet: Ricker wavelet, also known as the Mexican hat wavelet, is proportional to the negative value of the second derivative of a Gaussian function. No scaling function was associated with this wavelet. The following Eq. 5 is the functional form:
where σ is the standard deviation controlling the width, and t is an independent variable (Silik et al., 2021).
Morlet wavelet: Morlet wavelet is designed as a zero-mean function and represents a sinusoidal function modulated by a Gaussian function (Büssow, 2007; Cohen, 2019), which has an infinite duration. However, most energy is confined to a finite interval (Büssow, 2007). It has equal variance in time and frequency and detects good time- and frequency-localized information. This mother wavelet has no scaling function and does not technically satisfy the admissibility condition except for approximately. However, if α > 5.5, the error can be ignored numerically. It is defined as Eq. 6:
By dilating with a and translating with b, the Morlet wavelet family can be expressed as Eq. 7:
where b is the translation parameter that affects the shape of the wavelet, balancing time and frequency resolution. This wavelet has been successfully used for vibrational signal analysis (Cohen, 2019).
2.3.2 Short-time fourier transform (STFT)
STFT is another widely used technique for transforming time-series data into 2D image representations. It addresses the limitations of the traditional Fourier analysis by considering signal variations over short time intervals, making it suitable for non-stationary signals. Eq. 8 gives its discrete digital signal and time-frequency spectrogram.
where x [n] represents the ECG signal with a sampling rate of 360 Hz, and w [n] is the window function. We used the following functions in this study and each function is illustrated in Figure 2: window size of 256.
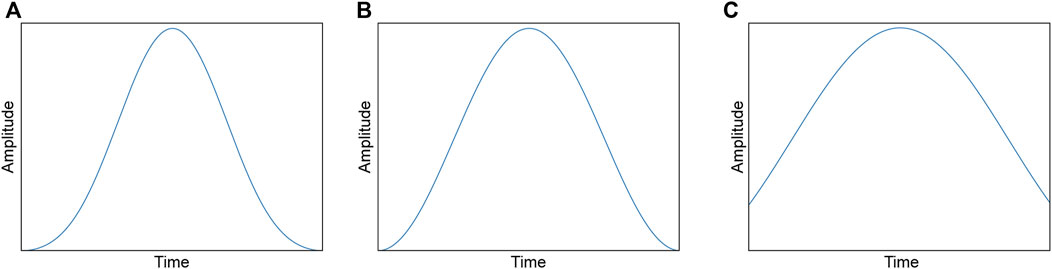
FIGURE 2. Waveforms of each window function: (A) Blackman window, (B) hann window, (C) kaiser window (α = 3.0).
Blackman window: Blackman window is a specific function used in signal processing and spectral analysis. It was designed to smoothly taper the data from zero at the edges to the maximum value at the center. The Blackman window is characterized by its main lobe, which is relatively wide and has relatively low side lobes compared to other window functions (Harris, 1978). Mathematically, Eq. 9 defines the Blackman window.
Hann window: The Hann or Hanning window is a popular window function used in signal processing and spectral analysis and is a member of the cosine-sum and power-of-sine families. The endpoint of the Hann window was zero. The resulting side lobes roll off at approximately
Kaiser window: The Kaiser window is used in signal processing and spectral analysis and is a one-parameter family of window functions used in finite-impulse designs and spectral analyses (Kuo and Kaiser, 1966; Harris, 1978). Eqs 11, 12 samples this window.
where M denotes the sample length of the signal, the Kaiser window is characterized by its ability to adjust these parameters by varying a shape parameter, the value of α, whose value is 3.0 in this study.
Consequently, we transformed the ECG signals into 227 × 227-pixel images using image transformation methods, as Figure 3 shows.
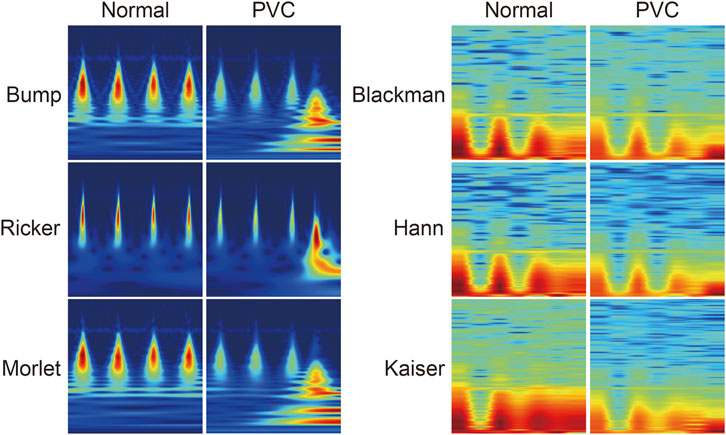
FIGURE 3. Visualization of samples of image transformation belonging to each image transformation method and ECG class.
2.4 Classification model
We chose a CNN model based on ImageNet, a vast dataset encompassing myriad images across diverse categories for ECG classification. CNN models trained on ImageNet are well-equipped for image classification tasks owing to their feature-extraction capabilities. We explored the applicability of various ImageNet-based CNN architectures, including AlexNet, SqueezeNet, ResNet, and DenseNet.
AlexNet: AlexNet (Krizhevsky et al., 2012) comprises five convolutional layers paired with max-pooling layers, followed by three fully connected layers. In addition, it incorporates a dropout layer and softmax activation. Notably, each layer employed a Rectified Linear Unit (ReLU) activation function, replacing the previous tanh function in 2012. This transition to ReLU is instrumental in accelerating the architectural performance.
ResNet: ResNet (He et al., 2016) revolutionized the deep learning architecture by introducing residual blocks. These blocks allow the network to mitigate the vanishing gradient problem and facilitate the training of intense networks. In the residual block, the input is added to the output of a series of convolutional layers to create skip connections.
DenseNet: DenseNet (Huang et al., 2017) introduces a densely connected architecture that addresses deep network information flow and gradient vanishing issues. DenseNet architectures have multiple densely connected blocks repeated to form a deep network. Each layer receives feature maps from all the previous layers, leading to densely connected blocks.
SqueezeNet: SqueezeNet (Iandola et al., 2016) introduces a unique architecture featuring “fire modules.” SqueezeNet focuses on achieving high accuracy while significantly reducing model size and parameter count. The proposed network achieves this goal using smaller filter sizes and a streamlined architecture. We used SqueezeNet v1.1, which requires 2.4x less computation and slightly fewer parameters than SqueezeNet v1.0 without sacrificing accuracy.
We selected two models with different depths: ResNet (ResNet-18 and ResNet-152) and DenseNet (DenseNet-121 and DenseNet-201). We modified the classifier in the model architecture into a binary classifier suitable for arrhythmia classes and downloaded Network-fine-tuned weights pretrained on ImageNet from PyTorch.
2.5 Activation map
We employed gradient-weighted class activation mapping (Grad-CAM) to gain insight into the regions that were most influential in the classification decisions of the models within the ECG signals. We generated the activation maps of the final convolutional layer using Grad-CAM to visualize the last convolutional layer of each CNN architecture.
2.6 Evaluation metrics and statistical analysis
In this study, we evaluated the performance of each method using accuracy. Sensitivity and F1-score were also calculated for a binary comparison between the CWT and STFT. Eqs 13–15 defines the performance metrics.
where TP, FP, TN, and FN represent true positives, false positives, true negatives, and false negatives, respectively. We calculated precision as TP/(TP + FP).
We expressed continuous data as mean ± standard error (SE) as percentages (%), conducted a robust evaluation by performing five-fold cross-validation on the training set, and used student’s t-tests to statistically analyze the feature extraction time measurements.
For our research, we performed computations on a system equipped with an Intel (R) Xeon (R) Silver 4210R CPU (20 cores, 2.40 GHz), 64 GB of DDR4 RAM, and an NVIDIA RTX A5000 with 24 GB of dedicated memory. Windows 11 Pro was the operating system used for the workstations.
3 Result
3.1 Feature extraction time
We measured the time required to process 3,000 samples to assess the computational efficiency of the image-transformation methods used for feature extraction and the time required to convert a single segment into 2D images. We plotted the pixel images for each method. Table 1. Presents the time measurements.
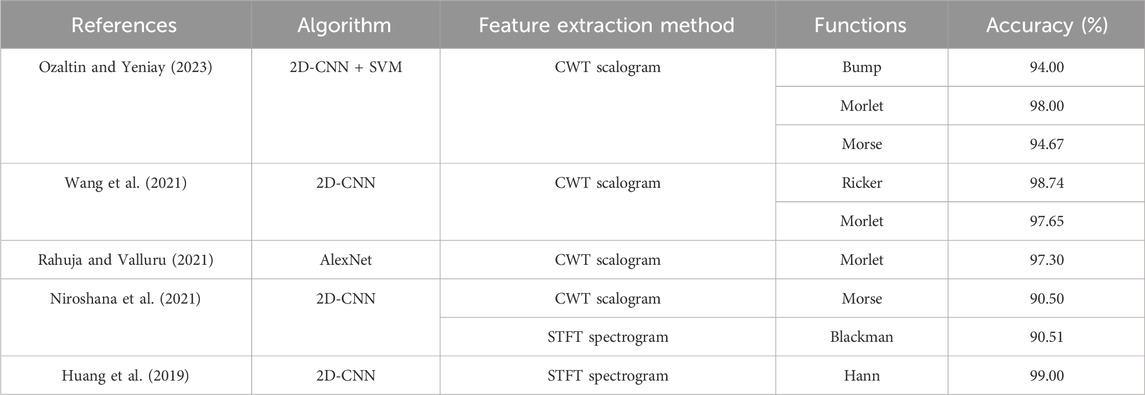
TABLE 1. Comparison of feature extraction methods and functions in recent ECG classification studies.
The CWT took approximately 216.36 milliseconds per segment on average, whereas the STFT required only approximately 135.36 milliseconds per segment on average, 1.6 times faster than the CWT. Furthermore, the fastest method, the Kaiser STFT method, was significantly faster than the other methods (p < 0.05), except for Hann (p = 0.97).
3.2 Performance: comparison between training from scratch and transfer learning
Figure 4 shows the accuracy scores obtained from both training approaches across a range of methods that incorporate the combined features of the CWT and STFT. Each data point represents the average of all six methods obtained by combining CWT and STFT.
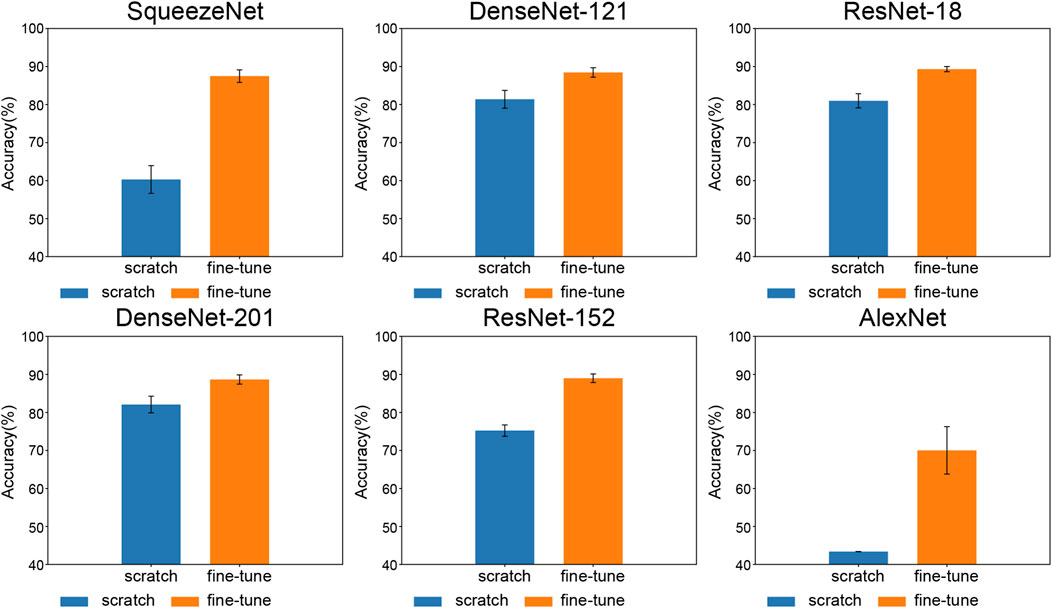
FIGURE 4. Comparison of accuracy between training from scratch and fine-tune training—models are sorted by parameter count.
The measurements indicated that fine-tuning the training improved the performance of the CNN model. The positive impact of fine-tuning on CNN model performance was evident through a comparative analysis between training from scratch and fine-tuned learning approaches. The classification performance of AlexNet was low when we performed the training from scratch. When trained from scratch, it failed to classify (43.37% ± 0.00%). However, fine-tuning improved the classification performance (70.03% ± 5.70%) within the same epoch, indicating that fine-tuning resolved the underfitting problem observed during training from scratch.
3.3 Performance: comparison of each type of image transformation methods
Figures 5, 6 illustrate the accuracies of the fine-tuned CNN architectures, which differ from the functions used in the image transformation methods.
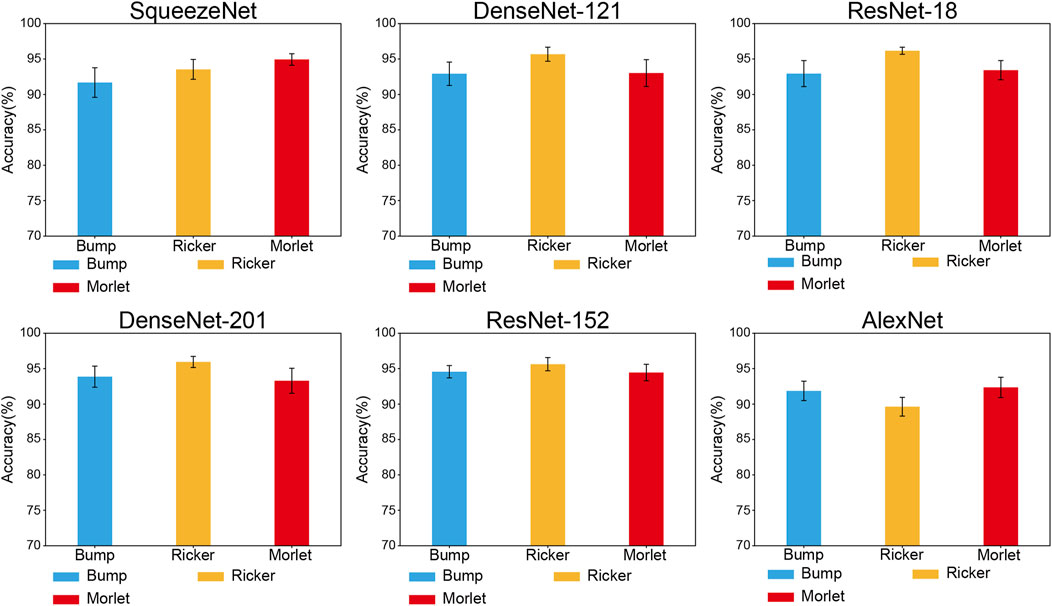
FIGURE 5. Classification performance comparison for mother wavelet functions of CWT image transformation.
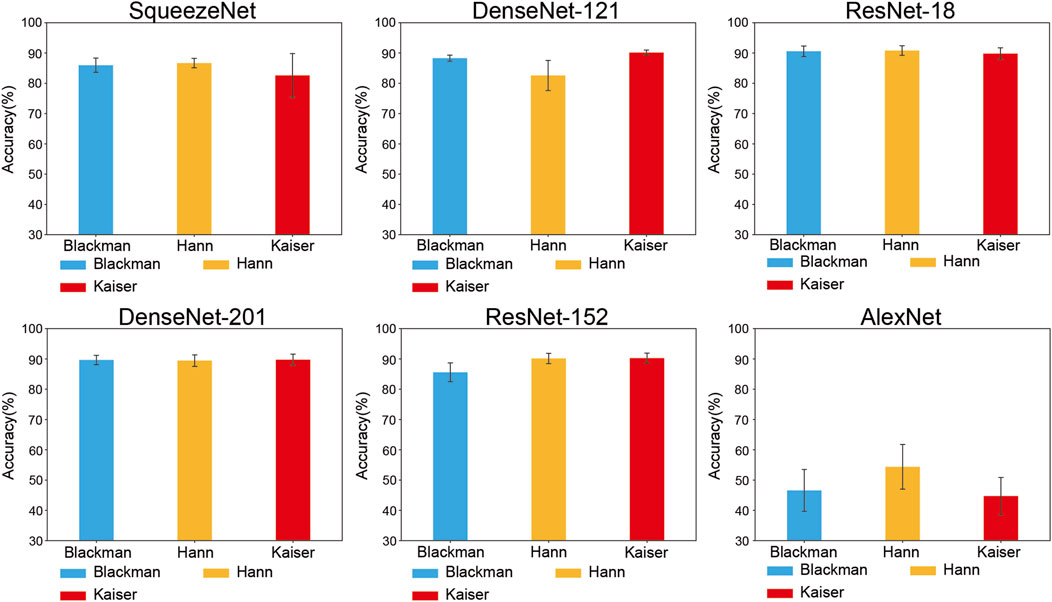
FIGURE 6. Classification performance comparison for window functions of STFT image transformation.
In CWT methods, as Figure 5 shows, the Morlet function shows the highest accuracy in SqueezeNet (94.93% ± 0.91%), AlexNet (92.36% ± 1.59%), and the Ricker function shows the highest accuracy in DenseNet-121 (95.68% ± 1.11%), ResNet-18 (96.17% ± 0.56%), DenseNet-201 (95.95% ± 0.88%), and ResNet-152 (95.63% ± 1.05%). Ricker + ResNet-18 was the model-and-function mixture that exhibited the highest accuracy.
In STFT methods, as Figure 6 shows, the Kaiser method outperformed the other methods in DenseNet-121 (90.15% ± 0.92%), ResNet-152 (90.26% ± 1.88%), and DenseNet-201 (89.74% ± 2.06%). Hann yielded the best performance in SqueezeNet (86.66% ± 1.73%), Resnet-18 (90.80% ± 1.79%), and AlexNet (54.37% ± 8.24%). Hann + ResNet-18 is the combination with the highest performance.
3.4 Performance: comparison of image transformation methods
Figure 7 shows the classification performance of each method that exhibited the highest accuracy among the CWT and STFT methods for each architecture. As Figure 7 shows, all the CNN architectures are expected to outperform the STFT architectures. The CWT methods exhibited extreme variations in performance on AlexNet (accuracy: +37.99%, sensitivity: +29.61%, F1-Score: +40.25%). Excluding the case of AlexNet, the CWT method outperformed the STFT method based on all the performance metrics (Accuracy: +5.37–8.27%, Sensitivity: +4.56–10.10%, F1-Score: +6.21–10.70%).
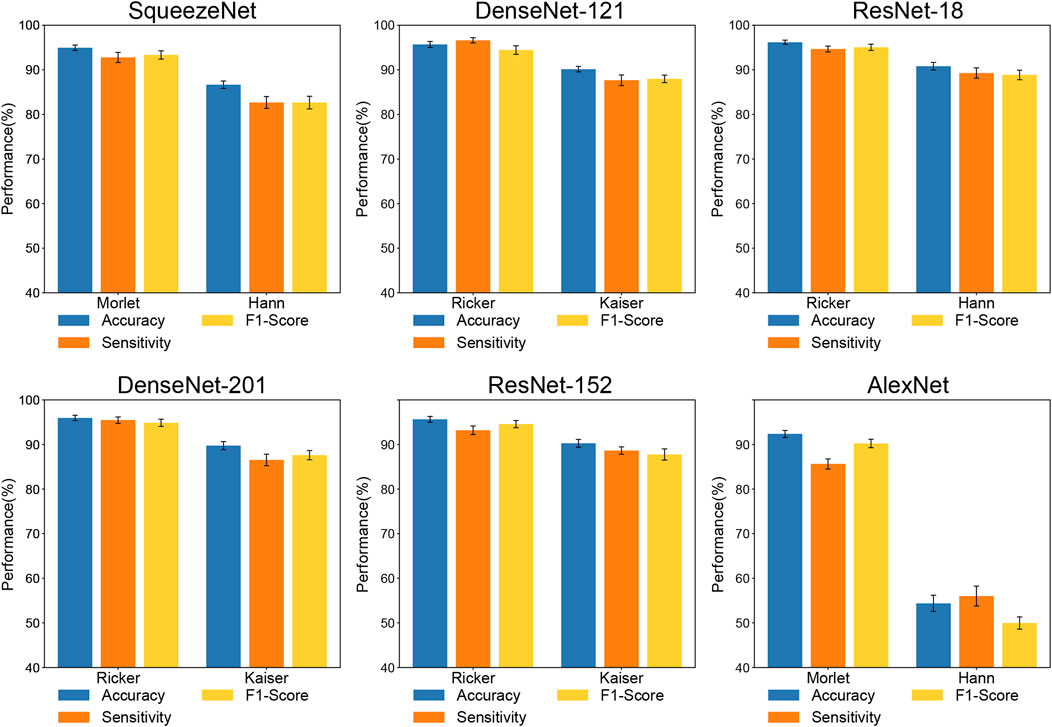
FIGURE 7. Classification performances comparison of image transformation methods. Methods in subplots show the highest accuracy in each image transformation.
3.5 Grad-CAM
Figure 8 shows the Grad-CAM heatmaps of the best combinations for each transformation method in Section 3.3: Ricker + ResNet-18 (CWT) and Hann + ResNet-18 (STFT). The CNN method focused on the red-colored zones.
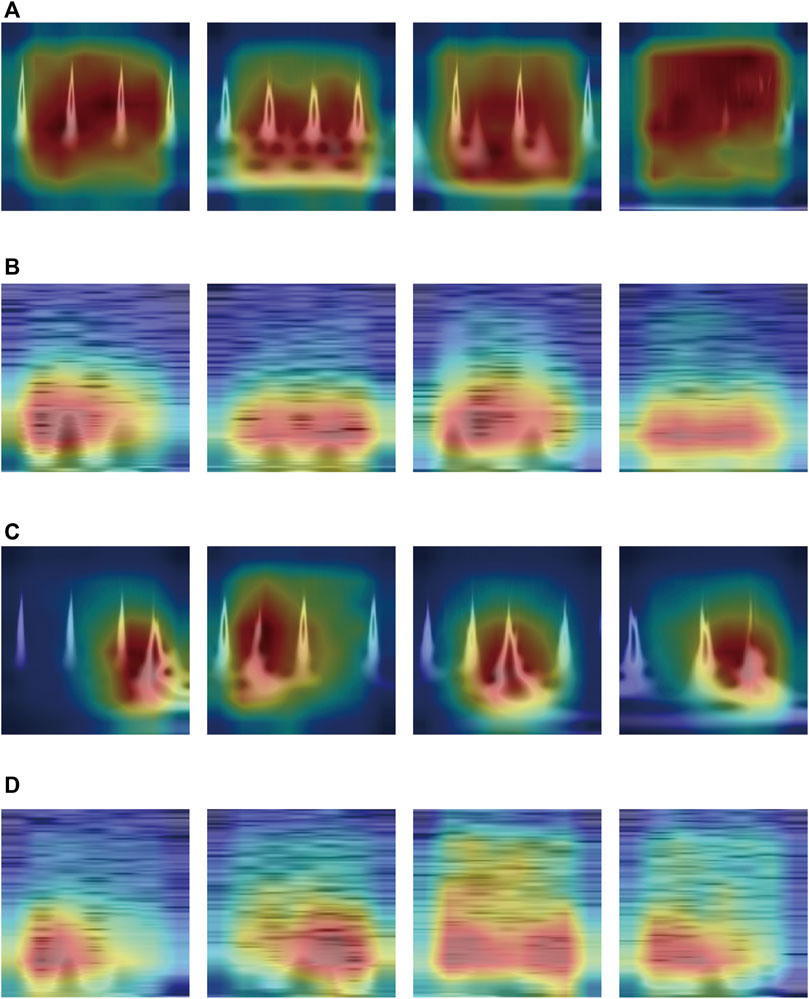
FIGURE 8. Grad-CAM heatmap of Best Combination in Each Transformation Method: (A) Normal Class—CWT method, (B) Normal Class—STFT method, (C) PVC Class—CWT method, (D) PVC Class—STFT method.
As Figures 8A, B show, representing the normal class, the heatmaps of the best CWT and the STFT methods focused across the entire area about the time component. However, Figures 8C, D, representing the PVC class, show distinctly different heatmap distributions. In Figure 8C, the heatmaps of the best CWT method distinctly concentrate on the abnormal PVC beats. By contrast, the heatmaps of the best STFT method predominantly focused on the opposite time component of the abnormal PVC beats within the PVC class, as Figure 8D shows.
4 Discussion
We conducted a comparative analysis of six feature extraction methods for the two groups. We compared the performances of various feature extraction methods in 2D CNN architectures for ECG using image transformation as the feature extraction method and suggested the most effective methods for the 2D-CNN classification model. The key findings of our research can be summarized as follows: (i) STFT methods have a shorter execution time than CWT methods. (ii) Fine-tuning training improved the performance of the 2D-CNN architecture, solving the underfitting problem when training from scratch. (iii) The CWT method outperformed the STFT methods. (iii) ResNet-18, which had the third lowest number of parameters among the model architectures, exhibited the highest CWT and STFT performance. (v) In CWT and STFT heatmaps visualized using Grad-CAM, significantly opposite areas were observed within the PVC class.
We assessed the computational efficiency of the image transformation, revealing the time required for feature extraction. The STFT methods outperformed the CWT methods in the image transformation speed. We attribute the observed difference in performance between the CWT and STFT methods to the process differences between the two image transformation methods. In CWT methods, we utilized separate modules to perform image transformation and plot pixel images, which may increase the computational cost and time required for image transformation. However, in STFT methods, the transformation process involves directly converting the signal into spectrograms without an additional module, leading to a faster image transformation process than CWT. These findings highlight the computational efficiency of the image transformation methods employed for feature extraction. The statistical significance of the Kaiser window function’s superior performance over other feature extraction methods emphasizes its efficiency in this context, making it a promising choice for researchers and practitioners seeking a balance between computational speed and accuracy in ECG analysis.
We demonstrated the effectiveness of fine-tuned training in enhancing CNN model performance. The results indicated significant improvements in accuracy compared with training from scratch. Notably, fine-tuning significantly improves the classification performance of AlexNet, which initially exhibited no classification capability when trained from scratch. Fine-tune training successfully elevated the accuracy to 92.36% ± 1.59% (Morlet of CWT method), showcasing the remarkable impact of fine-tuning in overcoming the underfitting issue evident in the scratch-trained model. This highlights the effectiveness of transfer learning, in which pre-trained model weights are leveraged to enhance the initial learning process by utilizing knowledge from the pre-trained models. In contrast to training from scratch, fine-tuning mitigates underfitting issues and enhances learning efficiency, underscoring the importance of fine-tuning the ECG classification tasks and providing recommended training strategies.
Through extensive experiments, we compared the performance of different feature extraction methods. We examined different mother wavelet functions (Bump, Ricker, and Morlet) in the CWT methods and window functions (Blackman, Hann, and Kaiser) in the STFT methods to determine the most efficient feature extraction method for improving the classification performance of 2D-CNN model architectures.
One notable observation is that, in general, the classification performance of STFT methods is notably lower in AlexNet. This suggests that the choice of the image transformation method can significantly affect the performance of CNN models, and certain methods may be unsuited for specific architectures. Furthermore, when comparing the best-performing methods, CWT evidently and consistently outperformed STFT across various CNN architectures. This finding demonstrates the importance of selecting an appropriate image transformation method for ECG analysis and provides valuable guidance to researchers. Researchers can make informed choices regarding selecting feature extraction methods, potentially improving the diagnostic accuracy of ECG classification tasks. This research lays the foundation for developing more effective ECG-based diagnostic tools and underscores the significance of feature extraction in deep learning-based ECG classification.
From a model perspective, it is worth noting that ResNet-18, the model with the third-fewest parameters, consistently demonstrated the best performance across both image transformation methods. This suggests that a model with parameters such as those of ResNet-18 is sufficient for effective learning for ECG classification, considering the information contained in the ECGs after image transformation. Increasing the number of parameters beyond this value does not yield a significant performance improvement.
In this study, we observed differences in the feature extraction performance compared to existing research methodologies in ECG signal analysis. As Table 2 illustrates, in existing studies using the CWT as a feature extraction method, the wavelet function used in the feature extraction method was not unified, and the Morlet wavelet function was mainly used. However, our research findings revealed a significant performance improvement when utilizing the Ricker Wavelet in CWT-based feature extraction. This wavelet function has not been widely used in previous studies. The excellent performance of the Ricker Wavelet in this study suggests that incorporating these changes into existing CWT-based feature extraction techniques could potentially improve the performance metrics. This finding contributes to the knowledge about ECG signal analysis and represents a promising direction for future research to refine further and optimize classification methods.
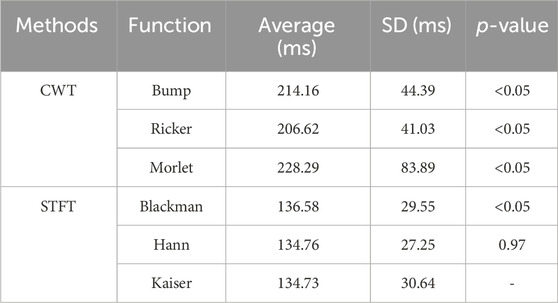
TABLE 2. Execution time of time-frequency methods.
Our use of Grad-CAM heatmaps reveals how CNNs focus on specific areas of ECG signals during classification. We observed distinct differences in the heatmap distribution within the PVC classes. Furthermore, we confirmed that the CWT and STFT heatmaps focused on opposite areas based on abnormal beats. We hypothesized that the difference in image transformation results between the two time-frequency methods may explain why the heatmaps produced by the CWT method concentrated significantly on abnormal PVC beats, as Figure 8C shows. In contrast, the heatmaps generated by the STFT method primarily emphasized the opposite areas of abnormal beats, as Figures8D shows. Hence, the activation maps generated by the CWT methods played a role in the observed performance improvement compared to the STFT.
Although our study provides substantial advancements in ECG classification using CNNs, it has several limitations. First, our study focused on binary classification, limiting their applicability to more complex medical diagnoses. Future research should expand the proposed methodology to include multiclass classification scenarios to address this issue. Specifically, we propose adopting a 5-class AAMI arrhythmia classification labeling standard to enhance our work’s practical applicability and relevance in diverse medical settings.
Although using Grad-CAM to visualize the focus of CNN architectures is highly beneficial, it has limitations regarding resolution and object localization. In addition, Grad-CAM can fail to localize multiple abnormal beats properly. This can be overcome by developing visualization techniques with higher resolution and accuracy for simultaneous object localization, such as Grad-CAM++ (Chattopadhay et al., 2018), which provides higher resolution and accuracy in localizing multiple abnormal ECG patterns.
Another limitation is our reliance on pre-trained CNN models from ImageNet. Although this approach benefits from established metrics, it may limit the depth of understanding of how these models specifically adapt to and perform ECG signal analysis. Future studies should explore and develop CNN models specifically designed and trained for ECG signal analysis, potentially leading to more accurate and clinically relevant results. By improving the fine-tuning methods, such as new learning image datasets after initializing the weights of some layers (Han et al., 2018), we can secure a good image search performance for existing weights and the ability to solve specific problems of ECG signals simultaneously.
Furthermore, while the MIT-BIH Arrhythmia Database was chosen for the detailed and comprehensive annotation of ectopic beats, we acknowledge this study’s generalizability limitations. The specificity of our focus on ectopic beat detection posed a challenge in identifying datasets aligned with our research criteria. This has emerged as a notable limitation in our study, which we fully acknowledge. Considering the limitations identified in our current study, we will undertake further research as more diverse and comprehensive ECG datasets become available. This commitment pertains to dataset variety and addresses the limitations associated with binary classification discussed earlier in our current approach. In addition, we plan to explore and refine signal-processing techniques, including appropriate resampling and denoising methods tailored to diverse datasets. By overcoming this limitation, we aimed to enhance the applicability of our methodology to a broader spectrum of medical diagnostic scenarios that often involve complex, multiclass conditions.
5 Conclusion
In this study, we offer valuable insights into the utilization of CNNs for ECG classification and present a comprehensive analysis of various feature extraction methods. The presented research findings collectively contribute to the expanding knowledge on applying CNNs to ECG classification. Through time-frequency-method-based image transformation, we confirmed high classification performance without needing models with many parameters. In addition, we validated the improvement in 2D-CNN ECG classification performance through transfer learning.
These findings collectively contribute to the growing body of knowledge regarding the application of CNNs in ECG classification. Our research highlights the significance of fine-tuned training and selecting appropriate image transformation methods for ECG classification, providing clear guidelines for practitioners and researchers. These insights can enhance the accuracy and efficiency of ECG interpretation, benefiting clinicians and patients. In addition, measuring the computational efficiency by measuring the feature extraction time for each method will improve arrhythmia detection methods in various clinical scenarios, such as emergency care, where rapid and accurate ECG interpretation is critical. Furthermore, our research, conducted using single-lead signal data, allows future application of our findings to patient-centered medical technologies, such as wearable electrocardiogram monitors, which enables our enhanced classification techniques to provide continuous, real-time analysis to detect and intervene in cardiac health problems early. Further research in this area could explore additional image-transformation methods to improve the capabilities of CNNs for ECG analysis.
Data availability statement
The original contributions presented in the study are included in the article/Supplementary material, further inquiries can be directed to the corresponding author.
Author contributions
M-SS: Writing–original draft, Writing–review and editing, Formal Analysis, Investigation, Methodology, Validation, Visualization, Data curation. S-BL: Writing–review and editing, Conceptualization, Funding acquisition, Project administration, Supervision, Resources, Validation.
Funding
The author(s) declare financial support was received for the research, authorship, and/or publication of this article. This research was supported by a grant of the Korea Health Technology R&D Project through the Korea Health Industry Development Institute (KHIDI), funded by the Ministry of Health and Welfare, Republic of Korea (grant number: HI22C0452).
Conflict of interest
The authors declare that the research was conducted in the absence of any commercial or financial relationships that could be construed as a potential conflict of interest.
Publisher’s note
All claims expressed in this article are solely those of the authors and do not necessarily represent those of their affiliated organizations, or those of the publisher, the editors and the reviewers. Any product that may be evaluated in this article, or claim that may be made by its manufacturer, is not guaranteed or endorsed by the publisher.
References
Attia, Z. I., Noseworthy, P. A., Lopez-Jimenez, F., Asirvatham, S. J., Deshmukh, A. J., Gersh, B. J., et al. (2019). An artificial intelligence-enabled ECG algorithm for the identification of patients with atrial fibrillation during sinus rhythm: a retrospective analysis of outcome prediction. Lancet 394 (10201), 861–867. doi:10.1016/s0140-6736(19)31721-0
Bae, M. H., Lee, J. H., Yang, D. H., Park, H. S., Cho, Y., Chae, S. C., et al. (2012). Erroneous computer electrocardiogram interpretation of atrial fibrillation and its clinical consequences. Clin. Cardiol. 35 (6), 348–353. doi:10.1002/clc.22000
Büssow, R. (2007). An algorithm for the continuous Morlet wavelet transform. Mech. Syst. Signal Process. 21 (8), 2970–2979. doi:10.1016/j.ymssp.2007.06.001
Chattopadhay, A., Sarkar, A., Howlader, P., and Balasubramanian, V. N. (2018). “Grad-cam++: generalized gradient-based visual explanations for deep convolutional networks,” in 2018 IEEE winter conference on applications of computer vision (WACV), Lake Tahoe, NV, USA, March 15 2018 (IEEE).
Clifford, G. D., Azuaje, F., and McSharry, P. (2006). Advanced methods and tools for ECG data analysis. Boston: Artech house Boston.
Cohen, M. X. (2019). A better way to define and describe Morlet wavelets for time-frequency analysis. NeuroImage 199, 81–86. doi:10.1016/j.neuroimage.2019.05.048
Donahue, J., Jia, Y., Vinyals, O., Hoffman, J., Zhang, N., Tzeng, E., et al. (2014). “Decaf: a deep convolutional activation feature for generic visual recognition,” in International conference on machine learning; 2014: PMLR, Beijing, China, June 21–June 26, 2014.
Guglin, M. E., and Thatai, D. (2006). Common errors in computer electrocardiogram interpretation. Int. J. Cardiol. 106 (2), 232–237. doi:10.1016/j.ijcard.2005.02.007
Gurley, K., and Kareem, A. (1999). Applications of wavelet transforms in earthquake, wind and ocean engineering. Eng. Struct. 21 (2), 149–167.
Han, D., Liu, Q., and Fan, W. (2018). A new image classification method using CNN transfer learning and web data augmentation. Expert Syst. Appl. 95, 43–56. doi:10.1016/j.eswa.2017.11.028
Harris, F. J. (1978). On the use of windows for harmonic analysis with the discrete Fourier transform. Proc. IEEE 66 (1), 51–83. doi:10.1109/proc.1978.10837
He, K., Zhang, X., Ren, S., and Sun, J. (2016). “Deep residual learning for image recognition,” in Proceedings of the IEEE conference on computer vision and pattern recognition, Boston, MA, USA, June 12 2015.
Holst, H., Ohlsson, M., Peterson, C., and Edenbrandt, L. (1999). A confident decision support system for interpreting electrocardiograms. Clin. Physiol. 19 (5), 410–418. doi:10.1046/j.1365-2281.1999.00195.x
Hu, R., Chen, J., and Zhou, L. (2022). A transformer-based deep neural network for arrhythmia detection using continuous ECG signals. Comput. Biol. Med. 144, 105325. doi:10.1016/j.compbiomed.2022.105325
Huang, G., Liu, Z., Van Der Maaten, L., and Weinberger, K. Q. (2017). “Densely connected convolutional networks,” in Proceedings of the IEEE conference on computer vision and pattern recognition, Honolulu, HI, USA, July 21 2017 to July 26 2017.
Huang, J., Chen, B., Yao, B., and He, W. (2019). ECG arrhythmia classification using STFT-based spectrogram and convolutional neural network. IEEE access 7, 92871–92880. doi:10.1109/access.2019.2928017
Huang, P.-S., Tseng, Y.-H., Tsai, C.-F., Chen, J.-J., Yang, S.-C., Chiu, F.-C., et al. (2022). An artificial intelligence-enabled ECG algorithm for the prediction and localization of angiography-proven coronary artery disease. Biomedicines 10 (2), 394. doi:10.3390/biomedicines10020394
Iandola, F. N., Han, S., Moskewicz, M. W., Ashraf, K., Dally, W. J., and Keutzer, K. (2016). SqueezeNet: AlexNet-level accuracy with 50x fewer parameters and< 0.5 MB model size. arXiv preprint arXiv:160207360. 2016 Available at: https://arxiv.org/abs/1602.07360.
Krizhevsky, A., Sutskever, I., and Hinton, G. E. (2012). Imagenet classification with deep convolutional neural networks. Adv. neural Inf. Process. Syst. 25.
Lee, H. K., and Choi, Y.-S. (2019). Application of continuous wavelet transform and convolutional neural network in decoding motor imagery brain-computer interface. Entropy 21 (12), 1199. doi:10.3390/e21121199
Li, L., Cai, H., and Jiang, Q. (2020). Adaptive synchrosqueezing transform with a time-varying parameter for non-stationary signal separation. Appl. Comput. Harmon. Analysis 49 (3), 1075–1106. doi:10.1016/j.acha.2019.06.002
Makimoto, H., Höckmann, M., Lin, T., Glöckner, D., Gerguri, S., Clasen, L., et al. (2020). Performance of a convolutional neural network derived from an ECG database in recognizing myocardial infarction. Sci. Rep. 10 (1), 8445. doi:10.1038/s41598-020-65105-x
Moody, G. B., and Mark, R. G. (2001). The impact of the MIT-BIH arrhythmia database. IEEE Eng. Med. Biol. Mag. 20 (3), 45–50. doi:10.1109/51.932724
Niroshana, S. I., Zhu, X., Nakamura, K., and Chen, W. (2021). A fused-image-based approach to detect obstructive sleep apnea using a single-lead ECG and a 2D convolutional neural network. Plos one 16 (4), e0250618. doi:10.1371/journal.pone.0250618
Ozaltin, O., and Yeniay, O. (2023). A novel proposed CNN–SVM architecture for ECG scalograms classification. Soft Comput. 27 (8), 4639–4658. doi:10.1007/s00500-022-07729-x
Peng, Z. K., and Chu, F. (2004). Application of the wavelet transform in machine condition monitoring and fault diagnostics: a review with bibliography. Mech. Syst. signal Process. 18 (2), 199–221. doi:10.1016/s0888-3270(03)00075-x
Poon, K., Okin, P. M., and Kligfield, P. (2005). Diagnostic performance of a computer-based ECG rhythm algorithm. J. Electrocardiol. 38 (3), 235–238. doi:10.1016/j.jelectrocard.2005.01.008
Rahuja, N., and Valluru, S. K. (2021). “A deep neural network approach to automatic multi-class classification of electrocardiogram signals,” in 2021 International Conference on Intelligent Technologies (CONIT), Hubli, India, 25-27 June 2021 (IEEE).
Schlant, R. C., Adolph, R. J., DiMarco, J., Dreifus, L. S., Dunn, M. I., Fisch, C., et al. (1992). Guidelines for electrocardiography. A report of the American College of cardiology/American heart association task force on assessment of diagnostic and therapeutic cardiovascular procedures (committee on electrocardiography). Circulation 85 (3), 1221–1228. doi:10.1161/01.cir.85.3.1221
Schläpfer, J., and Wellens, H. J. (2017). Computer-interpreted electrocardiograms: benefits and limitations. J. Am. Coll. Cardiol. 70 (9), 1183–1192. doi:10.1016/j.jacc.2017.07.723
Shah, A. P., and Rubin, S. A. (2007). Errors in the computerized electrocardiogram interpretation of cardiac rhythm. J. Electrocardiol. 40 (5), 385–390. doi:10.1016/j.jelectrocard.2007.03.008
Silik, A., Noori, M., Altabey, W. A., Ghiasi, R., and Wu, Z. (2021). Comparative analysis of wavelet transform for time-frequency analysis and transient localization in structural health monitoring. Struct. Durab. Health Monit. 15 (1), 1–22. doi:10.32604/sdhm.2021.012751
Wang, T., Lu, C., Sun, Y., Yang, M., Liu, C., and Ou, C. (2021). Automatic ECG classification using continuous wavelet transform and convolutional neural network. Entropy 23 (1), 119. doi:10.3390/e23010119
Yildirim, Ö. (2018). A novel wavelet sequence based on deep bidirectional LSTM network model for ECG signal classification. Comput. Biol. Med. 96, 189–202. doi:10.1016/j.compbiomed.2018.03.016
Yıldırım, Ö., Pławiak, P., Tan, R.-S., and Acharya, U. R. (2018). Arrhythmia detection using deep convolutional neural network with long duration ECG signals. Comput. Biol. Med. 102, 411–420. doi:10.1016/j.compbiomed.2018.09.009
Keywords: electrocardiogram (ECG), time-frequency transformation, continuous wavelet transform (CWT), short-time fourier transform (STFT), convolutional neural network (CNN)
Citation: Song M-S and Lee S-B (2024) Comparative study of time-frequency transformation methods for ECG signal classification. Front. Sig. Proc. 4:1322334. doi: 10.3389/frsip.2024.1322334
Received: 16 October 2023; Accepted: 15 January 2024;
Published: 29 January 2024.
Edited by:
Rakesh Chandra Joshi, Dr. A.P.J. Abdul Kalam Technical University, IndiaReviewed by:
Gozde Cay, Baylor College of Medicine, United StatesIvan Miguel Pires, Universidade da Beira Interior, Portugal
Copyright © 2024 Song and Lee. This is an open-access article distributed under the terms of the Creative Commons Attribution License (CC BY). The use, distribution or reproduction in other forums is permitted, provided the original author(s) and the copyright owner(s) are credited and that the original publication in this journal is cited, in accordance with accepted academic practice. No use, distribution or reproduction is permitted which does not comply with these terms.
*Correspondence: Seung-Bo Lee, a29yZWF0ZWFtMjNAZ21haWwuY29t