 Angela Digulescu1,2*
 Annamaria Sârbu3Denis Stanescu1,3Dragoș Nastasiu1,3
 Cristina Despina-Stoian3Cornel Ioana2,3Ali Mansour4
- 1Telecommunications and Information Technology Department, Military Technical Academy “Ferdinand I”, Bucharest, Romania
- 2ALTRANS, Grenoble, France
- 3GIPSA-Lab, UMR 5216 CNRS, Université Grenoble-Alpes, Grenoble, France
- 4ENSTA Bretagne—2 rue François VERNY—29806 BREST, Brest, France
Signal modulation identification is of high interest for applications in military communications, but is not limited only to this specific field. Some possible applications are related to spectrum surveillance, electronic warfare, quality services, and cognitive radio. Distinguishing between multi-carrier signals, such as orthogonal frequency division multiplexing (OFDM) signals, and single-carrier signals is very important in several applications. Conventional methods face a stalemate in which the classification accuracy process is limited, and, therefore, new descriptors are needed to complement the existing methods. Another drawback is that some features cannot be extracted using conventional feature extraction techniques in practical OFDM systems. This paper introduces a new signal detection algorithm based on the phase diagram characterization. First, the proposed algorithm is described and implemented for simulated signals in MATLAB. Second, the algorithm performance is verified in an experimental scenario by using long-term evolution OFDM signals over a software-defined radio (SDR) frequency testbed. Our findings suggest that the algorithm provides good detection performance in realistic noisy environments.
1 Introduction
The last few years have brought huge development in wireless communication systems. With technology development, multiple-input and multiple-output (MIMO) systems have become more widely used. The advantages of this technology are based on the increased data capacity, which leads to reaching effective multiple parallel spatial data streams to increase the number of users and enhance the transmission quality.
With the development of these systems, the types of modulation used in data transmission have also become an important topic. Therefore, OFDM data transmission represents one of the most important techniques in advanced wireless communications.
The limited availability of spectrum resources places constraints on the development of wireless systems as the demand for wireless services continues to increase. To address this challenge, wireless systems are moving toward incorporating more embedded intelligence. The cognitive radio (CR) concept appears as a key solution to the problem of making different systems coexist in the same frequency band. CR terminals possess the capability to reconfigure themselves, adjusting parameters such as modulation, carrier frequency, and power based on the surrounding radio environment and spectrum policy. Therefore, spectrum sensing and especially system identification is a crucial step toward radio environment awareness (H. Mahmoud et al., 2009). Thus, identification of OFDM signals is highly important for adaptive receiver algorithms and signal identification applications.
As a brief introduction, OFDM is based on the concept of the inverse fast Fourier transform (IFFT), which requires the simultaneous transmission of parallel data streams over mutually orthogonal sub-carriers with overlapping frequency bands (Singh et al., 2022). Each subcarrier may be modulated with a conventional digital modulation scheme (such as binary phase-shift keying (BPSK) and quadrature phase-shift keying (QPSK)), at a lower symbol rate (Lin et al., 2002) than traditional single carrier modulations.
The documented automatic modulation classifier methods for OFDM systems include conventional spectral analysis (Jafar et al., 2021), deep learning-based methods (Huynh-The et al., 2022), and maximum a posteriori-based algorithms (Bahrani et al., 2016). The automatic recognition of this type of modulation is rather complicated with classical signal analysis techniques like spectral analysis, time-frequency analysis, wavelet analysis, or high-order statistics (Hassan et al., 2012).
In Park et al. (2021), the authors propose a deep learning-based automatic modulation classification system to classify higher-order OFDM modulations, 64 OFDM to 512 OFDM, at an SNR value of 20 dB. The results obtained are quite low in a classic deep learning manner, as the authors also showed, obtaining an accuracy below 30%. For this reason, they combine this approach with a CNN model operating on the fast Fourier transformation window bank to extract the useful symbol length in OFDM, which represents the identification of each OFDM-based wireless communication technology, thus managing to increase the accuracy by over 90%. However, the proposed model required a longer input sample length and high SNR value, and the accuracy result depends on the value of the thresholds used for FFT window length.
A maximum a posteriori-based automatic modulation classification for adaptive OFDM systems is presented in Haring et al. (2013), where the authors show that the joint probabilities of the transmit and receive subcarrier bandwidth efficiencies must be precisely known to be able to use this approach. The numerical results show that the approach can be used only at high values of SNR. Above 20 dB, this method provides over 90% results for the identification of OFDM. However, at a value of 10 dB, the accuracy is 0%.
The integration of cyclostationary spectrum sensing detection with an OFDM system is implemented and analyzed in Kumar et al. (2019). This approach, although simple from a computational point of view, manages to highlight features necessary to be able to identify OFDM modulation. In the cases studied by the authors, the results obtained are satisfactory and can identify the modulation at an SNR value of 5 dB with a probability of 90%.
In Gorcin et al. (2015), an OFDM signal identification method that employs estimates of higher-order cumulants and their covariance is proposed. Using this approach, the OFDM modulation can be identified with a probability of 80% at an SNR value of 5 dB. However, the identification performance is affected under low SNR because of the time-domain Gaussianity of the OFDM signals.
As we have seen, identifying the OFDM modulation is not an easy task. There are different ways of approaching the problem, and no unanimously accepted method will provide the desired results. In the case of most approaches, the biggest impediment is the low SNR value. Otherwise, the more complex the approach, the more factors involved in the identification process that must be estimated. This leads to the impossibility of using the blind identification of the modulation, which is preferable in the case of real systems.
Therefore, our proposal is to combine the iterative filter bank decomposition with the phase diagram analysis, a data-driven technique, applied in each frequency sub-band to address the detection of the OFDM modulations. This approach allows us to identify the single carrier in a given sub-band and, for all the signal’s bandwidth, to determine the sub-bands containing each individual orthogonal carrier.
This paper is organized as follows: Section 2 presents the theoretical aspects of the analyzed signal model, phase diagram, and its characteristics used in the modulation recognition process. In Section 3, we analyze the results obtained after the implementation of the detection and characterization algorithm. Finally, in Section 4, we present the conclusions and some future perspectives of our work.
2 Materials and methods
2.1 Theoretical aspects
2.1.1 OFDM signal model
In general, an OFDM signal can be defined as follows:
where
where
2.1.2 Phase diagram
The phase diagram is a way of analyzing nonlinear data based on a new representation domain of an analyzed time series. In this new representation space, different characteristics can be highlighted, bringing new information about the analyzed time series (Marwan et al., 2007). The transition to this new representation space of the time series is performed based on the phase space vectors, according to Eq. 3:
In the construction of the phase space vectors, we can observe the introduction of two new parameters: the time delay
One of the major advantages of this analysis method is that each analyzed signal has a specific representation in the phase diagram. Figure 1 shows the phase diagram representation of a BPSK signal, defined as in Eq. 4:
where
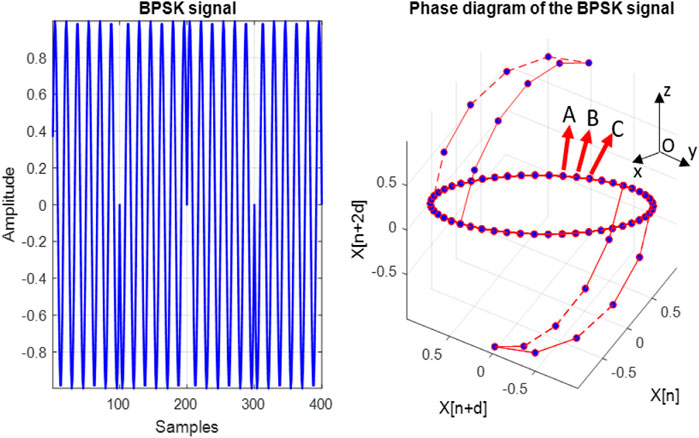
FIGURE 1. BPSK signal (left) and its phase diagram representation (right).
Figure 1 shows that the phase diagram of a BPSK signal consists of one ellipse with two distinct branches. These branches correspond to the moments when the transition from one phase to another happens in the analyzed signal.
2.1.3 The angle of the trajectory in the phase diagram
In this paper, we use the angle extracted from the phase diagram for the OFDM signal detection and its subcarrier characterizations. The extraction of this angle is based on the analysis of the points that build the trajectory of the series analyzed in the phase diagram (Scripcaru et al., 2020).
Inspired by Figure 2, we consider any three points (
where
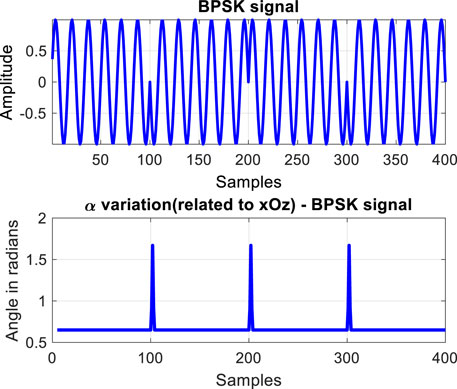
FIGURE 2. BPSK signal (up) and the variation of the α angle (down).
2.2 Phase-space-based OFDM recognition
In this subsection, we present the OFDM detection for two cases: with four and with eight subcarriers. The central idea of our work is the following: the detection process is based on the fact that each BPSK subcarrier of the OFDM signal has a specific characteristic in the field of the phase diagram. In this sense, using orthogonal filters, we decompose the analyzed frequency band, and, with the phase diagram representation, we characterize each signal extracted from its sub-band. Then, the characteristics of the extracted signals are compared with the specific BPSK phase diagram characteristics.
2.2.1 Analog OFDM signal with two BPSK subcarriers
We consider the case of an OFDM signal with a guard interval of 20% of the total length of the signal shown in Figure 3 composed of two orthogonal BPSK subcarriers with the following frequencies:
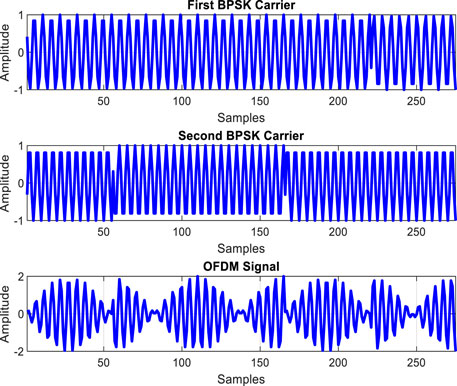
FIGURE 3. OFDM signal and its subcarriers.
Figure 4 shows the spectrum and spectrogram of the OFDM signal from Figure 3. The individual characteristics of the subcarriers are not visible in these representation domains, and we cannot find any information on the type of modulation of the subcarriers.
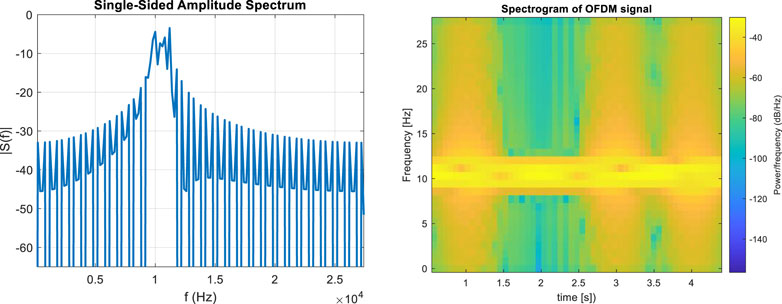
FIGURE 4. Analog OFDM signal spectrum (left) and spectrogram (right).
To decompose the OFDM signal band, we use the set of orthogonal bandpass Chebyshev type II filters, as shown in Figure 5. The pass band of the filter is
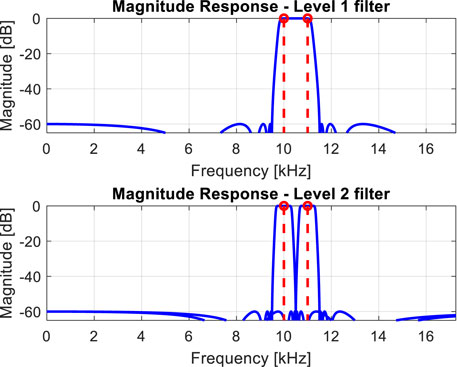
FIGURE 5. Set of filters and the OFDM subcarriers (red).
Three situations can occur in the filtered frequency domain: the presence of a single BPSK subcarrier, the presence of more than one BPSK carrier, or the absence of any subcarrier.
To illustrate these examples, we have used the following filtering bands:
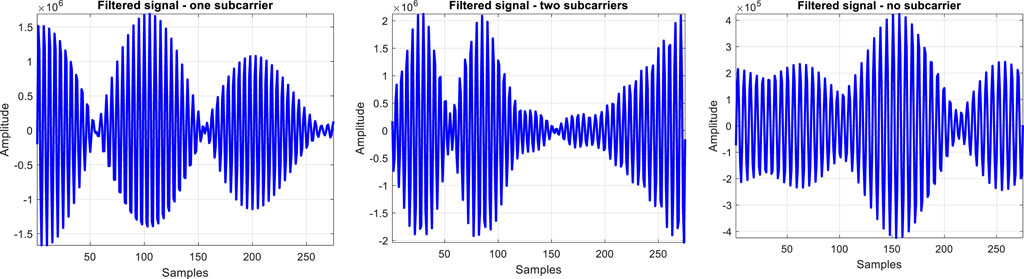
FIGURE 6. Filtered signal: only one subcarrier present (left), two subcarriers present (middle), or no subcarrier present (left).
On the filtered signals, we extract the angle from the phase diagram. Its variation can be observed in Figure 7.
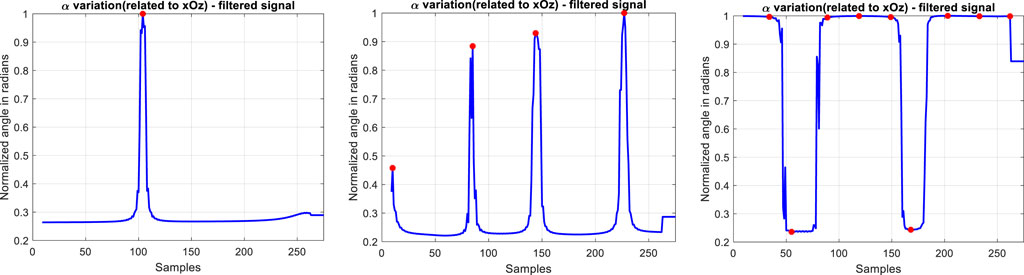
FIGURE 7. Variation of the angle
As it can be seen, depending on the case, the variation of the angle
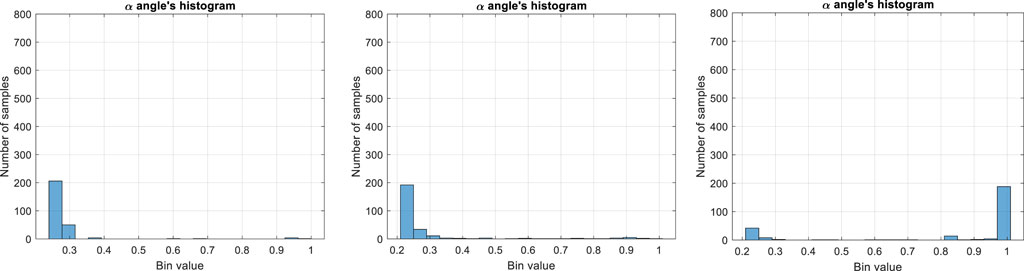
FIGURE 8. α angle’s histograms for the filtered signals: left—single carrier, middle—two subcarriers, and right—no subcarrier.
The definition of the
where
The
Depending on the studied case, we have several possible interpretations of the histogram results. For a single carrier, the values of the samples are concentrated in a main bin or near a certain value. In the case of two subcarriers, the values are distributed in multiple bins, and in the case of no carrier, false peaks are introduced, and their distribution is similar to the previous case. Consequently, the algorithm must be completed with another condition.
It is necessary to check if the number of samples from the two most-populated bins represents more than
If
Therefore, the steps of the presented algorithm for the OFDM signal carrier detection and characterization are proposed in the diagram form shown in Figure 9.
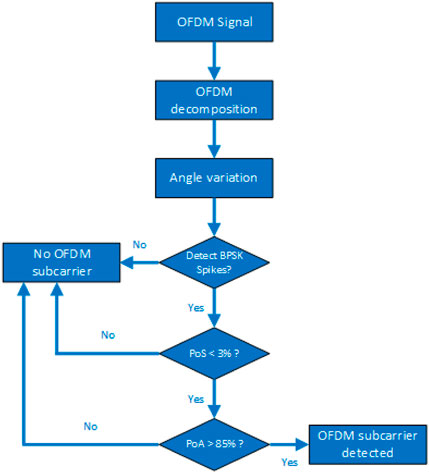
FIGURE 9. Block diagram of the proposed algorithm.
Next, we aim to verify the efficiency of the proposed algorithm in the presence of noise. In addition, we have considered the cases with four BPSK subcarriers and eight BPSK subcarriers. The data are analyzed by reporting at two levels of the signal-to-noise ratio (SNR):
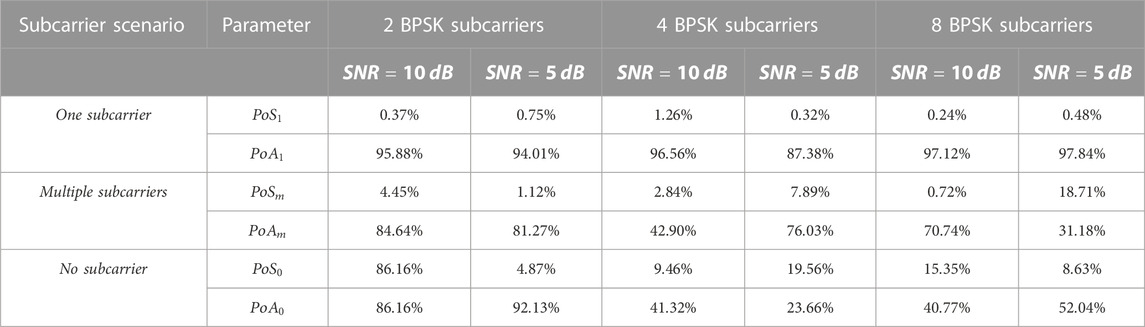
TABLE 1. Results obtained with white Gaussian noise added.
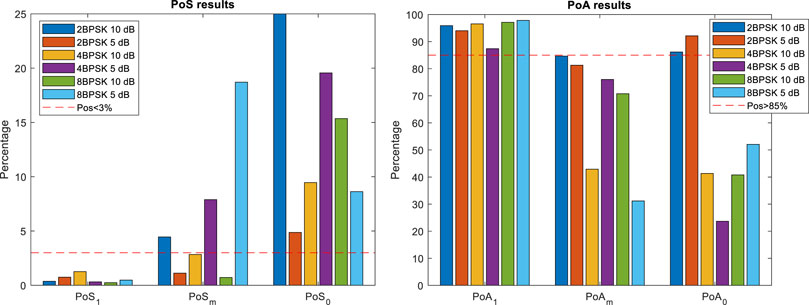
FIGURE 10. PoS and PoA results obtained with white Gaussian noise added.
We notice that the proposed algorithm successfully detects a single subcarrier of the multi-carrier signal for the two SNR values of the additive white Gaussian noise. Thus, the noise presence in the analyzed signal still allows the detection of the OFDM signal.
2.2.2 Digital OFDM signal with 4 BPSK subcarriers
In this case, we start from the characteristics of the IEEE 802.11a standard for WLAN [Wireless Local Access Network—(IEEE Std 802.11a-1999)] having a bandwidth

FIGURE 11. OFDM signal (left) and its corresponding amplitude spectrum (right).
Hereinafter, we present the evolution of the algorithm in the three possible situations discussed previously (one carrier in the filtered signal, more than one carrier in the filtered signal, or no carrier in the filtered signal). Figure 12 highlights the corresponding filtered signal for a single carrier present case.
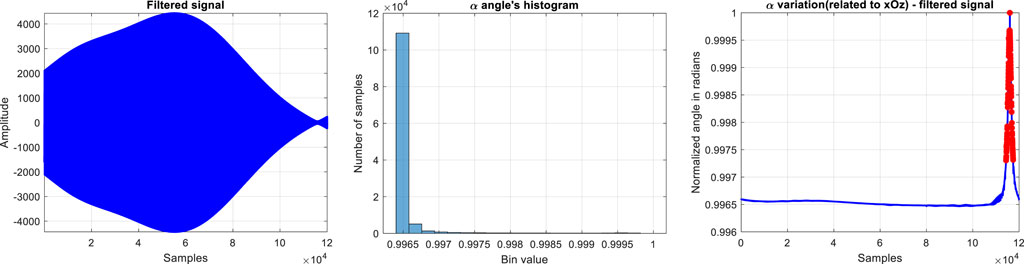
FIGURE 12. Filtered signal with a single subcarrier present (left), the variation of the angle
The corresponding angle variation and histogram of this signal with a single subcarrier are displayed in Figure 12. The results obtained for the two parameters required for detection are:
The results obtained for the case in which we have two subcarriers present are shown in Figure 13. The results obtained for the two parameters required for detection are:
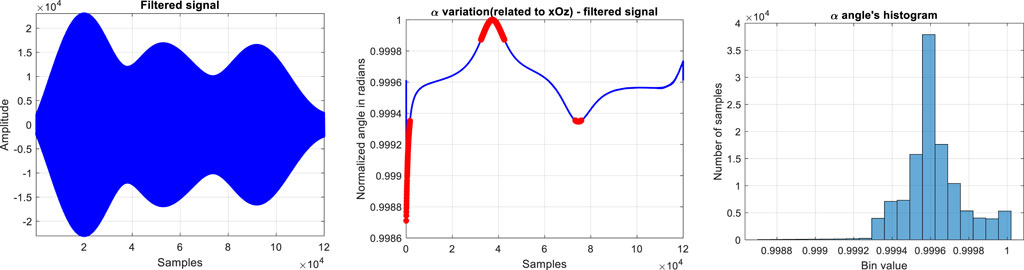
FIGURE 13. Filtered signal with two subcarriers present (left), the variation of the angle
The results obtained for the case in which no subcarrier is present are shown in Figure 14. The results obtained for the two parameters required for detection are:
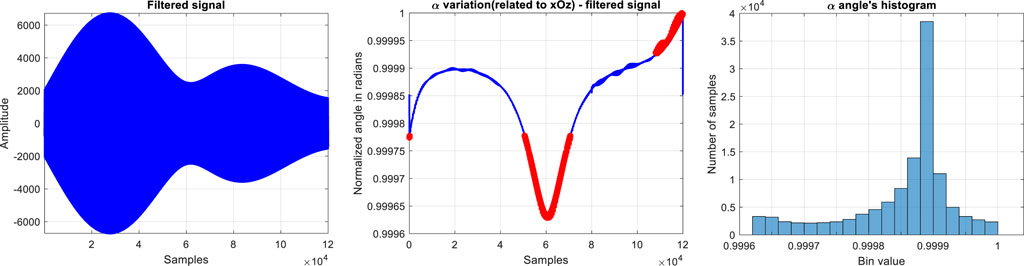
FIGURE 14. Filtered signal with no subcarrier present (left), the variation of the angle
Based on these results, we can observe that, in the case of a single carrier present, the proposed algorithm provides the results in the imposed limits; see Figure 9. Furthermore, in the cases in which we do not have any subcarrier present or multiple carriers are present, the proposed algorithm corresponds to the chosen restrictions.
3 Results for experimental LTE OFDM signals
In this section, we have performed an experimental setup using two B210 SDR boards connected with a VERT2450 antenna, as shown in Figure 15. The distance between the two boards is 0.8 m, and they are placed in an indoor location.
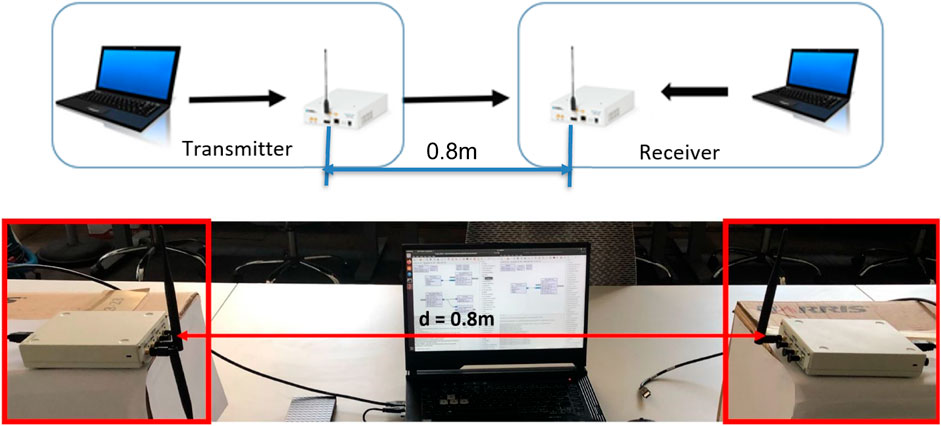
FIGURE 15. Experimental setup and illustration of the OFDM signal recording.
The transmitted signal is generated based on the downlink LTE-OFDM standard (Rumney, 2013) according to the “R.4” reference channel defined according to Annex A.3 of 3GPP TS 36.101 as presented in Table 2. Figure 16 presents the transmitted and received signals.
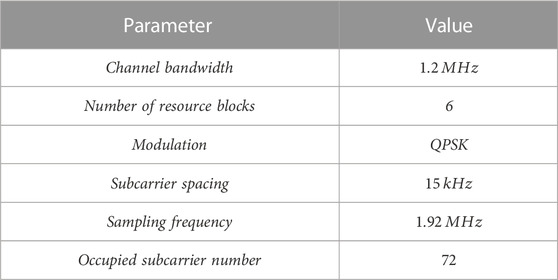
TABLE 2. Parameters of the downlink LTE-OFDM signal.
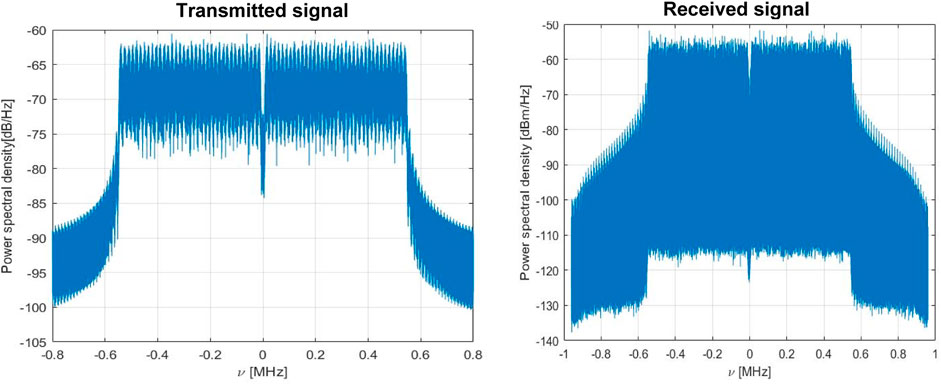
FIGURE 16. Transmitted (left) and received (right) downlink LTE-OFDM signals.
Next, we have applied the same algorithm for the previously considered cases:
• No subcarrier is present: filter bandwidth is
• One subcarrier is present: filter bandwidth is
• Multiple subcarriers are present:
○ For two subcarriers, the filter bandwidth is
○ For three subcarriers, the filter bandwidth is
○ For four subcarriers, the filter bandwidth is
○ For five subcarriers, the filter bandwidth is
○ For six subcarriers, the filter bandwidth is
We have performed the measurements for five different scenarios depending on the gain of the receiver:
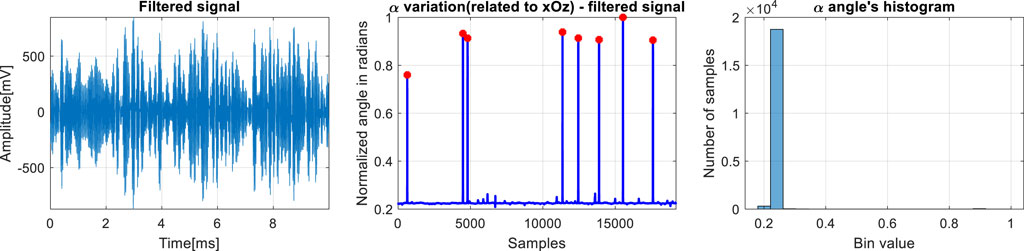
FIGURE 17. Downlink LTE-OFDM filtered signal with one subcarrier (left), the phase diagram angle variation (middle), and its corresponding histogram (right).
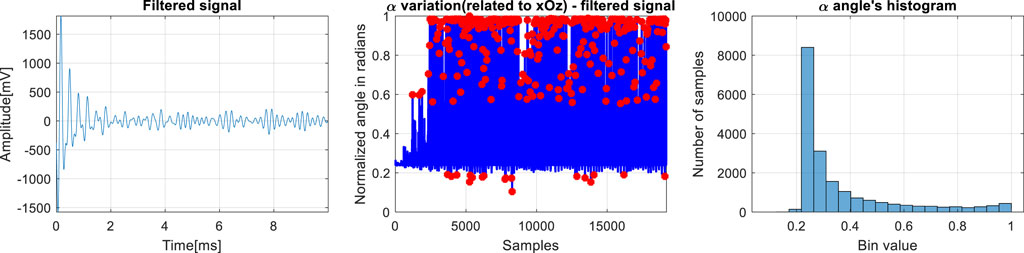
FIGURE 18. Downlink LTE-OFDM filtered signal with no subcarrier (left), the phase diagram angle variation (middle), and its corresponding histogram (right).
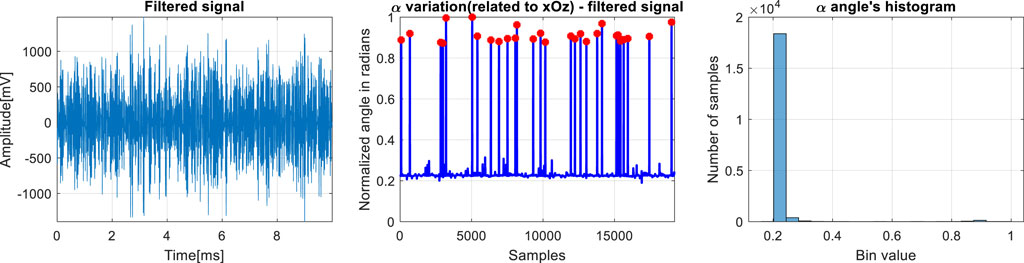
FIGURE 19. Downlink LTE-OFDM filtered signal with two subcarriers (left), the phase diagram angle variation (middle), and its corresponding histogram (right).
The recorded downlink LTE-OFDM signals are analyzed by reporting for all the noise scenarios and filtering cases. The obtained results are shown in Table 3 and Figure 20.
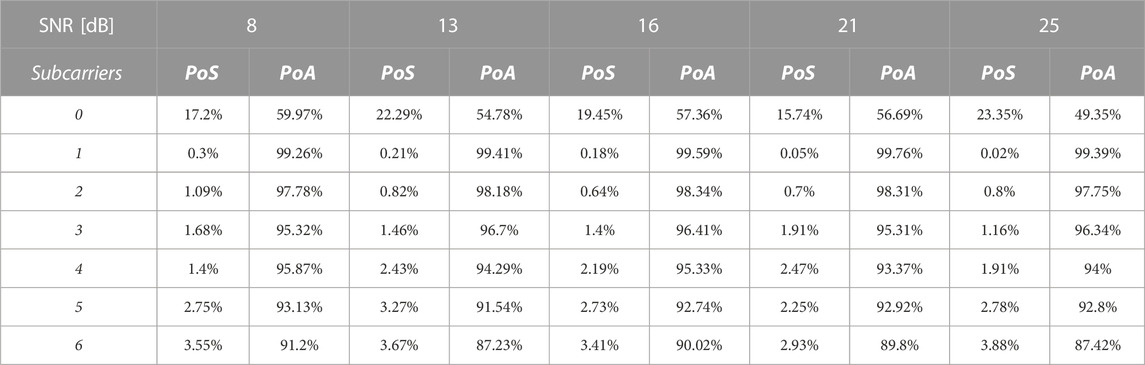
TABLE 3. Results obtained for the experimental setup.

FIGURE 20. PoS and PoA results obtained for the experimental setup.
From the aforementioned results, we can see that the restrictions for the PoS and PoA previously imposed are available for the cases of no subcarrier present or one subcarrier present, but for the case of multiple subcarriers present, the threshold should be higher than 0.5% for PoS and 99% for PoA.
4 Conclusion
This paper proposes a novel approach for the detection of the OFDM modulation. First, using a set of orthogonal bandpass filters, we perform the decomposition of an OFDM signal so that each sub-band is analyzed separately. Then, a phase diagram representation analysis is performed, and the angle of the phase diagram representation variation is obtained. The statistical distribution of the angle variation is further used to recognize an OFDM signal and characterize its subcarriers.
Based on the defined statistical interpretation of the angle variation, we implemented a subcarrier detection algorithm for BPSK-modulated subcarriers. This algorithm was successively applied to Gaussian noise-corrupted signals, 802.11a OFDM signals, and in an experimental scenario using a software-defined radio testbed to LTE signals. Our findings suggest that the algorithm provides good results even in cases involving a low SNR level.
With this paper, we propose to present a new approach for OFDM detection. In future work, we will improve these results by classifying different types of OFDM modulation (QPSK and quadrature amplitude modulation (QAM)) in real scenarios using machine learning algorithms that make use of the present features.
Hereby, the work presented in this paper will represent a starting point for the further step of automatic digital modulation classification. With our proposed algorithm, the separation of each subcarrier in the OFDM transmission will be performed. Then, using several machine learning algorithms, such as in Aslam et al. (2010), we will discriminate between each type of modulation on each subcarrier.
Furthermore, another next step is to use this approach for the THz domain in order to enhance the identification of illicit substances based on the different responses received on each acquired subcarrier.
Data availability statement
The original contributions presented in the study are included in the article/Supplementary Materials; further inquiries can be directed to the corresponding author.
Author contributions
AD: conceptualization, data curation, formal analysis, methodology, and writing—original draft. CD, DN and DS: conceptualization and validation. AD, CI, and AS: methodology and validation. CI and AM: funding acquisition. AD and CI: conceptualization and supervision. All authors contributed to the article and approved the submitted version.
Funding
The project has been supported in part by the NATO grant, “Implementation of a terahertz system dedicated to identification of illicit substances”.
Acknowledgments
The authors are grateful to AID-DGA (l’Agence de l’Innovation de Défense à la Direction Générale de l’Armement—Minitère des Armées) and ANR (Agence Nationale de le Recherche en France) for supporting our ANR-ASTRID—Project (ANR-19-ASTR-0005-03).
Conflict of interest
Authors AD and CI were employed by the company ALTRANS.
The remaining authors declare that the research was conducted in the absence of any commercial or financial relationships that could be construed as a potential conflict of interest.
Publisher’s note
All claims expressed in this article are solely those of the authors and do not necessarily represent those of their affiliated organizations, or those of the publisher, the editors, and the reviewers. Any product that may be evaluated in this article, or claim that may be made by its manufacturer, is not guaranteed or endorsed by the publisher.
References
3 GPP TS 36.101, 20133 GPP TS 36.101 (2013). 3rd generation partnership project; technical specification group radio access Network; evolved universal terrestrial radio access (E-UTRA); user equipment (UE) radio transmission and reception (release 11). 3GPP Organ. Partners (ARIB, ATIS, CCSA, ETSI, TTA, TTC).
Aslam, M. W., Zhu, Z., and Nandi, A. K. (2010). “Automatic digital modulation classification using Genetic Programming with K-Nearest Neighbor,” in 2010 - MILCOM 2010 MILITARY COMMUNICATIONS CONFERENCE, San Jose, CA, USA, November 2010, 1731–1736.
Bahrani, S., Derakhtian, M., and Zolghadrasli, A. (2016). Performance analysis of a low-complexity MAP algorithm for automatic modulation classification in adaptive OFDM systems. IET Commun. 10, 2363–2371. doi:10.1049/iet-com.2015.0768
Digulescu, A., Murgan, I., Ioana, C., Candel, I., and Serbanescu, A. (2016). “Applications of Transient Signal Analysis using the concept of recurrence plot analysis,” in Recurrence Plots and their quantifications: Expanding horizons sl. Editors C. J. L. Webber, C. Ioana, and N. Marwan (Berlin: Springer), 19–38.
Gorcin, A., and Arslan, H. (2015). An OFDM signal identification method for wireless communications systems. IEEE Trans. Veh. Technol. 64 (12), 5688–5700. doi:10.1109/TVT.2015.2388671
Haring, L., and Kisters, C. “Map-based automatic modulation classification for wireless adaptive OFDM systems,” in 2013 IEEE International Conference on Acoustics, Speech and Signal Processing, Vancouver, BC, Canada, May 2013 (IEEE), 5204–5208.
Hassan, K., Dayoub, I., Hamouda, W., Nzeza, C. N., and Berbineau, M. (2012). Blind digital modulation identification for spatially-correlated MIMO systems. IEEE Trans. Wirel. Commun. 11 (2), 683–693. doi:10.1109/twc.2011.122211.110236
Huynh-The, T., Pham, Q.-V., Nguyen, T.-V., Da Costa, D. B., and Kim, D.-S. (2022). “Automatic modulation classification with low-cost attention Network for impaired OFDM signals,” in 2022 IEEE Wireless Communications and Networking Conference (WCNC), Austin, Texas, 10-13 April 2022.
IEEE Standard for Telecommunications and Information Exchange Between Systems (1999). IEEE standard for telecommunications and information exchange between systems - LAN/MAN specific requirements - Part 11: wireless medium access control (MAC) and physical layer (PHY) specifications: high speed physical layer in the 5 GHz band. IEEE Std 802.11a-1999, 1–102. doi:10.1109/IEEESTD.1999.90606
Jafar, N., Paeiz, A., and Farzaneh, A. (2021). Automatic modulation classification using modulation fingerprint extraction. J. Syst. Eng. Electron. 32, 799–810. doi:10.23919/jsee.2021.000069
Kumar, A., and Nandha kumar, P. (2019). OFDM system with cyclostationary feature detection spectrum sensing. ICT Express 5 (1), 21–25. doi:10.1016/j.icte.2018.01.007
Lin, Y., Wang, H., and Chen, B. (2002). “Blind identification of OFDM channel using receiver diversity,” in 6th International Conference on Signal Processing, Beijing, China, 26-30 August 2002, 1332–1335.
Mahmoud, H., Yucek, T., and Arslan, H. (2009). OFDM for cognitive radio: merits and challenges. IEEE Wirel. Commun. 16 (2), 6–15. doi:10.1109/MWC.2009.4907554
Marwan, N., Carmen Romano, M., Thiel, M., and Kurths, J. (2007). Recurrence plots for the analysis of complex systems. Phys. Rep. 438 (5-6), 237–329. doi:10.1016/j.physrep.2006.11.001
Park, M. C., and Han, D. S. (2021). Deep learning-based automatic modulation classification with blind OFDM parameter estimation. IEEE Access 9, 108305–108317. doi:10.1109/ACCESS.2021.3102223
Rumney (2013). LTE and the evolution to 4G wireless - design and measurement challenges. 2. New Jersey, United States: Wiley.
Scripcaru, R., Nastasiu, D., Digulescu, A., Stanescu, D., Ioana, C., and Serbanescu, A. (2021). “On the potential of phase diagram analysis to identify OFDM modulation,” in Brest, Workshop on Security & Protection of Information (SPI21), Brest, France, 24-25 May 2023.
Scripcaru, R., Nastasiu, D., Digulescu, A., Stănescu, D., Ioana, C., and Şerbănescu, A. (2020). “On the potential of phase diagram analysis to identify the wide band modulations,” in 13th International Conference on Communications (COMM), Bucharest, Romania, June 24-27, 2013, 55–58. doi:10.1109/COMM48946.2020.9141963
Keywords: orthogonal frequency division multiplexing, phase diagram, signal recognition, cognitive radio, electronic warfare
Citation: Digulescu A, Sârbu A, Stanescu D, Nastasiu D, Despina-Stoian C, Ioana C and Mansour A (2023) Detection of OFDM modulations based on the characterization in the phase diagram domain. Front. Sig. Proc. 3:1197590. doi: 10.3389/frsip.2023.1197590
Received: 31 March 2023; Accepted: 17 July 2023;
Published: 21 August 2023.
Edited by:
M. L. Dennis Wong, Heriot-Watt University Malaysia, MalaysiaReviewed by:
Mehdi Korki, Swinburne University of Technology, AustraliaMilica Pejanovic-Djurisic, University of Montenegro, Montenegro
Copyright © 2023 Digulescu, Sârbu, Stanescu, Nastasiu, Despina-Stoian, Ioana and Mansour. This is an open-access article distributed under the terms of the Creative Commons Attribution License (CC BY). The use, distribution or reproduction in other forums is permitted, provided the original author(s) and the copyright owner(s) are credited and that the original publication in this journal is cited, in accordance with accepted academic practice. No use, distribution or reproduction is permitted which does not comply with these terms.
*Correspondence: Angela Digulescu, YW5nZWxhLmRpZ3VsZXNjdUBtdGEucm8=